variation in resource utilization and cost of reproduction
TRANSCRIPT

Brigham Young University Brigham Young University
BYU ScholarsArchive BYU ScholarsArchive
Theses and Dissertations
2014-12-01
Variation in Resource Utilization and Cost of Reproduction for Variation in Resource Utilization and Cost of Reproduction for
Two Burying Beetle Species Two Burying Beetle Species
Peter J. Meyers Brigham Young University - Provo
Follow this and additional works at: https://scholarsarchive.byu.edu/etd
Part of the Biology Commons
BYU ScholarsArchive Citation BYU ScholarsArchive Citation Meyers, Peter J., "Variation in Resource Utilization and Cost of Reproduction for Two Burying Beetle Species" (2014). Theses and Dissertations. 5761. https://scholarsarchive.byu.edu/etd/5761
This Thesis is brought to you for free and open access by BYU ScholarsArchive. It has been accepted for inclusion in Theses and Dissertations by an authorized administrator of BYU ScholarsArchive. For more information, please contact [email protected], [email protected].
Variation in Resource Utilization and Cost of
Reproduction for Two Burying
Beetle Species
Peter J. Meyers
A thesis submitted to the faculty of Brigham Young University
in partial fulfillment of the requirements for the degree of
Master of Science
Mark C. Belk, Chair J. Curtis Creighton Jerald B. Johnson G. Bruce Schaalje
Department of Biology
Brigham Young University
December 2014
Copyright © 2014 Peter J. Meyers
All Rights Reserved

ABSTRACT
Variation in Resource Utilization and Cost of Reproduction for Two Burying
Beetle Species
Peter J. Meyers Department of Biology, BYU
Master of Science
The cost of reproduction hypothesis suggests that allocation into current reproduction constrains future reproduction. How organisms accrue reproductive costs may differ between species and with varying levels of resource quality. Burying beetles are model organisms for testing for the cost of reproduction because of their unique natural history; beetles utilize small vertebrate carcasses for reproduction and they and their offspring feed exclusively on these discrete resources. Burying beetles also can utilize a large range of carcass sizes for reproduction. We tested for the cost of reproduction in two species of burying beetles, Nicrophorus marginatus and Nicrophorus guttula found in Central Utah by breeding beetles on a range of carcass sizes (5g, 10g, 20g, 30g, 40g, and 50g carcasses). We also used a manipulation experiment to force beetles into over-allocating energy into reproduction to assess reproductive costs. For both species, reproduction was costly, with beetles suffering reduced lifespan and reduced lifetime fecundity with increased resource quality. Both species also showed clear signs of senescence, having reduced brood size and lower efficiency as individuals aged. Females did not show indications of terminal investment in terms of female mass change, unlike the previously studied Nicrophorus orbicollis, which gained less mass after each reproductive attempt as it aged. Nicrophorus marginatus consistently outperformed N. guttula in terms of total number of offspring produced for all carcass sizes. Nicrophorus guttula populations may continue to persist with N. marginatus by exploiting a less desirable but more abundant resource. Keywords: burying beetles, cost of reproduction, terminal investment, resource allocation

ACKNOWLEDGEMENTS
I would like to thank my committee, Mark Belk, Curtis Creighton, Bruce Schaalje, and
Jerry Johnson, for help developing this research project and comments on how to structure and
shape my thesis. I would also like to thank Eric Billman for helping design and execute this
experiment, as well as Clint Laidlaw for crucial insights into carrying out the laboratory work.
Additionally, thanks to a myriad of undergraduate researchers for help executing my laboratory
work, especially Mason Segura. I would also like to thank my wife, Carly, for her unending
encouragement and support.
TABLE OF CONTENTS
TITLE PAGE ................................................................................................................................... i
ABSTRACT .................................................................................................................................... ii
ACKNOWLEDGEMENTS ........................................................................................................... iii
TABLE OF CONTENTS ............................................................................................................... iv
LIST OF TABLES .......................................................................................................................... v
LIST OF FIGURES ....................................................................................................................... vi
INTRODUCTION .......................................................................................................................... 1
METHODS ..................................................................................................................................... 3
Burying Beetle Natural History................................................................................................... 3
Experimental Design ................................................................................................................... 4
Statistical Analyses ..................................................................................................................... 6
Analysis of Lifetime Patterns of Allocation ............................................................................ 6
Analysis of Within-lifetime Patterns of Allocation ................................................................. 8
RESULTS ..................................................................................................................................... 10
Lifetime Fitness Measures ........................................................................................................ 10
Within Lifetime Fitness Measures ............................................................................................ 12
DISCUSSION ............................................................................................................................... 15
LITERATURE CITED ................................................................................................................. 22
TABLES ....................................................................................................................................... 26
FIGURES ...................................................................................................................................... 30
iv

LIST OF TABLES
Table 1. Results of ANCOVA for lifespan, lifetime total number of offspring, and lifetime total offspring mass. Significant effects are bolded. ............................................................................ 26 Table 2. Results of ANCOVA for number of successful bouts, total number of bouts, and unsuccessful bouts. Significant effects are bolded. ..................................................................... 27 Table 3. Results of repeated measures ANCOVA analyzing mean offspring size, initial brood size, and final brood size. Significant effects are bolded. ............................................................ 28 Table 4. Results of repeated measures ANCOVA analyzing carcass use efficiency, percent female mass change, and proportion brood culled. Significant effects are bolded. ..................... 29
v

LIST OF FIGURES
Figure 1. Mean (±SE) lifespan of N. marginatus (closed circles) and N. guttula (open circles) for non-reproducing (NR) females, reproducing females (on 5g, 10g, 20g, 30g, 40g, or 50g carcasses), and over-allocation (E) females. ................................................................................. 30 Figure 2. Mean (±SE) lifetime number of offspring and total offspring mass of N. marginatus (closed circles) and N. guttula (open circles) for females on 5g, 10g 20g, 30g, 40g, or 50g carcasses, and for females on the over-allocation (E) treatment. ................................................. 31 Figure 3. Mean (±SE) number of successful bouts, total reproductive bouts, and unsuccessful bouts of N. marginatus (closed circles) and N. guttula (open circles) for females on 5g, 10g 20g, 30g, 40g, or 50g carcasses, and for females on the over-allocation (E) treatment. ...................... 32 Figure 4. Mean (±SE) offspring mass for N. marginatus (left) and N. guttula (right) females within a female’s lifetime. Darkest to lightest circles: 5g, 10g, 20g, 30g, 40g, 50g, over-allocation. ...................................................................................................................................... 33 Figure 5. Mean (±SE) initial brood and final brood for N. marginatus (left) and N. guttula (right) females within a female’s lifetime. Darkest to lightest circles: 5g, 10g, 20g, 30g, 40g, 50g, over-allocation. ...................................................................................................................................... 34 Figure 6. Mean (±SE) carcass use efficiency for N. marginatus (left) and N. guttula (right) females within a female’s lifetime. Darkest to lightest circles: 5g, 10g, 20g, 30g, 40g, 50g, over-allocation. ...................................................................................................................................... 35 Figure 7. Mean (±SE) percent female mass change during reproductive attempts for both N. marginatus and N. guttula females on 5g, 10g, 20g, 30g, 40g, and 50g carcasses. ..................... 36 Figure 8. Mean (±SE) proportion brood culled during each reproductive bout for N. marginatus (left) and N. guttula (right) females within a female’s lifetime. Darkest to lightest circles: 5g, 10g, 20g, 30g, 40g, 50g, over-allocation. ..................................................................................... 37
vi

INTRODUCTION
The cost of reproduction hypothesis suggests that for iteroparous organisms, current
reproductive effort constrains future reproductive output (Williams 1966). As an organism
allocates resources towards current reproduction, that energy is unavailable for use in somatic
maintenance and growth, which can create costs through a reduction in lifespan (survivorship
cost) or through reduced fecundity (fecundity cost). Because of this tradeoff, organisms are
expected to balance current and future reproduction to maximize total lifetime reproductive
output (Carlisle 1982, Heimpel and Rosenheim 1995, Rosenheim 1999).
Resource variation may affect how an organism accrues reproductive costs over a
lifetime. Large amounts of resources may ameliorate reproductive costs by allowing for a large
allocation of energy into both offspring and individual somatic maintenance (Van Noordwijk and
Dejong 1986). Conversely, large resources may require additional effort to acquire and process,
as well as protect from other competitors (Trumbo 1992) and as such, added benefits from
increased energy intake may diminish. It is thus unclear how resource variation affects the
accrual of reproductive costs, and costs may depend on species-specific adaptation to local
resource availability.
Can adaptation to specific resource qualities influence the way individuals accrue
reproductive costs? An organism adapted to use large resources for reproduction may have
decreased lifetime fecundity when only given small resources, though such reduced reproductive
effort may extend the organism’s lifespan. Likewise, an organism adapted for use of small
resources may have both reduced lifespan and reduced fecundity when exploiting large
resources. Thus, one way to test how reproductive costs are accrued is to compare reproductive
output between two species adapted to differing resource qualities (Le Lann et al. 2012).
1

Burying beetles (genus Nicrophorus) are ideal model organisms for life history studies
because of their use of discrete, quantifiable resources in reproduction, and their ease of
manipulation in the laboratory. Burying beetles feed and reproduce exclusively on small
vertebrate carcasses where they provision offspring through post-hatching parental care
(Pukowski 1933). Burying beetles can use a range of carcass sizes from only a few grams to
several hundred grams, though reproductive success on different sized carcasses varies
depending on species (Muller et al. 1990b, Trumbo 1992, Trumbo and Fiore 1994, Smith and
Heese 1995). Typically, larger species are more successful on larger carcasses, while smaller
species are more successful on smaller carcasses (Trumbo 1992). Because of their ability to
breed on varying carcass sizes and the variation in body size among species, burying beetles are
well-suited for studies about effects of resource quality on lifetime fitness and accrual of
reproductive costs.
In addition, the cost of reproduction hypothesis can be tested with burying beetles by
forcing parents to overinvest in current reproduction. Parents use carcass volume to assess the
size of the carcass (Trumbo and Fernandez 1995), then reduce the clutch through filial
cannibalism to match clutch size with resource size (Bartlett 1987). After assessment of carcass
size has occurred, we can replace the carcass with a smaller, prepared carcass (Creighton 2009).
The result is a brood that is too large for the smaller carcass. This creates a condition of
overinvestment in current reproduction, and allows assessment of costs of overinvestment on
future reproduction and subsequent lifetime fitness. Creighton et al (2009) utilized this
technique to test for the cost of reproduction hypothesis in Nicrophorus orbicollis and showed
that overinvestment in current reproduction constrained future reproductive output. Females
2
manipulated to overinvest suffered greater fecundity costs and survivorship costs compared to
unmanipulated females.
We tested how adaptation to specific resource qualities affects the accrual of reproductive
costs in two species of burying beetles, Nicrophorus marginatus and Nicrophorus guttula. We
chose these two species because they are phylogenetically similar (Nicrophorus marginatus is
the outgroup to the sister species Nicrophorus guttula and Nicrophorus obscurus), they overlap
in their distribution, they co-occur in the same habitats, but they differ in body size (Peck and
Kaulbars 1987, Ratcliffe 1996, Sikes and Venables 2013). Because of the difference in body
size between the two species, we expect that the larger species, Nicrophorus marginatus will be
better suited to utilizing larger carcasses than the smaller Nicrophorus guttula (Muller et al.
1990b, Trumbo 1992). Because of their close relatedness, we expect that most differences we
see in lifetime allocation patterns will be due to differences in their body size and, in turn, their
species-specific adaptations to utilizing different-sized resources. In addition, we tested the
generality of the cost of reproduction hypothesis among burying beetle species by forcing over
allocation to current reproduction in a manipulation experiment similar to that performed by
Creighton et al (2009). We can thus assess the cost of over-allocation, and compare the effects
among multiple species of burying beetles.
METHODS
Burying Beetle Natural History
Burying beetles locate small vertebrate carcasses and use them as food resources for
themselves and their offspring. Male-female pairs will compete with other pairs, with the largest
competitors usually dominating the carcass (Bartlett and Ashworth 1988, Muller et al. 1990a).
3

The winning pair of beetles bury the carcass under the soil, remove the feathers or hair, shape the
carcass into a ball, and coat it with oral and anal secretions that help prevent desiccation of the
carcass and bacterial and fungal growth. During carcass preparation, the pair will mate and the
female will lay eggs in the soil, with larvae usually hatching on or after the fourth day. Parents
will then feed newly hatched larvae through regurgitation and will provide defense of the carcass
and larvae from predators. Parental care continues (via feeding and defense) until larvae
disperse into the soil to pupate (Scott 1998).
Experimental Design
We collected live individual burying beetles from two species, Nicrophorus marginatus
and Nicrophorus guttula, at Goshen Ponds (39° 57.476’N, 111° 51.426’W) and Utah Lake
Wetland Preserve (40° 6.933'N, 111° 47.589'W) in Central Utah during June 2011 and July 2012
using pitfall traps baited with aged chicken. We transported beetles back to Brigham Young
University and established laboratory populations for each species by placing wild-caught pairs
on a 30g carcass and allowing them to breed. After first generation beetles eclosed, they were
kept in small plastic containers (11.3 cm x 7.6 cm x 5.7 cm), fed ad lib. raw chicken liver, and
maintained on a 14L:10D cycle. Beetles used in this experiment were F1, F2, and F3 individuals
and all crosses used different family lines to ensure no inbreeding occurred.
At 28 days from eclosion, we randomly assigned females from both species to one of
eight treatments (12 replicates for each treatment). In six of those treatments, females were
allowed to reproduce throughout their lifetime on one of six carcass sizes (5g, 10g, 20g, 30g,
40g, or 50g, ±1.0g). These six treatments tested for species-specific allocation patterns across a
range of resource qualities. For each reproductive bout, females were placed with a virgin male
on a carcass of their assigned size in a plastic container (20.3 cm x 15.2 cm x 9.8 cm) filled with
4
approximately 4.5 cm of commercially purchased topsoil and allowed to reproduce. After 48
hours, males were removed from the carcass so we could investigate only the reproductive
investment patterns of females (males only helped in carcass preparation and fertilization of eggs
in these experiments). After each reproductive attempt (determined when all larvae had
dispersed from the carcass into the soil), females were removed, placed in small containers, and
given ad lib. chicken liver. After 48 hours, females were placed on a new carcass (of the same
size as their previous reproductive attempt) with a new virgin male and allowed to produce
offspring. This cycle was repeated until the female died.
In addition to testing for species-specific allocation patterns, we examined the effect of
over-allocation (designated treatment seven). In this treatment, we placed females with virgin
males on a larger, high quality carcass, then switched it with a smaller, low quality carcass after
preparation had occurred and larvae had arrived on the carcass. Beetles assess carcass size
during burial and preparation of the carcass, and replacing a carcass after larvae have arrived
does not change the female’s previous allocation decisions (Bartlett and Ashworth 1988,
Creighton 2009). For N. marginatus, we used 30g carcasses for the high quality resource and
switched it with 20g carcass. For N. guttula, we used 20g carcasses for the high quality resource
and switched it with 10g carcasses. Our selection of high and low resources was based on our
analysis of lifetime number of offspring produced on the first six treatments. We chose two
carcass sizes that over the course of a female’s lifetime should produce the same number of
offspring but would require different numbers of reproductive attempts to achieve this
production. Because of differential carcass use by the two species, these two carcass sizes were
different for each species. Our interpretation will thus compare the over-allocation treatment
with the two carcass size treatments selected from the previous experiment on species-specific
5

responses to a range of carcass sizes (i.e., the response variables in the over-allocation treatment
for N. marginatus will be compared to the response variables from the 30g and 20g treatments
and the response variables in the over-allocation treatment for N. guttula will be compared to the
response variables from the 20g and 10g treatments). To assess effects of reproduction on
lifespan, our eighth treatment was a “non-reproducing” treatment where females were not
allowed to breed throughout their life.
For each treatment, females were weighed and their pronotum measured at 28 days of age
and each female’s lifespan was recorded. For the seven reproducing treatments, females were
weighed before and after each reproductive attempt. Each female and her brood were monitored
daily to determine brood size and timing of larval dispersal. If after 7 days no offspring had
appeared on the carcass, the brood was designated a failure, and the female was removed, given
food, and isolated for 48 hours, then allowed to breed again on a fresh carcass with a new virgin
male. We recorded the initial number of offspring and the final number and weight of offspring
as they dispersed into the soil for each reproductive attempt.
Statistical Analyses
Analysis of Lifetime Patterns of Allocation
We used linear models to examine the effects of treatment and species on lifespan,
lifetime number of offspring, and lifetime offspring mass using GLM in SAS (SAS 9.3 SAS
Institute, Cary, North Carolina, USA). Lifespan was used to determine differences in
survivorship costs while lifetime number of offspring and lifetime offspring mass were used to
determine differences in fecundity costs between the two species and across resource qualities.
We also used a generalized linear model to examine the effects of treatment and species on
number of successful reproductive attempts, total reproductive attempts, and number of
6

unsuccessful reproductive attempts (total reproductive attempts minus successful reproductive
attemtps) using GenMod in SAS (SAS 9.3 SAS Institute, Cary, North Carolina, USA). These
response variables indicated fecundity costs. Our non-reproducing treatment was only included
in the model for lifespan. For each model, treatment, and species were our main effects, with an
interaction between treatment and species included in the model and with female body size
(pronotum width standardized within each species) treated as a covariate. Because we used
different carcass sizes for the over-allocation treatment for each species, a comparison between
species for this treatment would not be appropriate as we would expect species level differences.
We thus treated the over-allocation treatment for each species as two separate treatments and
only included them in the treatment main effect; they were not included in the treatment by
species interaction. Female body size varied greatly between the two species, so we standardized
body size by creating a z-score from the means of each species. Response variables for lifespan,
lifetime number of offspring, and lifetime offspring mass were all log-transformed. In our
lifespan model, a single outlier N. guttula female from the 20g treatment never reproduced and
was removed from the analysis. Additionally, we removed a single N. marginatus female from
the 5g treatment from our model on unsuccessful bouts. This female lived longer than every
other female in this treatment, yet had only two successful bouts late in life, the fewest in the
treatment. Because her patterns of reproduction were so uncharacteristic of the other females in
the treatment, we removed her from our analysis. In our generalized linear models for number of
successful bouts, total number of bouts and number of unsuccessful bouts, we assumed a poisson
distribution and used a log-link function.
7
Analysis of Within-lifetime Patterns of Allocation
In addition to lifetime patterns of reproduction, we also investigated within-lifetime
patterns of allocation using generalized linear mixed models (GLMM) with the GLIMMIX
procedure in SAS (SAS 9.3 SAS Institute, Cary, North Carolina, USA). For these models, we
used six life history traits as response variables: mean individual offspring mass, initial brood
size, final brood size, proportion brood culled, carcass use efficiency, and percent female mass
change. Mean individual offspring mass was the mean mass of a single individual for a given
brood and indicates the level of investment into each brood. Initial brood size was the number of
larvae that first appeared on the carcass before culling had occurred. Final brood size was the
number of larvae that dispersed into the soil and represents the brood size after culling has
occurred. Proportion brood culled was the initial brood size minus the final brood size and
indicates the level of investment in the current brood. Carcass use efficiency was determined by
summing the combined mass of the offspring for a single brood and the mass change of the
female before and after raising that brood, then dividing that value by the initial mass of the
carcass. This response variable indicates how efficient a female is at converting carcass into
offspring. Percent female mass change was an indicator of how much mass the female gained or
lost over the course of the breeding attempt and was calculated by subtracting the female’s initial
mass from her final mass, then dividing that number by the female’s initial mass. A value
greater than zero meant a female gained mass during that breeding attempt and indicated an
investment towards future reproduction while a value smaller than zero meant a female lost mass
during the breeding attempt and indicated an investment in current reproduction. We used
percent female mass change instead of the actual change in female mass to avoid confounding
8
the differences in overall body size between the two species (larger beetles are able to consume
larger amounts of carcass tissue).
For each model we used a repeated measures design to analyze these six life history traits
through time. The six traits served as response variables while species, treatment, and
reproductive bout were our predictor variables. We again used standardized female body size as
our covariate and included the species by treatment interaction, the bout by species interaction,
and the bout by treatment interaction, as well as a three-way interaction of all three main effects.
The three-way interaction was not significant for carcass use efficiency and female percent mass
change, so this interaction was dropped from these models. Because our comparison was only
for life-history traits dealing with reproduction, we did not include our non-reproducing
treatment in this analysis. We again treated the over-allocation treatment for the two species as
two separate treatments, so they were only included as main effects but were not included in the
interactions. We used a log-transformed value for mean offspring size and weighted the mean
offspring size by the number of individuals in the brood. Because we have lower confidence in
the mean offspring size for small broods and higher confidence in mean offspring size for large
broods, we needed to weight mean offspring size with the brood size. A single outlier N. guttula
female never reproduced and was removed from the mean offspring model. In addition, two
bouts from a single female were removed from the analysis for mean offspring size because in
each bout, two offspring were produced that were abnormally small (1/5 the size of any other
offspring) and were likely early instar larvae that had left the carcass early. For both initial and
final brood sizes, we assumed a poisson distribution and used a log-link function. For proportion
brood culled, we assumed a binomial distribution with a logit-link function where number
9

offspring culled was our response and initial brood size was the number of trials. We also log-
transformed female percent mass change.
RESULTS
Lifetime Fitness Measures
Lifespan: Lifespan differed significantly between species and across treatments, as well
as by body size, but the interaction between species and treatments was not significant (Table 1).
Nicrophorus marginatus on average lived longer than N. guttula (Figure 1). Across species,
beetles that reproduced on small carcass sizes tended to live longer than those on larger carcasses
and non-reproducing individuals tended to live the longest (Figure 1). The largest individuals
lived about 30 days longer than the smallest individuals.
Total number of offspring: Total number of offspring differed by species, carcass size,
and their interaction, but not by body size (Table 1). Total number of offspring for N.
marginatus increased with carcass size up to 20g and then plateaued on larger carcass sizes while
total number of offspring for N. guttula peaked on 10g and 20g carcasses but was lower on 5g
carcasses and carcasses larger than 20g (Figure 2).
Total offspring mass: Lifetime total offspring mass was significantly different between
species and among treatments, and the species by treatment interaction was significant, though it
did not differ significantly by body size (Table 1). For N. marginatus, total offspring mass
increased with carcass size up to 20g and then plateaued on larger carcass sizes while total
offspring mass for N. guttula was greatest on 10g and 20g carcasses but was lower on 5g
carcasses and carcasses larger than 20g (Figure 2).
10
Number of total reproductive bouts: Total number of reproductive bouts differed by
species and among treatments but the interaction between species and treatment was not
significant (Table 2). Total number of bouts also differed by size. Nicrophorus. marginatus
females tended to have more bouts than N. guttula (Figure 3). For both species, total number of
bouts decreased with increased carcass size (Figure 3).
Number of successful reproductive bouts: The number of successful reproductive bouts
differed by species and among treatments, but not by body size. The interaction between species
and treatment was not significant (Table 2). Nicrophorus marginatus typically had more
successful bouts than N. guttula and for both species, the number of successful reproductive
bouts decreased with increased carcass sizes (Figure 3)
Number of unsuccessful reproductive bouts: Number of unsuccessful bouts was not
significantly different between species but was significantly different among treatments, as well
as the treatment by species interaction, and by body size (Table 2). Both N. marginatus and N.
guttula had more unsuccessful bouts on 5g carcasses than on larger carcasses, though N. guttula
had a similar number of unsuccessful bouts on 50g carcasses as it did on 5g carcasses (Figure 3).
Over-allocation treatments: Lifespan for the over-allocation treatment was not
significantly different from the high quality resource control (30g treatment for N. marginatus
and 20g treatment for N. guttula) for either species (Figure 1). Total number of offspring tended
to be lower in the over-allocation treatment than either control for both species (Figure 2). Total
offspring mass also tended to be lower in the over-allocation treatment than the controls for both
species (Figure 2). Number of successful bouts for females in the over-allocation treatment was
similar to the high-quality resource control for both species (Figure 3). Total number of bouts
for females in the over-allocation treatment was also similar to the high-quality resource control
11

for both species (Figure 3). Number of unsuccessful bouts for female N. guttula in the over-
allocation treatment was similar to the low resource quality (10g carcasses) treatment but greater
than the high resource quality (20g carcasses) treatment (Figure 3). For N. marginatus, number
of unsuccessful bouts was similar for females in the over-allocation treatment to the high quality
(30g carcasses) treatment but greater than the low quality (20g carcasses) treatment (Figure 3).
Within Lifetime Fitness Measures
Mean Offspring Size: Mean offspring size differed significantly between species, among
treatments, and bout number (Table 3). The interaction between bout number and treatment was
also significant (Table 3). For both species, mean offspring size increased as individuals
continued to reproduce (except for 5g and 10g carcasses for N. marginatus and 5g carcasses for
N. guttula) and mean offspring size increased with bout number at a greater rate for females
breeding on larger carcasses (Figure 4).
Initial Brood Size: Initial brood size differed significantly by species, among treatments,
and bout number (Table 3). The interaction between species and carcass, the interaction between
species and bout number, and the interaction between bout number and carcass were also all
significant (Table 3). Females on larger carcasses tended to produce larger initial broods than
females on smaller carcasses early in life (Figure 5). Initial brood size for N. marginatus stayed
relatively constant across bouts at the lowest carcass sizes (5g and 10g) but dropped with more
bouts for every other treatment (Figure 5). For N. guttula, initial brood size decreased with bout
number for every treatment, and the rate of decrease was greater as carcass size increased (Figure
5).
Final Brood Size: Final brood size differed between species, among treatments and bouts
(Table 3). The interaction between bout number and species, the interaction between bout
12

number and treatment, and a three-way interaction of bout number, species, and treatment were
also significant (Table 3). For both species, final brood size decreased as individuals had more
bouts, with the rate of decrease greater on larger carcass sizes (Figure 5).
Carcass Use Efficiency: Carcass use efficiency differed by species, among treatments,
and bout number (Table 4). The interaction between species and treatment and the interaction
between bout number and treatment were also significant (Table 4). Efficiency decreased as
individuals had more bouts and the rate of decrease in efficiency was greater for females
breeding on larger sized carcasses than for females on smaller sized carcasses. Nicrophorus
guttula was most efficient on small carcasses (5g and 10g), while N. marginatus was most
efficient during bout 1 on 20g and 10g carcasses, but as bouts increased tended to be most
efficient on 20g carcasses (Figure 6). Nicrophorus marginatus was less efficient on both very
small (5g and 10g) and very large (40g and 50g) carcasses (Figure 6).
Percent Female Mass Change: Percent female mass change differed significantly only
among treatments (Table 4). Females of both species gained mass on larger carcasses (40g and
50g) and tended to lose mass on smaller carcasses (5g, 10g, 20g, and 30g; Figure 7).
Proportion Brood Culled: Proportion brood culled differed significantly by species,
treatment, and bout number (Table 4). The interaction between species and treatment was also
significant, with the three-way interaction between species, treatment, and bout number being
marginally significant. Nicrophorus marginatus females tended to cull more offspring with
successive bouts on small carcasses (5g and 10g), but culled fewer offspring with successive
bouts on larger carcasses (20g, 30g, 40g, and 50g; Figure 8). Nicrophorus guttula females
showed a different pattern, culling more offspring with successive bouts on all but the largest
13

carcass sizes; on 40g and 50g carcasses, they tended to cull fewer offspring with successive
bouts (Figure 8).
Over-allocation treatments: Mean offspring size increased with bout number for females
of both species in the over-allocation; however, over-allocating N. guttula (20g10g) had
smaller offspring than either the 20g or 10g controls at early bouts, while for N. marginatus
(30g20g), offspring were approximately the same size as the 30g and the 20g controls (Figure
4). For initial brood size, N. marginatus had a greater rate of decrease in the over-allocation
(30g20g) treatment than in the 20g control but not as great as the decrease in 30g control over
successive bouts (Figure 5). The rate of decrease for N. guttula in the over-allocation treatment
(20g10g) was similar to the 10g control, but not as great for the 20g control. For final brood
size, N. marginatus females on the over-allocation treatment (30g20g) had a greater rate of
decrease than females on the 20g control, but not as great of a decrease as females on the 30g
control (Figure 5). For N. guttula, females in the over-allocation treatment (20g10g) showed a
similar decrease in final brood size as females in the 10g control, but this decrease was not as
great for females in the 20g control. For carcass use efficiency, N. marginatus was less efficient
in the over-allocation treatment (30g20g) than either the 30g or 20g controls and efficiency
stayed relatively constant for N. guttula on the over-allocation treatment (20g10g; Figure 6).
For the proportion brood culled, N. marginatus tended to cull fewer offspring with successive
bouts in the over-allocation treatment (30g20g; Figure 8). Nicrophorus guttula females on the
over-allocation treatment (20g10g) tended to increase the number of offspring culled with
successive bouts (Figure 8).
14

DISCUSSION
As predicted, N. marginatus and N. guttula maximize reproductive fitness on different
sized resources. Nicrophorus marginatus had the highest total offspring mass and total number
of offspring on medium to large-sized carcasses (20g, 30g, 40g, and 50g), while N. guttula had
the highest total offspring mass and total number of offspring on small to medium-sized
carcasses (10g, 20g). Nicrophorus marginatus was most efficient on medium sized carcasses
(20g and 30g), while N. guttula was most efficient on the smallest carcasses (5g and 10g). In
addition, N. marginatus tended to cull more offspring with successive bouts on the smallest
carcass sizes (5g and 10g) but less on medium and large carcass sizes (20g, 30g, 40g, and 50g)
while N. guttula tended to cull less offspring with successive bouts on small and medium sized
carcasses (5g, 10g, 20g, and 30g) but culled more offspring with successive bouts on large
carcass sizes (40g and 50g).
Reproduction is costly for both female Nicrophorus guttula and Nicrophorus marginatus.
In general, females that did not reproduce lived longer than those that reproduced. However, the
reduction in lifespan mirrored the number of offspring produced in N. marginatus, but not in N.
guttula. This suggests that it is the number of offspring produced in N. marginatus, but the
accumulation of reproductive activities in general in N. guttula, that drives the cost of
reproduction as assessed by lifespan. Though the difference in lifespan between the two species
was fairly small (about five days), it was significant, further suggesting that the two species
accrue survival costs differently. Surprisingly, over-allocating females did not show a significant
decline in lifespan when compared to their large carcass size control (30g carcass for N.
marginatus and 20g carcass for N.guttula) and their lifespan was similar to females reproducing
on the largest carcass sizes (30g, 40g, and 50g for N. marginatus and 20g, 30g, 40g, and 50g for
15

N. guttula). These results are quite different from Nicrophorus orbicollis, which showed a
dramatic decrease in lifespan for females assigned to the over-allocation treatment when
compared to the large carcass size control (30g carcass for N. orbicollis; Creighton 2009). The
cost of over-allocation on individual survival may be greater for N. orbicollis than for N.
marginatus and N. guttula. Alternatively, the carcass sizes used for the over-allocation
experiment may have caused an unfair comparison across the three species. The carcass sizes
chosen for N. marginatus and N. guttula may not have caused a reduction in lifespan in the over-
allocation treatment but different sized carcasses (larger or smaller) may have replicated results
seen in N. orbicollis. Over-allocation thus may reduce lifespan in N. marginatus and N. guttula
similarly to N. orbicollis if a more similar carcass use ratio were used.
Reproduction also incurs fecundity costs for both burying beetle species studied. The
cost of reproduction hypothesis suggests that investment into current reproduction constrains
allocation to future reproduction (Williams 1966) and our results confirm this prediction. While
N. marginatus did not have any reduction in lifetime fecundity on large carcasses, N. guttula
showed a marked reduction in lifetime fecundity when reproducing on larger resources; females
had both fewer offspring and also smaller overall offspring mass when reproducing on larger
(≥30g) carcasses than when reproducing on smaller (10g and 20g) carcasses. Our results suggest
that N. marginatus is particularly adapted for using large carcasses (≥20g) and thus we did not
see a drop off in fecundity for females reproducing on larger carcasses. If very large carcasses
(>50g) were given to N. marginatus females, we would expect that fecundity would eventually
diminish as carcasses became difficult to care for and process. Additionally, both species were
less fecund when over-allocating; females suffered a large reduction in lifetime fecundity and
total offspring mass in the over-allocation treatment compared to their controls (30g20g
16

carcasses for N. marginatus and 20g10g carcasses for N. guttula). Thus, while each species
may be adapted to different resource sizes, they both accrue fecundity costs when making a poor
allocation decision. Additionally, while both species showed a decrease in total number of
offspring in the over-allocation treatment compared with their controls (30g20g for N.
marginatus and 20g10g for N. guttula) the reduction was greater in N. marginatus than in N.
guttula when viewed as a proportion of change in resource availability. Both species produced
approximately the same number of offspring on the control carcasses (51 and 52 offspring on
30g and 20g carcasses for N. marginatus and 27 offspring for 20g and 10g carcasses for N.
guttula) and reduced the number of offspring produced by about half when over allocating (28
offspring for N. marginatus and 15 offspring for N. guttula). Because the reduction in resources
in the over-allocation treatment was half for N. guttula but only one third for N. marginatus, the
greater reduction in total offspring in N. marginatus indicates that over allocation is more costly
in terms of fecundity costs than it is for N. guttula. We again point out that this may be an unfair
comparison if the carcass sizes used were not similar in the range of carcasses most suitable for
each species. Thus, we may see more similar fecundity costs if different sized carcasses were
used.
Why might N. marginatus suffer fewer fecundity costs than N. guttula on larger
carcasses? The variation in fecundity costs may indicate a species-specific difference in amount
of investment into a single reproductive attempt: N. guttula may be investing more into
reproduction per reproductive attempt than N. marginatus. The number of successful bouts was
greater for N. marginatus than for N. guttula, indicating that N. marginatus is more conservative
in investment into current reproduction. If investment into current reproduction is already high
for N. guttula, increasing carcass size may be more detrimental than it is for N. marginatus.
17

N. guttula may have smaller fecundity costs while over-allocating due to the differences
in optimal carcass sizes for each species and the carcasses chosen for the over-allocation
experiment. N. guttula was most efficient on 5g and 10g carcasses, and efficiency declined with
each subsequently larger carcass size. Their peak number of offspring produced was with 10g
and 20g carcasses. Females utilizing the largest sized carcasses were never able to exceed about
14 offspring, even in their first reproductive attempt, far below what a carcass of that size could
actually support (as seen by the offspring produced by N. marginatus on this size). This suggests
that N. guttula is under-utilizing all but 5g and 10g carcasses (excess carcass remains of larger
carcasses used by N. guttula during the experiment support this). Production of enzymes to
preserve and maintain carcasses from bacterial and fungal infection is costly for burying beetles
(Cotter et al. 2013), and reproduction on large carcasses for this species appears to be quite
difficult. Thus, when we gave N. guttula a high-quality resource and then switched it with a low-
quality resource, it may have benefited the female in that there was a smaller carcass to protect
from bacterial and fungal infection. This may have reduced the negative impact of over-
allocation for N. guttula.
Our results also indicate that N. marginatus and N. guttula senesce with age. Individuals
of both species decreased in multiple measures of female performance with age, including initial
brood size, final brood size, and carcass use efficiency, similar to N. orbicollis (Creighton 2009).
However, while female mass change clearly demonstrated terminal investment in N. orbicollis
(younger females gained more mass over a reproductive attempt than older females; Creighton
2009), percent female mass change did not show evidence of terminal investment in either N.
marginatus or N. guttula, (percent female mass change was not significantly different across
bouts). However, beetles may still have been terminally investing by culling fewer larvae as
18

they age. Both N. marginatus and N. guttula had a decrease in the number of initial larvae on the
carcass as they aged, and this decrease became greater the larger the resource the female was
using. In addition, final brood size similarly decreased with age. However, for both species, the
percentage of larvae culled per reproductive bout decreased for every treatment (except the two
smallest carcass sizes for N. marginatus which showed an increase in the number of larvae culled
with age). Thus, while females have smaller broods as they age (likely due to senescence), they
choose to care for a greater proportion of these broods as they get older.
Typically, the explanation for why the beetles cull down the brood is that culling a few
too many offspring is less costly to fitness than laying too few offspring (i.e., the insurance
hypothesis; Clark and Wilson 1981, Bartlett 1987). Our results suggest that for these two
species, there may be additional reasons for culling. Especially on larger carcass sizes, females
from both species were able to provide for a larger number of offspring than they kept and cared
for later in age. As females aged, they would lay a smaller number of eggs with each
reproductive attempt, but would still cull down the brood, despite previously caring for a similar
number of offspring in a previous reproductive attempt. This suggests that culling may serve an
additional purpose. One explanation is that culling is a means to ensure paternity (Eggert and
Muller 2011). Female N. vespilloides that lose in competitive interactions often will attempt to
parasitize the dominant female’s brood, and dominant females will base the timing of their
culling to prevent such parasitism from these subordinant females (Muller et al. 1990a, Eggert
and Muller 2011). Nicrophorus marginatus and N. guttula females may continue culling broods
later in life to avoid such brood parasitism. Interspecific brood parasitism between these two
species may also help explain how both species coexist in the same habitat.
19

With lower fecundity and carcass use efficiency, how does N. guttula persist in this area
with N. marginatus? Nicrophorus marginatus is larger than N. guttula and likely outcompetes N.
guttula in competitive interactions. Additionally, N. marginatus was more efficient and had
more offspring than N. guttula on all but the smallest carcass sizes (5g and 10g). Burying beetles
segregate niches to avoid competitive interactions on a number of different axes (seasonal
activity, habitat preference, resources; Anderson 1982, Trumbo 1990, 1992, Scott 1998, Hocking
et al. 2007, Smith et al. 2007). Nicrophorus defodiens, a smaller burying beetle, is often
displaced from larger carcasses by the larger N. orbicollis, but is successful on small carcasses,
likely due to a higher finding and processing efficiency on smaller carcasses (Trumbo 1990).
Nicrophorus guttula had a lower carcass use efficiency than N. marginatus for all but the
smallest carcass sizes (5g and 10g carcasses) where it was similar to N. marginatus.
Nicrophorus marginatus may simply ignore such small carcass sizes in nature given the ability to
increase total number of offspring on a larger carcass, and N. guttula may have uncontested
access to these small carcasses. Small mammal abundances may also favor sizes preferred by N.
guttula. The deer mouse (Peromyscus maniculatus) was the most abundant small mammal in
similar habitat in nearby Juab County and fits the optimal mass for N. guttula (Smith and Urness
1984). Increased numbers of these smaller carcasses may decrease competitive interactions
between the two species and allow for N. guttula to persist despite similar efficiency and
reproductive output on these sizes. Carcass preference and competition experiments between
these species could further elucidate how they are able to co-occur.
An additional explanation for coexistence despite the lack of dominance on varying
carcass sizes may be utilization of alternative reproductive strategies; N. guttula may use brood
parasitism as a main form of reproduction. At least some species of burying beetles employ
20
brood parasitism as an alternative reproductive strategy (Muller et al. 1990a). Typically, females
that lose competitive interactions with a dominant female will continue to reside around the
carcass and will lay fertilized eggs in an attempt to parasitize the dominant female’s brood
(Muller et al. 2007). Because N. guttula would seemingly lose most competitive interactions
between N. marginatus, female N. guttula in this region may utilize brood parasitism as a
dominant reproductive strategy, and thus are maladapted to care for broods alone on carcasses of
any size.
In this study, we showed that two phylogenetically similar species of burying beetles that
differ in body size are adapted to maximize reproductive output on different-sized resources.
These beetles may be utilizing different carcass sizes to avoid competitive interactions with each
other and segregating niches on a resource-size basis. We also showed that for both species,
reproduction is costly; burying beetles had lower survival on larger carcasses than they did on
smaller carcasses. In addition, we utilized the unique biology of burying beetles to test the cost
of reproduction hypothesis for these two species and showed that over-allocation is costly in
terms of fecundity costs, but not for survival costs, for both species. Additionally, N. guttula
showed lower fecundity costs than N. marginatus, indicating that N. guttula may be investing
more energy into each reproductive attempt and thus a poor allocation decision may be less
costly. The way the two species utilize carcasses and incur reproductive costs may demonstrate
how they co-occur in nature.
21

LITERATURE CITED
Anderson, R. S. 1982. Resource partitioning in the carrion beetle (Coleoptera, Silphidae) fauna
of southern Ontario - ecological and evolutionary considerations. Canadian Journal of
Zoology-Revue Canadienne De Zoologie 60:1314-1325.
Bartlett, J. 1987. Filial cannibalism in burying beetles. Behavioral Ecology and Sociobiology
21:179-183.
Bartlett, J. and C. M. Ashworth. 1988. Brood size and fitness in Nicrophorus vespilloides
(Coleoptera: Silphidae). Behavioral Ecology and Sociobiology 22:429-434.
Carlisle, T. R. 1982. Brood success in variable environments - implications for parental care
allocation. Animal Behaviour 30:824-836.
Clark, A. B. and D. S. Wilson. 1981. Avian breeding adaptations - hatching asynchrony, brood
reduction, and nest failure. Quarterly Review of Biology 56:253-277.
Cotter, S. C., J. E. Littlefair, P. J. Grantham, and R. M. Kilner. 2013. A direct physiological
trade-off between personal and social immunity. Journal of Animal Ecology 82:846-853.
Creighton, J. C., N. D. Heflin, M. C. Belk. 2009. Cost of reproduction, resource quality, and
terminal investment in a burying beetle. American Naturalist 174:673-684.
Eggert, A. K. and J. K. Muller. 2011. Timing of oviposition enables dominant female burying
beetles to destroy brood-parasitic young. Animal Behaviour 82:1227-1233.
Heimpel, G. E. and J. A. Rosenheim. 1995. Dynamic host feeding by the parasitoid Aphytis
melinus - the balance between current and future reproduction. Journal of Animal
Ecology 64:153-167.
22

Hocking, M. D., C. T. Darimont, K. S. Christie, and T. E. Reimchen. 2007. Niche variation in
burying beetles (Nicrophorus spp.) associated with marine and terrestrial carrion.
Canadian Journal of Zoology-Revue Canadienne De Zoologie 85:437-442.
Le Lann, C., B. Visser, J. van Baaren, J. J. M. van Alphen, and J. Ellers. 2012. Comparing
resource exploitation and allocation of two closely related aphid parasitoids sharing the
same host. Evolutionary Ecology 26:79-94.
Muller, J. K., V. Braunisch, W. B. Hwang, and A. K. Eggert. 2007. Alternative tactics and
individual reproductive success in natural associations of the burying beetle, Nicrophorus
vespilloides. Behavioral Ecology 18:196-203.
Muller, J. K., A. K. Eggert, and J. Dressel. 1990a. Intraspecific brood parasitism in the burying
beetle, Necrophorus vespilloides (Coleoptera, Silphidae). Animal Behaviour 40:491-499.
Muller, J. K., A. K. Eggert, and E. Furlkroger. 1990b. Clutch size regulation in the burying
beetle Necrophorus vespilloides Herbst (Coleoptera, Silphidae). Journal of Insect
Behavior 3:265-270.
Peck, S. B. and M. M. Kaulbars. 1987. A synopsis of the distribution and bionomics of the
carrion beetles (Coleoptera, Silphidae) of the conterminous United States. Proceedings of
the Entomological Society of Ontario 118:47-81.
Pukowski, E. 1933. Oekologische Untersuchungen an Necrophorus F. Z. Morph Oekol Tiere
Berlin 27:518-586.
Ratcliffe, B. C. 1996. The carrion beetles (Coleoptera: Silphidae) of Nebraska. Bulletin of the
University of Nebraska State Museum, Lincoln, Nebraska.
Rosenheim, J. A. 1999. Characterizing the cost of oviposition in insects: a dynamic model.
Evolutionary Ecology 13:141-165.
23

Scott, M. P. 1998. The ecology and behavior of burying beetles. Annual Review of Entomology
43:595-618.
Sikes, D. S. and C. Venables. 2013. Molecular phylogeny of the burying beetles (Coleoptera:
Silphidae: Nicrophorinae). Molecular Phylogenetics and Evolution 69:552-565.
Smith, C. B. and P. J. Urness. 1984. Small mammal abundance on native and improved foothill
ranges, Utah. Journal of Range Management 37:353-357.
Smith, G., S. T. Trumbo, D. S. Sikes, M. P. Scott, and R. L. Smith. 2007. Host shift by the
burying beetle, Nicrophorus pustulatus, a parasitoid of snake eggs. Journal of
Evolutionary Biology 20:2389-2399.
Smith, R. J. and B. Heese. 1995. Carcass selection in a high-altitude population of the burying
beetle, Nicrophorus investigator (Silphidae). Southwestern Naturalist 40:50-55.
Trumbo, S. T. 1990. Interference competition among burying beetles (Silphidae, Nicrophorus).
Ecological Entomology 15:347-355.
Trumbo, S. T. 1992. Monogamy to communal breeding - exploitation of a broad resource base
by burying beetles (Nicrophorus). Ecological Entomology 17:289-298.
Trumbo, S. T. and A. G. Fernandez. 1995. Regulation of brood size by male parents and cues
employed to assess resource size by burying beetles. Ethology Ecology & Evolution
7:313-322.
Trumbo, S. T. and A. J. Fiore. 1994. Interspecific competition and the evolution of communal
breeding in burying beetles. American Midland Naturalist 131:169-174.
Van Noordwijk, A. J. and G. Dejong. 1986. Acquisition and allocation of resources - their
influence on variation in life-history tactics. American Naturalist 128:137-142.
24

Williams, G. C. 1966. Natural selection, the cost of reproduction and a refinement of Lack's
principle. American Naturalist 100:687-690.
25

TABLES
Table 1. Results of ANCOVA for lifespan, lifetime total number of offspring, and lifetime total offspring mass. Significant effects are bolded.
LIFESPAN Effect d.f. F P species 1 4.89 0.0283 treatment 8 23.96 <0.0001 treatment x species 6 0.37 0.8943 standardized size 1 27.96 <0.0001
TOTAL NUMBER OF OFFSPRING
Effect d.f. F P species 1 55.27 <0.0001 treatment 7 4.35 0.0002 treatment x species 5 5.52 0.0001 standardized size 1 1.59 0.2099
TOTAL OFFSPRING MASS
Effect d.f. F P species 1 93.36 <0.0001 treatment 7 17.33 <0.0001 treatment x species 5 8.38 <0.0001 standardized size 1 2.94 0.0884
26

Table 2. Results of ANCOVA for number of successful bouts, total number of bouts, and unsuccessful bouts. Significant effects are bolded.
NUMBER OF SUCCESSFUL BOUTS
Effect d.f. Chi-Square P species 1 16.82 <0.0001 treatment 7 57.46 <0.0001 treatment x species 5 3.79 0.5793 standardized size 1 2.73 0.0988
TOTAL NUMBER OF BOUTS
Effect d.f. Chi-Square P species 1 10.06 0.0015 treatment 7 90.21 <0.0001 treatment x species 5 1.31 0.9338 standardized size 1 8.57 0.0034
NUMBER UNSUCESSFUL BOUTS
Effect d.f. Chi-Square P species 1 1.00 0.3183 treatment 7 61.48 <0.0001 treatment x species 5 12.75 0.0258 standardized size 1 8.57 0.0034
27
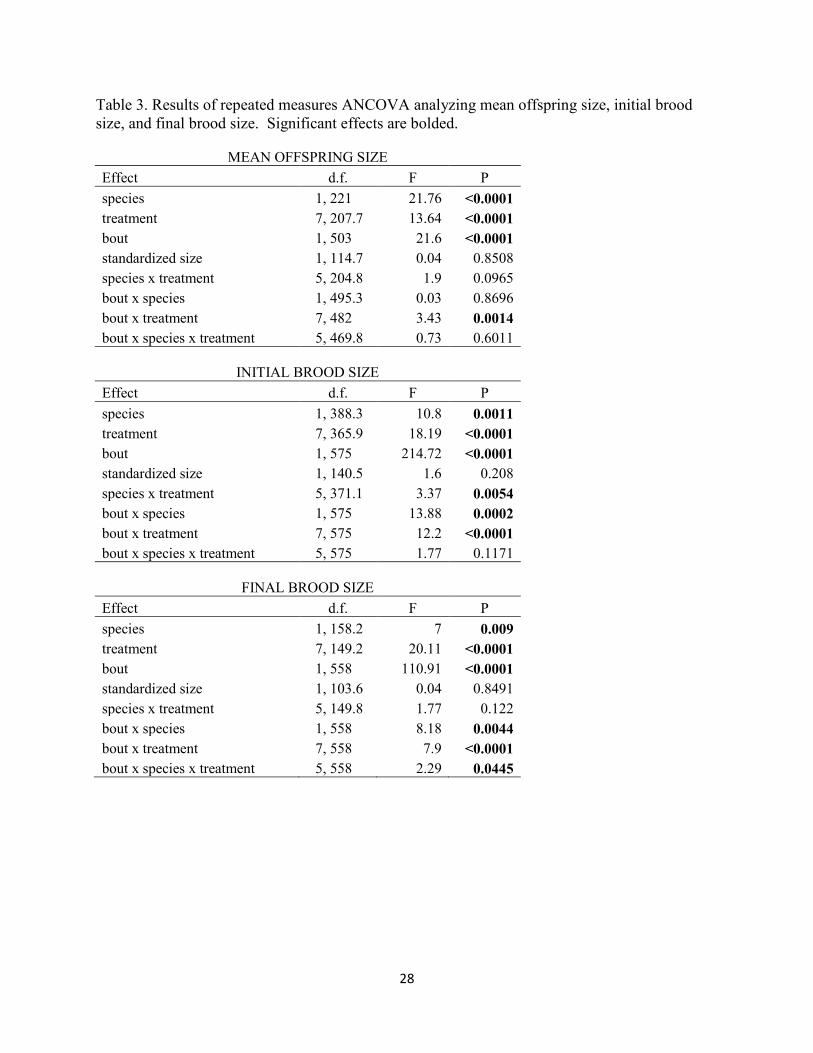
Table 3. Results of repeated measures ANCOVA analyzing mean offspring size, initial brood size, and final brood size. Significant effects are bolded.
MEAN OFFSPRING SIZE Effect d.f. F P species 1, 221 21.76 <0.0001 treatment 7, 207.7 13.64 <0.0001 bout 1, 503 21.6 <0.0001 standardized size 1, 114.7 0.04 0.8508 species x treatment 5, 204.8 1.9 0.0965 bout x species 1, 495.3 0.03 0.8696 bout x treatment 7, 482 3.43 0.0014 bout x species x treatment 5, 469.8 0.73 0.6011
INITIAL BROOD SIZE
Effect d.f. F P species 1, 388.3 10.8 0.0011 treatment 7, 365.9 18.19 <0.0001 bout 1, 575 214.72 <0.0001 standardized size 1, 140.5 1.6 0.208 species x treatment 5, 371.1 3.37 0.0054 bout x species 1, 575 13.88 0.0002 bout x treatment 7, 575 12.2 <0.0001 bout x species x treatment 5, 575 1.77 0.1171
FINAL BROOD SIZE
Effect d.f. F P species 1, 158.2 7 0.009 treatment 7, 149.2 20.11 <0.0001 bout 1, 558 110.91 <0.0001 standardized size 1, 103.6 0.04 0.8491 species x treatment 5, 149.8 1.77 0.122 bout x species 1, 558 8.18 0.0044 bout x treatment 7, 558 7.9 <0.0001 bout x species x treatment 5, 558 2.29 0.0445
28

Table 4. Results of repeated measures ANCOVA analyzing carcass use efficiency, percent female mass change, and proportion brood culled. Significant effects are bolded.
CARCASS USE EFFICIENCY
Effect d.f. F P species 1, 410.6 101.48 <0.0001 treatment 7, 476.5 6.62 <0.0001 bout 1, 486.3 35.85 <0.0001 standardized size 1, 153.6 0.08 0.7725 species x treatment 5, 158 12.33 <0.0001 bout x species 1, 499.4 1.11 0.2923 bout x treatment 7, 477.2 3.78 0.0005
PERCENT MASS CHANGE
Effect d.f. F P species 1, 682.8 1.20 0.2745 treatment 7, 661.9 1.79 0.0862 bout 1, 668.2 1.06 0.3043 standardized size 1, 159.9 1.68 0.1968 species x treatment 5, 651.2 0.73 0.5992 bout x species 1, 669.4 2.08 0.1499 bout x treatment 7, 671.3 1.54 0.1500 bout x species x treatment 5, 669 1.70 0.1312
PROPORTION BROOD CULLED
Effect d.f. F P species 1, 212.8 5.65 0.0184 treatment 7, 167.2 2.88 0.0072 bout 1, 202 8.71 0.0035 standardized size 1, 135.8 8.45 0.0043 species x treatment 5, 186.4 2.58 0.0275 bout x species 1, 265.6 0.29 0.5892 bout x treatment 7, 117.1 0.75 0.6305 bout x species x treatment 5, 129.2 2.03 0.0788
29

FIGURES
Figure 1. Mean (±SE) lifespan of N. marginatus (closed circles) and N. guttula (open circles) for non-reproducing (NR) females, reproducing females (on 5g, 10g, 20g, 30g, 40g, or 50g carcasses), and over-allocation (E) females.
30

Figure 2. Mean (±SE) lifetime number of offspring and total offspring mass of N. marginatus (closed circles) and N. guttula (open circles) for females on 5g, 10g 20g, 30g, 40g, or 50g carcasses, and for females on the over-allocation (E) treatment.
31

Figure 3. Mean (±SE) number of successful bouts, total reproductive bouts, and unsuccessful bouts of N. marginatus (closed circles) and N. guttula (open circles) for females on 5g, 10g 20g, 30g, 40g, or 50g carcasses, and for females on the over-allocation (E) treatment.
32

Figure 4. Mean (±SE) offspring mass for N. marginatus (left) and N. guttula (right) females within a female’s lifetime. Darkest to lightest circles: 5g, 10g, 20g, 30g, 40g, 50g, over-allocation.
33

Figure 5. Mean (±SE) initial brood and final brood for N. marginatus (left) and N. guttula (right) females within a female’s lifetime. Darkest to lightest circles: 5g, 10g, 20g, 30g, 40g, 50g, over-allocation.
34

Figure 6. Mean (±SE) carcass use efficiency for N. marginatus (left) and N. guttula (right) females within a female’s lifetime. Darkest to lightest circles: 5g, 10g, 20g, 30g, 40g, 50g, over-allocation.
35

Figure 7. Mean (±SE) percent female mass change during reproductive attempts for both N. marginatus and N. guttula females on 5g, 10g, 20g, 30g, 40g, and 50g carcasses.
36

Figure 8. Mean (±SE) proportion brood culled during each reproductive bout for N. marginatus (left) and N. guttula (right) females within a female’s lifetime. Darkest to lightest circles: 5g, 10g, 20g, 30g, 40g, 50g, over-allocation.
37