variation in medicaid eligibility and jennifer haley ... · genevieve m. kenney victoria lynch...
TRANSCRIPT

Genevieve M. Kenney
Victoria Lynch
Jennifer Haley
Michael Huntress
Variation in MedicaidEligibility andParticipation amongAdults: Implications forthe Affordable Care Act
Steep declines in the uninsured population under the Affordable Care Act (ACA) will
depend on high enrollment among newly Medicaid-eligible adults. We use the 2009American Community Survey to model pre-ACA eligibility for comprehensive Medicaid
coverage among nonelderly adults. We identify 4.5 million eligible but uninsured adults.We find a Medicaid participation rate of 67% for adults; the rate is 17 percentagepoints lower than the national Medicaid participation rate for children, and it varies
substantially across socioeconomic and demographic subgroups and across states.Achieving substantial increases in coverage under the ACA will require sharp increases
in Medicaid participation among adults in some states.
The Affordable Care Act (ACA), enacted in2010, includes an expansion of Medicaid1
eligibility to the nonelderly with incomesbelow 138% of the federal poverty level(FPL).2 Beginning in 2014, states that expandMedicaid under the ACA will receive federalfinancing that covers 100% of the cost ofcovering the newly eligible through 2016, withfederal matching rates gradually phasingdown to 90% by 2020. In contrast, federalmatching rates for those currently eligibleunder Medicaid vary from 50% to 76%.3
While the ACA will make some childrennewly eligible for Medicaid, adults will com-prise the vast majority of the newly eligible,particularly adults who do not live withdependent children (Holahan and Headen2010). This reflects the fact that adults arecurrently much less likely than children to beeligible for public coverage under Medicaidand the Children’s Health Insurance Program(CHIP), and that parents are more likely than
adults without dependent children to beeligible for such coverage (Cohen Ross et al.2009). At present, while half of the states coveruninsured children with family incomes upto 250% of the FPL or higher (18 of these at300% of the FPL or higher), just 18 statesprovide comprehensive Medicaid coverageto parents with incomes at or above 100% ofthe FPL. Thirty-three states have thresholdsbelow this level, with 17 of these only coveringparents at 50% of the FPL or lower (Heber-lein, Brooks et al. 2012).
Very few states provide Medicaid coveragefor nondisabled, nonpregnant adults withoutchildren (Heberlein et al. 2011; Kaiser Com-mission on Medicaid and the Uninsured2011). As of 2012, adults without dependentchildren in only the District of Columbia andVermont, and parents in only the District ofColumbia and 10 states (Connecticut, Illinois,Maine, Massachusetts, Minnesota, New Jersey,New York, Rhode Island, Vermont, and
Genevieve M. Kenney, M.A., M.A., Ph.D., is a senior fellow; Victoria Lynch, M.S., and Jennifer Haley, M.A., areresearch associates; and Michael Huntress, B.A., is a research assistant, all at the Health Policy Center of the UrbanInstitute. Address correspondence to Dr. Kenney at Health Policy Center, The Urban Institute, 2100 M St., N.W.,Washington DC 20037. Email: [email protected]
Inquiry 49: 231–253 (Fall 2012). ’ 2012 Excellus Health Plan, Inc.ISSN 0046-9580 10.5034/inquiryjrnl_49.03.08
www.inquiryjournal.org 231
Wisconsin) are eligible for comprehensiveMedicaid or Medicaid-equivalent coverage ator above 133% of the FPL, the level to whichMedicaid coverage can be expanded under theACA.4
An estimated 15 million uninsured adultsnationwide could become newly eligible forMedicaid in 2014 under the ACA (Kenney etal. 2012). However, in light of the recentSupreme Court decision, states have theoption of whether to expand Medicaid underthe ACA (Advisory Board 2012), and it isexpected that even in states that implementthe expansion, some people who are eligiblefor Medicaid/CHIP will not enroll (Sommersand Epstein 2010; Buettgens, Garrett, andHolahan 2010). Recent research showed thatMedicaid/CHIP participation rates have in-creased among children, reaching nearly 85%in 2009 (Kenney et al. 2011), but participa-tion rates vary across subgroups of childrenwith respect to age, race/ethnicity, andcitizenship and across states (Kenney et al.2010).
Given current Medicaid/CHIP eligibilitypolicies, it is not surprising that eligibilityand participation also vary across subgroupsof adults. Higher eligibility rates have beenfound among women, citizens, parents, andthose with lower incomes (Davidoff et al.2004). Among the eligible, prior research hasfound higher participation among adults withdisabilities, parents of children enrolled inMedicaid/CHIP, and those with recent cashassistance participation (Davidoff et al. 2004;Davidoff, Yemane, and Adams 2005; Som-mers and Epstein 2010), perhaps because oftighter linkages to other public assistanceprograms. In addition, participation rateshave been found to vary across states (David-off et al. 2004; Davidoff, Yemane, andAdams 2005; Sommers and Epstein 2010).
This paper uses the 2009 American Com-munity Survey (ACS) to explore variation ineligibility for comprehensive Medicaid bene-fits, as well as variation in Medicaid partic-ipation, among nonelderly adults prior to theACA. The ACS includes a public use sampleof approximately 1.8 million adults eachyear. Due to the survey’s large sample sizeand representation of every county in thenation in its sample frame, the addition of a
health insurance question beginning in 2008made it possible to develop much moreprecise estimates of insurance coverage atthe state and local level than was previouslypossible. This study improves on other recentstate-level estimates of Medicaid eligibilityand participation (Sommers and Epstein2010) by employing a more comprehensiveapproach5 to modeling eligibility, by using adata source with much larger state-levelsamples6 and more complete geographiccoverage within each state, and by examiningalternative approaches to defining eligibilityand participation.
The following section describes the datasource, how we derive coverage estimates onthe ACS, and how eligibility is defined foradults. Subsequent sections present findingsand discuss the policy and methodologicalimplications of the results.
Data and Methods
Data Source
The estimates in this study are derived fromthe 2009 ACS, an annual survey fielded bythe U.S. Census Bureau. We use an augment-ed version of the ACS prepared by theUniversity of Minnesota Population Center.Known as the Integrated Public Use Micro-data Sample (IPUMS), it employs the publicuse sample of the ACS and contains editsfor family relationships and other variables(Ruggles et al. 2010). The 2009 ACS has areported household response rate of 98.0%,ranging from 94.9% in the District ofColumbia to 99.4% in Indiana and Wisconsin(U.S. Census Bureau 2009). The survey usesan area frame that includes households withand without telephones (land line or cellular).It is a mixed-mode survey that starts with amail-back questionnaire—52.7% of the civil-ian noninstitutionalized sample was complet-ed by mail in 2009 (Mach and O’Haraforthcoming)—and is followed by telephoneinterviews for initial nonresponders; it isfurther followed by in-person interviews fora subsample of remaining nonresponders(Griffin and Hughes 2010). The estimatespresented here are based on a sample of 1.8million adults ages 19 to 64 in the civiliannoninstitutionalized population.7
Inquiry/Volume 49, Fall 2012
232

In 2008, a question was added to the ACSto ask respondents about coverage of eachindividual in their households by any of thefollowing types of health insurance or healthplans at the time of the survey:
a. Insurance through a current or formeremployer or union (of this person oranother family member);
b. Insurance purchased directly from aninsurance company (by this person oranother family member);
c. Medicare, for people 65 and older, orpeople with certain disabilities;
d. Medicaid, Medical Assistance, or anykind of government-assistance plan forthose with low incomes or a disability;
e. TRICARE or other military health care;f. VA [Department of Veterans Affairs]
(including those who have ever used orenrolled for VA health care);
g. Indian Health Service;h. Any other type of health insurance or
health coverage plan (respondents areasked to specify).
Multiple types of coverage can be identi-fied for each person, and people identified asnot having coverage under categories athrough f (or recoded to another categoryfrom the write-in option, category h) areconsidered uninsured (Turner and Bou-dreaux 2010).8 Since the data are collectedcontinuously over a 12-month period, thecoverage estimates represent an average dayin the calendar year.
With the exception of nongroup coverageand, to a lesser extent, Medicaid, researchsuggests that the ACS coverage estimatesreleased by the Census Bureau are generallyvalid for policy purposes (Boudreaux et al.2011), with estimates for the other coveragecategories fairly similar to those from theCurrent Population Survey Annual Socialand Economic Supplement (CPS-ASEC) andthe National Health Interview Survey (NHIS)(Turner and Boudreaux 2010), which arecommonly used to study insurance coverage.
Data Edits
In an effort to correct for the apparentmisreporting of private nongroup coverageand Medicaid/CHIP in the ACS, and to
define coverage as including only comprehen-sive health insurance as opposed to single-service plans (e.g., dental coverage), wedeveloped a set of logical coverage edits thatare applied if other information collected inthe ACS implies that coverage for a samplecase likely has been misclassified (Lynch et al.2011; Lynch and Kenney 2011). We drawfrom approaches that have been applied toother surveys (National Center for HealthStatistics 2005) and build on ACS edit rulesused by the Census Bureau (Lynch, Bou-dreaux, and Davern 2010). For instance, weedit sample adults reporting private non-group coverage to Medicaid if they aresimulated as eligible for Medicaid, a parentof a dependent child, and enrolled in theSupplemental Nutrition Assistance Program(SNAP)/food stamps or public assistance,assuming that the reported private nongroupcoverage is an error because families withincomes low enough to qualify for otherpublic benefits likely cannot afford to pur-chase nongroup health insurance coverage onthe individual market. We also edit sampleadults reporting both Medicaid and employ-er-sponsored insurance (ESI) to ESI only ifthey are not simulated as Medicaid-eligible(assuming that the reported Medicaid cover-age is an error or that it is for wrap aroundcoverage or for narrowly defined services, suchas for family planning). As detailed in anappendix (available to readers upon request),the additional edits increase the estimatednumber of uninsured adults from the ACSby 1 million and decrease the number of adultswith Medicaid coverage by 58,000 in 2009.After editing, our derived estimate of thenumber of uninsured adults is 39.4 million,relative to the NHIS uninsured estimate of39.2 million for 2009, and our derived estimateof the number of adults with Medicaid is 16.8million, compared with 17.1 million from theNHIS (authors’ tabulations).9
Eligibility Simulation
This analysis relies on a model developed forthe ACS that simulates eligibility for Medi-caid using available information on eligibilityguidelines, including income thresholds forthe appropriate family10 size, asset tests,parent/family status, and the amount and
Medicaid Eligibility
233
extent of income disregards, for each pro-gram and state in place as of the middle of2009 (Cohen Ross et al. 2008; Cohen Rosset al. 2009; Heberlein et al. 2011; KaiserCommission on Medicaid and the Uninsured2010a, 2011).11 For noncitizens, as in someprior studies, the model also takes intoaccount length of residency in the UnitedStates in states where this is a factor ineligibility (National Immigration Law Center2011; Sullivan 2010). Because the ACS doesnot contain sufficient information to deter-mine whether an individual is an authorizedimmigrant and therefore potentially eligiblefor Medicaid coverage, we impute documen-tation status for noncitizens based on a modelused in the CPS-ASEC. Documentationstatus is imputed to immigrant adults in twostages using individual and family character-istics, based on an imputation methodologythat was originally developed by Passel(Passel and Cohen 2009). The approach isdesigned to produce imputations that match,in the aggregate, published summary esti-mates of the U.S. undocumented population,nationally and in a subset of large states.12
Our model identifies eligibility for compre-hensive Medicaid or Medicaid-equivalentbenefits in 2009 using state rules for majorpathways for adults. The following eligibilitypathways are modeled (they correspondroughly to the order in which caseworkersor state eligibility-determination softwaretypically check for eligibility):13
1. Aged-out Foster Children (young adultswho were foster children who qualify forMedicaid);
2. Supplemental Security Income (SSI)(adults who receive SSI income aredeemed Medicaid-eligible because theyare enrolled automatically in most states);
3. Section 1931 (usually parents of minorswhose incomes fall below the TemporaryAssistance for Needy Families [TANF]income cut-offs);
4. Aged/Blind/Disabled (adults with func-tional limitations who meet the qualifica-tions for aged/blind/disabled coverage);
5. Section 1115 Waivers (adults who meetthe qualifications for eligibility in stateswith Section 1115 programs that provide
comprehensive Medicaid or Medicaid-equivalent benefits);
6. Medically Needy (adults categoricallyeligible for medically needy coveragewho meet the income qualifications foreligibility);
7. Relative Caretakers (adults who are notparents of minors but appear to berelative caretakers of Medicaid-enrolledminors not living with their parents).
For reporting purposes, these eligibilitypathways are grouped into four mutuallyexclusive categories, where cases are groupedaccording to the first pathway for which theyare eligible: 1) Section 1931 (parents qualifyingfor Section 1931 coverage and relative care-takers), 2) disability-related (those receivingSSI and those who qualify for aged/blind/disabled coverage), 3) 1115 waiver (thosemeeting the qualifications for 1115 waivercoverage), and 4) other (aged-out fosterchildren and medically needy).
In addition, the appendix includes explor-atory analysis of eligibility and participationwhere we include adults who are ineligible forcomprehensive Medicaid in the simulationbut either: 1) are eligible for federally fundedSection 1115 Medicaid coverage (such asCommonwealth Care in Massachusetts) orstate-funded coverage (such as the BasicHealth Plan in Washington) that is morelimited in scope than comprehensive Medi-caid (Heberlein et al. 2011) (we refer to theseadults as ‘‘limited benefit eligibles’’14), or 2)fall into particular Medicaid categoricallyeligible groups but do not meet all therequirements for eligibility according to theinformation available on the ACS and therules we have (known as ‘‘imputed eligibles’’).Of the 7.4 million adults with Medicaidcoverage who do not appear eligible forcomprehensive Medicaid services throughthe main pathways that are simulated, 1.4million are eligible for limited coverage (.7million for limited Medicaid coverage and .7million for state-funded coverage), and 3.6million meet the categorical requirements foreligibility for comprehensive Medicaid cover-age but have reported income levels slightlyabove the eligibility thresholds that aremodeled (i.e., these are so-called imputed
Inquiry/Volume 49, Fall 2012
234

eligibles, many of whom are likely eligible forpregnancy-related services but are not mod-eled in the core eligibility model because wedo not have information on pregnancystatus).15 Our core estimates do not includethese groups, but where applicable we exam-ine how our findings change when they areincluded.
Summary of Limitations to the Model
Modeling eligibility for adults is much moredifficult than for children for a number ofreasons: first, the eligibility rules are morecomplex for adults and thus harder to derivefrom summary reports and state manuals;second, the ACS, like other surveys, does notcontain the detail needed to correctly captureimportant elements of all the major eligibilitypathways for adults (e.g., pregnancy status,legal disability status, income disregardsrelated to child support, medical spendingused to calculate spend-down for medicallyneedy eligibility, or duration of enrollmentor income history to determine transitionalmedical assistance [TMA] and related eligi-bility); and third, some states offer coveragefor adults that is less comprehensive in scopethan full Medicaid benefits.
While extensive efforts were made to collectinformation on the different rules for eachstate and to marshal all the relevant informa-tion in the ACS, eligibility in states that haveadditional pathways that are not captured inour model may be understated. In addition,states’ determinations of disability-relatedeligibility use criteria other than the indicatorsof functional limitations available on the ACS.Thus, some of the adults who appear in ourmodel to be eligible through the disabilitypathway might not qualify when the moredetailed information on their characteristics istaken into account. Additional measurementerror in estimates of Medicaid eligibility andparticipation may result from: the use of theACS’s income data, which collects annualrather than monthly income, and thus doesnot align with eligibility determination proce-dures (and which could miscalculate eligibilityfor those whose income fluctuates from monthto month); the misreporting of income or otherinformation, such as immigration status, usedin determining eligibility; error associated with
the application of state-level eligibility require-ments (for instance, if states apply additionalcriteria such as work requirements for certaincategories of eligibles); the lack of data todetermine whether custodial parents meetchild support cooperation requirements whichcould preclude them from Medicaid eligibility(Roberts 2003); the possible inclusion ofenrollees in restricted-benefit Medicaid cover-age or local public plans (which are notmodeled in this simulation) among thoseclassified as having Medicaid coverage; andthe systematic underreporting of income insurvey data (Moore, Stinson, and Welnick2000), which could lead to overstating thenumber of eligible adults and understatingtheir participation. While, taken together, webelieve the limitations in our study may biasupward our participation rates and downwardour estimates of the number of uninsuredadults who are eligible but not enrolled, thedirection and extent of bias are not known.
Analysis
We examine rates of Medicaid eligibility andparticipation, where we define participationrates as the ratio of Medicaid-eligible enrolledadults to Medicaid-eligible enrolled adultsplus Medicaid-eligible uninsured adults.16
Participation rates are presented for the totalnonelderly adult population, and by thefollowing socioeconomic, health, and demo-graphic variables: parental status (where aparent is defined as an adult living in ahousehold with a biological, adoptive, orstepchild under age 19), age, sex, citizenshipstatus (U.S. citizen or noncitizen), race/ethnicity, English proficiency, income levelof the family, education level, work status,marital status, report of any functionallimitation (experiencing cognitive difficulties,trouble performing tasks outside the home,physical limitations, difficulty caring foroneself, or vision or hearing difficulties),household receipt of SNAP/food stamps atsome point in the prior 12 months,17 veteranstatus, and the availability of a vehicle and oftelephone service in the household. We alsoexamine variation across metropolitan status,region, and state. National and state-levelparticipation rates are presented for childrenas a point of comparison to the estimates for
Medicaid Eligibility
235

adults, using a sample of more than 700,000children from birth to age 18 in the civiliannoninstitutionalized population (see Kenneyet al. 2010 and Kenney et al. 2011 forinformation on how eligibility and coveragewere defined for children).18
In addition, we estimate multivariate mod-els to assess the correlates of Medicaidparticipation among adults. Both logit andlinear/ordinary least squares (OLS) probabil-ity models produced similar results in termsof direction of the effects and significancelevel; we present results from the linearprobability models for ease of interpretation.
We use a linear probability model of theform:
Participationi~azX
k
bkXkizdizei
where Participationi is a dummy dependentvariable for participation in Medicaid; Xki
is avector of dummy variables of socioeconomic,demographic, and health status characteris-tics; di is a vector of state dummy variables tocontrol for factors influencing participationunique to each state (such as intensity ofenrollment and retention efforts, the availabil-ity of additional public programs such aspremium assistance programs that may affectthe likelihood that the uninsured seek cover-age, and other differences); and ei is astochastic error term. The models control forall of the socioeconomic, health, and demo-graphic variables listed previously.19
To examine the extent to which differencesin participation across states hold up when wecontrol for observed differences in the com-position of the eligible population acrossstates, we compare the difference betweeneach state’s participation rate and the rest ofthe nation’s, using a modified version of themodel shown earlier. We remove the fullvector of state dummy variables and includeonly one state dummy at a time representingresidence in a given state. The coefficient onthat term is taken to be the difference inparticipation likelihood for an individualresiding in that state relative to the rest ofthe nation, controlling for individual differ-ences in the socioeconomic, health, anddemographic characteristics included in themodel. We run this model 51 times, each with
a single dummy variable representing each ofthe 50 states and the District of Columbia.
All estimates use weights provided by theU.S. Census Bureau. Standard errors arecalculated using replicate weights that takeinto account the complex nature of thesample design.
Results
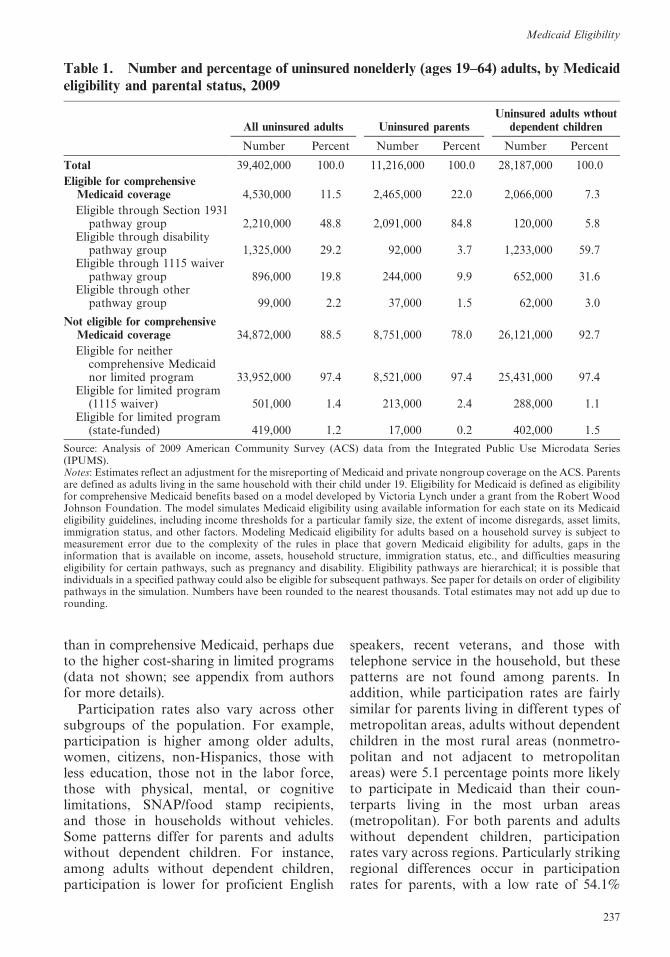
We find over 39 million uninsured nonelderlyadults in 2009 (Table 1). Of those, 11.5%—or4.5 million—are eligible for comprehensiveMedicaid benefits but not enrolled.20 Whenincluding additional eligibility for more lim-ited Medicaid coverage or state-funded cov-erage, we find an additional .9 million eligibleuninsured—.5 million and .4 million, respec-tively.21 Parents constitute more than half(2.5 million) of the 4.5 million uninsuredadults who are eligible for comprehensiveMedicaid coverage but not enrolled, and theremaining 2 million are adults who do nothave dependent children. An estimated 22.0%of uninsured parents are eligible for Medi-caid, compared with just 7.3% of uninsuredadults without dependent children. The tablealso indicates that the eligibility pathwaysdiffer dramatically for uninsured parents andother adults: 84.8% of eligible uninsuredparents qualify through Section 1931 cover-age, while the majority of uninsured adultswithout dependent children are eligible be-cause they report having a functional limita-tion and meet the income qualifications fordisability-related coverage (59.7%)22 or be-cause they qualify for 1115 waiver coverage instates with Medicaid programs for adultswithout dependent children (31.6%).
Among Medicaid-eligible adults, we finda participation rate of 67.4%,23 with higherparticipation among adults without dependentchildren (70.2%) than for parents (64.5%),which is likely because of the higher rates ofparticipation in disability-related coverage(Table 2). However, as subsequently noted,we find that participation is higher amongparents in multivariate models that control forother differences, such as age and functionallimitation, between eligible parents and adultswithout dependent children (Table 3). We findlower rates of participation in limited programs
Inquiry/Volume 49, Fall 2012
236
than in comprehensive Medicaid, perhaps dueto the higher cost-sharing in limited programs(data not shown; see appendix from authorsfor more details).
Participation rates also vary across othersubgroups of the population. For example,participation is higher among older adults,women, citizens, non-Hispanics, those withless education, those not in the labor force,those with physical, mental, or cognitivelimitations, SNAP/food stamp recipients,and those in households without vehicles.Some patterns differ for parents and adultswithout dependent children. For instance,among adults without dependent children,participation is lower for proficient English
speakers, recent veterans, and those withtelephone service in the household, but thesepatterns are not found among parents. Inaddition, while participation rates are fairlysimilar for parents living in different types ofmetropolitan areas, adults without dependentchildren in the most rural areas (nonmetro-politan and not adjacent to metropolitanareas) were 5.1 percentage points more likelyto participate in Medicaid than their coun-terparts living in the most urban areas(metropolitan). For both parents and adultswithout dependent children, participationrates vary across regions. Particularly strikingregional differences occur in participationrates for parents, with a low rate of 54.1%
Table 1. Number and percentage of uninsured nonelderly (ages 19–64) adults, by Medicaideligibility and parental status, 2009
All uninsured adults Uninsured parentsUninsured adults wthout
dependent children
Number Percent Number Percent Number Percent
Total 39,402,000 100.0 11,216,000 100.0 28,187,000 100.0
Eligible for comprehensiveMedicaid coverage 4,530,000 11.5 2,465,000 22.0 2,066,000 7.3
Eligible through Section 1931pathway group 2,210,000 48.8 2,091,000 84.8 120,000 5.8
Eligible through disabilitypathway group 1,325,000 29.2 92,000 3.7 1,233,000 59.7
Eligible through 1115 waiverpathway group 896,000 19.8 244,000 9.9 652,000 31.6
Eligible through otherpathway group 99,000 2.2 37,000 1.5 62,000 3.0
Not eligible for comprehensiveMedicaid coverage 34,872,000 88.5 8,751,000 78.0 26,121,000 92.7
Eligible for neithercomprehensive Medicaidnor limited program 33,952,000 97.4 8,521,000 97.4 25,431,000 97.4
Eligible for limited program(1115 waiver) 501,000 1.4 213,000 2.4 288,000 1.1
Eligible for limited program(state-funded) 419,000 1.2 17,000 0.2 402,000 1.5
Source: Analysis of 2009 American Community Survey (ACS) data from the Integrated Public Use Microdata Series(IPUMS).Notes: Estimates reflect an adjustment for the misreporting of Medicaid and private nongroup coverage on the ACS. Parentsare defined as adults living in the same household with their child under 19. Eligibility for Medicaid is defined as eligibilityfor comprehensive Medicaid benefits based on a model developed by Victoria Lynch under a grant from the Robert WoodJohnson Foundation. The model simulates Medicaid eligibility using available information for each state on its Medicaideligibility guidelines, including income thresholds for a particular family size, the extent of income disregards, asset limits,immigration status, and other factors. Modeling Medicaid eligibility for adults based on a household survey is subject tomeasurement error due to the complexity of the rules in place that govern Medicaid eligibility for adults, gaps in theinformation that is available on income, assets, household structure, immigration status, etc., and difficulties measuringeligibility for certain pathways, such as pregnancy and disability. Eligibility pathways are hierarchical; it is possible thatindividuals in a specified pathway could also be eligible for subsequent pathways. See paper for details on order of eligibilitypathways in the simulation. Numbers have been rounded to the nearest thousands. Total estimates may not add up due torounding.
Medicaid Eligibility
237
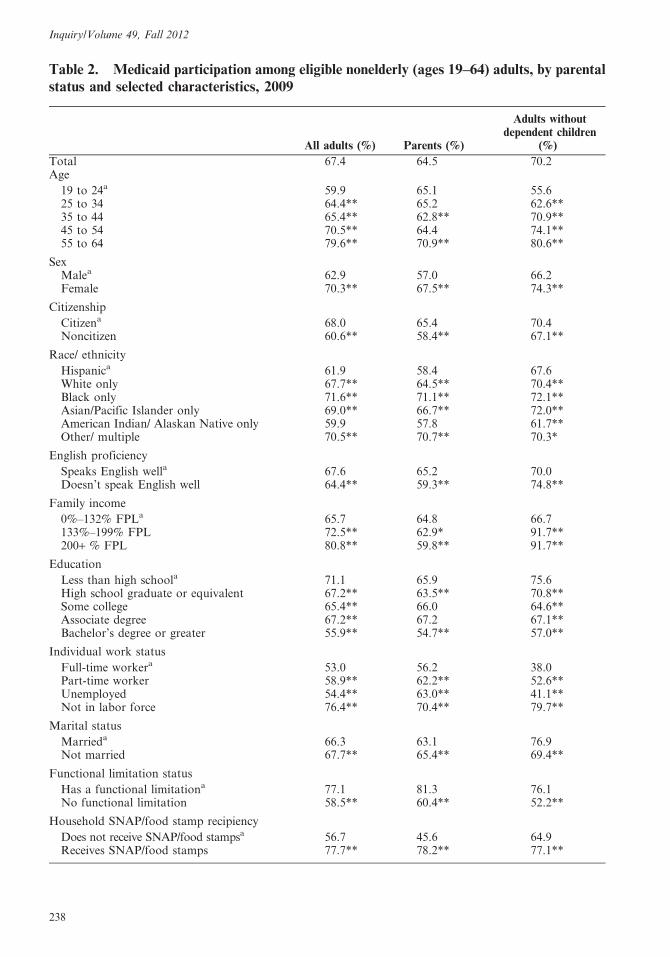
Table 2. Medicaid participation among eligible nonelderly (ages 19–64) adults, by parentalstatus and selected characteristics, 2009
All adults (%) Parents (%)
Adults withoutdependent children
(%)
Total 67.4 64.5 70.2Age
19 to 24a 59.9 65.1 55.625 to 34 64.4** 65.2 62.6**35 to 44 65.4** 62.8** 70.9**45 to 54 70.5** 64.4 74.1**55 to 64 79.6** 70.9** 80.6**
SexMalea 62.9 57.0 66.2Female 70.3** 67.5** 74.3**
Citizenship
Citizena 68.0 65.4 70.4Noncitizen 60.6** 58.4** 67.1**
Race/ ethnicity
Hispanica 61.9 58.4 67.6White only 67.7** 64.5** 70.4**Black only 71.6** 71.1** 72.1**Asian/Pacific Islander only 69.0** 66.7** 72.0**American Indian/ Alaskan Native only 59.9 57.8 61.7**Other/ multiple 70.5** 70.7** 70.3*
English proficiency
Speaks English wella 67.6 65.2 70.0Doesn’t speak English well 64.4** 59.3** 74.8**
Family income
0%–132% FPLa 65.7 64.8 66.7133%–199% FPL 72.5** 62.9* 91.7**200+ % FPL 80.8** 59.8** 91.7**
Education
Less than high schoola 71.1 65.9 75.6High school graduate or equivalent 67.2** 63.5** 70.8**Some college 65.4** 66.0 64.6**Associate degree 67.2** 67.2 67.1**Bachelor’s degree or greater 55.9** 54.7** 57.0**
Individual work status
Full-time workera 53.0 56.2 38.0Part-time worker 58.9** 62.2** 52.6**Unemployed 54.4** 63.0** 41.1**Not in labor force 76.4** 70.4** 79.7**
Marital status
Marrieda 66.3 63.1 76.9Not married 67.7** 65.4** 69.4**
Functional limitation status
Has a functional limitationa 77.1 81.3 76.1No functional limitation 58.5** 60.4** 52.2**
Household SNAP/food stamp recipiency
Does not receive SNAP/food stampsa 56.7 45.6 64.9Receives SNAP/food stamps 77.7** 78.2** 77.1**
Inquiry/Volume 49, Fall 2012
238
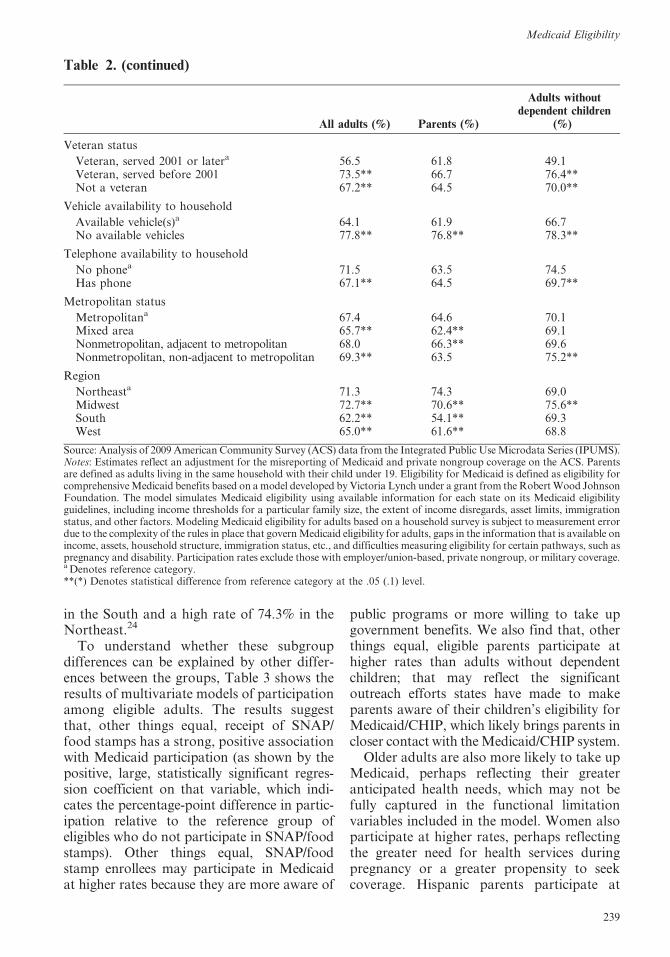
in the South and a high rate of 74.3% in theNortheast.24
To understand whether these subgroupdifferences can be explained by other differ-ences between the groups, Table 3 shows theresults of multivariate models of participationamong eligible adults. The results suggestthat, other things equal, receipt of SNAP/food stamps has a strong, positive associationwith Medicaid participation (as shown by thepositive, large, statistically significant regres-sion coefficient on that variable, which indi-cates the percentage-point difference in partic-ipation relative to the reference group ofeligibles who do not participate in SNAP/foodstamps). Other things equal, SNAP/foodstamp enrollees may participate in Medicaidat higher rates because they are more aware of
public programs or more willing to take upgovernment benefits. We also find that, otherthings equal, eligible parents participate athigher rates than adults without dependentchildren; that may reflect the significantoutreach efforts states have made to makeparents aware of their children’s eligibility forMedicaid/CHIP, which likely brings parents incloser contact with the Medicaid/CHIP system.
Older adults are also more likely to take upMedicaid, perhaps reflecting their greateranticipated health needs, which may not befully captured in the functional limitationvariables included in the model. Women alsoparticipate at higher rates, perhaps reflectingthe greater need for health services duringpregnancy or a greater propensity to seekcoverage. Hispanic parents participate at
Table 2. (continued)
All adults (%) Parents (%)
Adults withoutdependent children
(%)
Veteran status
Veteran, served 2001 or latera 56.5 61.8 49.1Veteran, served before 2001 73.5** 66.7 76.4**Not a veteran 67.2** 64.5 70.0**
Vehicle availability to household
Available vehicle(s)a 64.1 61.9 66.7No available vehicles 77.8** 76.8** 78.3**
Telephone availability to household
No phonea 71.5 63.5 74.5Has phone 67.1** 64.5 69.7**
Metropolitan status
Metropolitana 67.4 64.6 70.1Mixed area 65.7** 62.4** 69.1Nonmetropolitan, adjacent to metropolitan 68.0 66.3** 69.6Nonmetropolitan, non-adjacent to metropolitan 69.3** 63.5 75.2**
Region
Northeasta 71.3 74.3 69.0Midwest 72.7** 70.6** 75.6**South 62.2** 54.1** 69.3West 65.0** 61.6** 68.8
Source: Analysis of 2009 American Community Survey (ACS) data from the Integrated Public Use Microdata Series (IPUMS).Notes: Estimates reflect an adjustment for the misreporting of Medicaid and private nongroup coverage on the ACS. Parentsare defined as adults living in the same household with their child under 19. Eligibility for Medicaid is defined as eligibility forcomprehensive Medicaid benefits based on a model developed by Victoria Lynch under a grant from the Robert Wood JohnsonFoundation. The model simulates Medicaid eligibility using available information for each state on its Medicaid eligibilityguidelines, including income thresholds for a particular family size, the extent of income disregards, asset limits, immigrationstatus, and other factors. Modeling Medicaid eligibility for adults based on a household survey is subject to measurement errordue to the complexity of the rules in place that govern Medicaid eligibility for adults, gaps in the information that is available onincome, assets, household structure, immigration status, etc., and difficulties measuring eligibility for certain pathways, such aspregnancy and disability. Participation rates exclude those with employer/union-based, private nongroup, or military coverage.a Denotes reference category.**(*) Denotes statistical difference from reference category at the .05 (.1) level.
Medicaid Eligibility
239
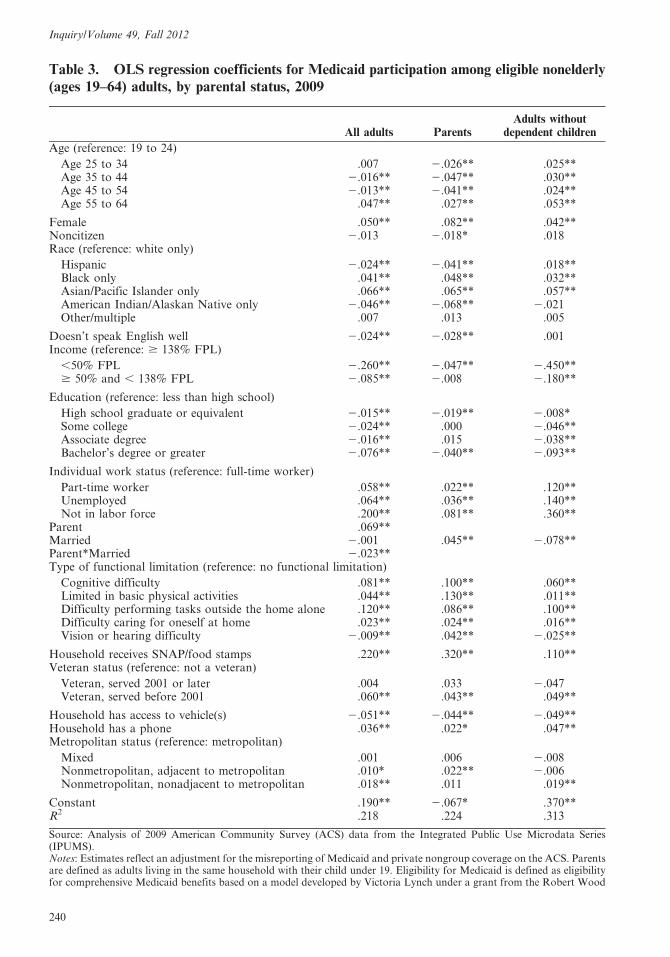
Table 3. OLS regression coefficients for Medicaid participation among eligible nonelderly(ages 19–64) adults, by parental status, 2009
All adults ParentsAdults without
dependent children
Age (reference: 19 to 24)
Age 25 to 34 .007 2.026** .025**Age 35 to 44 2.016** 2.047** .030**Age 45 to 54 2.013** 2.041** .024**Age 55 to 64 .047** .027** .053**
Female .050** .082** .042**Noncitizen 2.013 2.018* .018Race (reference: white only)
Hispanic 2.024** 2.041** .018**Black only .041** .048** .032**Asian/Pacific Islander only .066** .065** .057**American Indian/Alaskan Native only 2.046** 2.068** 2.021Other/multiple .007 .013 .005
Doesn’t speak English well 2.024** 2.028** .001Income (reference: $ 138% FPL)
,50% FPL 2.260** 2.047** 2.450**$ 50% and , 138% FPL 2.085** 2.008 2.180**
Education (reference: less than high school)
High school graduate or equivalent 2.015** 2.019** 2.008*Some college 2.024** .000 2.046**Associate degree 2.016** .015 2.038**Bachelor’s degree or greater 2.076** 2.040** 2.093**
Individual work status (reference: full-time worker)
Part-time worker .058** .022** .120**Unemployed .064** .036** .140**Not in labor force .200** .081** .360**
Parent .069**Married 2.001 .045** 2.078**Parent*Married 2.023**Type of functional limitation (reference: no functional limitation)
Cognitive difficulty .081** .100** .060**Limited in basic physical activities .044** .130** .011**Difficulty performing tasks outside the home alone .120** .086** .100**Difficulty caring for oneself at home .023** .024** .016**Vision or hearing difficulty 2.009** .042** 2.025**
Household receives SNAP/food stamps .220** .320** .110**Veteran status (reference: not a veteran)
Veteran, served 2001 or later .004 .033 2.047Veteran, served before 2001 .060** .043** .049**
Household has access to vehicle(s) 2.051** 2.044** 2.049**Household has a phone .036** .022* .047**Metropolitan status (reference: metropolitan)
Mixed .001 .006 2.008Nonmetropolitan, adjacent to metropolitan .010* .022** 2.006Nonmetropolitan, nonadjacent to metropolitan .018** .011 .019**
Constant .190** 2.067* .370**R2 .218 .224 .313
Source: Analysis of 2009 American Community Survey (ACS) data from the Integrated Public Use Microdata Series(IPUMS).Notes: Estimates reflect an adjustment for the misreporting of Medicaid and private nongroup coverage on the ACS. Parentsare defined as adults living in the same household with their child under 19. Eligibility for Medicaid is defined as eligibilityfor comprehensive Medicaid benefits based on a model developed by Victoria Lynch under a grant from the Robert Wood
Inquiry/Volume 49, Fall 2012
240

lower rates than non-Hispanic white parents,even after controlling for citizenship statusand English language skills, while African-American adults participate at higher rates,regardless of parental status.25 Among par-ents, not being a citizen and the inability tospeak English well are both associated withlower Medicaid participation, possibly indi-cating problems such adults have navigatingenrollment systems or lack of knowledge ofthe program. Being married is associated withgreater likelihood of participating amongparents, but lower likelihood among adultswithout dependent children, though it is notclear why the direction of the effect differsacross the two groups.
Most of the functional limitation measureswe can examine—experiencing cognitive dif-ficulties, trouble performing tasks outside thehome, physical limitations, or difficulty car-ing for oneself, all of which suggest aheightened need for health care—are associ-ated with higher participation. However,experiencing vision or hearing difficulties isassociated with a slightly lower Medicaidparticipation rate among adults withoutdependent children. Eligible adults in verylow-income families, particularly those with-out dependent children and with incomesbelow 50% of the FPL, are less likely toparticipate, all else being equal, but beingdisconnected from the labor force is associ-ated with higher participation. Being aveteran who served before 2001 is associatedwith higher participation, but recent veteransare not more likely to participate thannonveterans. Having telephone service in thehousehold is also associated with higher ratesof participation, but having access to avehicle has the opposite relationship.26
The share of uninsured adults who areeligible for comprehensive Medicaid coveragevaries across states, from below 7.0% in five
states (New Hampshire, Oregon, Texas,Virginia, and Wyoming) to above 29.0% infour states (Arizona, Delaware, New York,and Vermont) (Table 4). Low rates ofeligibility among uninsured adults can reflecta variety of different circumstances, such asrestrictive eligibility policies under which fewlow-income adults qualify for coverage;broad Medicaid eligibility policies, combinedwith high participation; or a relatively high-income uninsured population in the state dueto high per capita income levels. Eligibilityamong the uninsured is much higher whenincluding limited programs: in Connecticut,the District of Columbia, Hawaii, Iowa,Maine, Massachusetts, Minnesota, and Ver-mont, the combined eligibility rates for bothcomprehensive and limited coverage arehigher than 44.3%, the highest state rate ofeligibility for only comprehensive coverage(data not shown; see appendix). Eligibility ishigher among uninsured parents than foradults without dependent children in everystate, with the share of uninsured parentseligible for Medicaid ranging from 9.6% inTexas to 61.7% in Maine; the share foruninsured adults without dependent childrenis below 10% in every state but four (Arizona,Delaware, New York, and Vermont, all ofwhich have expansive Section 1115 waiverprograms providing comprehensive coveragefor adults without dependent children).
Medicaid participation rates also varyacross states (Table 5). Participation ratesfor adults range from above 90% in Massa-chusetts and the District of Columbia tobelow 55% in Montana and Nevada.27,28
While participation rates in many states areclustered around the national average—26states have a participation rate that is withinfive percentage points of the national aver-age—four states ( Hawaii, Maine, Massachu-setts, and Rhode Island) and the District of
Johnson Foundation. The model simulates Medicaid eligibility using available information for each state on its Medicaideligibility guidelines, including income thresholds for a particular family size, the extent of income disregards, asset limits,immigration status, and other factors. Modeling Medicaid eligibility for adults based on a household survey is subject tomeasurement error due to the complexity of the rules in place that govern Medicaid eligibility for adults, gaps in theinformation that is available on income, assets, household structure, immigration status, etc., and difficulties measuringeligibility for certain pathways, such as pregnancy and disability. Participation rates exclude those with employer/union-based, private nongroup, or military coverage. Models also include state dummy indicators. ** (*) indicates statisticaldifference from zero at the .05 (.1) level.
Table 3. (continued)
Medicaid Eligibility
241
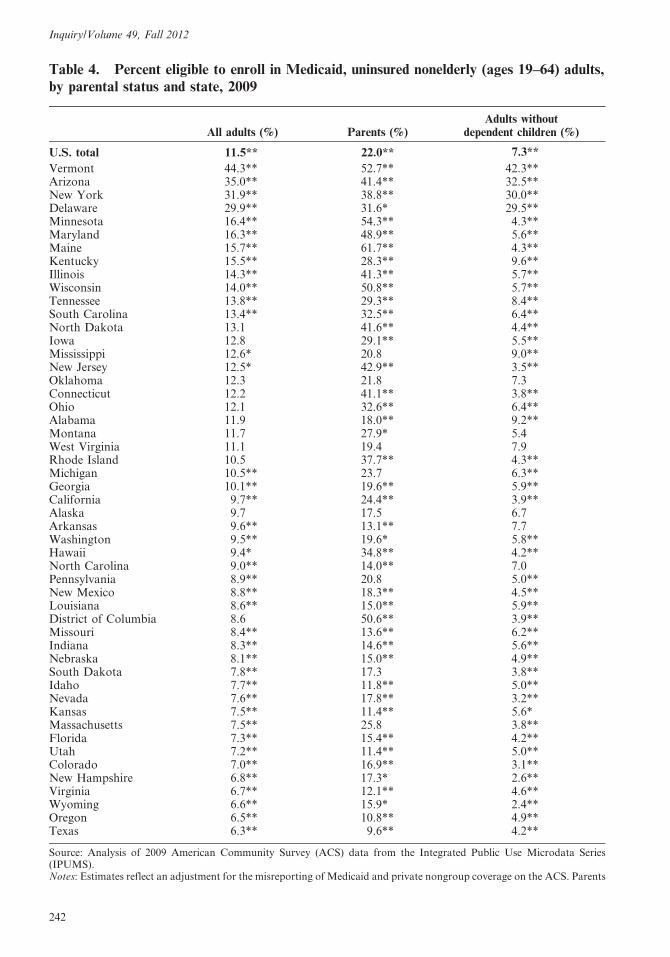
Table 4. Percent eligible to enroll in Medicaid, uninsured nonelderly (ages 19–64) adults,by parental status and state, 2009
All adults (%) Parents (%)Adults without
dependent children (%)
U.S. total 11.5** 22.0** 7.3**
Vermont 44.3** 52.7** 42.3**Arizona 35.0** 41.4** 32.5**New York 31.9** 38.8** 30.0**Delaware 29.9** 31.6* 29.5**Minnesota 16.4** 54.3** 4.3**Maryland 16.3** 48.9** 5.6**Maine 15.7** 61.7** 4.3**Kentucky 15.5** 28.3** 9.6**Illinois 14.3** 41.3** 5.7**Wisconsin 14.0** 50.8** 5.7**Tennessee 13.8** 29.3** 8.4**South Carolina 13.4** 32.5** 6.4**North Dakota 13.1 41.6** 4.4**Iowa 12.8 29.1** 5.5**Mississippi 12.6* 20.8 9.0**New Jersey 12.5* 42.9** 3.5**Oklahoma 12.3 21.8 7.3Connecticut 12.2 41.1** 3.8**Ohio 12.1 32.6** 6.4**Alabama 11.9 18.0** 9.2**Montana 11.7 27.9* 5.4West Virginia 11.1 19.4 7.9Rhode Island 10.5 37.7** 4.3**Michigan 10.5** 23.7 6.3**Georgia 10.1** 19.6** 5.9**California 9.7** 24.4** 3.9**Alaska 9.7 17.5 6.7Arkansas 9.6** 13.1** 7.7Washington 9.5** 19.6* 5.8**Hawaii 9.4* 34.8** 4.2**North Carolina 9.0** 14.0** 7.0Pennsylvania 8.9** 20.8 5.0**New Mexico 8.8** 18.3** 4.5**Louisiana 8.6** 15.0** 5.9**District of Columbia 8.6 50.6** 3.9**Missouri 8.4** 13.6** 6.2**Indiana 8.3** 14.6** 5.6**Nebraska 8.1** 15.0** 4.9**South Dakota 7.8** 17.3 3.8**Idaho 7.7** 11.8** 5.0**Nevada 7.6** 17.8** 3.2**Kansas 7.5** 11.4** 5.6*Massachusetts 7.5** 25.8 3.8**Florida 7.3** 15.4** 4.2**Utah 7.2** 11.4** 5.0**Colorado 7.0** 16.9** 3.1**New Hampshire 6.8** 17.3* 2.6**Virginia 6.7** 12.1** 4.6**Wyoming 6.6** 15.9* 2.4**Oregon 6.5** 10.8** 4.9**Texas 6.3** 9.6** 4.2**
Source: Analysis of 2009 American Community Survey (ACS) data from the Integrated Public Use Microdata Series(IPUMS).Notes: Estimates reflect an adjustment for the misreporting of Medicaid and private nongroup coverage on the ACS. Parents
Inquiry/Volume 49, Fall 2012
242

Columbia have rates that are higher than80% and eight states have rates that are 60%or below (Alaska, Arizona, Georgia, Idaho,Montana, Nevada, Oklahoma, and Texas).States that have relatively low participationamong eligible parents at all income levelsalso tend to have low participation ratesamong eligible adults at the lowest povertylevels (data not shown).
While some of the state variation can beexplained by differences in population char-acteristics across states, we still see substan-tial differences in participation across stateswhen controlling for the characteristics of theeligible population using the regression modelpresented in Table 3. The range between thehighest and the lowest state participationrates remains large, but narrows from ap-proximately 42 percentage points to approx-imately 34 percentage points when control-ling for these characteristics. Moreover, nineof the 10 states with the highest unadjustedparticipation rates remain in the top 10, evenafter accounting for demographic, health,and socioeconomic differences in the compo-sition of the eligible population in differentstates; likewise, seven of the 10 states in thelowest quintile and four of the five states withthe very lowest unadjusted participation ratesremain in the bottom 10 and five, respective-ly. In addition, the correlation coefficientbetween the adjusted and the unadjustedstate-level differences is .90. This suggeststhat differences in the observed characteristicsof eligible adults across states account foronly a relatively small part of the state-levelvariation in participation. However, in somestates, there is inconsistency between theunadjusted and the adjusted differences;Vermont, for instance, has the 27th highestunadjusted participation rate at 66.8%, but
when accounting for population differencesacross states, it moves into the top 10.
When imputed eligibles (i.e., Medicaidenrollees who fall into particular Medicaidcategorically eligible groups and whose in-comes are near, but not below, the thresh-olds) are included in our participation esti-mates, the range narrows across states, bothfor our unadjusted and regression-adjustedestimates (data available from the authors).Greater increases in participation occuramong states near the bottom of the distri-bution, but most of the states in the top andbottom 10 remain the same in terms of theunadjusted and adjusted participation raterankings when we include imputed eligibles.For unadjusted estimates, Minnesota movesout of the top 10 when we include imputedeligibles, and is replaced by Wisconsin, andFlorida, Idaho, and North Dakota move outof the bottom 10, and are replaced byMaryland, New York, and South Carolina(data not shown).
We also compared our participation esti-mates for adults to those for children toexamine how states’ success in enrolling thesetwo groups differs. The results show thatparticipation is consistently lower for non-elderly adults than for children. Our estimateof Medicaid participation among nonelderlyadults is 17 percentage points lower than therate for children. While we see a pattern oflower participation for adults than forchildren in each state with the differentialexceeding 20 percentage points in 19 states,the gap differs widely across states, rangingfrom 28.1 percentage points in Arkansas(92.6% participation rate for children and64.6% for adults) to just 2.9 percentage pointsin Massachusetts (95.7% participation ratefor children and 92.9% for adults).
are defined as adults living in the same household with their child under 19. Eligibility for Medicaid is defined as eligibilityfor comprehensive Medicaid benefits based on a model developed by Victoria Lynch under a grant from the Robert WoodJohnson Foundation. The model simulates Medicaid eligibility using available information for each state on its Medicaideligibility guidelines, including income thresholds for a particular family size, the extent of income disregards, asset limits,immigration status, and other factors. Modeling Medicaid eligibility for adults based on a household survey is subject tomeasurement error due to the complexity of the rules in place that govern Medicaid eligibility for adults, gaps in theinformation that is available on income, assets, household structure, immigration status, etc., and difficulties measuringeligibility for certain pathways, such as pregnancy and disability. **(*) indicates estimate is statistically different fromnational estimate at the .05 (.1) level.
Table 4. (continued)
Medicaid Eligibility
243

Table
5.
Med
icaid
part
icip
ati
on
am
ong
elig
ible
nonel
der
ly(a
ges
19–64)
adult
sand
chil
dre
n(b
irth
-age
18),
by
state
,2009
Ad
ult
sC
hil
dre
n
Ra
te(%
)R
an
kD
iffe
ren
cefr
om
rest
of
na
tio
n(p
erce
nta
ge
po
int)
Ad
just
edd
iffe
ren
ce(p
erce
nta
ge
po
int)
aA
dju
sted
ran
ka
Ra
te(%
)D
iffe
ren
cefr
om
ad
ult
s(p
erce
nta
ge
po
int)
U.S
.to
tal
67
.4--
---
----
---
---
----
-8
4.3
17
.0*
*
Ma
ssa
chu
sett
s9
2.9
12
6.0
**
19
.3*
*#
#1
95
.72
.9*
*D
istr
ict
of
Co
lum
bia
92
.12
24
.8*
*1
7.5
**
##
39
7.3
5.2
**
Ha
wa
ii8
6.5
31
9.2
**
19
.1*
*2
91
.44
.9*
*M
ain
e8
3.6
41
6.3
**
12
.3*
*#
#5
91
.17
.5*
*R
ho
de
Isla
nd
81
.65
14
.3*
*1
0.5
**
##
69
0.7
9.0
**
Wis
con
sin
79
.46
12
.3*
*1
2.9
**
48
8.2
8.8
**
Pen
nsy
lva
nia
79
.37
12
.3*
*5
.4*
*#
#1
08
8.1
8.8
**
Co
nn
ecti
cut
76
.68
9.3
**
10
.2*
*7
89
.81
3.2
**
Min
nes
ota
74
.89
7.6
**
7.9
**
87
9.9
5.0
**
Mic
hig
an
74
.71
07
.6*
*3
.2*
*#
#1
59
1.5
16
.8*
*O
hio
74
.11
17
.0*
*2
.6*
*#
#1
68
6.0
12
.0*
*W
est
Vir
gin
ia7
2.5
12
5.2
**
20
.4#
#2
29
0.2
17
.7*
*N
ewH
am
psh
ire
72
.41
35
.11
.9#
19
86
.51
4.1
**
Mis
sou
ri7
1.7
14
4.4
**
23
.5*
*#
#3
48
4.0
12
.3*
*Io
wa
70
.91
53
.50
.8#
#2
18
6.7
15
.8*
*V
irg
inia
69
.81
62
.5*
21
.5#
#2
78
3.3
13
.5*
*W
ash
ing
ton
69
.71
72
.42
2.1
##
30
85
.31
5.6
**
Illi
no
is6
9.7
18
2.4
**
1.9
**
18
90
.92
1.2
**
Neb
rask
a6
8.7
19
1.4
21
.9#
29
89
.92
1.1
**
Ind
ian
a6
8.6
20
1.3
21
.1#
#2
47
9.8
11
.1*
*C
ali
forn
ia6
8.5
21
1.2
**
5.2
**
##
11
83
.91
5.4
**
So
uth
Da
ko
ta6
7.5
22
0.2
4.0
13
84
.31
6.8
**
No
rth
Ca
roli
na
67
.32
32
0.1
21
.9*
##
28
87
.01
9.7
**
New
Mex
ico
67
.32
42
0.1
2.2
17
85
.21
7.9
**
Ten
nes
see
67
.12
52
0.3
23
.1*
*#
#3
38
9.9
22
.8*
*N
ewJe
rsey
67
.02
62
0.3
1.0
##
20
83
.91
6.9
**
Ver
mo
nt
66
.82
72
0.5
5.5
**
##
99
2.4
25
.5*
*K
an
sas
66
.02
82
1.4
25
.4*
*#
#3
58
2.0
16
.1*
*N
ewY
ork
65
.52
92
2.1
**
3.6
**
##
14
90
.62
5.0
**
Ore
go
n6
5.0
30
22
.42
6.5
**
##
39
81
.21
6.2
**
Lo
uis
ian
a6
4.7
31
22
.72
8.9
**
##
46
89
.32
4.6
**
Del
aw
are
64
.63
22
2.8
5.0
**
##
12
90
.92
6.3
**
Ark
an
sas
64
.63
32
2.8
26
.9*
*#
#4
09
2.6
28
.1*
*
Inquiry/Volume 49, Fall 2012
244

Table
5.
(conti
nued
)
Ad
ult
sC
hil
dre
n
Ra
te(%
)R
an
kD
iffe
ren
cefr
om
rest
of
na
tio
n(p
erce
nta
ge
po
int)
Ad
just
edd
iffe
ren
ce(p
erce
nta
ge
po
int)
aA
dju
sted
ran
ka
Ra
te(%
)D
iffe
ren
cefr
om
ad
ult
s(p
erce
nta
ge
po
int)
Wy
om
ing
64
.23
42
3.2
20
.62
38
2.7
18
.5*
*K
entu
cky
64
.23
52
3.2
**
27
.3*
*#
#4
18
9.7
25
.5*
*M
issi
ssip
pi
63
.93
62
3.5
**
25
.8*
*#
#3
68
4.4
20
.5*
*C
olo
rad
o6
3.8
37
23
.6*
21
.3#
#2
58
0.3
16
.4*
*U
tah
63
.63
82
3.8
21
.3#
#2
67
5.5
11
.9*
*A
lab
am
a6
3.4
39
24
.0*
*2
8.9
**
##
45
89
.12
5.7
**
So
uth
Ca
roli
na
62
.14
02
5.4
**
26
.0*
*3
78
3.3
21
.2*
*M
ary
lan
d6
1.2
41
26
.3*
*2
7.3
**
##
42
88
.82
7.6
**
No
rth
Da
ko
ta6
1.1
42
26
.32
2.2
32
74
.61
3.6
**
Flo
rid
a6
0.6
43
27
.1*
*2
6.4
**
38
76
.31
5.7
**
Ala
ska
60
.04
42
7.4
*2
7.7
**
44
78
.31
8.3
**
Ida
ho
59
.04
52
8.4
**
27
.6*
*4
38
3.5
24
.5*
*O
kla
ho
ma
55
.94
62
11
.6*
*2
14
.6*
*#
#5
18
3.2
27
.3*
*A
rizo
na
55
.84
72
12
.2*
*2
2.1
**
##
31
81
.82
6.0
**
Tex
as
55
.84
82
12
.1*
*2
14
.1*
*#
#5
07
5.9
20
.1*
*G
eorg
ia5
5.1
49
21
2.5
**
21
2.3
**
48
82
.02
6.8
**
Mo
nta
na
53
.75
02
13
.7*
*2
11
.3*
*4
77
5.8
22
.1*
*N
eva
da
51
.15
12
16
.3*
*2
13
.8*
*#
#4
96
1.9
10
.8*
*
So
urc
e:A
naly
sis
of
20
09
Am
eric
an
Co
mm
un
ity
Su
rvey
(AC
S)
da
tafr
om
the
Inte
gra
ted
Pu
bli
cU
seM
icro
da
taS
erie
s(I
PU
MS
).N
ote
s:E
stim
ate
sre
flec
ta
na
dju
stm
ent
for
the
mis
rep
ort
ing
of
Med
ica
ida
nd
pri
va
ten
on
gro
up
cov
era
ge
on
the
AC
S.
Pa
ren
tsa
red
efin
eda
sa
du
lts
liv
ing
inth
esa
me
ho
use
ho
ldw
ith
thei
rch
ild
un
der
19.
Eli
gib
ilit
yfo
rM
edic
aid
isd
efin
eda
sel
igib
ilit
yfo
rco
mp
reh
ensi
ve
Med
icaid
ben
efit
sb
ase
do
na
mo
del
dev
elo
ped
by
Vic
tori
aL
yn
chu
nd
era
gra
nt
fro
mth
eR
ob
ert
Wo
od
Joh
nso
nF
ou
nd
ati
on
.T
he
mo
del
sim
ula
tes
Med
icaid
elig
ibil
ity
usi
ng
avail
ab
lein
form
ati
on
for
each
state
on
its
Med
icaid
elig
ibil
ity
gu
idel
ines
,in
clu
din
gin
com
eth
resh
old
sfo
ra
part
icu
lar
fam
ily
size
,th
eex
ten
to
fin
com
ed
isre
gard
s,ass
etli
mit
s,im
mig
rati
on
statu
s,an
do
ther
fact
ors
.M
od
elin
gM
edic
aid
elig
ibil
ity
for
ad
ult
sb
ase
do
na
ho
use
ho
ldsu
rvey
issu
bje
ctto
mea
sure
men
ter
ror
du
eto
the
com
ple
xit
yo
fth
eru
les
inp
lace
that
go
ver
nM
edic
aid
elig
ibil
ity
for
ad
ult
s,gap
sin
the
info
rmati
on
that
isavail
ab
leo
nin
com
e,a
sset
s,h
ou
seh
old
stru
ctu
re,
imm
igra
tio
nst
atu
s,et
c.,
an
dd
iffi
cult
ies
mea
suri
ng
elig
ibil
ity
for
cert
ain
pa
thw
ays,
such
as
pre
gn
an
cya
nd
dis
ab
ilit
y.
Part
icip
ati
on
rate
sex
clu
de
tho
sew
ith
emp
loyer
/un
ion
-b
ase
d,
pri
vate
no
ngro
up
,o
rm
ilit
ary
cover
age.
aIn
dic
ate
sth
at
the
dif
fere
nce
bet
wee
nth
est
ate
an
dth
ere
sto
fth
en
ati
on
con
tro
lsfo
rd
iffe
ren
ces
inth
eso
cio
eco
no
mic
an
dd
emo
gra
ph
icch
ara
cter
isti
cso
fth
eel
igib
lep
op
ula
tio
n.
See
Tab
le3
for
ali
sto
fvari
ab
les
incl
ud
edin
the
regre
ssio
nm
od
el.
**
(*)
ind
icate
sst
ati
stic
al
dif
fere
nce
fro
mze
roa
tth
e.0
5(.
1)
lev
el.
##
(#)
ind
icate
sad
just
edd
iffe
ren
ceis
stati
stic
all
yd
iffe
ren
tfr
om
un
ad
just
edd
iffe
ren
ceat
the
0.0
5(0
.1)
level
.
Medicaid Eligibility
245

A number of states have either high orlow participation rates for both adults andchildren. At one extreme, Massachusetts, theDistrict of Columbia, Hawaii, Maine andRhode Island rank among the top five statesin terms of enrolling eligible adults and allhave participation rates for children above90%, putting them in the top quintile in termsof enrolling eligible children. At the otherextreme, Alaska, Florida, Montana, Nevada,North Dakota, and Texas all fall into thebottom quintile in both categories. Overall,we find a positive, fairly strong correlationbetween the state-level participation ratesfor adults and children (with an estimatedcorrelation coefficient of .68).29
There are several states that do relativelywell enrolling eligible children but do rela-tively poorly enrolling eligible adults. Arkan-sas, which has the third highest participationrate among children, at 92.6%, has only the33rd highest participation rate for adults(64.6%). Other states, such as Alabama,Delaware, Kentucky, Louisiana, Maryland,New York, and Tennessee, have participationrates for children near or above 90%, buthave participation rates for adults that are ator below the national average of 67.4%.
Discussion
While most states currently are quite success-ful at enrolling eligible children in Medicaid/CHIP, these results suggest that enrollingeligible adults remains a challenge in manystates. Current patterns of participation incomprehensive Medicaid programs, prior toimplementation of the ACA, indicate thatabout two-thirds of eligible adults are partic-ipating. Nationally, Medicaid participationrates are 17 percentage points lower amongeligible adults than among eligible children,with a pattern of lower participation amongadults in each state, and a gap that exceeds 20percentage points in 19 states. These resultsindicate that in order to achieve substantialcoverage gains among poor adults under theACA, most states will need to reach higherparticipation in Medicaid among those whoare newly eligible relative to current levels.
Differences between adult and child eligi-bility, outreach, and enrollment policies may
contribute to the pattern of lower Medicaidparticipation rates among adults. In additionto having more complicated eligibility rulesfor adults, states have made fewer policychanges to simplify enrollment and renewalprocedures for parents than for children: forinstance, half of the states have asset limitsfor parents compared with only five programsfor children, and more states request incomedocumentation or interviews for applicationor renewal for parents than for children(Heberlein et al. 2011, Heberlein, Brooks,et al. 2012). The ACA includes a numberof provisions that are expected to increaseparticipation in Medicaid among adults, suchas the simplification of Medicaid eligibilityrules for adults and the elimination of assettests, the creation of health insurance ex-changes, funding for new outreach efforts,and an individual mandate. However, toachieve dramatic increases in participationamong adults may require additional changesto Medicaid enrollment procedures and newincentives to states. For instance, while statescan provide 12-month continuous eligibilityto children (requiring that coverage berenewed only once a year regardless ofchanges in income), they will not be able toprovide this option for adults without awaiver under the ACA (Kaiser Commissionon Medicaid and the Uninsured 2010b).Furthermore, since CHIP’s reauthorization,states that adopt certain enrollment andretention procedures for children and meetMedicaid enrollment targets have beenawarded bonus payments (U.S. Departmentof Health and Human Services 2011); it ispossible that similar efforts focused on adults’enrollment in Medicaid could prove fruitful.
While many more uninsured adults couldbecome eligible for Medicaid under ACAimplementation, states are in a position nowto reduce the number of uninsured individu-als by enrolling those who are already eligiblefor coverage. Despite relatively low rates ofeligibility for public coverage among adults,in 2009 up to 4.5 million uninsured adultswere eligible for comprehensive Medicaidcoverage but not enrolled. In that same year,an estimated 4.3 million children were alsoeligible for Medicaid or CHIP coverage butnot enrolled (Kenney et al. 2011). Thus, by
Inquiry/Volume 49, Fall 2012
246
increasing participation among already eligi-ble adults and children, states could decreasethe number of uninsured nationwide by up to8.8 million (or even more given the additional.9 million uninsured adults who are eligiblefor more limited federally funded Medicaid orstate-funded coverage). Targeted outreachand enrollment strategies may be needed tobe effective. For both adults and children,participation varies across subgroups of thepopulation; for instance, eligible Hispanicsand noncitizens have lower rates of partici-pation in both populations, suggesting apayoff to enrollment efforts that target thesecommunities. In addition, we find lowerparticipation among adults who are younger,do not have a functional limitation, or are inhouseholds that are not receiving SNAP/foodstamps, which could indicate difficulty reach-ing these populations under the ACA. Otherresearch shows that adults who could becomenewly Medicaid-eligible under the ACA start-ing in 2014 will be a diverse group, spanningdifferent age and racial/ethnic groups andincluding both parents and adults withoutdependent children (Kenney et al. 2012); thistoo may call for the adoption of a variety ofenrollment strategies.
The current variation across states in Med-icaid participation rates among adults isstriking—over 40 percentage points from thelowest to the highest rate—and much greaterthan that among children. Participation ratesfor comprehensive Medicaid coverage amongadults vary from 51.1% in Nevada andbetween 53.7% and 55.9% in Arizona, Geor-gia, Montana, Oklahoma, and Texas to86.5%, 92.1%, and 92.9% in Hawaii, theDistrict of Columbia, and Massachusetts,respectively. Large state-level differences inMedicaid participation are found amongadults even when controlling for differencesin the characteristics of the adults who areeligible in each state. Thus, other differencesbetween states, such as outreach and enroll-ment procedures, eligibility thresholds, publicperceptions of government programs, rates ofemployer-sponsored coverage, and other fac-tors may contribute to the observed variationacross states in participation levels.
State variation in Medicaid participationrates suggests that Medicaid take-up and
enrollment among states implementing theMedicaid expansion under the ACA coulddiffer widely. Nationwide, the implementationof the Medicaid expansion under the ACA hasthe potential to greatly reduce cross-statevariation in uninsurance rates (Buettgens,Holahan, and Carroll 2011). However, theextent to which the ACA narrows coveragegaps across states will be dependent on states’execution of the expansion (Sommers, Swartz,and Epstein 2011). The ACA has the potentialto raise eligibility levels for parents in moststates, bringing them closer to those forchildren. As eligibility for parents expands, itshould be possible to achieve participationrates for parents similar to those for childrensince many uninsured parents have childrenwho are already covered by Medicaid/CHIP(Heberlein, Huntress, et al. 2012).
The ACA has the potential, in particular,to reduce uninsurance rates among nondis-abled, nonpregnant adults without depen-dent children, most of whom are not eligiblefor any sort of public health insurancecoverage under current law, no matter howlow their income level. While newly eligibleadults without dependent children are un-likely to have other family members who arealready enrolled in public health insuranceprograms, it may be possible to reach someof these newly eligible through the SNAP/food stamps program (Eslami, Filion, andStrayer 2011).
As this analysis shows, there is dramaticvariation in participation among eligibleadults across states under current law, whichis not fully explained by differences in thecharacteristics of eligible adults. It is likelythat much could be learned by examining thestates that are doing well at enrolling eligibleadults to identify strategies that are mosteffective at promoting enrollment and reten-tion in Medicaid.
Dramatic declines in uninsurance under theACA will hinge on successful enrollment ofMedicaid eligibles (Holahan and Headen2011). If Medicaid participation rates remainat current levels, the projected gains incoverage for poor adults under the ACAmay be overstated and substantial cross-statevariation in uninsured rates is likely to persist.Features in the ACA, such as increased use of
Medicaid Eligibility
247

presumptive eligibility determinations; re-quirements for consumer-friendly, coordinat-ed enrollment systems; less need for paperdocumentation; and other methods of simpli-fying enrollment should increase participationrates and make enrollment processes moreconsistent across states (Morrow and Paradise2010). While these factors, combined with thecoverage mandate under the ACA, shouldhave a positive effect on participation, the dualchallenges of reaching previously eligible andnewly eligible adults may require that statesand the federal government implement addi-tional policy changes as well.
As described earlier, limitations are inherentin simulation studies, and ours is no exception;correctly determining eligibility among non-elderly adults is particularly difficult due to the
many pathways to eligibility, the dependencyof eligibility on a range of characteristics thatare not measured well (or at all) in survey data,and the vast differences in rules across statesunder current law. It should be noted that theseissues will also introduce measurement error inestimates of the number of individuals who arebeing made newly eligible for Medicaid underthe ACA. However, despite these measurementissues, our basic findings—that Medicaid eligi-bility and participation for adults are both lowand vary considerably across states and acrosssubgroups—hold up under the alternativemethodological approaches we pursued. WhileMedicaid eligibility will likely broaden andchange under the ACA, it will remain impor-tant to monitor state and subgroup differencesin participation over time.
Notes
This research and the Urban Institute HealthPolicy Center’s American Community Survey(ACS) Medicaid/CHIP Eligibility SimulationModel were developed under a grant from theRobert Wood Johnson Foundation. The opin-ions and conclusions expressed in this article arethose of the authors and do not necessarilyrepresent the views of the funder, The UrbanInstitute, or its sponsors or trustees. Theauthors appreciate the helpful suggestions andcomments of Lisa Dubay, John Holahan, andAlan Monheit as well as two anonymousreviewers. We also thank Samantha Artiga,Martha Heberlein, and Sharon Long for theirhelpful advice on Medicaid eligibility rules;Julie Hudson and Tom Selden for sharing theirinsights on Medicaid/CHIP simulation issues;Cheryl Camillo and Esther Regan for sharingtheir knowledge of how family members aregrouped for Medicaid/CHIP eligibility determi-nation; Jeff Passel for providing advice onmodeling documentation status; and DeanResnick for modeling documentation statusand providing other technical assistance.
1 For adults, we refer to public coverage as‘‘Medicaid’’ although the American CommunitySurvey (ACS) estimate likely includes someadults who have non-Medicaid coveragethrough state and local programs or restricted-benefit programs, as well as a small number ofenrollees in the Children’s Health InsuranceProgram (CHIP). (See Parisi, L. 2009. What’sNext for CHIP-Funded Adult Coverage? Wash-
ington, D.C.: Families USA. http://familiesusa2.org/assets/pdfs/chipra/adult-coverage.pdf.)
2 The ACA will expand Medicaid eligibility tolegal residents with incomes below 133% ofthe FPL in 2014 but a standard 5% incomedisregard will be applied, so the de factothreshold will be 138% of the FPL.
3 States that have already expanded to 100% ofthe FPL for parents and other adults willreceive an enhanced federal match that in-creases over time to the rate for the newlyeligible (Kenney et al. 2012; Holahan andHeaden 2010).
4 In this paper, we define Medicaid coverage asinsurance through joint federal-state Medicaidprograms that provide comprehensive cover-age (Heberlein et al. 2011). Some states offeradditional coverage options such as premiumassistance programs for certain groups; theseare not modeled as Medicaid coverage. Wealso examine states with limited Medicaidcoverage—such programs offer coverage thatincludes hospital stays and physician visits,but are more limited in scope than compre-hensive Medicaid due to benefit limits, highercost-sharing, or other limitations (such as theMedicaid coverage in Massachusetts that isprovided to adults without dependent childrenwith incomes under 300% of the FPL)(Heberlein et al. 2011). Appendix Table 2(available from the authors) provides detailson which programs were modeled as compre-hensive Medicaid coverage and which pro-grams were modeled as limited coverage.
Inquiry/Volume 49, Fall 2012
248
5 For instance, while Sommers and Epstein(2010) excluded noncitizens from the analysis,our approach includes noncitizens and em-ploys techniques for imputing their documen-tation status, thereby making the results moregeneralizable to the full adult population. Wealso provide estimates of eligibility and par-ticipation for all 50 states and the District ofColumbia, provide details about the types ofeligibility pathways we are able to examine,identify comprehensive vs. limited eligibility,and give alternative estimates of eligibility andparticipation to assess the robustness of thefindings.
6 On average, the ACS state public use samplesare about 14 times larger than the statesamples available from the Current PopulationSurvey Annual Social and Economic Supple-ment (CPS-ASEC), a survey frequently usedfor coverage estimates. Tennessee has thelargest difference, with the ACS sample 23times larger than the CPS-ASEC sample(Blewett 2010).
7 This includes adults living in private residencesas well as college students in dorms and a smallnumber of other adults living in group quarters,such as outpatient treatment facilities.
8 The Indian Health Service (IHS) is nottypically counted as health insurance coveragebecause of limitations in the scope of availableservices and geographic reach of IHS facilities.
9 We benchmarked our estimates to the NHISbecause both surveys measure point-in-timecoverage status and because of other desirablemeasurement properties of the health insur-ance coverage estimates of the NHIS (Kenney,Holahan, and Nichols 2006).
10 Family-level characteristics used in determin-ing eligibility, such as income, are based on thegrouping of family members to align withMedicaid rules. Statistics on ‘‘family’’ charac-teristics in this paper are based on the morestraightforward grouping of family memberswho would be eligible for the same privateinsurance plan, known as the health insuranceunit (HIU).
11 The model takes into account disregards forchild care expenses, work expenses, andearnings in determining eligibility, but doesnot take into account child support disregardsbecause data on such amounts were notavailable.
12 These states are California, New York, NewJersey, Florida, Illinois, and Texas.
13 The model assigns eligibility type hierarchical-ly, and cases are classified by the first pathwayfor which they are eligible. For instance, if anSSI recipient gets classified as eligible throughthe SSI pathway, that person would beclassified as eligible through disability-relatedcoverage even if the individual also met thequalifications for Section 1931 coverage.
14 We do not model eligibility for restrictedMedicaid benefits, such as family planningservices or emergency services. As defined inthis paper, limited coverage is more compre-hensive than such restricted-benefit coverage.The limited programs modeled here all cover,at the least, hospitalizations and doctor visits.
15 Estimates from the March 2010 CPS-ASECthat use the same eligibility rules and coverroughly the same time period are similar; atotal of 9 million adults with Medicaidcoverage do not appear eligible for compre-hensive Medicaid services through the mainpathways that are simulated, 1.5 million ofwhom are eligible for limited coverage, and 3.2million of whom are imputed eligible (authors’communication with Christine Coyer, January27, 2012).
16 We exclude from these counts adults with bothMedicaid and employer/union-based, privatenongroup, or military coverage because Med-icaid is supplementary coverage for thosewith dual coverage. We also exclude thosewith Medicaid coverage who do not have asimulated eligibility pathway.
17 See Parker 2011. SNAP/food stamps receiptwas reported on the household level (‘‘In thepast 12 months, did anyone in this householdreceive Food Stamps or a Food Stamp benefitcard?’’) and applied to every member of thehousehold. In 2010, a note was added thatreferenced the Supplemental Nutrition Assis-tance Program (SNAP) to reflect the officialname change of the program in 2008. Thus,there may have been lower reporting of foodstamp benefits in the 2009 ACS because of theomission of the program’s new name.
18 The estimates of children’s participation inMedicaid/CHIP in 2009 presented here differfrom those for 2009 included in Kenney et al.2011 because of improvements to our insur-ance coverage editing processes (which also ledto revisions in the participation rates for 2008compared to what was included in Kenney etal. 2010) since the release of the prior report.However, the overall participation rate changewas small (84.8% in the earlier analysiscompared with 84.3% here), and most states’relative positions among others changed onlyslightly.
19 We classify cases according to their PUMA(the lowest level geographic indicator presentfor all ACS cases), modifying the county-levelcoding scheme and applying the University ofMissouri’s MABLE Geocorrelation applica-tion.
20 Prior estimates of eligibility vary according tothe data source used, survey timing, andsimulation methodology. Data from 1999showed that 15% of uninsured adults wereeligible for Medicaid or state-only programs,but this study did not determine whether
Medicaid Eligibility
249
noncitizens were legally residing and thuseligible for coverage, or include those receivingor eligible for SSI (Davidoff et al. 2004). Whilethe 1999 data found that just 8% of all adults(12% of parents and 5% of nonparents)appeared to be eligible, by 2002 eligibilityhad increased due to declines in the incomedistribution and eligibility expansions (David-off et al. 2004; Davidoff, Yemane, and Adams2005). Estimates using more recent data fromthe 2005 CPS-ASEC, which adjusted for bothunderreporting of Medicaid/CHIP and docu-mentation status for noncitizens, found 28%of uninsured parents and 8% of uninsuredchildless adults eligible (Holahan et al. 2007).Analysis of the 2008 CPS-ASEC, whichreflected eligibility for comprehensive andlimited Medicaid and CHIP and adjustmentsfor Medicaid/CHIP underreporting and im-puted documentation status for noncitizens,found that 38% of uninsured parents and 12%of uninsured nonparents were eligible forMedicaid/CHIP (Cook, Dubay, and Garrett2009; Dubay, Cook, and Garrett 2009).Differences in eligibility rates across studiesmay be explained by different populations ofthe uninsured captured in each study andother differences across data sources.
21 Among adults with all types of health insur-ance status, we find that 17.7 million adultsqualify for comprehensive Medicaid benefitsbased on states’ income and categoricalrequirements. Including those eligible forlimited programs increases this estimate byan additional 5.2 million.
22 As described previously, the ACS only hasindicators for selected functional limitations,while states’ determinations of disability-related eligibility use additional criteria. Thus,some of the adults who appear in our model tobe eligible through the disability pathwaymight not qualify when the more detailedinformation on their characteristics is takeninto account.
23 Estimates of participation vary over time andacross data sources and simulation techniques.For example, estimates from 1999 and 2002(excluding SSI recipients, and without impu-tations of documentation status for nonciti-zens) yielded low participation rates, some-what over 50% (Davidoff et al. 2004;Davidoff, Yemane, and Adams 2005). Morerecent data from the 2007–2009 CPS-ASEC(Sommers and Epstein 2010) were used tocalculate a participation rate of 62% amongthose with no other coverage; while thisestimate incorporates an adjustment for theunderreporting of Medicaid/CHIP, the studyexcluded noncitizens, who have a lower rate ofparticipation than citizens (Davidoff et al.2004). In comparison, our estimate of partic-ipation is higher than both of these estimates;
this is in line with evidence that Medicaidparticipation among children has increased inrecent years (Kenney et al. 2011).
24 The inclusion of imputed eligibles results in asmaller gap between regional estimates. Forexample, when imputed eligibles are included,participation rates in the South and Northeastare 69.4% and 80.3%, respectively (data notshown).
25 American Indians and Alaskan Natives par-ticipate at the lowest rates relative to otherethnic groups. However, this estimate issensitive to the decision not to count thosewith insurance through the IHS among theinsured. When we consider IHS as compre-hensive coverage, we no longer find thatNative Americans and Alaskan Natives par-ticipate at lower rates than non-Hispanicwhites (data not shown).
26 We report results from models with statedummy variables, although, with very fewexceptions, the inclusion or exclusion of statedummy variables did not affect the directionor magnitude of the other estimates. However,several of the coefficient estimates reflectingmetropolitan statistical area (MSA) statuswere affected by the exclusion of the statedummy variables, suggesting that, other thingsequal, adults living in metropolitan areasparticipate at higher rates than adults livingin other areas because they tend to live instates that enroll people at higher rates acrossall types of areas, both metropolitan andnonmetropolitan.
27 When coverage through the IHS is treated ascomprehensive coverage, participation re-mains almost unchanged nationally (67.4%to 67.7%). However, five states’ participationrates exhibit a change greater than fivepercentage points when IHS is treated ascoverage. South Dakota (9.1 percentagepoints), Alaska (7.5), Montana (6.6), NorthDakota (5.8), and New Mexico (5.3) showimproved participation estimates when IHS isconsidered coverage, moving them up 14, 20,4, 14, and 11 rank positions, respectively, interms of participation rates among states (datanot shown).
28 Within states, there is a pattern of lowerparticipation in limited Medicaid programscompared to comprehensive Medicaid pro-grams. For instance, Massachusetts has aparticipation rate of 92.9% for comprehensiveMedicaid, but this falls to 77.8% whenincluding those eligible for limited benefits aswell.
29 When we include imputed eligibles in ourparticipation estimate for adults, the correla-tion coefficient between children’s and adults’participation rates across states drops from .68to .56.
Inquiry/Volume 49, Fall 2012
250

References
The Advisory Board Company. 2012. Where eachstate stands on ACA’s Medicaid expansion: Aroundup of what each state’s leadership hassaid about their Medicaid plans. Last updatedJuly 17, 2012. http://www.advisory.com/Daily-Briefing/2012/07/05/Where-each-state-stands-of-the-Medicaid-expansion.
Blewett, L. A. 2010. Overview of State SurveyDevelopment and Use: What States Need toMonitor Health Insurance Coverage. TheNational Academies, Workshop on EvaluatingDatabases for Use in Uninsured Estimates forChildren. http://www7.nationalacademies.org/cnstat/1Blewett%20Slides%20CHIP.pdf.
Boudreaux, M., J. Y. Ziegenfuss, P. Graven, M.Davern, and L. Blewett. 2011. CountingUninsurance and Means-Tested Coverage inthe American Community Survey: A Compar-ison to the Current Population Survey. HealthServices Research 46(1):210–231.
Buettgens, M., B. Garrett, and J. Holahan. 2010.America Under the Affordable Care Act.Washington, D.C.: The Urban Institute.
Buettgens, M., J. Holahan, and C. Caroll. 2011.Health Reform Across the States: IncreasedInsurance Coverage and Federal Spending onthe Exchanges and Medicaid. Washington,D.C.: The Urban Institute. http://www.urban.org/uploadedpdf/412310-Health-Reform-Across-the-States.pdf.
Cohen Ross, D., A. Horn, R. Rudowitz, and C.Marks. 2008. Determining Income Eligibility inChildren’s Health Coverage Programs: HowStates Use Disregards in Children’s Medicaidand SCHIP. Washington, D.C.: Kaiser Com-mission on Medicaid and the Uninsured. http://www.kff.org/medicaid/upload/7776.pdf.
Cohen Ross, D., M. Jarlenski, S. Artiga, and C.Marks. 2009. A Foundation for Health Re-form: Findings of a 50 State Survey ofEligibility Rules, Enrollment and RenewalProcedures, and Cost- Sharing Practices inMedicaid and CHIP for Children and ParentsDuring 2009. Washington, D.C.: Kaiser Com-mission on Medicaid and the Uninsured.http://www.kff.org/medicaid/upload/8028.pdf.
Cook, A., L. Dubay, and B. Garrett B. 2009. HowWill Uninsured Parents be Affected by HealthReform? Washington, D.C.: The Urban Insti-tute. http://www.urban.org/uploadedpdf/411950_uninsured_parent.pdf.
Davern, M., J. A. Klerman, J. Ziegenfuss, V. Lynch,D. Baugh, and G. Greenberg. 2009. A PartiallyCorrected Estimate of Medicaid Enrollment andUninsurance: Results from an ImputationalModel Developed Off Linked Survey andAdministrative Data. Journal of Economic andSocial Measurement 34(4):219–240.
Davidoff, A., A. S. Sommers, J. Lesko, and A.Yemane. 2004. Medicaid and State-Funded
Coverage for Adults: Estimates of Eligibilityand Enrollment. Report No. 7078. Washing-ton, D.C.: Kaiser Commission on Medicaidand the Uninsured.
Davidoff, A., A. Yemane, and E. Adams. 2005.Health Coverage for Low-Income Adults:Eligibility and Enrollment in Medicaid andState Programs, 2002. Report No. 7285. Wash-ington, D.C.: Kaiser Commission on Medicaidand the Uninsured.
Dubay, L., A. Cook, and B. Garrett. 2009. How WillUninsured Childless Adults be Affected byHealth Reform? Washington, D.C.: The UrbanInstitute. http://www.urban.org/uploadedpdf/411950_uninsured_childless.pdf
Elmendorf, D. W. 2011. Statement on CBO’sAnalysis of the Major Health Care LegislationEnacted in March 2010 Before the U.S. Houseof Representatives, Subcommittee on Health,Committee on Energy and Commerce. Table 3.http://www.cbo.gov/ftpdocs/121xx/doc12119/03-30-healthcarelegislation.pdf.
Eslami, E., K. Filion, and M. Strayer. 2011.Characteristics of Supplemental Nutrition As-sistance Program Households: Fiscal Year2010. Alexandria, Va.: U.S. Department ofAgriculture, Food and Nutrition Service,Office of Research and Analysis.
Griffin, D., and T. Hughes. 2010. Mixed ModeData Collection in the American CommunitySurvey. American Association of Public Opin-ion Research Conference Proceedings, May2010, Chicago, Ill.
Heberlein, M., T. Brooks, J. Guyer, S. Artiga, and J.Stephens. 2011. Holding Steady, Looking Ahead:Annual Findings of a 50-State Survey ofEligibility Rules, Enrollment and Renewal Pro-cedures, and Cost-Sharing Practices in Medicaidand CHIP, 2010–2011. Washington, D.C.: KaiserCommission on Medicaid and the Uninsured.
———. 2012. Performing Under Pressure: AnnualFindings of a 50-State Survey of Eligibility,Enrollment, Renewal, and Cost-Sharing Poli-cies in Medicaid and CHIP, 2011–2012.Washington, D.C.: Kaiser Commission onMedicaid and the Uninsured.
Heberlein, M., M. Huntress, G. Kenney, J. Alker,V. Lynch, and T. Mancini. 2012. MedicaidCoverage for Parents under the AffordableCare Act. Washington, D.C.: GeorgetownUniversity Center for Children and Families.http://ccf.georgetown.edu/wp-content/uploads/2012/06/Medicaid-Coverage-for-Parents1.pdf.
Holahan, J., A. Cook, and L. Dubay. 2007.Characteristics of the Uninsured: Who isEligible for Public Coverage and Who NeedsHelp Affording Coverage? Issue Brief No. 7613.Washington, D.C.: Kaiser Commission onMedicaid and the Uninsured. http://www.kff.org/uninsured/7613.cfm
Medicaid Eligibility
251

Holahan, J., and I. Headen. 2010. MedicaidCoverage and Spending in Health Reform:National and State-by-State Results for Adultsat or Below 133% FPL. Washington, D.C.:Kaiser Commission on Medicaid and theUninsured. http://www.kff.org/healthreform/upload/Medicaid-Coverage-and-Spending-in-Health-Reform-National-and-State-By-State-Results-for-Adults-at-or-Below-133-FPL.pdf.
Kaiser Commission on Medicaid and the Unin-sured. 2010a. Expanding Medicaid to Low-Income Childless Adults under Health Re-form: Key Lessons from State Experiences.Publication No. 8087. Washington, D.C.:Kaiser Commission on Medicaid and theUninsured.
———. 2010b. Coordinating Coverage and Carein Medicaid and Health Insurance Exchanges.Publication No. 8118. Washington, D.C.:Kaiser Commission on Medicaid and theUninsured. http://www.kff.org/healthreform/upload/8118.pdf
———. 2011. Where are States Today? Medicaidand CHIP Eligibility Levels for Children andNon-Disabled Adults. Publication No. 7993-02. Washington, D.C.: Kaiser Commission onMedicaid and the Uninsured.
Kenney, G., J. Holahan, and L. Nichols. 2006.Towards a More Reliable Federal Survey forTracking Health Insurance Coverage and Ac-cess. || Health Services Research 41(3):918–945.
Kenney, G., V. Lynch, A. Cook, and S. Phong. 2010.Who and Where are theChildren Yet to Enroll inMedicaid and the Children’s Health InsuranceProgram? Health Affairs 29(10):1920–1929.
Kenney, G., V. Lynch, J. Haley, M. Huntress, D.Resnick, and C. Coyer. 2011. Gains forChildren: Increased Participation in Medicaidand CHIP in 2009. Washington, D.C.: TheUrban Institute and Robert Wood JohnsonFoundation. http://www.rwjf.org/files/research/20110816coveragegainsforkidsfull.pdf.
Kenney, G., S. Zuckerman, L. Dubay, M. Hunt-ress, V. Lynch, J. Haley, and N. Anderson.2012. Opting in to the Medicaid Expansionunder the ACA: Who Are the Uninsured AdultsWho Could Gain Health Insurance Coverage?Robert Wood Johnson Foundation QuickStrike Series, No. 78. Princeton, N.J.: TheRobert Wood Johnson Foundation. http://www.rwjf.org/coverage/product.jsp?id574697.
Klerman, J., M. Plotzke, and M. Davern. 2010. AnImputational Model for Medicaid Under-Report-ing in the National Health Interview Survey.Presented at AcademyHealth Research Meetings.
Lynch, V., and G. Kenney. 2011. Improving theAmerican Community Survey for StudyingHealth Insurance Reform. Proceedings of the10th Conference on Health Survey ResearchMethods, April 2011, Atlanta, Ga. Hyattsville,Md.: Department of Health and HumanServices.
Lynch, V., G. M. Kenney, J. Haley, and D. M.Resnick. 2011. Improving the Validity of theMedicaid/CHIP Estimates on the AmericanCommunity Survey: The Role of Logical Cov-erage Edits. Submitted to the U.S. CensusBureau. http://www.census.gov/hhes/www/hlthins/publications/Improving%20the%20Validity%20of%20the%20Medicaid-CHIP%20Estimates%20on%20the%20ACS.pdf.
Lynch, V., M. Boudreaux, and M. Davern. 2010.Applying and Evaluating Logical CoverageEdits to Health Insurance Coverage in theAmerican Community Survey. Suitland, Md.:U.S. Census Bureau, Housing and HouseholdEconomic Statistics Division.
Mach, A., and B. O’Hara.. Forthcoming. DoPeople Really Have Multiple Health InsurancePlans? Estimates of Nongroup Health Insurancein the American Community Survey. AmericanStatistical Association 2011 Proceedings.
Moore, J. C., L. L. Stinson, and E. J. Welniak. 2000.Income Measurement in Surveys: A Review.Journal of Official Statistics 16:331–361.
Morrow, B., and J. Paradise. 2010. ExplainingHealth Reform: Eligibility and EnrollmentProcesses for Medicaid, CHIP, and Subsidiesin the Exchanges. Publication 8090. MenloPark, Calif.: Kaiser Family Foundation. http://www.kff.org/healthreform/upload/8090.pdf.
National Center for Health Statistics, Division ofHealth Interview Statistics. 2005. 2004 NationalHealth Interview Survey (NHIS) Public UseData Release Survey Description. Hyattsville,Md.: National Center for Health Statistics.http://www.cdc.gov/nchs/data/nhis/srvydesc.pdf.
National Immigration Law Center. 2011. Table:Medical Assistance Programs for Immigrants inVarious States. http://www.nilc.org/pubs/guideup-dates/med-services-for-imms-in-states-2011-07.pdf.
Parker, J. 2011. SNAP Misreporting on the CPS:Does it Affect Poverty Estimates? U.S. CensusBureau working paper presented at the 2011National Association of Welfare Research andStatistics Conference. http://www.census.gov/hhes/www/income/publications/Parker%20snap%20paper%201_2012.pdf.
Passel, J., and D. Cohen. 2009. A Portrait ofUnauthorized Immigrants in the United States.Washington, D.C.: Pew Hispanic Center.
Robert Wood Johnson Foundation, State CoverageInitiatives. 2010. State Specific Strategies. http://www.statecoverage.org/node/50/cs_states.
Roberts, P. 2003. Rethinking the Medicaid ChildSupport Cooperation Requirement. Washington,D.C.: Center for Law and Social Policy. http://www.clasp.org/admin/site/publications/files/0126.pdf.
Ruggles, S., T. J. Alexander, K. Genadek, R.Goeken, M. Schroeder, and M. Sobek. 2010.Integrated Public Use Microdata Series: Ver-sion 5.0 [Machine-readable database]. Minne-apolis, Minn.: University of Minnesota.
Inquiry/Volume 49, Fall 2012
252
Sommers, B. D., and A. M. Epstein. 2010.Medicaid Expansion — The Soft Underbellyof Health Care Reform? New England Journalof Medicine 363(22):2085–2087.
Sommers, B. D., K. Swartz, and A. Epstein. 2011.Policy Makers Should Prepare for MajorUncertainties in Medicaid Enrollment, Costs,and Needs for Physicians Under HealthReform. Health Affairs 30(11):2186–2193.
Sullivan, J. 2010. Expanding Coverage for RecentImmigrants: CHIPRA Gives States New Options.Washington, D.C.: Families USA. http://familie-susa2.org/assets/pdfs/chipra/immigrant-coverage.pdf.
Turner, J., and M. Boudreaux. 2010. Health InsuranceCoverage in the American Community Survey: AComparison to Two Other Federal Surveys.Washington, D.C.: National Academies Press.
U.S. Census Bureau. 2012. American CommunitySurvey Response Rates: Data: United States.http://www.census.gov/acs/www/methodology/response_rates_data/.
U.S. Department of Health and Human Ser-vices. 2011. Connecting Kids to Coverage:Steady Growth, New Innovation. 2011. CHI-PRA Annual Report. http://www.insurekidsnow.gov/chipraannualreport.pdf.
Medicaid Eligibility
253

Copyright of Inquiry (00469580) is the property of Excellus Health Plan, Inc. and its content may not be copied
or emailed to multiple sites or posted to a listserv without the copyright holder's express written permission.
However, users may print, download, or email articles for individual use.