variation in care of surgical conditions · surrounding dialysis access surgery, access to...
TRANSCRIPT

Variation in the Care of Surgical Conditions:End-Stage Renal Disease
A Dartmouth Atlas of Health Care Series


Variation in the Care of Surgical Conditions: End-Stage Renal DiseaseA Dartmouth Atlas of Health Care Series
DEPARTMENT OF SURGERY
Dartmouth-Hitchcock Medical Center
Devin Zarkowsky, MDRichard Freeman, MDDavid Axelrod, MD, MBA
Division of Vascular and Endovascular Therapy, The Johns Hopkins Medical Institutes
Mahmoud Malas, MD, MHS
The Dartmouth Institute of Health Policy & Clinical Practice
Philip R. Goodney, MD, MSNino Dzebisashvili, PhDDavid C. Goodman, MD, MSKristen K. Bronner, MA
A DARTMOUTH ATLAS OF HEALTH CARE SERIES I


A DARTMOUTH ATLAS OF HEALTH CARE SERIES III
Table of Contents
Foreword ............................................................................................................................................................. v
Introduction ......................................................................................................................................................... 1Variation in decision-making for surgical conditions ...........................................................................................................2New developments that have influenced surgical decision-making ....................................................................................4Challenges to improving surgical decision-making and the goals of this series .................................................................6Influencing the key decision-makers: Patients, primary care physicians, surgeons, and policymakers ..............................8References ........................................................................................................................................................................10
Kidney Failure ................................................................................................................................................... 11Before surgery ..................................................................................................................................................................12
History of ESRD treatment in the U.S. ........................................................................................................................................... 12Current epidemiology of ESRD ..................................................................................................................................................... 15Factors that influence the quality of ESRD care ............................................................................................................................ 20
During surgery ..................................................................................................................................................................24Arteriovenous fistulas .................................................................................................................................................................... 24Kidney transplantation ................................................................................................................................................................... 26
After surgery .....................................................................................................................................................................30Beyond surgery .................................................................................................................................................................31
Quality initiatives in ESRD care ..................................................................................................................................................... 31Conclusion ........................................................................................................................................................................33Methods ............................................................................................................................................................................34References ........................................................................................................................................................................38


Foreword
The new Dartmouth Atlas series on variation in the care of surgical conditions, including this report on the procedures associated with end-stage renal disease, raises new questions regarding surgical management of both common and less frequently occurring medical conditions. This report carefully details the issues surrounding dialysis access surgery, access to transplantation and transplant-related care, and the impact of transplantation on patient-related outcomes. As in previous Atlas analyses, the authors emphasize geographic practice variation in rates of dialysis access surgery and transplantation. However, the report also takes a broader view, describing the resources necessary to help patients make the best decisions for their complex care.
Patients faced with kidney failure want to know how to best navigate their options. Just as the future of medicine is personalization of diagnosis and treatment, so too the future of decision support is to increasingly provide information tailored to the person and his or her health care environment. Ultimately, it is fully informed patients that participate most effectively in their health care, even when they face the tremendous challenges posed by end-stage renal disease. I look forward to future analyses examining the key priorities the authors describe, which will continue to highlight opportunities for improvement.
Michael J. Barry, M.D.
President, Informed Medical Decisions FoundationClinical Professor of Medicine, Harvard Medical School
A DARTMOUTH ATLAS OF HEALTH CARE SERIES v


A DARTMOUTH ATLAS OF HEALTH CARE SERIES 1
Variation in the Care of Surgical ConditionsA Dartmouth Atlas of Health Care Series
Introduction
Twenty-first century surgery is among the great accomplishments of medicine. Sur-geons have led some of the most important improvements in care quality, safety, and efficiency. Surgical methods are now highly effective for some of the most serious and previously intractable medical conditions, ranging from arthrosclerosis to obesity to chronic back pain. Today, surgical procedures work better and entail lower risk, less pain, and less time in the hospital.
As the scope and quality of surgical care continues to advance, there is still much that remains to be done to optimize care for patients. For many conditions, surgery is one of several care options, and in some instances, there are several types of surgical procedures available. Research into the effectiveness and adverse effects of a surgical procedure compared to alternatives is often incomplete. While qual-ity has generally improved over time, outcomes can differ across hospitals and surgeons. Too often, treatment options, whether medical or surgical, are recom-mended without patients fully understanding the choices and participating in the decision; and these recommendations can vary markedly from one physician to the next. Finally, the costs of care continue to rise and often differ across health care systems, even the most reputable and prestigious. Why can the “best” surgical care at one academic medical center cost twice as much as another?
This Dartmouth Atlas of Health Care series reports on unwarranted regional varia-tion in the care of several conditions for which surgery is one important treatment option. Unwarranted variation is the differences in care that are not explained by patient needs or preferences. Each report begins with an examination of the underlying condition, the available treatment options before surgery, and the role of shared decision-making. The care during surgery is then presented, including aspects of quality, risks, and costs. The next section is concerned with the care of patients after surgery, including hospital readmissions and ambulatory care.
The bottom line is that the greatest promise of surgery still lies before us. These reports show that quality is often excellent, but not in all places. Variation in surgical rates is high and represents both gaps in outcomes research and poor patient deci-sion quality. Outcomes differ from place to place even when controlling for patient differences. The opportunities for better and more efficient care are substantial and will require renewed efforts in research and clinical quality improvement.

A Dartmouth Atlas of Health Care Series
2 vARIATION IN THE CASE OF SURGICAL CONDITIONS
Variation in decision-making for surgical conditions
Experienced leaders and educators in surgery often emphasize to their trainees and students that performing an operation is easy: choosing the right patients for surgery is much more difficult. Over the last decade, important changes have occurred related to how surgeons and patients decide whether, when, where, and how to best perform surgery. In the past, surgeons commonly played a paternalistic role, and many surgeons made decisions for their patients, relying on their own training and experience.
When surgeons—and more importantly, patients—face a decision regarding sur-gery, making the “right” choice can be clear and straightforward in certain situations. For example, patients with hip fracture almost always need to undergo surgery. For nearly every patient, surgical repair offers better pain control, improved func-tional status, and lower mortality when compared to treatment with conservative measures. Further, most patients who experience hip fracture are over the age of 65 and have access to surgical care, as they receive their health care benefits through Medicare. Because of this important constellation of circumstances—the treatment works well, is readily available, and is actively sought by both physicians and patients—hip fracture care is fairly uniform and regional rates vary relatively little, as shown in previous work by the Dartmouth Atlas and others (Figure 1).1,2
Figure 1. Variation profiles of 11 surgical procedures among hospital referral regions (2010)
Each point represents the ratio of observed to expected (national average) Medicare rates in the 306 U.S. hospital referral regions. Rates are adjusted for age, sex, and race. High and low outlier regions are distinguished by dotted lines.
: INTRODUCTION
Rat
io o
f su
rgic
al r
ate
to n
atio
nal
ave
rag
e
Hip
fract
ure
Chol
ecys
tect
omy
Hip
repl
acem
ent
Cole
ctom
y fo
r col
on c
ance
r
CABG
sur
gery
Back
sur
gery
Mas
tect
omy
for c
ance
r
Low
er e
xtre
mity
reva
scul
ariz
atio
n
Caro
tid e
ndar
tere
ctom
y
Radi
cal p
rost
atec
tom
y
TURP
for B
PH3.5
3.0
2.5
2.0
1.5
1.0
0.5
0.0

A DARTMOUTH ATLAS OF HEALTH CARE SERIES 3
For many other illnesses, the choice of surgery is much less clear. For example, patients with asymptomatic carotid artery stenosis have a small but measurable risk of stroke as a result of narrowing within the carotid artery (the blood vessel in the neck that supplies the brain).3 For certain patients with carotid disease, the risk of surgery to remove the plaque is fairly low, and removal of plaque can reduce the patient’s risk of stroke over time. However, in patients with other illnesses, the chance of complications from surgery may be higher than the risk of stroke from the plaque itself.4
Because of this uncertainly about who should undergo carotid revascularization, treatment decisions vary considerably. Unlike hip fracture treatment, carotid sur-gery varies dramatically across the United States, as the Dartmouth Atlas has previously shown.5 Carotid procedures are performed commonly in some regions, but rarely in others, resulting in marked regional differences in the use of revascu-larization. Many of these differences appear to be explained by differences in local medical opinion of the value of surgical care (Map 1).
Map 1. Overall carotid revascularization rates among hospital referral regions (1998)
The map shows the combined rate for carotid endarterectomy and carotid artery stenting across hospital referral regions for 1998. Rates are adjusted for age, sex, and race.

A Dartmouth Atlas of Health Care Series
4 vARIATION IN THE CASE OF SURGICAL CONDITIONS
New developments that have influenced surgical decision-making
How can surgeons and patients make the best decisions? In the past, many inves-tigators reasoned that the surgeons who achieved the best results were likely to have the largest practices, and using this seemingly simple metric would ensure that patients received good surgical care. However, this assumption ignored the fact that it is difficult for surgeons to know who really achieves the “best” results. Many outcomes (such as death after carotid surgery) occur uncommonly, and a single surgeon has little ability to compare his or her results to those of other surgeons.
Given this challenge, over the last two decades, efforts to organize, measure, and improve results in surgical practice via quality improvement initiatives have developed, despite substantial obstacles. Patterns of surgical practice vary broadly across different regions of the United States, making it challenging to study and compare patients and outcomes. Further, the process of collecting, studying, and improving surgical outcomes represented a formidable challenge a decade ago, when most medical information lived in paper records, arranged in leaning stacks of bulging charts.
One important development in measuring care has been the development of clinical registries. These registries are used to study the clinical characteristics and outcomes of patients undergoing surgery and have supported many quality improvement initiatives, such as those shown in Table 1.
Table 1. Surgical registries and quality improvement organizations
Quality Improvement Initiative Organization Surgical Specialty Focus Funding
American College of Surgeons National Surgical Quality Improvement Initiative (ACS-NSQIP)
American College of Surgeons
Many Measuring and reporting patient characteristics and outcomes
Hospitals
veterans Affairs National Surgical Quality Improvement Program veterans Affairs Many Measuring and reporting patient characteristics and outcomes
Federal
Society of Thoracic Surgeons National Database (STS) Society of Thoracic Surgeons
Thoracic surgery Limiting risk with cardiac and thoracic procedures
Surgeons
vascular Quality Initiative (vQI) Society for vascular Surgery
vascular surgery Improving care of patients with vascular disease
Surgeons and hospitals
: INTRODUCTION

A DARTMOUTH ATLAS OF HEALTH CARE SERIES 5
Uncertainty regarding benefits
and risks of surgery
Information for patients and surgeons
to guide decisions
Uncertainty regarding benefits
and risks of surgery
Information for patients and surgeons
to guide decisions
Variation in surgical decisions: AFTER the evolution of registries, etc.
Variation in surgical decisions: BEFORE the evolution of registries, etc.
Surgeons interested in measuring and improving their surgical results collaborat-ed by systematically tracking patient outcomes. In many ways, these new efforts represented an important and novel strategy toward reducing variation by using clinically derived information to improve surgical decisions and care (Figure 2). As information for surgeons and patients increased (the green arrow), uncertainty for patients decreased (the red arrow). This simple but effective approach helped to limit variation in surgical treatments.
Figure 2. How information and uncertainty can affect variation in surgical care
Three other changes occurred during this time that helped create a spirit of engage-ment and excitement for quality improvement efforts and surgical outcomes research. While there were some differences, these general changes are outlined below:
1. Less invasive methods became commonly available in surgery. In recent years, across nearly every surgical specialty, rapid advances in surgical technology have helped offer patients the ability to undergo major surgery without the need for a major recovery. Several examples illustrate this trend. Working inside body cavities no longer requires large abdomi-nal or chest incisions, and surgeons instead use video cameras and small instruments in laparoscopic and endoscopic surgery. In vascular surgery, the blood vessels themselves are often the pathway to perform procedures (i.e., endovascular techniques). And finally, with the development of radiofre-quency ablation, locally acting chemotherapeutics, and laser thermablation, the key objectives of a surgical procedure can be accomplished using a much less invasive approach. Patients rapidly learned about many of these approaches and sought out these less invasive procedures, and surgeons retrained to offer these new approaches.

A Dartmouth Atlas of Health Care Series
6 vARIATION IN THE CASE OF SURGICAL CONDITIONS
2. Surgeons learned about data management and quality improvement. In places like Northern New England,6,7 the Veterans Administration,8 and others,9 leaders in surgical outcomes assessment built the systems neces-sary to study and improve surgical care. These regional and national quality improvement efforts grew to become the infrastructure that allowed surgeons and patients to know when, how, where, and why surgical procedures were being performed. These initiatives set the stage for an emphasis on achiev-ing the best outcomes.
3. Surgeons, patients, and payers put a new emphasis on measuring and reporting. Armed with gigabytes of data and advanced analytic sys-tems, surgeons were now able to quickly analyze their outcomes. The ability to determine the structural and process measures associated with the best outcomes allowed surgeons new insights into what works and what does not. For example, surgeons used information from studies based on registries to demonstrate the benefits of processes of care, such as perioperative antibi-otic administration, or of evolving procedures, such as bariatric surgery for patients with morbid obesity. Payers’ and patients’ expectations grew; they demanded the best operation, at the right time, with the highest quality.
Challenges to improving surgical decision-making and the goals of this series
Of course, several challenges accompanied these new developments. Who will pay for continued efforts to organize and measure surgical practice? How should results be shared and compared, especially among competitors? Would efforts to use the newest, latest, or most profitable device win out over the goal of improving quality and efficiency? Would surgeons, a group steeped in tradition and often slow to change, adopt these new approaches?
These questions have different answers in different settings. In some cases, such as in coronary bypass surgery, cardiac surgeons adopted outcomes assessment and quality improvement broadly, quickly, and enthusiastically. However, in other settings, such as surgery for prostate cancer or lower extremity vascular disease, efforts toward quality measurement and outcomes assessment have been taken up more slowly, and the impact of these initiatives remains less striking.
Why might some surgeons improve their decisions using these new strategies while other surgeons choose not to try these approaches? In this series of reports, we will use several examples to illustrate the challenges. We will describe, across a broad spectrum of conditions, advances in surgical decision-making, including shared decision-making, which have resulted in less variation in care, improved patient satisfaction, and better outcomes. We will also describe settings wherein these strategies have been less successful, and variations in surgery rates and
: INTRODUCTION

A DARTMOUTH ATLAS OF HEALTH CARE SERIES 7
Table 2. Structure of each report
Before surgery
Determinants of condition and treatment decisions
Incidence of condition
Regional variation in condition/covariates related to the condition
Treatment options - effectiveness, trade-offs, and knowledge gaps
Issues related to decision quality and shared decision-making
Examples of quality improvement efforts or attempts to limit variation in treatments for condition
During surgery
Technical quality and outcomes
variation in procedure rates
Cross-sectional rates of competing treatments
Technical quality and results (short-term outcomes related to treatments)
Example where regional quality improvement efforts may hold potential benefits in improving care
After surgery
Post-procedure care and long-term outcomes
Downstream effects of treatment on condition
Readmission or re-interventions after treatments for condition
Beyond surgery
Implications for surgeons, patients, and society
How variation in treatments for the condition reflects opportunities for quality and efficiency gains
How, why, and where efforts to limit variation are needed and might help
How to move ahead in limiting variation or improving care in surgical treatments for condition
surgical decision-making remain. In these latter cases, we will outline the potential to improve surgical practice by refining the methods we use to select patients for intervention.
This series will study these conditions and their challenges in much the same way that surgeons approach these problems: by considering the challenges in care that occur before surgery, during surgery, after surgery, and beyond surgery. Within each condition, we will follow the patient along these choices and decisions and learn where the greatest challenges, most important uncertainties, and best evidence lie in making decisions about surgery. Further, we will examine the implications of these uncertainties and identify settings where more effective choices surrounding surgical care could result in healthier populations and potentially even lower costs.

A Dartmouth Atlas of Health Care Series
8 vARIATION IN THE CASE OF SURGICAL CONDITIONS
Influencing the key decision-makers: Patients, primary care physicians, surgeons, and policymakers
In the past, when it came to making a decision about surgery, the surgeon’s recom-mendation was considered the most important opinion. His or her perspective was often critical in determining the use of a particular surgical procedure, especially for “preference-sensitive” care: care for conditions where there is no single “right” rate for every population or patient.
Current models of care suggest that better outcomes occur when full information about treatment options is shared with patients, who are then assisted in sharing the decision with the physician. This information often needs to come not only from surgeons, but also from primary care physicians who help patients choose among the different options, each with their likely outcomes and trade-offs. (For more information about patient-centered medical decision-making, please visit the Dartmouth Center for Informed Choice at http://tdi.dartmouth.edu/research/engaging/informed-choice and the Informed Medical Decisions Foundation at www.informedmedicaldecisions.org). In addition to reaching patients, the best information needs to reach policymakers who make decisions about how we spend our health care dollars, such that our resources provide the most effective care for patients with surgical conditions.
: INTRODUCTION
Shared Decision-Making
Dale Collins Vidal, MDProfessor of Surgery, Geisel School of Medicine; Director, Center for Shared Decision Making, Dartmouth-Hitchcock
Much of the striking variation in the use of surgical procedures reported in this Dartmouth Atlas series can be attributed to differing physi-cian opinions about the value of one surgery over another, or a single surgical option compared to other treatments such as medication, active surveillance, or physical therapy. Each option can have different potential benefits as well as short and long-term side effects. For a given condition, any of the options may be a reasonable alternative. The decision is often further complicated by incomplete evidence regarding both benefit and harm.
It is particularly important to note that many informed patients have different perspectives than their physicians about the benefits and trade-offs of treatment options. The final choice of treatment should be made by patients who have been informed about the choices, including the pros and cons of each approach and any uncertainty about the evidence that supports each option. In addition, the health care team needs to help patients clarify their own goals and partner with patients to make joint decisions.
This process of engaging patients in decisions about their care is known as shared decision-making. Shared decision-making is a col-laborative process that allows patients and their providers to make health care treatment decisions together, taking into account the best scientific evidence available, as well as the patient’s values and preferences. The right choice for one patient may not be the same as the next. In this series, Dartmouth Atlas investigators will consider many clinical situations where there is no single “right” choice and highlight areas where shared decision-making may have an important role for patients with surgical conditions.
A DARTMOUTH ATLAS OF HEALTH CARE SERIES 9
In summary, this series of Atlas reports is intended to help patients, physicians, and policymakers recognize where improvements in science have helped to limit variation and improve surgical care; but more importantly, for each of the surgical conditions we study, we hope to identify specific clinical settings and situations where variation in the treatment of surgical condition remains, and outline the best opportunities for improvement in surgical care that lie ahead.

A Dartmouth Atlas of Health Care Series
10 vARIATION IN THE CASE OF SURGICAL CONDITIONS
References1. Wennberg DE, Birkmeyer JD, eds. The Dartmouth Atlas of Cardiovascular Health Care. American Hospital
Press, Chicago, IL: 1999.
2. Birkmeyer JD, Sharp SM, Finlayson SR, Fisher ES, Wennberg JE. Variation profiles of common surgical procedures. Surgery. 1998;124:917-923.
3. Endarterectomy for asymptomatic carotid artery stenosis. Executive Committee for the Asymptomatic Carotid Atherosclerosis Study. JAMA. 1991;273:1421-1428.
4. Wallaert JB, De Martino RR, Finlayson SR, Walsh DB, Corriere MA, Stone DH, Cronenwett JL, Goodney PP. Carotid endarterectomy in asymptomatic patients with limited life expectancy. Stroke. 2012;43:1781-1787.
5. Goodney PP, Travis LL, Malenka D, Bronner KK, Lucas FL, Cronenwett JL, Goodman DC, Fisher ES. Regional variation in carotid artery stenting and endarterectomy in the Medicare population. Circ Cardiovasc Qual Outcomes. 2010;3:15-24.
6. O’Connor GT, Plume SK, Olmstead EM, Coffin LH, Morton JR, Maloney CT, Nowicki ER, Tryzelaar JF, Hernandez F, Adrian L, et al. A regional prospective study of in-hospital mortality associated with coronary artery bypass grafting. The Northern New England Cardiovascular Disease Study Group. JAMA. 1991;266:803-809.
7. Cronenwett JL, Likosky DS, Russell MT, Eldrup-Jorgensen J, Stanley AC, Nolan BW. A regional registry for quality assurance and improvement: The Vascular Study Group of Northern New England (VSGNNE). J Vasc Surg. 2007;46:1093-1101.
8. Khuri SF, Daley J, Henderson W, Hur K, Demakis J, Aust JB, Chong V, Fabri PJ, Gibbs JO, Grover F, Hammermeister K, Irvin G, 3rd, McDonald G, Passaro E, Jr., Phillips L, Scamman F, Spencer J, Stremple JF. The Department of Veterans Affairs’ NSQIP: The first national, validated, outcome-based, risk-adjusted, and peer-controlled program for the measurement and enhancement of the quality of surgical care. National VA Surgical Quality Improvement Program. Annals of Surgery. 1998;228:491-507.
9. Flum DR, Fisher N, Thompson J, Marcus-Smith M, Florence M, Pellegrini CA. Washington state’s approach to variability in surgical processes/outcomes: Surgical Clinical Outcomes Assessment Program (SCOAP). Surgery. 2005;138:821-828.
: INTRODUCTION
A DARTMOUTH ATLAS OF HEALTH CARE SERIES 11
Kidney Failure
Kidneys perform several essential functions for the body. They maintain normal blood pressure and electrolyte balance, generate signals to create new blood cells, and eliminate waste from the body as urine. Before the 1950s, kidney failure, also called end-stage renal disease (ESRD)—a permanent decline in function of the kidneys—was associated with certain death. Advances in medical technology over the last 60 years have allowed patients to resume nearly normal lives, even when their own kidneys no longer function. Renal replacement therapy, either through dialysis or kidney transplantation, offers a substitute for the patient’s own kidney function.
Dialysis and kidney transplantation represent major steps forward in ESRD care. Unfortunately, current systems deliver therapy in a fragmented fashion. Patient care is spread across multiple locations, including primary care and specialist offices, dialysis facilities, and transplant centers. This often results in poor coordination and uneven provision of services.
This report highlights treatments for kidney failure—both dialysis and kidney trans-plantation—and describes patterns of care for patients in the United States. The evolution of ESRD treatments is first presented, from basic surgical techniques and rudimentary dialysis machines to the complex, multi-specialty model practiced today. Most importantly, the report examines current quality improvement initiatives and identifies areas in need of system-level improvement.

A Dartmouth Atlas of Health Care Series
12 vARIATION IN THE CASE OF SURGICAL CONDITIONS: END-STAGE RENAL DISEASE
Before surgery
History of ESRD treatment in the U.S.
Transplantation and dialysis were developed in parallel during the 1950s, culminat-ing in successful long-term survival for patients with ESRD for the first time. These techniques translated basic science and clinical research from dedicated surgeons and physicians into a therapeutic reality for ESRD patients.
Development of kidney transplantation
A knife-wielding assassin inspired the surgical techniques for organ transplanta-tion. French President Sadi Carnot died in 1894 after an attack that purportedly left his abdominal blood vessels damaged beyond repair. Alexis Carrel, a young French surgeon, seeking a technique that might have saved Carnot, developed suturing methods enabling blood vessels to be joined. He received a Nobel Prize for these efforts in 1912.
In December of 1954, Joseph Murray, a surgeon at the Peter Bent Brigham Hos-pital in Boston, employed the vascular surgery techniques developed by Carrel to successfully transplant a kidney from Ronald Herrick to his identical twin brother, Richard. Murray posited that an organ transplanted from one identical twin to the other would survive, based on successful skin-grafting experiments performed weeks before the kidney surgery.1 Richard’s body accepted his brother’s kidney as
Figure 3. Kidney transplantSource: National Institute of Diabetes and Digestive and Kidney Diseases (NIDDK), National Institutes of Health (NIH). Accessed October 23, 2014 at: kidney.niddk.nih.gov/kudiseases/pubs/transplant/
its own, and he lived for eight more years. Because the broth-ers were identical twins, organ rejection was not a problem. Murray also received the Nobel Prize for this work in 1990.
It is rare that ESRD patients have a twin able to donate an organ. To become more generally useful, transplantation required physicians to understand and suppress the immune system in order to prevent organ rejection from non-identical donors. Peter Medawar’s work in immunology characterized a cell’s ability to distinguish between self and non-self, forming the basis for immunosuppressive medications.2 Subsequent-ly, anti-rejection medications emerged, effectively controlling rejection and allowing organ transplantation to become a durable, broadly-available therapy.3
Subsequent research established kidney transplantation as the most medically and economically efficacious renal replacement therapy.1 Over 16,000 patients receive trans-plants from either living or deceased kidney donors every year.4 With current immunosuppression methods, over 94% of all kidneys transplanted function after one year, and nearly
A DARTMOUTH ATLAS OF HEALTH CARE SERIES 13
75% work at five years.5 Compared with dialysis, kidney transplantation costs less and leads to longer survival.6
Development of hemodialysis
While transplantation offers thousands of patients an opportunity for a nearly nor-mal life, tens of thousands are not able to receive a kidney, either because they are too ill or as a result of the shortage of available donor organs. For these patients, an alternative therapy—dialysis—is used to support life until either their kidneys recov-er or a donor organ becomes available. Hemodialysis machines filter the blood to remove toxins, salt, and fluids. Treatments generally occur three times per week, with each dialysis treatment lasting three to five hours.
Choosing whom to dialyze with the limited number of available machines chal-lenged clinicians in the early years, and cost was often prohibitive. In a highly publicized program at the University of Washington, Seattle in the early 1960s, patients seeking dialysis were screened first for medical suitability by a panel of doctors. They were then reviewed by a separate panel, including a pastor, a lawyer, a doctor, and a businessman. This second group approved patients based on their social contributions, choosing 10 of the first 17 ESRD candidates to dialyze.4 The remaining patients died from untreated renal failure. These systems persisted until funding for dialysis was incorporated into Medicare in 1972, leading to a dramatic expansion of dialysis capacity in the U.S.
Insurance reform
Despite the existence of reliable methods to treat kidney failure, availability and costs hindered both transplantation and hemodialysis until President Richard Nix-on signed Public Law 92-603, which initiated Medicare coverage for people under age 65 affected by ESRD. At the time, 7,000 Americans qualified for either dialy-sis or kidney transplantation; their treatment was fully reimbursed by the United States government. With this change, ESRD became a chronic, rather than fatal, medical condition. Public and political sentiment supported the expansion of treat-ment. Demand increased in the 40 years following Medicare coverage. The most recent report from the United States Renal Data System, the USRDS 2013 Annual Data Report: Atlas of Chronic Kidney Disease and End-Stage Renal Disease in the United States, showed that, as of December 31, 2010, the ESRD population in the United States comprised 488,938 people and consumed 6.3% of Medicare’s total budget.5

A Dartmouth Atlas of Health Care Series
14 vARIATION IN THE CASE OF SURGICAL CONDITIONS: END-STAGE RENAL DISEASE
Safer dialysis: creating fistulas
Hemodialysis requires durable access to large blood vessels that allow fluid exchange through the dialysis machine. Brescia, Cimino, Appel, and Hurwich described direct artery-vein connections—called arteriovenous (AV) fistulas—for hemodialysis in 1966.7 This technique grew in practice and became the primary mode of vascular access in ESRD treatment (Figure 4).
Figure 4. AV fistula
In an AV fistula, the surgeon divides one of the veins in the arm and attaches it directly to the side of the main artery to the arm. This results in a blood vessel with rapid blood flow and thicker walls which can be used for dialysis. The dialysis machine is connected by placing two needles through the skin into the blood vessel to remove the blood, clean it in the dialysis machine, and return it to the patients circulation.Source: Macsata RA, Sidaway AN. Hemodialysis Access: General Considerations. In: Cronenwett JL, Johnston KW, eds. Rutherford’s Vascular Surgery. Vol 1. 7th ed: Elsevier; 2010.
Figure 5. Non-tunneled central venous catheterSource: Blausen.com staff. “Blausen gallery 2014.” Wikiversity Journal of Medicine. DOI:10.15347/wjm/2014.010.
Intravascular hemodialysis catheters are large intravenous tubes placed to ensure easy access to patients’ blood vessels for hemodialysis (Figure 5). While simple to place, it is diffi-cult to maintain them and prevent infection. Dialysis catheters appeared in the 1980s, supplanting fistulas as the dominant access mode and increasing dialysis-associated costs.8 Studies have demonstrated inferior survival and increased morbidity associated with the indwelling catheters.8-11
The National Kidney Foundation-Kidney Dialysis Outcomes Quality Initiative (NKF-KDOQI) published practice guidelines regarding permanent hemodialysis access creation and maintenance in 1997. The NKF set a goal that nearly half (40%) of existing dialysis patients have a fistula, and 50% of new dialysis patients start dialysis with a fistula.3 An update in 2005 reflected the Centers for Medicare and Medicaid Services’ Fistula First Breakthrough Initiative (FFBI).8 While overall fistula prevalence doubled to 60% in the seven years after the initiation of the FFBI,12 in 2005, fewer than 20% of ESRD patients started dialysis through a fistula, a clear opportunity for improvement based on these guidelines.13 Patients also have the option of peritoneal dialysis, which, unlike hemodialysis, filters toxins from the blood stream through the lining of the patient’s abdominal cavity into fluid instilled and removed through an access port.
A DARTMOUTH ATLAS OF HEALTH CARE SERIES 15
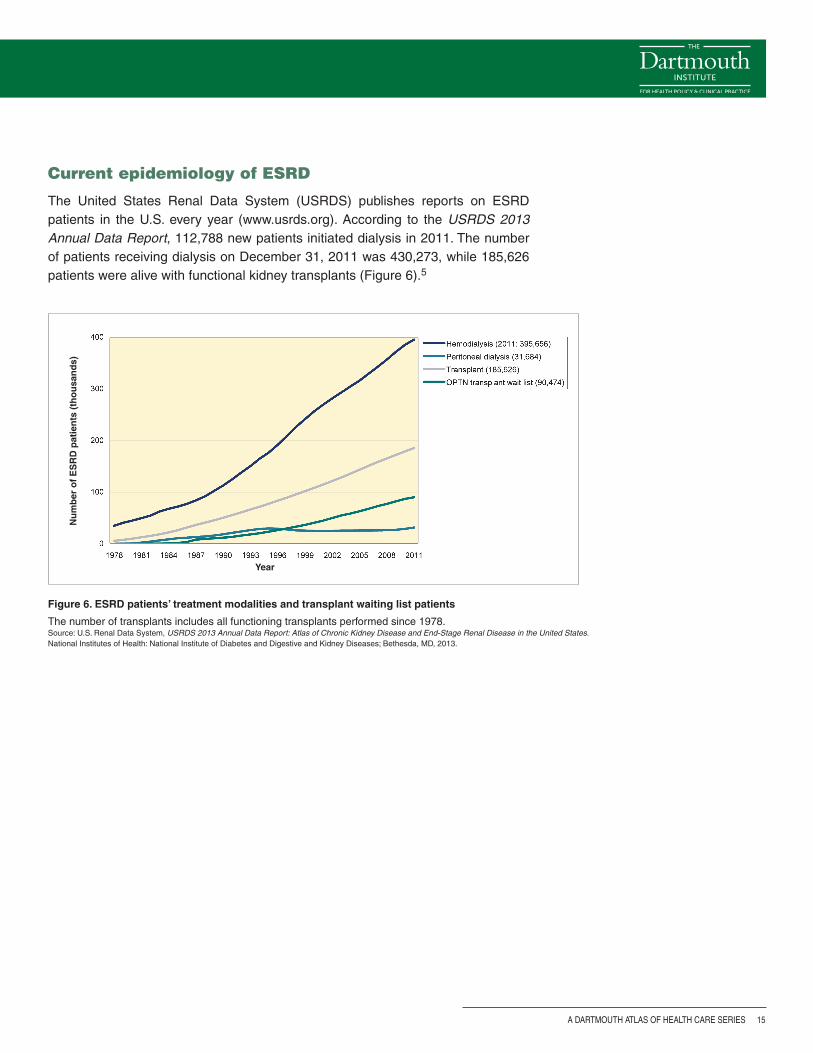
Figure 6. ESRD patients’ treatment modalities and transplant waiting list patients
The number of transplants includes all functioning transplants performed since 1978. Source: U.S. Renal Data System, USRDS 2013 Annual Data Report: Atlas of Chronic Kidney Disease and End-Stage Renal Disease in the United States. National Institutes of Health: National Institute of Diabetes and Digestive and Kidney Diseases; Bethesda, MD, 2013.
Current epidemiology of ESRD
The United States Renal Data System (USRDS) publishes reports on ESRD patients in the U.S. every year (www.usrds.org). According to the USRDS 2013 Annual Data Report, 112,788 new patients initiated dialysis in 2011. The number of patients receiving dialysis on December 31, 2011 was 430,273, while 185,626 patients were alive with functional kidney transplants (Figure 6).5
Year
Nu
mb
er o
f E
SR
D p
atie
nts
(th
ou
san
ds)
A Dartmouth Atlas of Health Care Series
16 vARIATION IN THE CASE OF SURGICAL CONDITIONS: END-STAGE RENAL DISEASE
Per
cen
t o
f M
edic
are
ben
efici
arie
s w
ith
ES
RD
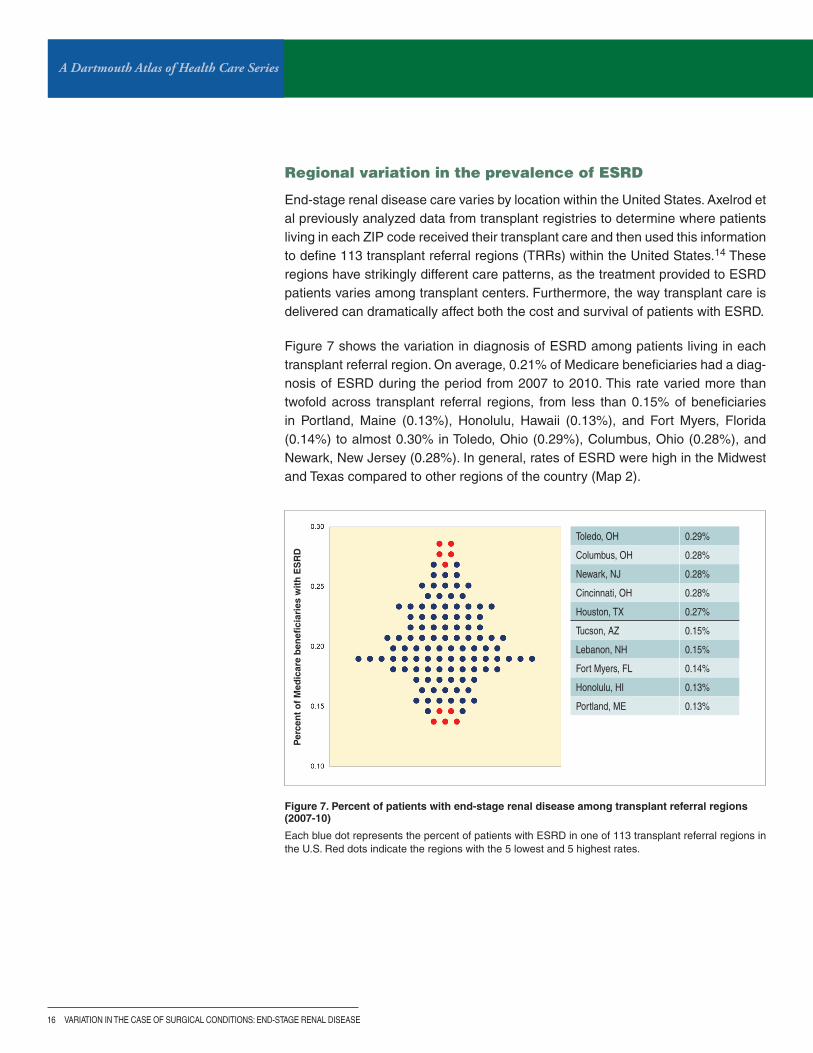
Regional variation in the prevalence of ESRD
End-stage renal disease care varies by location within the United States. Axelrod et al previously analyzed data from transplant registries to determine where patients living in each ZIP code received their transplant care and then used this information to define 113 transplant referral regions (TRRs) within the United States.14 These regions have strikingly different care patterns, as the treatment provided to ESRD patients varies among transplant centers. Furthermore, the way transplant care is delivered can dramatically affect both the cost and survival of patients with ESRD.
Figure 7 shows the variation in diagnosis of ESRD among patients living in each transplant referral region. On average, 0.21% of Medicare beneficiaries had a diag-nosis of ESRD during the period from 2007 to 2010. This rate varied more than twofold across transplant referral regions, from less than 0.15% of beneficiaries in Portland, Maine (0.13%), Honolulu, Hawaii (0.13%), and Fort Myers, Florida (0.14%) to almost 0.30% in Toledo, Ohio (0.29%), Columbus, Ohio (0.28%), and Newark, New Jersey (0.28%). In general, rates of ESRD were high in the Midwest and Texas compared to other regions of the country (Map 2).
Figure 7. Percent of patients with end-stage renal disease among transplant referral regions (2007-10)
Each blue dot represents the percent of patients with ESRD in one of 113 transplant referral regions in the U.S. Red dots indicate the regions with the 5 lowest and 5 highest rates.
Toledo, OH 0.29%
Columbus, OH 0.28%
Newark, NJ 0.28%
Cincinnati, OH 0.28%
Houston, TX 0.27%
Tucson, AZ 0.15%
Lebanon, NH 0.15%
Fort Myers, FL 0.14%
Honolulu, HI 0.13%
Portland, ME 0.13%

A DARTMOUTH ATLAS OF HEALTH CARE SERIES 17
Map 2. Percent of patients with end-stage renal disease (2007-10)
Rates are adjusted for age, sex, and race.
A Dartmouth Atlas of Health Care Series
18 vARIATION IN THE CASE OF SURGICAL CONDITIONS: END-STAGE RENAL DISEASE
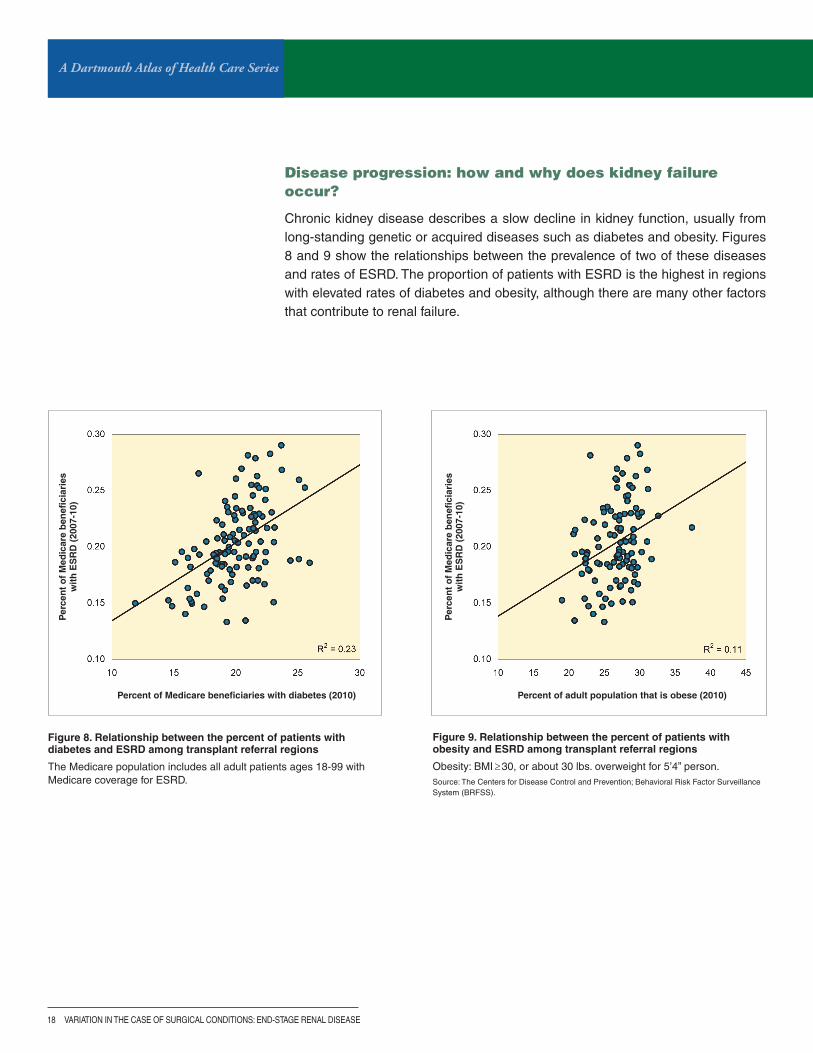
Disease progression: how and why does kidney failure occur?
Chronic kidney disease describes a slow decline in kidney function, usually from long-standing genetic or acquired diseases such as diabetes and obesity. Figures 8 and 9 show the relationships between the prevalence of two of these diseases and rates of ESRD. The proportion of patients with ESRD is the highest in regions with elevated rates of diabetes and obesity, although there are many other factors that contribute to renal failure.
Figure 8. Relationship between the percent of patients with diabetes and ESRD among transplant referral regions
The Medicare population includes all adult patients ages 18-99 with Medicare coverage for ESRD.
Figure 9. Relationship between the percent of patients with obesity and ESRD among transplant referral regions
Obesity: BMI≥30, or about 30 lbs. overweight for 5’4” person.Source: The Centers for Disease Control and Prevention; Behavioral Risk Factor Surveillance System (BRFSS).
Per
cen
t o
f M
edic
are
ben
efici
arie
s w
ith
ES
RD
(20
07-1
0)
Percent of Medicare beneficiaries with diabetes (2010)
Per
cen
t o
f M
edic
are
ben
efici
arie
s w
ith
ES
RD
(20
07-1
0)
Percent of adult population that is obese (2010)

A DARTMOUTH ATLAS OF HEALTH CARE SERIES 19
Who cares for patients with kidney failure?
When chronic kidney failure progresses, patients experience fatigue, nausea, and anorexia, indicating the need for renal replacement therapy. Patients whose kidney function declines to this level require multi-disciplinary counseling and an individu-alized care plan. This process is complex, usually involving a primary care provider, a nephrologist, and a vascular access surgeon, as well as a transplant center in some cases. Each member of the health care team has a distinct yet complemen-tary role, as outlined below:
Primary care provider: Primary care providers, including physicians, nurse prac-titioners, and physician assistants, may be the first to notice signs, symptoms, and laboratory values suggesting renal dysfunction. Often, patients developing kidney disease are already being actively managed for hypertension and diabetes, the two diseases most responsible for nephropathy leading to ESRD in the United States. While controlling these processes is important, early specialist referral is essential.15
Nephrologist: A nephrologist is a medical specialist who cares for patients with kidney dysfunction and failure, managing both acute kidney failure—a rapid decline in kidney function after an illness, surgery, or trauma—and chronic kidney disease. When a patient’s renal failure approaches ESRD, nephrologists administer dialysis treatments and refer patients for transplant evaluation when appropriate.
Dialysis access surgeon: General, vascular, and transplant surgeons may all be credentialed to place vascular access, including arteriovenous (AV) fistulas, AV grafts, hemodialysis catheters, and peritoneal dialysis catheters. Patients may require additional treatments to maintain the chosen dialysis modality, such as angioplasty or stent placement to preserve function in failing AV fistulas or grafts; such procedures are performed by vascular surgeons or interventional radiologists.
Transplant center team: Transplant centers’ multidisciplinary teams include sur-geons, nephrologists, social workers, nurse coordinators, and dieticians. Each plays a role along the path of organ transplantation, including pre-transplant social and medical assessment, ESRD care management while awaiting a kidney, per-forming the surgery, and adjusting medications post-operatively. Transplant centers are generally based within tertiary care academic hospitals.
A Dartmouth Atlas of Health Care Series
20 vARIATION IN THE CASE OF SURGICAL CONDITIONS: END-STAGE RENAL DISEASE
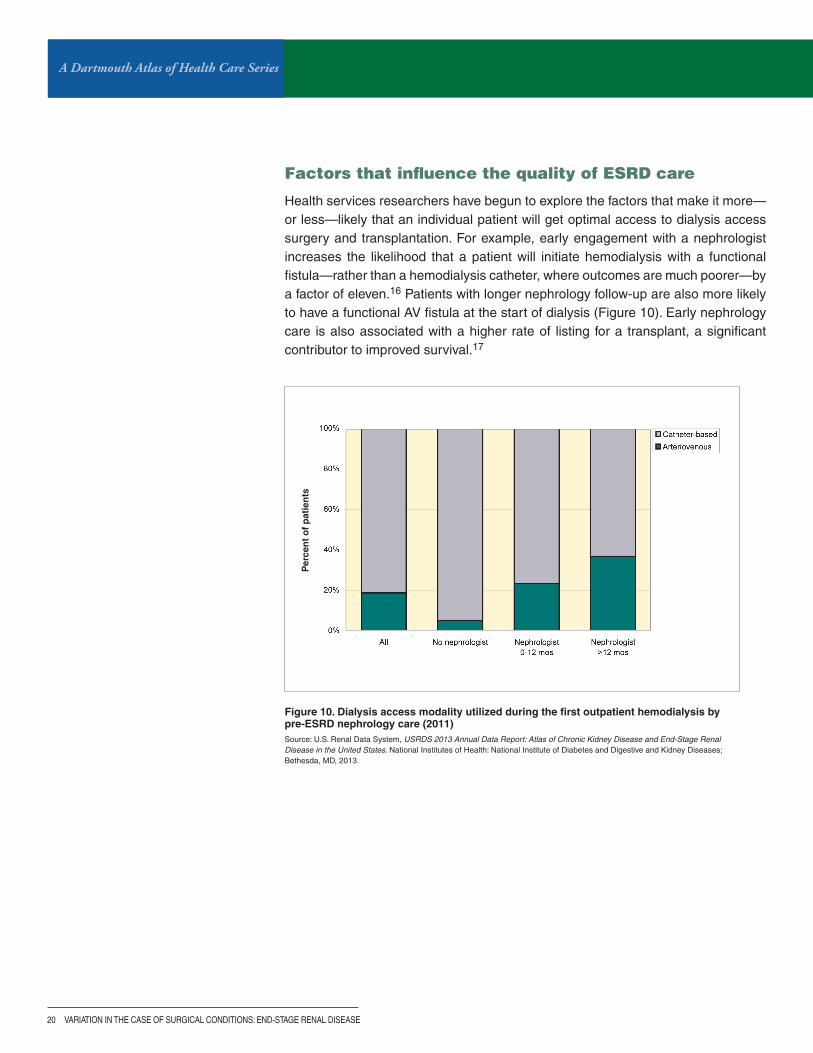
Figure 10. Dialysis access modality utilized during the first outpatient hemodialysis by pre-ESRD nephrology care (2011)Source: U.S. Renal Data System, USRDS 2013 Annual Data Report: Atlas of Chronic Kidney Disease and End-Stage Renal Disease in the United States. National Institutes of Health: National Institute of Diabetes and Digestive and Kidney Diseases; Bethesda, MD, 2013.
Per
cen
t o
f p
atie
nts
Factors that influence the quality of ESRD care
Health services researchers have begun to explore the factors that make it more—or less—likely that an individual patient will get optimal access to dialysis access surgery and transplantation. For example, early engagement with a nephrologist increases the likelihood that a patient will initiate hemodialysis with a functional fistula—rather than a hemodialysis catheter, where outcomes are much poorer—by a factor of eleven.16 Patients with longer nephrology follow-up are also more likely to have a functional AV fistula at the start of dialysis (Figure 10). Early nephrology care is also associated with a higher rate of listing for a transplant, a significant contributor to improved survival.17

A DARTMOUTH ATLAS OF HEALTH CARE SERIES 21
Per
cen
t re
ceiv
ing
kid
ney
tra
nsp
lan
t
Percent of ESRD patients using AV fistulas
Despite recommendations from the National Kidney Foundation, most patients start dialysis with catheters, the least effective and least safe access method. More than 70% of new patients—about 80,000 people—resorted to this strategy in 2011.5 Patients who initiate dialysis with catheters have poorer long-term survival than patients who initiate dialysis with AV fistulas, and these patients are less likely to be treated with kidney transplantation. The positive correlation between the use of AV fistulas and transplantation (Figure 11) may be a result of greater care coordina-tion, including the early involvement of a nephrologist.
Figure 11. Relationship between rates of incident AV fistula use and kidney transplantation among transplant referral regions (2007-10)

A Dartmouth Atlas of Health Care Series
22 vARIATION IN THE CASE OF SURGICAL CONDITIONS: END-STAGE RENAL DISEASE
As outlined in this report, patients with ESRD face difficult decisions regarding their care. Resources available to help patients and their loved ones navi-gate the healthcare system and make well-informed decisions include:
Explore Transplant: exploretransplant.org
The National Kidney Foundation: www.kidney.org/atoz/content/kidneytransnewlease
Kidney Link: www.kidneylink.org
The National Institute of Diabetes and Digestive and Kidney Diseases: kidney.niddk.nih.gov/kudis-eases/pubs/transplant/
Decision quality and shared decision-making
The most important decision ESRD patients face is choosing to either continue dialysis or to receive a transplant. Patients and their families are often anxious about transplantation surgery. The initiative Explore Transplant (www.exploretransplant.org) is a comprehensive patient education program designed to help ESRD patients make well-informed decisions about ESRD care. The program also offers an education module for dialysis providers to facilitate relationships between dialysis and transplant centers and to promote early patient education and referral for transplant evaluation. A separate module educates potential living organ donors about the risks and outcomes of organ donation.
Additional tools are available to help answer patients’ questions about renal disease and assess values and preferences related to their care. The Option Grid, shown in Figure 13, is one such decision aid. These tools are starting points to help patients better understand ESRD therapy options.
Figure 12. Conceptual model for decision support process

A DARTMOUTH ATLAS OF HEALTH CARE SERIES 23
Fig
ure 13. O
ptio
n g
rid fo
r chro
nic kid
ney d
iseaseS
ource: The O
ption Grid C
ollaborative (ww
w.optiongrid.org).

A Dartmouth Atlas of Health Care Series
24 vARIATION IN THE CASE OF SURGICAL CONDITIONS: END-STAGE RENAL DISEASE
During surgeryIn general, vascular access procedures are performed on an outpatient basis. How-ever, patients are occasionally admitted following more extensive surgery. Further, patients often have to wait several days to several weeks before vascular access connections are useable for dialysis, which further complicates the timing and care of these very ill patients.
Arteriovenous fistulas
Patients diagnosed with ESRD require a surgical procedure to allow blood stream access for dialysis therapy or transplantation. AV fistulas and grafts create con-nections between arteries and veins to create high-flow access sites protected by the skin. Access to the blood stream using this method is achieved by insert-ing two needles through the skin into the conduit connecting the blood vessels to withdraw and return blood (Figure 4). The National Kidney Foundation-Kidney Dis-ease Outcomes Quality Initiative (NKF-KDOQI) Practice Guideline 2 recommends autogenous fistulas—those using a patient’s own veins—rather than artificial grafts, because the natural fistulas last longer and are less prone to degeneration and infection.13 For patients who cannot undergo fistula placement, or who do not have a working fistula, hemodialysis catheters are inserted through the skin into large central veins (Figure 5). Patients who choose to receive peritoneal dialysis (PD) require placement of a PD catheter (a tube to carry the fluid) in the abdomen.
Ensuring access to the best surgical treatments for patients with ESRD—especially methods such as fistulas—can be challenging given the complexity of caring for this very ill population. As a result, there is significant variation in the use of these procedures across the United States. Use of AV fistulas varied nearly fourfold across transplant referral regions during the period from 2007 to 2010, from less than 8% of ESRD patients in Lubbock, Texas (6.4%), El Paso, Texas (7.0%), and Jacksonville, Florida (7.6%) to more than 20% in Honolulu, Hawaii (24.4%), Portland, Maine (23.7%), and Springfield, Massachusetts (22.3%) (Figure 14). The national average was 13%. Rates of AV fistula use were generally higher in the Northwest and New England than in other regions of the country (Map 3).

A DARTMOUTH ATLAS OF HEALTH CARE SERIES 25
Map 3. Percent of ESRD patients using AV fistulas (2007-10)
Rates are unadjusted.
Figure 14. Percent of ESRD patients using AV fistulas among transplant referral regions (2007-10)
Each blue dot represents the percent of ESRD patients using AV fistulas in one of 113 transplant referral regions in the U.S. Red dots indicate the regions with the 5 lowest and 5 highest rates.
Per
cen
t o
f E
SR
D p
atie
nts
usi
ng
AV
fist
ula
s
Honolulu, HI 24.4%
Portland, ME 23.7%
Springfield, MA 22.3%
Lebanon, NH 21.4%
Portland, OR 20.8%
Toledo, OH 7.6%
Little Rock, AR 7.6%
Jacksonville, FL 7.6%
El Paso, TX 7.0%
Lubbock, TX 6.4%
A Dartmouth Atlas of Health Care Series
26 vARIATION IN THE CASE OF SURGICAL CONDITIONS: END-STAGE RENAL DISEASE
Kidney transplantation
When available, kidney transplantation offers better quality of life, increased sur-vival, and lower cost for most patients compared to continued dialysis. This surgery involves two procedures, one for the donor and one for the recipient. Kidney donors can be either living or deceased. Live donor kidneys are removed through small inci-sions, with guidance from a camera. Deceased donor organs are recovered from patients who suffer devastating brain injuries, and are generally retrieved along with multiple other organs. Donor kidneys are surgically attached to the artery and vein supplying the leg and pelvis (Figure 3). Next, the ureter is connected directly to the bladder. Patients generally stay in the hospital fewer than four days.
For several reasons, not every ESRD patient is able to receive a transplant. Patients’ medical comorbidities are a major limitation, as is organ availability; the number of ESRD patients outstrips the donor organ supply. Growing demand has increased waiting list lengths, leading to innovative approaches aimed at increasing trans-plant rates, as well as attempts to make hemodialysis safer.
Living donor versus deceased donor transplant
Every year, more than 6,000 ESRD patients are able to find friends or family members willing to donate a kidney for transplant. Living donor kidney transplant recipients have the longest survival and the most frequent immediate organ func-tion, as well as flexibility in surgical scheduling. Kidney donors need compatible, though not identical, blood types. They are evaluated to ensure normal pre-donation kidney function, the absence of risk factors for chronic kidney disease—includ-ing diabetes or uncontrolled high blood pressure—and normal kidney anatomy. Counseling ensures that both donors and recipients understand that organ gifts are voluntary. Finally, the potential donors and recipients are carefully cross-matched to prevent organ rejection.
Access to living donor transplant also depends on transplant center practices. Some programs are more proactive in seeking and supporting living donation than others. On average, 3.3% of ESRD patients received transplants from living donors within two years of first dialysis during the period from 2007 to 2010. There was more than tenfold variation across transplant referral regions, from about 1% of ESRD patients in Shreveport, Louisiana (1.1%), Augusta, Georgia (1.2%), and Charleston, West Virginia (1.2%) to about 10% of ESRD patients in the Minnesota regions of Rochester (10.1%) and Minneapolis (9.9%) (Figure 15). On average, rates were lower in the Southeast and in southern California than in other parts of the country (Map 4).

A DARTMOUTH ATLAS OF HEALTH CARE SERIES 27
Rochester, MN 10.1%
Minneapolis, MN 9.9%
Lebanon, NH 8.5%
Salt Lake City, UT 7.1%
Boston, MA 6.9%
Las vegas, Nv 1.3%
Jacksonville, FL 1.3%
Charleston, Wv 1.2%
Augusta, GA 1.2%
Shreveport, LA 1.1%
Figure 15. Percent of ESRD patients receiving living donor transplants within two years of starting dialysis among transplant referral regions (2007-10)
Each blue dot represents the percent of ESRD patients receiving living donor transplants within two years of starting dialysis in one of 113 transplant referral regions in the U.S. Red dots indicate the regions with the 5 lowest and 5 highest rates.
Map 4. Percent of ESRD patients receiving living donor transplants within two years of starting dialysis (2007-10)
Rates are unadjusted.
Per
cen
t re
ceiv
ing
livi
ng
do
no
r tr
ansp
lan
ts w
ith
in t
wo
yea
rs

A Dartmouth Atlas of Health Care Series
28 vARIATION IN THE CASE OF SURGICAL CONDITIONS: END-STAGE RENAL DISEASE
Patients unable to identify a living kidney donor are listed with the United Network for Organ Sharing (UNOS), which administrates the national Organ Procurement and Transplantation Network (OPTN). Deceased donor kidneys are allocated to patients based on criteria established by UNOS under the direction of the Health Services and Resources Administration (HRSA) division of the U.S. Department of Health and Human Services. Under current kidney allocation rules, blood type, wait time, match difficulty related to antibody sensitization, and need for other simul-taneous, non-renal organ transplants are evaluated. Donor kidneys are initially offered to patients locally, and are only shared more broadly if local transplant centers decline the organs. Consequently, there is significant variation in deceased donor kidney transplant rates due to differences in local and regional organ supply, waiting list size, and organ acceptance decisions (Figure 16).18 Similarly, average waiting times vary significantly across donation service areas, varying from less than 19 months to more than 37 months.19
Figure 16. Deceased donor kidney transplant rates among active adult candidates, by donor service area (2011-12)
Transplant rates are given by donor service area of the listing center, limited to those with active time on the waiting list in 2011 and 2012. Maximum time per listing is two years. Source: 2004 Annual Report of the U.S. Organ Procurement and Transplantation Network and the Scientific Registry of Transplant Recipients: Transplant Data 1994-2003. Department of Health and Human Services, Health Resources and Services Administration, Healthcare Systems Bureau, Division of Transplantation, Rockville, MD; United Network for Organ Sharing, Richmond, VA; University Renal Research and Education Association, Ann Arbor, MI.
Options for patients without a compatible kidney donor
Frequently, patients are able to iden-tify a willing donor whose blood type or immunologic profile would preclude transplant. However, several options now exist, including paired donor exchange. In these programs, two or more donor-recipient pairs with incom-patible cross-matches are grouped so that compatible organs can be shared. Drs. Segev and Gentry creat-ed a mathematical model to apportion kidneys among incompatible ESRD patients and their donors across multiple centers.20 Paired donation accounted for 10%—approximately 500—of the living donor kidney trans-plants in 2011, a significant increase since the exchange programs were initiated ten years ago.21 At this writ-ing, the longest open chain in the United States was under way at the University of Alabama, where twenty-one people received kidney paired donations.22
Donor service area (N=58)
Dec
ease
d d
on
or
kid
ney
tra
nsp
lan
t ra
tes
per
10
0 p
atie
nt
year
s o
n t
he
wai
tin
g li
st

A DARTMOUTH ATLAS OF HEALTH CARE SERIES 29
How long will patients live without a transplant?
In general, patients do not live for a long time without transplantation if they simply remain on dialysis. Their overall five-year mortality rate is 47%, meaning that fewer than one in two are still alive within five years of starting dialysis; and, as a result of the long waiting period for transplant, unfortunately, many people on a waiting list for transplantation die prior to receiving a kidney. Long-term survival is even less likely for patients whose age or medical condition preclude transplant. Among patients deemed to ill to undergo transplantation, nearly half—44%—will die within the first year of starting dialysis (Figure 17).
Figure 17. Risk of mortality within one year of starting dialysis without kidney transplant
133 out of 300 (44%).

A Dartmouth Atlas of Health Care Series
30 vARIATION IN THE CASE OF SURGICAL CONDITIONS: END-STAGE RENAL DISEASE
After surgerySurgery—either placing a dialysis access fistula or performing a kidney transplant—is only one aspect of managing ESRD. Long-term success requires cooperation between nephrologists, primary care physicians, and patients in a complex, multi-disciplinary process.
Kidney transplantation requires several days in the hospital to recover, evaluate organ function, and adjust immunosuppressant medications. Following discharge, patients are seen frequently by a surgeon, and later by a transplant nephrolo-gist to manage the medications necessary to prevent rejection. Treating comorbid diseases, such as diabetes and hypertension, helps to protect a patient’s newly transplanted kidney. Patients are often readmitted to the hospital within 30 days of receiving a kidney (Table 3), for reasons such as rejection, medication adjustments, or infection.
Table 3. Percent of ESRD patients receiving kidney transplants within two years of starting dialysis readmitted within 30 days following transplant among transplant referral regions (2007-10)
TRR State Percent readmitted within 30 days following transplant
10 highest TRRs
Wichita KS 81.3%
Augusta GA 78.4%
Greenville NC 77.3%
Allentown PA 75.0%
Fort Worth TX 74.2%
Burlington vT 73.7%
New Haven CT 73.3%
Toledo OH 70.0%
Seattle WA 64.9%
Columbia MO 64.7%
10 lowest TRRs
Sacramento CA 41.9%
Memphis TN 41.7%
Danville PA 41.4%
Tulsa OK 40.7%
Tucson AZ 40.7%
Columbus OH 40.7%
Spokane WA 40.6%
Knoxville TN 40.0%
Fargo/Moorhead MN ND 40.0%
Grand Rapids MI 40.0%
A DARTMOUTH ATLAS OF HEALTH CARE SERIES 31
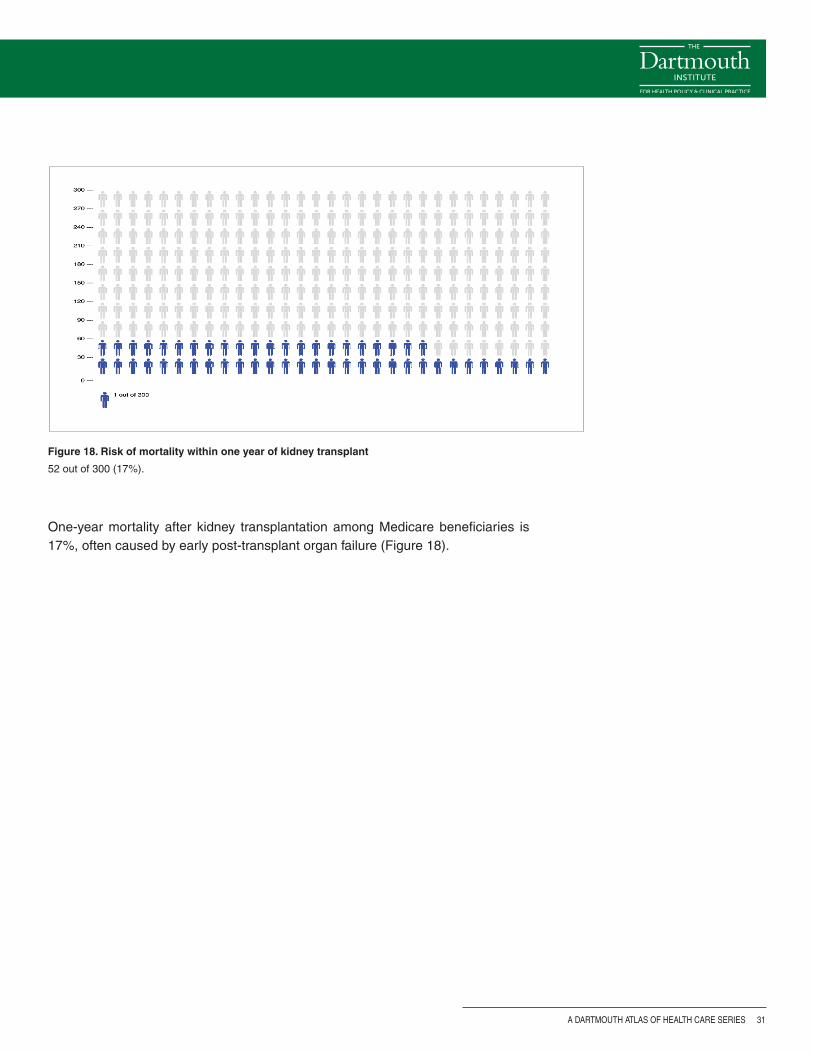
One-year mortality after kidney transplantation among Medicare beneficiaries is 17%, often caused by early post-transplant organ failure (Figure 18).
Figure 18. Risk of mortality within one year of kidney transplant
52 out of 300 (17%).

A Dartmouth Atlas of Health Care Series
32 vARIATION IN THE CASE OF SURGICAL CONDITIONS: END-STAGE RENAL DISEASE
Beyond surgery
Quality initiatives in ESRD care
Priority #1: Increase the use of fistulas rather than catheters
Sustaining patients with kidney failure is an expensive undertaking with two nota-ble shortcomings in current practice. First, most patients initiate dialysis using intravascular catheters, which results in less than optimal survival.23 The Fistula First Breakthrough Initiative, enacted in 2005, increased the frequency with which patients dialyzing with catheters converted to fistulas.8 However, there has been minimal improvement in incident fistula frequency; it increased from 13% to 15% between 2005 and 2010.24 Policy changes aimed at physician awareness appear to have had little effect on this trend. Federal reimbursement policy may be the root cause; Medicare reimburses patients for ESRD-related medical expenses three months after beginning chronic dialysis at a clinic or one month after beginning in-home therapy.25 Pre-emptive fistula creation is not covered,26 even though trans-plant recipients receive retroactive coverage for costs incurred up to two months prior to surgery.26,27 Revising Medicare dialysis access provisions to mirror trans-plant policy would incentivize improvement in current practices.
Priority #2: Prioritize the most cost-effective treatments
Kidney transplants and fistulas not only improve outcomes; they also save money. In 2011, 430,273 patients comprised the prevalent hemodialysis population.5 The estimated cost differential to dialyze a patient with a catheter, as opposed to a fistula, for one year is $23,808: $127,677 versus $103,869 in 2006 dollars.28 With the ESRD population reaching 430,000, 80% of which employed catheter-based access at some point in their care, an enormous potential savings exists. Fistula creation is technically challenging, but clearly represents a laudable goal for both improving outcomes and providing cost-effective care for patients with ESRD.
Further, transplantation should be emphasized whenever possible. Data from the USRDS 2013 Annual Data Report describe a distinct cost advantage to transplan-tation over dialysis. Medicare expenditures for hemodialysis were $34.3 billion in 2010—6.2% of the total Medicare budget—or $87,945 per person per year. Com-parative renal transplant costs were $2.8 billion, or $32,922 per person per year.5
Transplant costs are amortized over the organ’s functional life span. The break-even point between living donor kidney transplant and dialysis is 2.3 years, while that for deceased donor kidney transplant and dialysis is 3.6 years.29 Quality-of-life parameters are not factored into this assessment. When they are included, the Medicare savings is projected to be about $270,000 per transplant in comparison to dialysis.30

A DARTMOUTH ATLAS OF HEALTH CARE SERIES 33
High-quality, coordinated ESRD care is evident when patients start dialysis with a fistula and the best candidates receive transplants. These data provide an impor-tant emphasis for the second priority: evidence-based transplant care centered on multidisciplinary care coordination and effective, lower-cost treatments, leading to better outcomes for patients.
Priority #3: Emphasize new technology for organ supply and vascular access
The limited donor organ supply restricts transplantation, contributing to excess ESRD-related mortality. Recently, the organ allocation system for deceased donor kidneys has been revised to consider donor age; donor kidneys from younger patients demonstrated improved performance when matched to younger recipi-ents.31 The donor pool has also been expanded with organ preservation pumps, which maintain blood flow in organs during transport, particularly kidneys donated after cardiac death. Overall, donation of organs per 100 eligible deaths increased from 69 to 73 between 2009 and 2012.32
Regenerative medicine offers another hopeful direction. American and Italian sci-entists have removed cells from pig kidneys, while retaining the fiber lattices that support the organ’s shape and blood vessel networks.33,34 Subsequent work by the same American group at Wake Forest University in Winston-Salem, North Carolina replicated this technique with a human kidney.33 A functional organ fit for transplan-tation is not yet available, but research efforts continue.
Novel technologies are also being developed for dialysis patients. Rather than resorting to synthetic materials, like polyester or polytetrafluoroethylene, current studies are examining the safety of tissue-engineered vascular grafts to use in dialysis.35 Not all ESRD patients have adequate veins for AV fistula creation. For these patients, bioengineered tissues could provide a better-functioning alternative to polymer grafts. Finally, Fissell and colleagues at Vanderbilt University in Nash-ville, Tennessee envision wearable or implantable continuous dialysis devices that would serve as mechanical alternatives to renal transplant.36
Conclusion
Transplantation is the most efficacious and cost-effective therapy for patients suf-fering from end-stage renal disease. Applying cost-effective, high-quality care strategies—such as early provision of AV fistulas to patients—requires an integrat-ed and coordinated approach. The best care saves lives and money, a philosophy worth disseminating and implementing in caring for patients everywhere.
A Dartmouth Atlas of Health Care Series
34 vARIATION IN THE CASE OF SURGICAL CONDITIONS: END-STAGE RENAL DISEASE
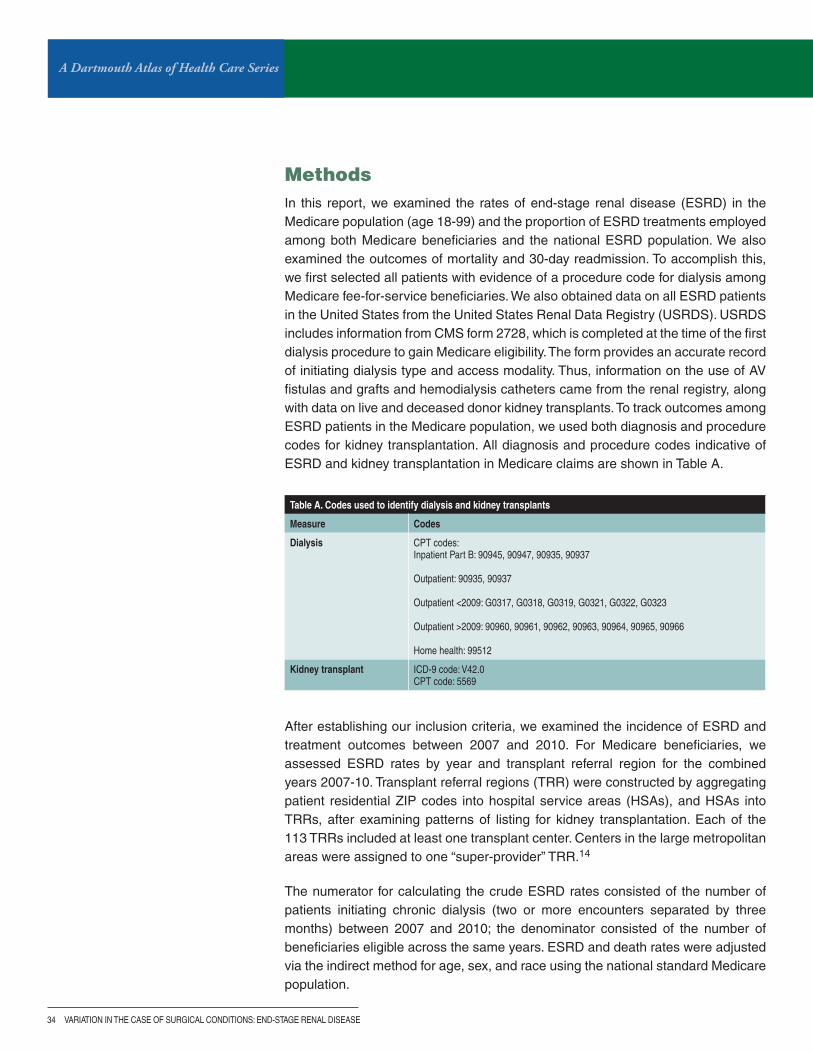
MethodsIn this report, we examined the rates of end-stage renal disease (ESRD) in the Medicare population (age 18-99) and the proportion of ESRD treatments employed among both Medicare beneficiaries and the national ESRD population. We also examined the outcomes of mortality and 30-day readmission. To accomplish this, we first selected all patients with evidence of a procedure code for dialysis among Medicare fee-for-service beneficiaries. We also obtained data on all ESRD patients in the United States from the United States Renal Data Registry (USRDS). USRDS includes information from CMS form 2728, which is completed at the time of the first dialysis procedure to gain Medicare eligibility. The form provides an accurate record of initiating dialysis type and access modality. Thus, information on the use of AV fistulas and grafts and hemodialysis catheters came from the renal registry, along with data on live and deceased donor kidney transplants. To track outcomes among ESRD patients in the Medicare population, we used both diagnosis and procedure codes for kidney transplantation. All diagnosis and procedure codes indicative of ESRD and kidney transplantation in Medicare claims are shown in Table A.
Table A. Codes used to identify dialysis and kidney transplants
Measure Codes
Dialysis CPT codes: Inpatient Part B: 90945, 90947, 90935, 90937 Outpatient: 90935, 90937 Outpatient <2009: G0317, G0318, G0319, G0321, G0322, G0323 Outpatient >2009: 90960, 90961, 90962, 90963, 90964, 90965, 90966 Home health: 99512
Kidney transplant ICD-9 code: v42.0 CPT code: 5569
After establishing our inclusion criteria, we examined the incidence of ESRD and treatment outcomes between 2007 and 2010. For Medicare beneficiaries, we assessed ESRD rates by year and transplant referral region for the combined years 2007-10. Transplant referral regions (TRR) were constructed by aggregating patient residential ZIP codes into hospital service areas (HSAs), and HSAs into TRRs, after examining patterns of listing for kidney transplantation. Each of the 113 TRRs included at least one transplant center. Centers in the large metropolitan areas were assigned to one “super-provider” TRR.14
The numerator for calculating the crude ESRD rates consisted of the number of patients initiating chronic dialysis (two or more encounters separated by three months) between 2007 and 2010; the denominator consisted of the number of beneficiaries eligible across the same years. ESRD and death rates were adjusted via the indirect method for age, sex, and race using the national standard Medicare population.

A DARTMOUTH ATLAS OF HEALTH CARE SERIES 35
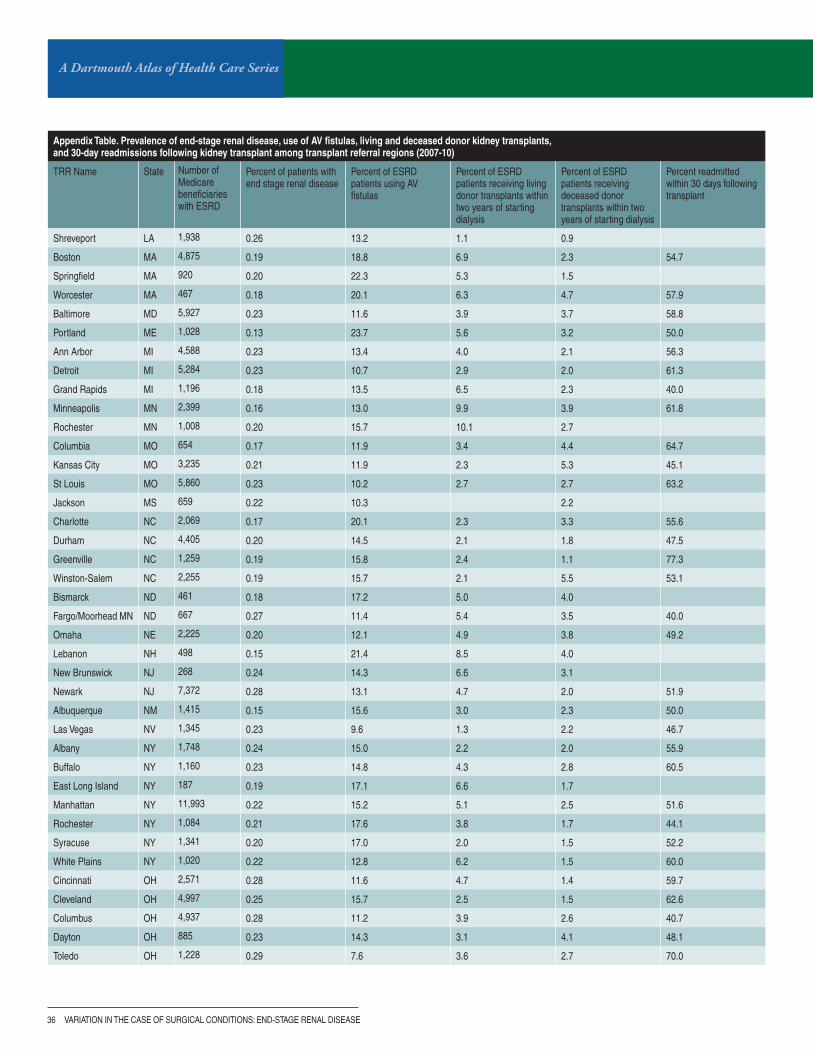
Appendix Table. Prevalence of end-stage renal disease, use of AV fistulas, living and deceased donor kidney transplants, and 30-day readmissions following kidney transplant among transplant referral regions (2007-10)
TRR Name State Number of Medicare beneficiaries with ESRD
Percent of patients with end stage renal disease
Percent of ESRD patients using Av fistulas
Percent of ESRD patients receiving living donor transplants within two years of starting dialysis
Percent of ESRD patients receiving deceased donor transplants within two years of starting dialysis
Percent readmitted within 30 days following transplant
Birmingham AL 8,451 0.20 14.1 2.4 1.7 43.1
Little Rock AR 3,421 0.19 7.6 1.6 3.6 45.0
Phoenix AZ 692 0.19 14.9 6.4 2.9
Sun City AZ 2,220 0.19 12.0 4.8 2.2 63.5
Tucson AZ 616 0.15 18.9 4.0 4.0 40.7
Los Angeles CA 10,361 0.21 10.7 2.0 1.0 49.3
Orange County CA 905 0.20 12.4 3.1 1.0 60.0
Sacramento CA 1,217 0.17 15.3 3.8 1.9 41.9
San Bernardino CA 2,050 0.21 10.0 1.9 1.3 43.5
San Diego CA 1,912 0.19 12.8 4.3 2.7 48.0
San Francisco CA 7,771 0.18 14.5 3.2 2.1 48.1
San Jose CA 222 0.15 14.0 5.4 1.9
Santa Rosa CA 61 0.20 2.4
Denver CO 2,378 0.15 18.2 6.6 3.6 47.2
Hartford CT 1,637 0.20 15.5 4.8 1.9 50.0
New Haven CT 1,469 0.19 17.5 4.8 2.1 73.3
Washington DC 4,080 0.21 12.0 4.4 2.3 59.1
Fort Myers FL 859 0.14 12.1 2.2 2.4 63.2
Gainesville FL 3,371 0.19 13.5 2.0 3.6 51.3
Jacksonville FL 561 0.26 7.6 1.3 3.0
Miami FL 4,949 0.21 9.1 2.0 2.7 44.4
Orlando FL 2,649 0.22 9.9 1.8 3.1 57.4
Ormond Beach FL 1,148 0.26 12.0 2.2 2.9 55.9
Tampa FL 3,953 0.18 10.2 1.9 3.0 55.6
Atlanta GA 7,300 0.21 11.5 2.0 1.8 53.2
Augusta GA 1,592 0.20 12.1 1.2 1.3 78.4
Honolulu HI 991 0.13 24.4 2.3 1.0
Des Moines IA 634 0.19 13.5 6.0 4.3 42.3
Iowa City IA 1,578 0.18 20.3 4.5 3.8 56.0
Chicago IL 10,754 0.23 9.3 4.0 2.3 54.0
Peoria IL 742 0.16 17.9 6.4 3.9 48.4
Springfield IL 621 0.21 14.1 2.8 2.6
Indianapolis IN 6,293 0.25 10.7 3.6 2.9 57.7
Wichita KS 895 0.16 13.5 3.5 2.2 81.3
Lexington KY 2,395 0.25 12.5 2.9 3.8 50.0
Louisville KY 2,534 0.22 16.2 1.5 3.1 42.2
New Orleans LA 4,931 0.23 14.4 1.6 2.7 53.0
Rates of ESRD are adjusted for age, sex, and race. The percent using AV fistulas and the percent receiving living and deceased donor transplants are unadjusted. Blank cells indicate that the rate was suppressed due to a small number of events occurring in the region during the study period.
A Dartmouth Atlas of Health Care Series
36 vARIATION IN THE CASE OF SURGICAL CONDITIONS: END-STAGE RENAL DISEASE
Appendix Table. Prevalence of end-stage renal disease, use of AV fistulas, living and deceased donor kidney transplants, and 30-day readmissions following kidney transplant among transplant referral regions (2007-10)
TRR Name State Number of Medicare beneficiaries with ESRD
Percent of patients with end stage renal disease
Percent of ESRD patients using Av fistulas
Percent of ESRD patients receiving living donor transplants within two years of starting dialysis
Percent of ESRD patients receiving deceased donor transplants within two years of starting dialysis
Percent readmitted within 30 days following transplant
Shreveport LA 1,938 0.26 13.2 1.1 0.9
Boston MA 4,875 0.19 18.8 6.9 2.3 54.7
Springfield MA 920 0.20 22.3 5.3 1.5
Worcester MA 467 0.18 20.1 6.3 4.7 57.9
Baltimore MD 5,927 0.23 11.6 3.9 3.7 58.8
Portland ME 1,028 0.13 23.7 5.6 3.2 50.0
Ann Arbor MI 4,588 0.23 13.4 4.0 2.1 56.3
Detroit MI 5,284 0.23 10.7 2.9 2.0 61.3
Grand Rapids MI 1,196 0.18 13.5 6.5 2.3 40.0
Minneapolis MN 2,399 0.16 13.0 9.9 3.9 61.8
Rochester MN 1,008 0.20 15.7 10.1 2.7
Columbia MO 654 0.17 11.9 3.4 4.4 64.7
Kansas City MO 3,235 0.21 11.9 2.3 5.3 45.1
St Louis MO 5,860 0.23 10.2 2.7 2.7 63.2
Jackson MS 659 0.22 10.3 2.2
Charlotte NC 2,069 0.17 20.1 2.3 3.3 55.6
Durham NC 4,405 0.20 14.5 2.1 1.8 47.5
Greenville NC 1,259 0.19 15.8 2.4 1.1 77.3
Winston-Salem NC 2,255 0.19 15.7 2.1 5.5 53.1
Bismarck ND 461 0.18 17.2 5.0 4.0
Fargo/Moorhead MN ND 667 0.27 11.4 5.4 3.5 40.0
Omaha NE 2,225 0.20 12.1 4.9 3.8 49.2
Lebanon NH 498 0.15 21.4 8.5 4.0
New Brunswick NJ 268 0.24 14.3 6.6 3.1
Newark NJ 7,372 0.28 13.1 4.7 2.0 51.9
Albuquerque NM 1,415 0.15 15.6 3.0 2.3 50.0
Las vegas Nv 1,345 0.23 9.6 1.3 2.2 46.7
Albany NY 1,748 0.24 15.0 2.2 2.0 55.9
Buffalo NY 1,160 0.23 14.8 4.3 2.8 60.5
East Long Island NY 187 0.19 17.1 6.6 1.7
Manhattan NY 11,993 0.22 15.2 5.1 2.5 51.6
Rochester NY 1,084 0.21 17.6 3.8 1.7 44.1
Syracuse NY 1,341 0.20 17.0 2.0 1.5 52.2
White Plains NY 1,020 0.22 12.8 6.2 1.5 60.0
Cincinnati OH 2,571 0.28 11.6 4.7 1.4 59.7
Cleveland OH 4,997 0.25 15.7 2.5 1.5 62.6
Columbus OH 4,937 0.28 11.2 3.9 2.6 40.7
Dayton OH 885 0.23 14.3 3.1 4.1 48.1
Toledo OH 1,228 0.29 7.6 3.6 2.7 70.0

A DARTMOUTH ATLAS OF HEALTH CARE SERIES 37
Appendix Table. Prevalence of end-stage renal disease, use of AV fistulas, living and deceased donor kidney transplants, and 30-day readmissions following kidney transplant among transplant referral regions (2007-10)
TRR Name State Number of Medicare beneficiaries with ESRD
Percent of patients with end stage renal disease
Percent of ESRD patients using Av fistulas
Percent of ESRD patients receiving living donor transplants within two years of starting dialysis
Percent of ESRD patients receiving deceased donor transplants within two years of starting dialysis
Percent readmitted within 30 days following transplant
Oklahoma City OK 2,653 0.21 10.1 2.2 2.7 44.0
Tulsa OK 1,172 0.18 13.0 1.8 2.1 40.7
Portland OR 1,908 0.15 20.8 4.3 3.2 57.4
Allentown PA 500 0.22 9.4 2.7 5.0 75.0
Danville PA 848 0.20 15.3 6.3 2.5 41.4
Harrisburg PA 1,504 0.17 10.3 4.1 2.0 54.8
Philadelphia PA 8,070 0.23 13.7 2.9 3.2 48.4
Pittsburgh PA 3,818 0.24 12.6 2.6 2.4 58.6
Providence RI 749 0.19 14.9 4.1 1.4 60.0
Charleston SC 4,403 0.19 14.4 1.8 3.1 48.8
Sioux Falls SD 705 0.15 8.7 6.4 4.2 54.2
Chattanooga TN 677 0.18 18.7 3.0 1.7
Johnson City TN 576 0.17 11.8 2.1 6.2
Knoxville TN 1,455 0.25 12.5 1.8 2.2 40.0
Memphis TN 3,087 0.23 9.8 1.5 2.2 41.7
Nashville TN 2,128 0.18 13.7 3.3 2.8 53.6
Austin TX 900 0.18 13.1 4.3 2.1 45.8
Dallas TX 4,854 0.20 14.5 2.8 3.2 45.0
El Paso TX 601 0.19 7.0 2.1 1.3
Fort Worth TX 1,123 0.23 8.4 2.0 1.7 74.2
Houston TX 6,807 0.27 8.3 2.3 2.2 50.4
Lubbock TX 1,175 0.22 6.4 4.7 2.3
Odessa TX 523 0.25 9.9 1.9 2.1
San Antonio TX 5,713 0.25 10.8 3.2 0.8 52.5
Temple TX 315 0.17 20.6 3.0 3.2
Tyler TX 566 0.19 14.2 1.9 2.9
Salt Lake City UT 1,699 0.16 15.1 7.1 4.8 49.0
Charlottesville vA 2,554 0.22 14.5 3.6 2.4 52.4
Norfolk vA 1,587 0.19 11.5 2.8 1.0 44.7
Richmond vA 2,256 0.19 12.6 3.4 3.0 44.4
Burlington vT 601 0.18 15.2 5.4 7.1 73.7
Seattle WA 4,065 0.15 20.2 4.6 3.4 64.9
Spokane WA 1,000 0.18 18.4 3.6 2.4 40.6
Madison WI 3,030 0.19 15.7 5.9 5.7 50.9
Milwaukee WI 2,216 0.24 14.4 3.3 5.2 45.8
Charleston Wv 1,303 0.27 9.9 1.2 2.1 60.7
Morgantown Wv 38 0.15 20.4 1.9
United States US 282,820 0.21 13.0 3.3 2.5 53.4
Rates of ESRD are adjusted for age, sex, and race. The percent using AV fistulas and the percent receiving living and deceased donor transplants are unadjusted. Blank cells indicate that the rate was suppressed due to a small number of events occurring in the region during the study period.
A Dartmouth Atlas of Health Care Series
38 vARIATION IN THE CASE OF SURGICAL CONDITIONS: END-STAGE RENAL DISEASE
References1. Murray JE, Boston Medical Library. Surgery of the soul: Reflections on a curious career. 1st ed. Canton, MA:
Published for the Boston Medical Library by Science History Publications; 2001.
2. Medawar PB. The immunology of transplantation. Harvey Lectures. 1956 (Series 52):144-176.
3. Wolfe RA, Ashby VB, Milford EL, et al. Comparison of mortality in all patients on dialysis, patients on dialysis awaiting transplantation, and recipients of a first cadaveric transplant. N Engl J Med. Dec 2 1999;341(23):1725-1730.
4. Freeman RB. Liver Allocation. In: Neuberger J FJ, Newsome P. N., ed. Liver Transplantation: Clinical Assessment and Management: Wiley-Blackwell; 2013.
5. USRDS 2013 Annual Data Report: Atlas of End-Stage Renal Disease in the United States. National Institutes of Health, Bethesda, MD: National Institutes of Health Diabetes and Digestive and Kidney Diseases; 2013.
6. Schnitzler MA, Whiting JF, Brennan DC, et al. The life-years saved by a deceased organ donor. Am J Transplant. Sep 2005;5(9):2289-2296.
7. Brescia MJ, Cimino JE, Appel K, Hurwich BJ. Chronic hemodialysis using venipuncture and a surgically created arteriovenous fistula. N Engl J Med. Nov 17 1966;275(20):1089-1092.
8. Lok CE. Fistula first initiative: advantages and pitfalls. Clin J Am Soc Nephrol. Sep 2007;2(5):1043-1053.
9. Berenholtz SM, Pronovost PJ, Lipsett PA, et al. Eliminating catheter-related bloodstream infections in the intensive care unit. Crit Care Med. Oct 2004;32(10):2014-2020.
10. Dhingra RK, Young EW, Hulbert-Shearon TE, Leavey SF, Port FK. Type of vascular access and mortality in U.S. hemodialysis patients. Kidney Int. Oct 2001;60(4):1443-1451.
11. Moist LM, Trpeski L, Na Y, Lok CE. Increased hemodialysis catheter use in Canada and associated mortality risk: data from the Canadian Organ Replacement Registry 2001-2004. Clin J Am Soc Nephrol. Nov 2008;3(6):1726-1732.
12. Fistula First Outcomes Dashboard. Version1.4: http://www.esrdncc.org/index/cms-filesystem-action/fistulafirst2012. Accessed October 24, 2014.
13. KDIGO Clinical Practice Guideline for Acute Kidney Injury. Kidney Int. 2012;2(Suppl 1).
14. Axelrod DA, Lentine KL, Xiao H, et al. Accountability for end-stage organ care: implications of geographic variation in access to kidney transplantation. Surgery. May 2014;155(5):734-742.
15. Smart NA, Dieberg G, Ladhani M, Titus T. Early referral to specialist nephrology services for preventing the progression to end-stage kidney disease. Cochrane Database Syst Rev. 2014;6:CD007333.
16. Zarkowsky DS, Schneider E, Qazi U, Perler BP, Freischlag JA, Malas MB. Racial and Ethnic Disparities in Incident Hemodialysis Access Types: Analysis of the United States Renal Data System. Podium presentation at New England Society for Vascular Surgery; September 28th, 2013; Stowe, VT.
17. Kallab S, Bassil N, Esposito L, Cardeau-Desangles I, Rostaing L, Kamar N. Indications for and barriers to preemptive kidney transplantation: a review. Transplant Proc. Apr 2010;42(3):782-784.
18. Ojo AO, Wolfe RA, Leichtman AB, Dickinson DM, Port FK, Young EW. A practical approach to evaluate the potential donor pool and trends in cadaveric kidney donation. Transplantation. Feb 27 1999;67(4):548-556.
19. Axelrod DA, McCullough KP, Brewer ED, Becker BN, Segev DL, Rao PS. Kidney and pancreas transplantation in the United States, 1999-2008: the changing face of living donation. Am J Transplant. Apr 2010;10(4 Pt 2):987-1002.
20. Segev DL, Gentry SE, Warren DS, Reeb B, Montgomery RA. Kidney paired donation and optimizing the use of live donor organs. JAMA. Apr 20 2005;293(15):1883-1890.
21. Gentry SE, Montgomery RA, Segev DL. Controversies in kidney paired donation. Adv Chronic Kidney Dis. Jul 2012;19(4):257-261.
22. University of Alabama. Celebrating the nation’s longest kidney chain. 2014; http://www.uab.edu/kidneychain/. Accessed August 19, 2014.
23. Malas MB, Hicks CW, Arhuidese IJ, Zarkowsky DS, Qazi U, Schneider EB, Black JH, Segev D, Freischlag JA. Decades after, incident fistulae fall short of recommendations; a current policy concern. JAMA Surgery. (accepted, pending publication) 2014.

A DARTMOUTH ATLAS OF HEALTH CARE SERIES 39
24. Zarkowsky DS, Arhuidese IJ, Schneider E, Qazi U, Black JH, Freischlag JA, Malas MB. Arteriovenous Fistula Cannulation Rate at Index Hemodialysis Increased Over the First Five Years of the Fistula First Breakthrough Initiative. Podium presentation at Society for Clinical Vascular Surgery; March 20, 2014; La Costa Hotel, Carlsbad, CA.
25. Original Medicare (Part A and B) Eligibility and Enrollment. http://www.cms.gov/Medicare/Eligibility-and-Enrollment/OrigMedicarePartABEligEnrol/index.html?redirect=/origmedicarepartabeligenrol/01_overview.asp. Accessed August 11, 2014.
26. DI 11052.001 Initial End-Stage Renal Disease Medicare Cases. Program Operations Manual System: Social Security Administration; 2011.
27. Kimball TA, Barz K, Dimond KR, Edwards JM, Nehler MR. Efficiency of the kidney disease outcomes quality initiative guidelines for preemptive vascular access in an academic setting. J Vasc Surg. Sep 2011;54(3):760-765; discussion 765-766.
28. Solid CA, Carlin C. Timing of arteriovenous fistula placement and Medicare costs during dialysis initiation. Am J Nephrol. 2012;35(6):498-508.
29. Buchanan PM, Lentine KL, Burroughs TE, Schnitzler MA, Salvalaggio PR. Association of lower costs of pulsatile machine perfusion in renal transplantation from expanded criteria donors. Am J Transplant. Nov 2008;8(11):2391-2401.
30. Axelrod DA SM, Freeman R. Organ Specific Benefits of Transplantation: Outcomes and Economics. In: Kirk AD KS, Larsen CP, Madsen JC, Pearson TC, Webber SA, ed. Textbook of Organ Transplantation. Oxford, UK: John Wiley & Sons; 2014.
31. Lee SH, Oh CK, Shin GT, Kim H, Kim SJ, Kim SI. Age matching improves graft survival after living donor kidney transplantation. Transplant Proc. Mar 2014;46(2):449-453.
32. United States Organ Transplantation OPTN & SRTR Annual Data Report. U.S. Department of Health and Human Services, Health Resources and Services Administration: 2013 edition.
33. Katari R, Peloso A, Zambon JP, et al. Renal bioengineering with scaffolds generated from human kidneys. Nephron Exp Nephrol. 2014;126(2):119.
34. Figliuzzi M, Remuzzi G, Remuzzi A. Renal bioengineering with scaffolds generated from rat and pig kidneys. Nephron Exp Nephrol. 2014;126(2):113.
35. Manson RJ, Unger JM, Ali A, Gage SM, Lawson JH. Tissue-engineered vascular grafts: autologous off-the-shelf vascular access? Semin Nephrol. Nov 2012;32(6):582-591.
36. Fissell WH, Roy S, Davenport A. Achieving more frequent and longer dialysis for the majority: wearable dialysis and implantable artificial kidney devices. Kidney Int. Aug 2013;84(2):256-264.


The Dartmouth Atlas Working Group
LeadershipElliott S. Fisher, MD, MPH, Dartmouth Atlas Co-Principal InvestigatorDavid C. Goodman, MD, MS, Dartmouth Atlas Co-Principal InvestigatorJonathan S. Skinner, PhD, Senior ScholarJohn E. Wennberg, MD, MPH, Founder of the Dartmouth AtlasKristen K. Bronner, MA, Managing Editor
Senior Authors and FacultyJohn Erik-Bell, MDShannon Brownlee, MSJulie P.W. Bynum, MD, MPHChiang-Hua Chang, PhDPhilip P. Goodney, MD, MSNancy E. Morden, MD, MPHJeffrey C. Munson, MD, MSThérèse A. Stukel, PhDJames N. Weinstein, DO, MS
Analytic and Administrative StaffThomas A. Bubolz, PhDDonald Carmichael, MDivJulie Doherty, BAJennifer Dong, MSDaniel J. Gottlieb, MSJia Lan, MSMartha K. Lane, MAStephanie R. Raymond, BASandra M. Sharp, SMJeremy Smith, MPHYunjie Song, PhDDean T. Stanley, RHCEYin Su, MSStephanie Tomlin, MPARebecca Zaha, MPHWeiping Zhou, MS
Design and ProductionJonathan Sa’adah and Elizabeth Adams
The Dartmouth Atlas Project works to accurately describe how medical resources are distributed and used in the United States. The project offers comprehensive information and analysis about national, regional, and local markets, as well as individual hospitals and their affiliated physicians, in order to provide a basis for improving health and health systems. Through this analysis, the project has demonstrated glaring variations in how health care is delivered across the United States.
A Report of the Dartmouth Atlas Project
The Dartmouth Atlas Project is funded by the Robert Wood Johnson Foundation and the California Healthcare Foundation.
The Dartmouth AtlasThe Dartmouth Institute for Health Policy and Clinical Practice
Center for Health Policy Research
Contact: Annmarie Christensen (603) 653-0897 [email protected]
www.dartmouthatlas.org
Cover image: Illustration depicting AV fistula during hemodialysis. Blausen.com staff. “Blausen gallery 2014”. Wikiversity Journal of Medicine. DOI:10.15347/wjm/2014.010.
11112014_dap1.2 Copyright 2014 by the Trustees of Dartmouth College