variants of hmms. higher-order hmms how do we model “memory” larger than one time point? p( i+1...
Post on 22-Dec-2015
213 views
TRANSCRIPT

Variants of HMMs
Higher-order HMMs
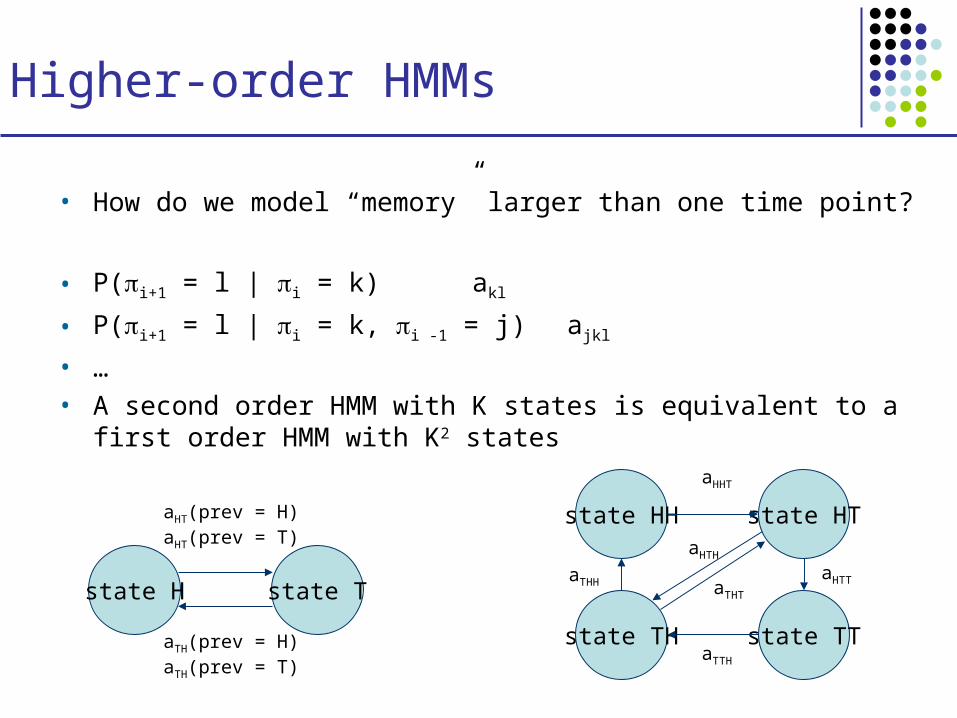
• How do we model “memory” larger than one time point?
• P(i+1 = l | i = k) akl
• P(i+1 = l | i = k, i -1 = j) ajkl
• …• A second order HMM with K states is equivalent to a first order HMM
with K2 states
state H state T
aHT(prev = H)aHT(prev = T)
aTH(prev = H)aTH(prev = T)
state HH state HT
state TH state TT
aHHT
aTTH
aHTTaTHH aTHT
aHTH

Modeling the Duration of States
Length distribution of region X:
E[lX] = 1/(1-p)
• Geometric distribution, with mean 1/(1-p)
This is a significant disadvantage of HMMs
Several solutions exist for modeling different length distributions
X Y
1-p
1-q
p q

Sol’n 1: Chain several states
X Y
1-p
1-q
p
qXX
Disadvantage: Still very inflexible lX = C + geometric with mean 1/(1-p)

Sol’n 2: Negative binomial distribution
Duration in X: m turns, where During first m – 1 turns, exactly n – 1 arrows to next state are followed During mth turn, an arrow to next state is followed
m – 1 m – 1
P(lX = m) = n – 1 (1 – p)n-1+1p(m-1)-(n-1) = n – 1 (1 – p)npm-n
X
p
XX
p
1 – p 1 – p
p
…… Y
1 – p

Example: genes in prokaryotes
• EasyGene:
Prokaryotic
gene-finder
Larsen TS, Krogh A
• Negative binomial with n = 3

Solution 3: Duration modeling
Upon entering a state:
1. Choose duration d, according to probability distribution2. Generate d letters according to emission probs3. Take a transition to next state according to transition probs
Disadvantage: Increase in complexity:
Time: O(D2) -- Why?Space: O(D)
where D = maximum duration of state
X

Connection Between Alignment and HMMs

A state model for alignment
-AGGCTATCACCTGACCTCCAGGCCGA--TGCCC---TAG-CTATCAC--GACCGC-GGTCGATTTGCCCGACCIMMJMMMMMMMJJMMMMMMJMMMMMMMIIMMMMMIII
M(+1,+1)
I(+1, 0)
J(0, +1)
Alignments correspond 1-to-1 with sequences of states M, I, J

Let’s score the transitions
-AGGCTATCACCTGACCTCCAGGCCGA--TGCCC---TAG-CTATCAC--GACCGC-GGTCGATTTGCCCGACCIMMJMMMMMMMJJMMMMMMJMMMMMMMIIMMMMMIII
M(+1,+1)
I(+1, 0)
J(0, +1)
Alignments correspond 1-to-1 with sequences of states M, I, J
s(xi, yj)
s(xi, yj) s(xi, yj)
-d -d
-e -e
-e
-e

How do we find optimal alignment according to this model?
Dynamic Programming:
M(i, j): Optimal alignment of x1…xi to y1…yj ending in M
I(i, j): Optimal alignment of x1…xi to y1…yj ending in I
J(i, j): Optimal alignment of x1…xi to y1…yj ending in J
The score is additive, therefore we can apply DP recurrence formulas
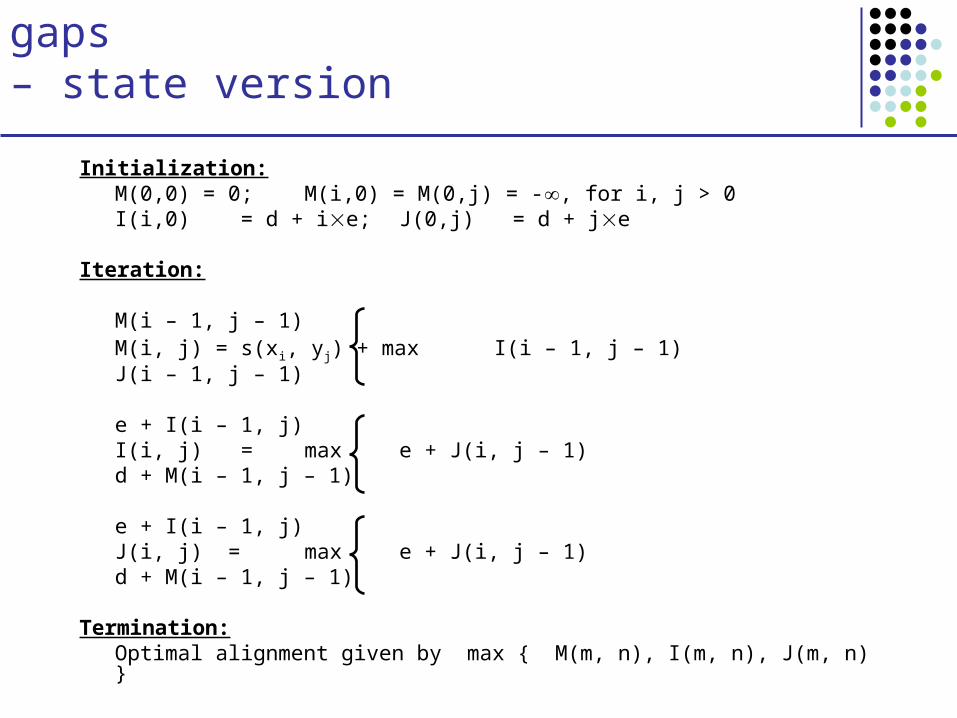
Needleman Wunsch with affine gaps – state version
Initialization:M(0,0) = 0; M(i,0) = M(0,j) = -, for i, j > 0I(i,0) = d + ie; J(0,j) = d + je
Iteration:
M(i – 1, j – 1)M(i, j) = s(xi, yj) + max I(i – 1, j – 1)
J(i – 1, j – 1)
e + I(i – 1, j)I(i, j) = max e + J(i, j – 1)
d + M(i – 1, j – 1)
e + I(i – 1, j)J(i, j) = max e + J(i, j – 1)
d + M(i – 1, j – 1)
Termination:Optimal alignment given by max { M(m, n), I(m, n), J(m, n) }
Probabilistic interpretation of an alignment
An alignment is a hypothesis that the two sequences are related by evolution
Goal:
Produce the most likely alignment
Assert the likelihood that the sequences are indeed related

A Pair HMM for alignments
MP(xi, yj)
IP(xi)
JP(yj)
1 – 2 –
1 – 2 –
1 – 2 –
BEGIN
END
M JI
1 – 2 –

A Pair HMM for unaligned sequences
BEGIN IP(xi)
ENDBEGIN
JP(yj)
END1 -
1 -
1 -
1 -
P(x, y | R) = (1 – )m P(x1)…P(xm) (1 – )n P(y1)…P(yn)
= 2(1 – )m+n i P(xi) j P(yj)
Model R

To compare ALIGNMENT vs. RANDOM hypothesis
Every pair of letters contributes:
• (1 – 2 – ) P(xi, yj) when matched
P(xi) P(yj) when gapped
• (1 – )2 P(xi) P(yj) in random model
Focus on comparison of
P(xi, yj) vs. P(xi) P(yj)
BEGINI
P(xi)END
BEGINJ
P(yj)END
1 -
1 -
1 -
1 -
MP(xi, yj)
IP(xi)
JP(yj)
1 – 2 –
1 – 2 –
1 – 2 –

To compare ALIGNMENT vs. RANDOM hypothesis
Idea:We will divide alignment score by the random score, and take logarithms
Let P(xi, yj) (1 – 2 – )
s(xi, yj) = log ––––––––––– + log ––––––––––– P(xi) P(yj) (1 – )2
(1 – 2 – ) P(xi) d = – log ––––––––––––––––––––
(1 – ) (1 – 2 – ) P(xi)
P(xi) e = – log –––––––––––
(1 – ) P(xi)
Every letter b in random model contributes (1 – ) P(b)
The meaning of alignment scores
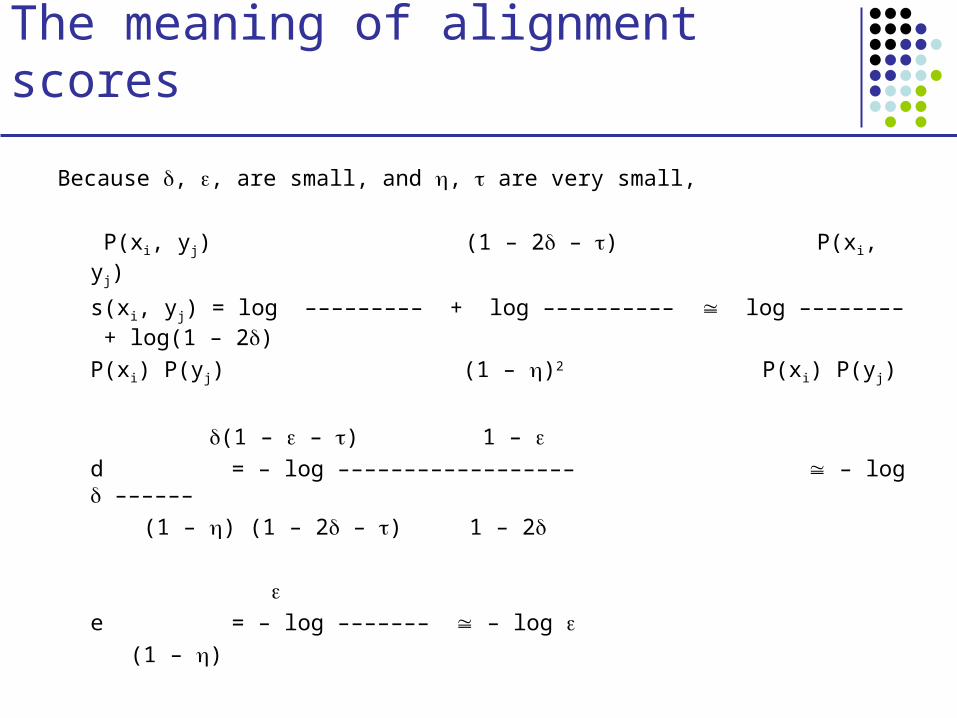
Because , , are small, and , are very small,
P(xi, yj) (1 – 2 – ) P(xi, yj)
s(xi, yj) = log ––––––––– + log –––––––––– log –––––––– + log(1 – 2)
P(xi) P(yj) (1 – )2 P(xi) P(yj)
(1 – – ) 1 – d = – log –––––––––––––––––– – log ––––––
(1 – ) (1 – 2 – ) 1 – 2
e = – log ––––––– – log
(1 – )

The meaning of alignment scores
• The Viterbi algorithm for Pair HMMs corresponds exactly to the Needleman-Wunsch algorithm with affine gaps
• However, now we need to score alignment with parameters that add up to probability distributions
1/mean length of next gap 1/mean arrival time of next gap
affine gaps decouple arrival time with length
1/mean length of aligned sequences (set to ~0) 1/mean length of unaligned sequences (set to ~0)

The meaning of alignment scores
Match/mismatch scores: P(xi, yj)
s(a, b) log ––––––––––– (let’s ignore log(1 – 2) for the moment – assume no gaps)
P(xi) P(yj)
Example:Say DNA regions between human and mouse have average conservation of 50%
Then P(A,A) = P(C,C) = P(G,G) = P(T,T) = 1/8 (so they sum to ½) P(A,C) = P(A,G) =……= P(T,G) = 1/24 (24 mismatches, sum to ½)
Say P(A) = P(C) = P(G) = P(T) = ¼
log [ (1/8) / (1/4 * 1/4) ] = log 2 = 1, for matchThen, s(a, b) = log [ (1/24) / (1/4 * 1/4) ] = log 16/24 = -0.585
Cutoff similarity that scores 0: s*1 – (1 – s)*0.585 = 0
According to this model, a 37.5%-conserved sequence with no gaps would score on average 0.375 * 1 – 0.725 * 0.585 = 0
Why? 37.5% is between the 50% conservation model, and the random 25% conservation model !

Substitution matrices
A more meaningful way to assign match/mismatch scores
For protein sequences, different substitutions have dramatically different frequencies!
PAM Matrices:1. Start from a curated set of very similar protein sequences2. Construct ancestral sequences (using parsimony)
3. Calculate Aab: frequency of letters a and b interchanging
4. Calculate Bab = P(b|a) = Aab/(c≤d Acd)
5. Adjust matrix B so that a,b qa qb Bab = 0.01
PAM(1)
6. Let PAM(N) = [PAM(1)]N -- Common PAM(250)
Substitution Matrices
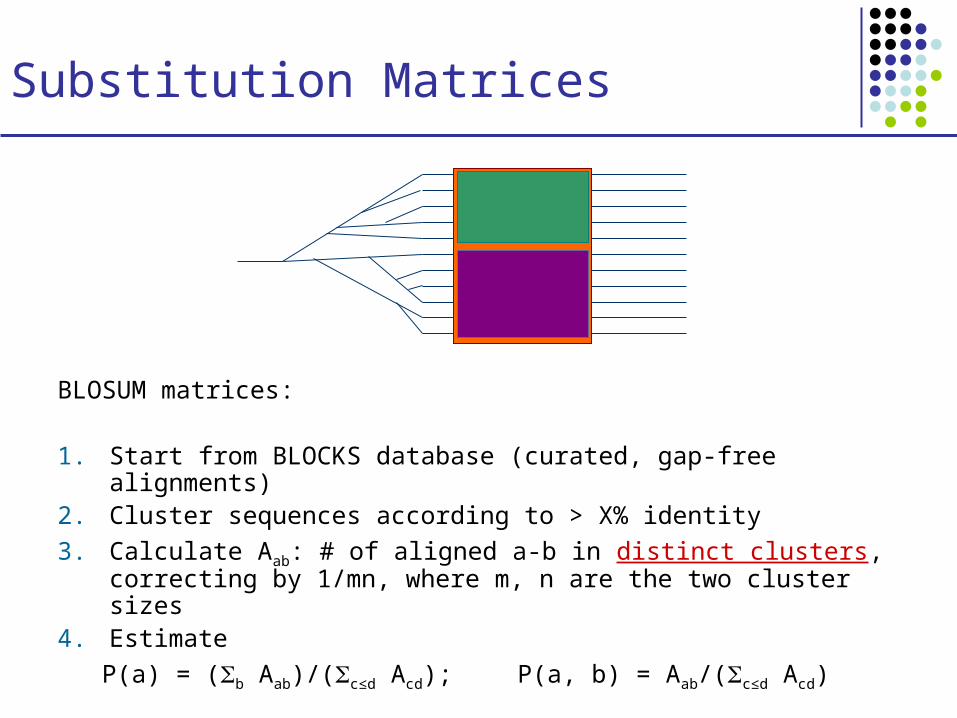
BLOSUM matrices:
1. Start from BLOCKS database (curated, gap-free alignments)2. Cluster sequences according to > X% identity
3. Calculate Aab: # of aligned a-b in distinct clusters, correcting by 1/mn, where m, n are the two cluster sizes
4. Estimate
P(a) = (b Aab)/(c≤d Acd); P(a, b) = Aab/(c≤d Acd)

BLOSUM matrices
BLOSUM 50 BLOSUM 62
(The two are scaled differently)