variability in stable isotopes of snowy owl feathers and ... · particular were abundant in the...
TRANSCRIPT

759
Variability in stable isotopes of snowy owl feathers and contribution of marine resources to their winter diet
Audrey Robillard, Gilles Gauthier, Jean-François Therrien, Guy Fitzgerald, Jennifer F. Provencher and Joël Bêty
A. Robillard (http://orcid.org/0000-0002-3690-7080) ([email protected]) and G. Gauthier, Dépt. de biologie and Centre d’études nordiques, Univ. Laval, Sainte-Foy, Québec, Canada. – J.-F. Therrien, Hawk Mountain Sanctuary, Acopian Center for Conservation Learning, Orwigsburg, PA, USA. – G. Fitzgerald, Faculté de médecine vétérinaire, Univ. de Montréal, Saint-Hyacinthe, Québec, Canada. – J. F. Provencher, Dept of Biology, Acadia Univ., Wolfville, Nova Scotia, Canada. – J. Bêty, Dépt de biologie, chimie et géographie and Centre d’études nordiques, Univ. du Québec à Rimouski, Rimouski, Québec, Canada.
The snowy owl is an elusive arctic predator known for its nomadic behaviour. Satellite tracking has revealed that some adult snowy owls could make an extensive use of the marine environment during the non-breeding season. However, the relative contribution of marine resources to their diet is unknown. Stable isotope analyses can be useful to document the diet of mobile animals during periods of the year when individuals are less accessible. This study aimed to assess variation in isotopic values (d13C and d15N) of various feather types, and the usefulness of feathers to determine the contribution of the marine environment to the winter diet of snowy owls captured in summer. We sampled feathers coming from 6 body regions of 18 breeding females at two sites in the eastern Canadian Arctic in 2013 and 2014. Prior to analyses, diet-tissue discrimination factors of snowy owl feathers were established in captivity. Variability in isotopic values among feather types was relatively low and pairwise correlations in isotopic values between feathers on the same individual were variable and often low, which suggests differences in the diet at the time when various feathers were synthesized. Diet reconstruction models detected a contribution of marine sources to snowy owl feathers ranging from 4 to 19% among feather types. However, the marine contribution was highly variable when single feathers were examined within individuals, ranging from 3 to 71%. This indicated that no single feather type could be used alone to reliably infer the contribution of marine resources to the winter diet of owls, possibly due to a high variability in the timing and sequence of molt. For asynchronous molters like snowy owls, we recommend sampling multiple feathers from various body regions, excluding wing feathers, to investigate winter diet or habitat use.
Top predators are often highly mobile and can move over large distances during their life cycle. Examples include sea-birds (Akesson and Weimerskirch 2005, Phillips et al. 2007, Egevang et al. 2010) and arctic predators (Tarroux et al. 2010, Therrien et al. 2014), which can roam over large areas in search of food. To document the diet of highly mobile animals, stable isotope analyses can be useful (Hobson and Wassenaar 2008, Inger and Bearhop 2008, Hobson 2011), especially during periods of the year when individuals are less accessible such as when foraging at sea (Cherel et al. 2000, 2006). Arctic foxes Vulpes lagopus (Roth 2002, Tarroux et al. 2012) and long-tailed jaegers Stercorarius longicaudus (Julien et al. 2014) are two arctic-breeding species that use the marine environment during the non-breeding season and for which stable isotopes have been used successfully to analyse season-specific diet.
The snowy owl is a tundra-nesting top predator well known for its nomadic and irruptive migratory behaviour (Fuller et al. 2003, Therrien et al. 2014), which complicates the study of this species during the non-breeding season.
Recent evidence based on satellite tracking suggests that in eastern North America, most adults remain in the Arctic in winter and may use the marine environment for several weeks feeding on seabirds (Therrien et al. 2011b). However, the relative contribution of marine resources to the diet of snowy owls is unknown. Stable isotope analyses of animal tissues can be useful to address this question because the iso-topic values of potential prey are highly contrasted between the terrestrial and marine environments (Deniro and Epstein 1978, 1981, Hobson and Clark 1992a). However, captur-ing snowy owls during the non-breeding season in the Arctic to obtain samples for isotopic analyses is extremely difficult, especially in the marine environment. In contrast, capturing owls at nests during the summer is relatively easy (Therrien et al. 2012), and thus offers an opportunity to obtain samples for isotopic analyses provided that some tissues can retain isotopic information on prey ingested during the winter period when birds are at sea.
Feathers collected during the breeding season represent a potential tissue to investigate winter diet because isotopic
© 2017 The Authors. Journal of Avian Biology © 2017 Nordic Society OikosSubject Editor: Ronald Ydenberg. Editor-in-Chief: Thomas Alerstam. Accepted 12 February 2017
Journal of Avian Biology 48: 759–769, 2017 doi: 10.1111/jav.01257

760
ratios of keratin, the structural component of feathers, are determined when the tissue is synthesized (i.e., dur-ing the period of feather growth) and remain fixed there-after (Hobson and Clark 1992a, Hobson 1999, Bearhop et al. 2002). In most bird species, feathers are synthesized during the non-breeding season to limit overlap between moult and reproduction (Payne 1972, Howell 2010), two energetically-costly activities, and hence could provide infor-mation on the diet during this part of the annual cycle. Unfortunately, moult patterns and timing of feather growth are poorly known in most species. Moult of flight feathers in snowy owls probably starts on the breeding grounds and may extend into the fall or winter period but body feathers can potentially moult year-round (Pyle 1997b). Moult pat-terns may also vary between sexes and with prey abundance on the breeding grounds (Solheim 2012). Variable moult-ing patterns of body and flight feathers has the potential to create within-individual heterogeneity in isotopic ratios of feathers (Carravieri et al. 2014), but few studies have looked at those variations within individuals and most of them were carried out on seabirds (Bond and Diamond 2008, Jaeger et al. 2009, Brasso et al. 2013, Carravieri et al. 2014).
Our aims were therefore to 1) assess the intra-individual variation in feather and blood isotopic values (d13C and d15N) of snowy owls captured during the summer, 2) assess if feather d13C and d15N could be useful tools to assess the con-tribution of the marine resources to the winter diet of owls, and 3) assess the average contribution of the marine eco-system to the diet of snowy owls. We expected variations in d13C and d15N values of feathers from different body regions
of the same individual because snowy owls are considered asynchronous moulters (i.e., feathers should be synthesized at different places or times, when diet is potentially different; Pyle1997b). In contrast, blood d13C and d15N values should show less variability because of the terrestrial-dominated diet of owls during breeding. Using isotopic mixing models, we then investigated the intra- and inter-individual variabil-ity in the contribution of marine resources to the diet of owls. For these calculations, we experimentally determined the discrimination factors of d13C and d15N owl feathers (Hobson and Clark 1992b), and obtained isotopic values of potential prey items of non-breeding owls. We expected marked inter-individual variations in the marine contribu-tion to the diet of owls because the use of marine environ-ments during the winter is highly variable among individuals (Therrien et al. 2011b).
Methods
Study system
Tissue sampling of wild snowy owls was carried out at two different sites in the eastern Canadian Arctic: Deception Bay, QC (62°02N, 74°49W; Low Arctic) in 2013 and Bylot Island, NU (73°08N 80°00W; High Arctic), in 2014 (Fig. 1). Deception Bay is located at the northern tip of the Nunavik region of the province of Quebec, and character-ised by a rugged and largely rocky terrain with lush tundra vegetation in river valleys. Ungava lemmings Dicrostonyx
Figure 1. Sampling locations of snowy owl tissues and potential prey items in eastern North America. Bylot Island, NU (star): feathers and blood of owls (2014), brown and collared lemmings (2007–2009); Deception Bay, QC (square): feathers and blood of owls, Ungava lemmings and meadow vole (2013); Belcher Islands, NU (diamond): common eiders (2012) and long-tailed ducks (2000); Kuujjuaq, QC (circle): rock ptarmigans (2013); Twilingate, NL (triangle): common murres, thick-billed murres and razorbills (2011–2012).
761
hudsonius and meadow voles Microtus pennsylvanicus were the main small mammal found at this site, and lemmings in particular were abundant in the region in 2013 (Robillard unpubl. data). In Nunavik, nest searches for owls were car-ried out along the 97 km-long road from the Raglan mine settlement (Katinik) to the coastal port of Deception Bay.
Bylot Island is a coastal study site dominated by herba-ceous tundra and composed of a mosaic of mesic (85%) and wet (15%) environments where two species of small mam-mals are found: brown lemmings Lemmus trimucronatus, the most abundant species, and collared lemmings Dicrostonyx groendlandicus (see Gauthier et al. 2011 for a description of the study area). Nest searches for owls took place on the south plain of the island over an area of ∼450 km2. We aimed to capture birds in the late incubation period or soon after hatching to limit nest abandonment by the parents. All captures of snowy owls were performed with bow-nets set at the nest (but one was performed using a bal-chatri, i.e. a noose-covered cage with a live bait), from 8 to 18 July 2013 at Deception Bay, and 29 June to 5 July 2014 on Bylot Island. The later capture dates on Deception Bay was due to our delayed arrival to the site because of logistic constraints, and not due to differences in breeding phenology, which was similar at both sites (laying date expressed as Julian day: Bylot Island: mean 152, range 144‒164, n 6; Deception Bay: mean 146, range 137‒153, n 10; p 0.08 [t-test]).
Tissue sampling in the field and preparation
Snowy owl feathers and blood were collected on 10 nesting females in 2013 and 8 females in 2014. We plucked or cut feathers from 6 different body regions: top of head, rear of neck, breast, flank, rump and wing (secondaries) and stored them in individual envelopes at room temperature. For wing feathers, 1 new feather (dark brown) and 1 old feather (worn, pale brown) were collected from either the right or left wing. In the laboratory, feathers were washed with a 2:1 chloroform: methanol solution, oven dried at 50°C for 24 h, and homogenized by cutting them with scissors into approximately 1–3 mm fragments. Feather shafts were excluded from homogenization (except for very small ones like head feathers) to limit within-feather variability (Gre-cian et al. 2015).
We took a 1-ml blood sample from the brachial vein of each individual with a syringe and immediately transferred it to a 70% ethanol-filled Eppendorf tube kept frozen at –20°C. Ethanol does not significantly alter carbon and nitrogen isotopic composition of tissues (Hobson et al. 1997, Therrien et al. 2011a). In the laboratory, blood samples were freeze-dried at –50°C for 72 h and ground to a fine powder with mortar and pestle. For stable isotope analyses, ∼0.7 mg of feathers (n 146) and ∼1.0 mg of blood (n 16) were subsampled, weighed to the nearest 0.001 mg and packed into tin capsules.
To evaluate the proportion of marine sources in the diet of snowy owls, we obtained isotopic values via tissues of potential prey items from different locations and envi-ronments within their known winter range (Fig. 1). In eastern North America, adult snowy owls winter mainly in south Baffin and Nunavik and in the surrounding marine
environment in Davis Strait/Labrador Sea, Hudson strait and eastern Hudson Bay (Therrien et al. 2011b). Thus, we included the following prey groups in our analyses: 1) breast muscles from seabirds, i.e., common eider Somateria mollissima, thick-billed murre Uria lomvia, common murre Uria aalge, razorbill Alca torda and long-tailed duck Clangula hyemalis (liver in this case) collected in winter; 2) breast muscles from terrestrial birds, i.e., rock ptarmigan Lagopus muta; 3) muscles from terrestrial small mammals, i.e., brown, collared and Ungava lemmings and meadow vole. We collected Ungava lemmings and meadow voles in the field near Deception Bay, samples of seabirds were accessed via the Seabird Research Team at Environment and Climate Change Canada (Supplementary material Appendix 2) and rock ptarmigans were given to us by Inuit hunters (see Fig. 1 and Supplementary material Appendix 2 for exact sampling locations). Sources were pooled in 2 groups: marine (n 5 species) and terrestrial sources (n 5 species) for stable isotope mixing models, given equal weight to each species within group.
Tissue samples collected in the field were stored frozen at –20°C. In the laboratory, samples were freeze-dried at –50°C, ground to a fine powder with mortar and pestle and lipid were extracted with chloroform using a Soxtec appa-ratus (Tecator system 1043) before isotopic analyses. Lipid extraction reduces the risk of introducing significant biases in d13C values, which often differ between lipid and non-lipid fractions (Tieszen et al. 1983), and is especially important when comparing sources with variable lipid content (Post et al. 2007). For stable isotope analyses, ∼1 mg of sources tissue were subsampled, weighed to the nearest 0.001 mg and packed into tin capsules. All values reported are lipid extracted values. Because of the difficulty of obtaining prey tissues from all the different sources, prey tissues came from different years depending of the species and often from a single year for a given species. Therefore, we assumed that prey isotopic ratios did not vary significantly from year to year. However, even if this assumption was not entirely met, annual variation in isotopic values within prey species (e.g. collared lemmings, Supplementary material Appendix 2) is likely to be small compared to the large differences between the terrestrial and marine prey (Fig. 2) and thus should have little impact on our results.
Diet-tissue discrimination
We assessed the diet-tissue discrimination factors of feathers using 3 captive snowy owls (2 females and 1 male) from a rehabilitation center affiliated with the Faculté de médecine vétérinaire of the Univ. de Montréal in Saint-Hyacinthe, Québec, Canada. The birds were found injured in the wild and taken to the centre for treatment where they had been in captivity for at least one year prior to the start of our experiment. At the start of the experiment, a tail feather was removed from each bird (R5 or R6 on the right side) under general anaesthesia to allow for a regrowth of the feather under a known diet. Birds were put on a pure diet of mice sev-eral weeks before the start of the experiment and maintained on it thereafter. Mice came from a single source (Charles River Canada, Saint-Constant, Quebec, Canada) and were reared on standard commercial feed (Purina 50–75). All the

762
were subtracted from the d13C and d15N values of each individual’s feather (ΔX Δtissue–Δdiet) to obtain the result-ing discrimination factor of feathers (ΔX). For blood, discrimination factors from Therrien et al. (2011a) were used.
All animal manipulations were approved by the Animal Care Committees of Univ. Laval and the Faculté de médecine vétérinaire of Univ. de Montréal.
Isotopic analyses
Isotopic analyses were performed at the Laboratoire d’Océanographie of Univ. Laval, Québec, Canada. Stable
mice used in this experiment came from the same batch and were kept frozen at the rehabilitation centre until offered to the birds. Birds ate 4–6 mice every day and ingested indi-vidual mice whole. Feathers regrowth started 1–2 months after extraction and lasted between 2 and 3 months.
The newly grown tail feathers were removed from each bird when it was fully grown. Five randomly picked mice from the frozen batch were also sampled. Samples of captive owl feathers were cut into tiny pieces and white mice leg muscles were homogenized and prepared for isotopic analy-ses using the same methods used for potential prey described above. The mean d13C and d15N values of prey items
Figure 2. Relationships between d13C and d15N of snowy owl tissues showing (a) the low inter-tissue variability (among 7 feather types and blood) and (b) the greater inter-individual variability in feathers (i.e., 18 females) for 2013 (circles) and 2014 (triangles) presented as means SD. Isotopic values of potential prey items are plotted as raw data but values of snowy owl tissues are corrected for their respective discrimination factors.
763
Discrimination factors for feathers (this study) and blood (Therrien et al. 2011a) were accounted for in all models and statistical analyses were performed using R 3.2.2 software (R Core Team). Results are presented as means SD, unless otherwise stated.
Results
Isotopic values of owls’ tissues
Overall mean d13C and d15N values for wild snowy owl tissues collected during the summer were respec-tively –23.1 0.6‰ and 7.5 1.9‰ for feathers and –24.8 0.3‰ and 4.9 0.8‰ for blood (Supplemen-tary material Appendix 2). Generally, we observed a greater variability in isotopic values among individuals than among tissues within individuals (Inter-tissues d15N: 3.3 0.3‰, d13C: –25.0 0.2‰; Fig. 2a; Inter-individuals d15N: 3.3 1.2‰, d13C: –25.0 0.4‰; Fig. 2b).
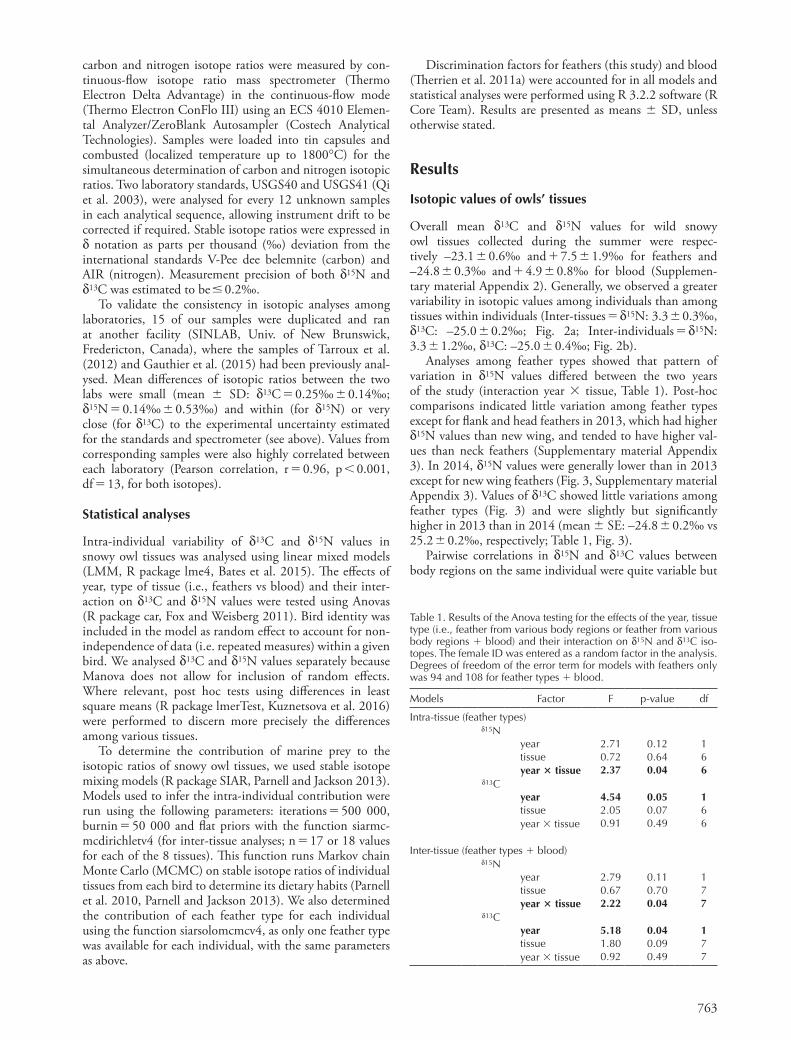
Analyses among feather types showed that pattern of variation in d15N values differed between the two years of the study (interaction year tissue, Table 1). Post-hoc comparisons indicated little variation among feather types except for flank and head feathers in 2013, which had higher d15N values than new wing, and tended to have higher val-ues than neck feathers (Supplementary material Appendix 3). In 2014, d15N values were generally lower than in 2013 except for new wing feathers (Fig. 3, Supplementary material Appendix 3). Values of d13C showed little variations among feather types (Fig. 3) and were slightly but significantly higher in 2013 than in 2014 (mean SE: –24.8 0.2‰ vs 25.2 0.2‰, respectively; Table 1, Fig. 3).
Pairwise correlations in d15N and d13C values between body regions on the same individual were quite variable but
carbon and nitrogen isotope ratios were measured by con-tinuous-flow isotope ratio mass spectrometer (Thermo Electron Delta Advantage) in the continuous-flow mode (Thermo Electron ConFlo III) using an ECS 4010 Elemen-tal Analyzer/ZeroBlank Autosampler (Costech Analytical Technologies). Samples were loaded into tin capsules and combusted (localized temperature up to 1800°C) for the simultaneous determination of carbon and nitrogen isotopic ratios. Two laboratory standards, USGS40 and USGS41 (Qi et al. 2003), were analysed for every 12 unknown samples in each analytical sequence, allowing instrument drift to be corrected if required. Stable isotope ratios were expressed in d notation as parts per thousand (‰) deviation from the international standards V-Pee dee belemnite (carbon) and AIR (nitrogen). Measurement precision of both d15N and d13C was estimated to be 0.2‰.
To validate the consistency in isotopic analyses among laboratories, 15 of our samples were duplicated and ran at another facility (SINLAB, Univ. of New Brunswick, Fredericton, Canada), where the samples of Tarroux et al. (2012) and Gauthier et al. (2015) had been previously anal-ysed. Mean differences of isotopic ratios between the two labs were small (mean SD: d13C 0.25‰ 0.14‰; d15N 0.14‰ 0.53‰) and within (for d15N) or very close (for d13C) to the experimental uncertainty estimated for the standards and spectrometer (see above). Values from corresponding samples were also highly correlated between each laboratory (Pearson correlation, r 0.96, p 0.001, df 13, for both isotopes).
Statistical analyses
Intra-individual variability of d13C and d15N values in snowy owl tissues was analysed using linear mixed models (LMM, R package lme4, Bates et al. 2015). The effects of year, type of tissue (i.e., feathers vs blood) and their inter-action on d13C and d15N values were tested using Anovas (R package car, Fox and Weisberg 2011). Bird identity was included in the model as random effect to account for non-independence of data (i.e. repeated measures) within a given bird. We analysed d13C and d15N values separately because Manova does not allow for inclusion of random effects. Where relevant, post hoc tests using differences in least square means (R package lmerTest, Kuznetsova et al. 2016) were performed to discern more precisely the differences among various tissues.
To determine the contribution of marine prey to the isotopic ratios of snowy owl tissues, we used stable isotope mixing models (R package SIAR, Parnell and Jackson 2013). Models used to infer the intra-individual contribution were run using the following parameters: iterations 500 000, burnin 50 000 and flat priors with the function siarmc-mcdirichletv4 (for inter-tissue analyses; n 17 or 18 values for each of the 8 tissues). This function runs Markov chain Monte Carlo (MCMC) on stable isotope ratios of individual tissues from each bird to determine its dietary habits (Parnell et al. 2010, Parnell and Jackson 2013). We also determined the contribution of each feather type for each individual using the function siarsolomcmcv4, as only one feather type was available for each individual, with the same parameters as above.
Table 1. Results of the Anova testing for the effects of the year, tissue type (i.e., feather from various body regions or feather from various body regions blood) and their interaction on d15N and d13C iso-topes. The female ID was entered as a random factor in the analysis. Degrees of freedom of the error term for models with feathers only was 94 and 108 for feather types blood.
Models Factor F p-value df
Intra-tissue (feather types)d15N
year 2.71 0.12 1tissue 0.72 0.64 6year tissue 2.37 0.04 6
d13Cyear 4.54 0.05 1tissue 2.05 0.07 6year tissue 0.91 0.49 6
Inter-tissue (feather types blood)d15N
year 2.79 0.11 1tissue 0.67 0.70 7year tissue 2.22 0.04 7
d13Cyear 5.18 0.04 1tissue 1.80 0.09 7year tissue 0.92 0.49 7

764
(Fig. 3a, d, Supplementary material Appendix 3). Again, d13C values did not differ among tissues when blood was included in the comparisons but differed between years (Table 1). Coefficients of variations of isotopic values were much lower for blood than for feathers for both d15N (blood: 15.3%, feathers: 25.3%, range: 20.6 to 32.9%) and d13C (blood: 1.1%, feathers: 2.6%, range: 1.8 to 4.7%) values.
Discrimination factor and marine contribution to owl diet
The mean d13C and d15N values of captive owl feathers were respectively –18.5 0.2‰ and 12.1 0.2‰ and mean values for white mouse muscles were –20.4 0.04‰
often low (Table 2). Neck and new wing feathers isotopic values did not correlate with any other body region whereas head, rump, flank and breast were the body regions that had isotopic values most often correlated to each other (Table 2). Overall, this suggests some differences in the diet at the time when various feathers were synthesized, and that these differences were greatest between new wing or neck feathers and other body regions.
When blood was included in the comparisons, there was again an interaction between year and tissue type for d15N values (Table 1). Post-hoc comparisons indicated that blood d15N values were not significantly different from any feather in both 2013 and 2014, but tended to be lower than head and flank feathers in 2013, and new wing feathers in 2014
Figure 3. Variation in d15N (a, d) and d13C (b, e) isotopic ratios (mean with SE) in 2013 (a, b) and 2014 (d, e) among snowy owl feather types (gray) and blood (Bl; black). Feather sampled are wing (new Wn; used Wu), neck (N), rump (R), flank (F), breast (Br), and head (H). Proportions of marine sources in different tissues of snowy owls (c, f ) are presented with their means (dot) and the 25, 50, 75 and 95% credible intervals (dark gray, medium gray, pale gray and white boxes respectively) from the SIAR posterior probability distributions. Dashed lines represent mean proportions of marine sources across all feathers. Isotopic ratios (a, b, d and e) were corrected with respective discrimination factors for d15N and d13C of blood and feathers to allow a comparison between these 2 tissues.

765
models detected a significant contribution of marine sources to snowy owl feathers, which supports the hypothesis that these predators feed in this environment at some point dur-ing their annual cycle. Moreover, examining these patterns at the individual level also revealed a large variability, with some individuals showing little contribution of the marine resources to their diet during feather growth, whereas oth-ers showing large isotopic differences among feathers. To our knowledge, this is the first study documenting intra- and inter-individual heterogeneity in isotopic ratios and diet of an arctic predator using multiple tissues.
Variation among feather type and individuals
In general, whole blood reflects the diet of animals during the previous few weeks (Hobson and Clark 1992a). Because snowy owls appear strictly terrestrial during the breeding sea-son (Holt et al. 2015), we expected isotopic values of blood samples collected in summer to mainly reflect a terrestrial diet. Diet reconstruction models generally confirmed this result but nonetheless indicated a modest contribution of the marine environment to the blood (8% on average). The marine contribution detected in blood samples could be due to the use of endogenous body reserves acquired at other time of the year by breeding females (Cherel et al. 2005, Fox et al. 2009) to meet some energetic shortfalls (Brodin and Jonsson 2003). It could also originate from marine or coastal prey consumed shortly before breeding. However, considering that blood isotopic values did not totally overlap those of terrestrial prey, we preferred to retain all sources in our analyses to avoid exclusions that may have led to dietary proportion biases (Phillips et al. 2014).
Because snowy owls are considered asynchronous moulters (Pyle 1997b), we expected large and possibly consistent vari-ability in isotopic ratios among feathers coming from various body regions as previously shown in other asynchronous moulters such as the Arctic tern Sterna paradisaea, com-mon tern Sterna hirundo, Leach’s storm petrel Oceanodroma
and 8.0 0.3‰. Diet-tissue discrimination factors (Δ13C and Δ15N) for snowy owl feathers were therefore respectively 1.9 0.04‰ and 4.1 0.3‰ (see Supple-mentary material Appendix 1 for details).
Isotopic values of marine and terrestrial sources differed considerably: marine sources were markedly enriched in 13C (marine: –19.5 0.7‰, terrestrial: –26.2 1.2‰) and in 15N (marine: 13.7 1.2‰, terrestrial: 3.3 1.8‰; Fig. 2, Supplementary material Appendix 2).
The mean proportions of marine sources in feathers from the 6 body regions of snowy owls varied from 0.037 to 0.188 (Fig. 3c, f ) and were greater in 2013 (0.151 0.024) than 2014 (0.074 0.039; t 4.5, df 10, p 0.001). Consistent with d15N and d13C values, mean proportions of marine sources appeared greater for flank, head and used wing feathers in 2013 and for new wing feathers in 2014, but overall, the variation in marine contribution among feathers was relatively low (Fig. 3c, f ). Proportions of marine sources in blood were also generally low (Fig. 3c, f ). When we combined the information from all feathers collected on each individual, the mean proportions of contribution of marine sources to feathers ranged from 0.04 to 0.23 among our 18 individuals (Fig. 4). However, if we look at the value for each feather in each individual, we found a considerable variability in the marine contribution, ranging from 0.03 to 0.71 (Fig. 4). For some individuals, the marine contribution was uniformly low for all feathers sampled (e.g., individuals C, K, and M; Fig. 4) but for others, the variability among feathers was very large (e.g., especially individuals G and N; Fig. 4).
Discussion
Contrary to our expectations, we did not find large and con-sistent differences in the nitrogen and carbon isotopic values among feathers coming from various body regions of snowy owls. Nonetheless, diet reconstruction using isotopic mixing
Table 2. Spearman’s rank-order correlation tests between pairs of tissues collected on the same individual (Wn: wing new, Wu: wing used, R: rump, Fl: flank, Br: breast, N: neck, H: head, Bl: blood) for nitrogen (top) and carbon (bottom) isotopes. Significant correlations are in bold. (*) 0.05 p 0.1, * 0.01 p 0.05, ** p 0.01.
d15N Wu N R Fl Br H Bl
Wn –0.07 –0.10 0.13 0.08 0.15 –0.07 –0.21Wu 1.00 0.31 0.59* 0.30 0.54* 0.48* 0.23N 1.00 0.01 0.14 0.12 0.22 –0.22R 1.00 0.46 0.81** 0.66** 0.18Fl 1.00 0.79** 0.87** –0.08Br 1.00 0.87** –0.14H 1.00 –0.10Bl 1.00
d13C Wu N R Fl Br H Bl
Wn –0.21 –0.23 0.07 0.21 0.39 0.12 0.17Wu 1.00 –0.08 0.63** 0.48* 0.27 0.47(*) –0.02N 1.00 0.07 0.21 –0.04 –0.12 –0.12R 1.00 0.72** 0.77** 0.79** 0.12Fl 1.00 0.63** 0.78** 0.16Br 1.00 0.67** 0.05H 1.00 0.22Bl 1.00

766
feathers within the same individual. At least two hypotheses can explain these patterns.
A first hypothesis may be that timing or sequence of moult among various body regions vary considerably among individuals. Flight feathers in snowy owls are only partially replaced every year with a complete moult spanning a period of 3 to 5 years in a relatively predictable replacement sequence (Pyle 1997b, Solheim 2012). On the other hand, body feath-ers of all owls undergo a complete annual moult (Forsman 1981), but the sequences and timing of body feather moult is poorly known. While diet can be studied in captivity, molt cannot due to different stress and environmental conditions,
leucorhoa and Antarctic prions Pachyptila desolata (Bond and Diamond 2008, Carravieri et al. 2014). However, the pat-tern of relatively low variability among feather types that we observed across individuals was shown in synchronous moulters like Sphenisciformes and Procellariiformes (Jaeger et al. 2009, Brasso et al. 2013) in which all feathers moult over a short time period. Pairwise correlations in isotopic values between feathers on the same individual were low for some body parts, which suggest differences in the diet at the time when various feathers were synthesized. As a consequence, marine proportions in the diet of snowy owls inferred from isotopic analyses showed large variations among different
Figure 4. Mean (dot) proportion of marine sources in different tissues of individual snowy owls and their 25 and 95% credible intervals (dark gray and pale gray boxes, respectively) from the SIAR posterior probability distributions, showing considerable variability in the contribution of marine sources when feathers are analysed independently. Dashed lines depict individual mean proportions of marine sources in diet across feathers. Individuals A to J were captured in 2013 at Deception Bay, QC and individuals K to R in 2014 on Bylot island, NU.

767
establishing these factors in captive experiments is important considering that stable isotope mixing models are sensitive to these values (Bond and Diamond 2011). In this study, the Δfeathers differ substantially from the Δblood determined on the same species: Δ13Cfeathers is 1.58‰ greater than Δ13Cblood and Δ15Nfeathers is 2.22‰ greater than Δ15Nblood. Moreover, had we used discrimination factors established for another avian predator, e.g., the peregrine falcon Falco peregrinus (Hobson and Clark 1992b), as a proxy in our analyses, Δ15N would have been more enriched in blood than in feathers, the reverse of snowy owls, which would have yielded erroneous conclusions. This emphasizes the need to use tissue-specific discrimination factors and refrain from using other species as proxy. It must however be noted that discrimination factors may also vary with prey type (Caut et al. 2009), an element that could not be taken into account in this study (i.e., cap-tive owls could not be fed with sea ducks). Although it could be a source of variability in our analysis, it probably had a negligible impact on our main conclusions because doubling the error of our discrimination factors in SIAR changed the results by 2% for feathers.
Usefulness of snowy owl feathers to infer winter diet
A limitation of this study lies in the fact that moult pat-terns in snowy owls, especially of body feathers, are poorly known. The approach we used (i.e., the analysis of feath-ers from different body regions) nonetheless allowed us to detect a significant marine signal in some feathers of several individuals, which supported our original hypothesis. The use of multiple feathers likely provided a general but con-servative estimate of marine resource contribution to snowy owl winter diet, and could potentially help in assessing hab-itat use. On the other hand, the lack of consistency among feathers also complicates their use as a biomonitoring tool for wintering snowy owls, at least until sequence and timing of body feather moult in snowy owls are better established. Our study could not discriminate a single body region from which we sampled feathers that could be reliably used alone to infer habitat use of snowy owls in winter. Flank feathers were the body feathers that yielded isotopic values with the highest marine contribution on average, but this was not always true at the individual level. Flight feathers should be especially avoided because new wing feathers showed oppo-site patterns between our 2 years (i.e., their isotopic ratios yielded the lowest marine contribution in 2013 among all body regions but the highest in 2014). This may not be sur-prising considering the protracted moult of flight feathers in owls and that the last juvenal feathers may not be replaced until the fourth prebasic moult (i.e., fourth year) or later (Pyle 1997a, b, Solheim 2012). Temporal resolution, how-ever, is likely to be low if moulting patterns are as variable as our data implies. For asynchronous moulters like snowy owls, we thus recommend sampling multiple feathers in dif-ferent body regions to obtain some information on the ani-mal diet at different periods of its life cycle. Future studies should also examine factors (e.g., age, sex, wintering strate-gies and habitat use or body condition) that could explain the large inter-individual variations in isotopic values that we found.
therefore very little is known for this species, even if captive birds are available. Body feathers are most often replaced dur-ing the pre-basic and/or pre-alternate moults depending on the species but year-round moult of some body feathers has been documented in a few species of birds of prey, including the snowy owl, Swainson’s hawk Buteo swainsoni and great horned owl Bubo virginianus (Pyle 1997b, Pyle 2008). In seabirds, random sequences and extent of body feather moult have been reported to cause large within-individual variabil-ity in the concentration of contaminants deposited in body feathers during their growth (Bond and Diamond 2008, Carravieri et al. 2014). Therefore, the protracted moult of flight feathers and a highly variable moult of body feathers in snowy owls could explain why some feathers in the same individual showed a very large contribution from the marine environment and others very little, and why feathers with a high marine contribution were not found in the same body regions of all individuals.
A second hypothesis may be that the type of environ-ments used (i.e., marine vs terrestrial) may not only vary among individuals (Therrien et al. 2011b) but also that the period of use of the marine environment (i.e., fall, winter or spring) varies among individuals. A seasonal variability like this would explain why some feathers, which could have grown at different times of the year but in a regular or specific sequence in all individuals, exhibit a variable contribution of marine environment among individuals. However, results from radio-tracking studies do not support this hypothesis because owls that use the marine environment tend to do so at about the same time of the year (i.e., from late December to late March; Therrien et al. 2011b).
Inter-annual differences
The marine contribution to the diet of owls inferred from feathers was twice as high in 2013 than 2014. This inter-annual variability may reflect geographic variation as owls sampled in 2013 were captured in the Low Arctic whereas owls from 2014 were captured in the High Arctic. Therefore, individuals from each sampling site may have had different diets driven by differences in migration or wintering strate-gies. For instance, birds collected in 2013 were closer to the marine areas used by wintering owls in the eastern Canadian Arctic (Hudson Bay and Hudson and Davis Straits, Therrien et al. 2011b), which could partly explain these inter-annual differences. However, because each site was sampled in a dif-ferent year, we cannot identify with certainty the source of variation.
Discrimination factor
Discrimination factors established in this study for feath-ers are similar to Great skua (lipid-extracted samples) val-ues (Δ13C: 2.21 0.07‰; Δ15N: 4.8 0.28‰; Bearhop et al. 2002), and are in the higher range of values reported for feathers (Δ13C: 0–2‰, Δ15N: 2–5‰; Peterson and Fry 1987, Kelly 2000; Supplementary material Appendix 1). Discrimination factors are known to vary among species and body tissues for the same species (Deniro and Epstein 1981, Vanderklift and Ponsard 2003, Caut et al. 2009). Thus,

768
Brodin, A. and Jonsson, K. I. 2003. Optimal energy allocation and behaviour in female raptorial birds during the nestling period. ‒ Ecoscience 10: 140–150.
Carravieri, A., Bustamante, P., Churlaud, C., Fromant, A. and Cherel, Y. 2014. Moulting patterns drive within-individual variations of stable isotopes and mercury in seabird body feathers: implications for monitoring of the marine environ-ment. ‒ Mar. Biol. 161: 963–968.
Caut, S., Angulo, E. and Courchamp, F. 2009. Variation in discrimination factors (Δ15N and Δ13C): the effect of diet isotopic values and applications for diet reconstruction. ‒ J. Appl. Ecol. 46: 443–453.
Cherel, Y., Hobson, K. A. and Weimerskirch, H. 2000. Using stable-isotope analysis of feathers to distinguish moulting and breeding origins of seabirds. ‒ Oecologia 122: 155–162.
Cherel, Y., Hobson, K. A., Bailleul, F. R. and Groscolas, R. 2005. Nutrition, physiology, and stable isotopes: new information from fasting and molting penguins. ‒ Ecology 86: 2881–2888.
Cherel, Y., Phillips, R. A., Hobson, K. A. and McGill, R. 2006. Stable isotope evidence of diverse species-specific and individual wintering strategies in seabirds. ‒ Biol. Lett. 2: 301–303.
Deniro, M. J. and Epstein, S. 1978. Influence of diet on distribution of carbon isotopes in animals. ‒ Geochim. Cosmochim. Acta 42: 495–506.
Deniro, M. J. and Epstein, S. 1981. Influence of diet on the distribution of nitrogen isotopes in animals. ‒ Geochim. Cosmochim. Acta 45: 341–351.
Egevang, C., Stenhouse, I. J., Phillips, R. A., Petersen, A., Fox, J. W. and Silk, J. R. D. 2010. Tracking of Arctic terns Sterna paradisaea reveals longest animal migration. ‒ Proc. Natl Acad. Sci. USA 107: 2078–2081.
Forsman, E. D. 1981. Molt of the spotted owl. ‒ Auk 98: 735–742.
Fox, A. D., Hobson, K. A. and Kahlert, J. 2009. Isotopic evidence for endogenous protein contributions to greylag goose Anser anser flight feathers. ‒ J. Avian Biol. 40: 108–112.
Fox, J. and Weisberg, S. 2011. An R Companion to Applied Regression, second edition. ‒ Sage.
Fuller, M., Holt, D. and Schueck, L. 2003. Snowy owl movements: variation on the migration theme. ‒ Springer.
Gauthier, G., Berteaux, D., Bêty, J., Tarroux, A., Therrien, J. F., McKinnon, L., Legagneux, P., Cadieux, M. C. 2011. The tundra food web of Bylot Island in a changing climate and the role of exchanges between ecosystems. ‒ Ecoscience 18: 223–235.
Gauthier, G., Legagneux, P., Valiquette, M. A., Cadieux, M. C. and Therrien, J. F. 2015. Diet and reproductive success of an Arctic generalist predator: interplay between variations in prey abundance, nest site location, and intraguild predation. ‒ Auk 132: 735–747.
Grecian, W. J., McGill, R. A. R., Phillips, R. A., Ryan, P. G. and Furness, R. W. 2015. Quantifying variation in d13C and d15N isotopes within and between feathers and individuals: is one sample enough? ‒ Mar. Biol. 162: 733–741.
Harrison, X. A., Blount, J. D., Inger, R., Norris, D. R. and Bearhop, S. 2011. Carry-over effects as drivers of fitness differences in animals. ‒ J. Anim. Ecol. 80: 4–18.
Hobson, K. A. 1999. Tracing origins and migration of wildlife using stable isotopes: a review. ‒ Oecologia 120: 314–326.
Hobson, K. A. 2011. Isotopic ornithology: a perspective. ‒ J. Ornithol. 152: 49–66.
Hobson, K. A. and Clark, R. G. 1992a. Assessing avian diets using stable isotopes I: turnover of 13C in tissues. ‒ Condor 94: 181–188.
Hobson, K. A. and Clark, R. G. 1992b. Assessing avian diets using stable isotopes II: factors influencing diet-tissue fractionation. ‒ Condor 94: 189–197.
Conclusion
Despite some limitations, isotopic analyses of feathers col-lected during the summer allowed us to uncover a signifi-cant contribution of the marine environment to the diet of at least some individuals during the non-breeding season. The consumption of marine environment by snowy owls can have important consequences at the individual level, for instance on their body condition, subsequent reproduc-tive success through carry-over effects or increased exposure contaminants present in marine prey (Harrison et al. 2011, Provencher et al. 2014). At the ecosystem level, the use of marine resources by a top predator of the Arctic tundra can also have some implications for cross-system exchanges and allochtonous subsidies (Polis and Hurd 1996), especially for the relatively unproductive terrestrial food web (Gauthier et al. 2011). Future studies should concentrate on address-ing these issues.
Acknowledgments – We would like to thank Andréanne Beardsell and Yannick Seyer for their help in the field. We are highly appre-ciative of Glencore Environmental Services for their generosity and help with logistics at the Glencore-XStrata mines in Raglan, NU. We also are indebted to Arnaud Tarroux for providing isotopic datasets, and to Inuit hunters for providing terrestrial prey. Thanks to Grant Gilchrist (Environment and Climate Change Canada; ECCC), ECCC’s Seabird Research Program and ECCC’s National Specimen Bank for providing marine prey tissues. Many thanks also to Keith Hobson for a preliminary review of the manuscript.Funding – This study was financially supported by the Natural Sciences and Engineering Research Council of Canada, the net-work of center of excellence ArcticNet, the Polar Continental Shelf Program of Natural Resources Canada, the Fonds de Recherche du Québec Nature et Technologies, EnviroNorth and the Fonds Écologique Anne Vallée.Permits – Tissue samples of marine birds were provided by the ECCC’s Seabird Research Program under permits: WL 2012-030, SS2505, ST2772.
References
Akesson, S. and Weimerskirch, H. 2005. Albatross long-distance navigation: comparing adults and juveniles. ‒ J. Navig. 58: 365–373.
Bates, D., Maechler, M., Bolker, B. and Walker, S. 2015. lme4: Linear mixed-effects models using Eigen and S4. – R package ver. 1.1-8, < http://CRAN.R-project.org/package = lme4 >.
Bearhop, S., Waldron, S., Votier, S. C. and Furness, R. W. 2002. Factors that influence assimilation rates and fractionation of nitrogen and carbon stable isotopes in avian blood and feathers. ‒ Physiol. Biochem. Zool. 75: 451–458.
Bond, A. L. and Diamond, A. W. 2008. High within-individual variation in total mercury concentration in seabird feathers. ‒ Environ. Toxicol. Chem. 27: 2375–2377.
Bond, A. L. and Diamond, A. W. 2011. Recent Bayesian stable-isotope mixing models are highly sensitive to variation in discrimination factors. ‒ Ecol. Appl. 21: 1017–1023.
Brasso, R. L., Drummond, B. E., Borrett, S. R., Chiaradia, A., Polito, M. J. and Rey, A. R. 2013. Unique pattern of molt leads to low intraindividual variation in feather mercury concentrations in penguins. ‒ Environ. Toxicol. Chem. 32: 2331–2334.

769
of the matter: models, methods and assumptions for dealing with lipids in stable isotope analyses. ‒ Oecologia 152: 179–189.
Provencher, J.F., Mallory, M. L., Braune, B. M., Forbes, M. R. and Gilchrist, H. G. 2014. Mercury and marine birds in Arctic Canada: effects, current trends, and why we should be paying closer attention. ‒ Environ. Rev. 22: 244–255.
Pyle, P. 1997a. Flight-feather molt patterns and age in North American owls. ‒ American Birding Association, Monographs in Field Ornithology No.2.
Pyle, P. 1997b. Identification guide to North American birds: part I Columbidae to Ploceidae. ‒ Slate Creek Press.
Pyle, P. 2008. Identification guide to North American birds: part II Anatidae to Alcidae. ‒ Slate Creek Press.
Qi, H. P., Coplen, T. B., Geilmann, H., Brand, W. A. and Bohlke, J. K. 2003. Two new organic reference materials for d13C and d15N measurements and a new value for the d13C of NBS 22 oil. ‒ Rapid Commun. Mass Spectrom. 17: 2483–2487.
Roth, J. D. 2002. Temporal variability in arctic fox diet as reflected in stable-carbon isotopes; the importance of sea ice. ‒ Oecologia 133: 70–77.
Solheim, R. 2012. Wing feather moult and age determination of Snowy owls. ‒ Ornis Norvegica 35: 48–67.
Tarroux, A., Berteaux, D. and Bêty, J. 2010. Northern nomads: ability for extensive movements in adult arctic foxes. ‒ Polar Biol. 33: 1021–1026.
Tarroux, A., Bêty, J., Gauthier, G. and Berteaux, D. 2012. The marine side of a terrestrial carnivore: intra-population variation in use of allochthonous resources by arctic foxes. ‒ PLoS One 7: e42427.
Therrien, J. F., Fitzgerald, G., Gauthier, G. and Bêty, J. 2011a. Diet-tissue discrimination factors of carbon and nitrogen stable isotopes in blood of Snowy owl (Bubo scandiacus). ‒ Can. J. Zool. 89: 343–347.
Therrien, J. F., Gauthier, G. and Bêty, J. 2011b. An avian terrestrial predator of the Arctic relies on the marine ecosystem during winter. ‒ J. Avian Biol. 42: 363–369.
Therrien, J. F., Gauthier, G. and Bêty, J. 2012. Survival and reproduction of adult snowy owls tracked by satellite. ‒ J. Wildl. Manage. 76: 1562–1567.
Therrien, J. F., Gauthier, G., Pinaud, D. and Bêty, J. 2014. Irruptive movements and breeding dispersal of snowy owls: a specialized predator exploiting a pulsed resource. ‒ J. Avian Biol. 45: 536–544.
Tieszen, L. L., Boutton, T. W., Tesdahl, K. G. and Slade, N. A. 1983. Fractionation and turnover of stable carbon isotopes in animal tissues: implications for d13C analysis of diet. ‒ Oecologia 57: 32–37.
Vanderklift, M. A. and Ponsard, S. 2003. Sources of variation in consumer-diet Δ15N enrichment: a meta-analysis. ‒ Oecologia 136: 169–182.
Hobson, K. A. and Wassenaar, L. I. 2008. Tracking animal migra-tion with stable isotopes. ‒ Academic Press.
Hobson, K. A., Gibbs, H. L. and Gloutney, M. L. 1997. Preservation of blood and tissue samples for stable-carbon and stable-nitrogen isotope analysis. ‒ Can. J. Zool. 75: 1720–1723.
Holt, D., Larson, M. D., Smith, N., Evans, D. and Parmelee, D. F. 2015. The Snowy owl (Bubo scandiacus). – In: Poole, A. (ed.), The birds of North America online, Cornell Lab of Ornithology.
Howell, S. N. G. 2010. Molt in North American birds. ‒ Houghton Mifflin Harcourt.
Inger, R. and Bearhop, S. 2008. Applications of stable isotope analyses to avian ecology. ‒ Ibis 150: 447–461.
Jaeger, A., Blanchard, P., Richard, P. and Cherel, Y. 2009. Using carbon and nitrogen isotopic values of body feathers to infer inter- and intra-individual variations of seabird feeding ecology during moult. ‒ Mar. Biol. 156: 1233–1240.
Julien, J. R., Legagneux, P., Gauthier, G., Morrison, R. I. G., Therrien, J. F. and Bêty, J. 2014. Contribution of alloch-thonous resources to breeding in a high-arctic avian predator. ‒ Polar Biol. 37: 193–203.
Kelly, J. F. 2000. Stable isotopes of carbon and nitrogen in the study of avian and mammalian trophic ecology. ‒ Can. J. Zool. 78: 1–27.
Kuznetsova, A., Brockhoff, P. B. and Christensen, R. H. B. 2016. Tests in linear mixed effects models. – R package ver. 2.0-30, < https://cran.r-project.org/web/packages/lmerTest/lmerTest.pdf >.
Parnell, A. and Jackson, A. 2013. Stable Isotope Analysis in R. – R package ver. 4.2. < https://cran.r-project.org/web/packages/siar/siar.pdf >.
Parnell, A. C., Inger, R., Bearhop, S. and Jackson, A. L. 2010. Source partitioning using stable isotopes: coping with too much variation. ‒ PLoS One 5: e9672.
Payne, R. B. 1972. Mechanisms and control of molt. ‒ In: Farner, D. S. and King, J. R. (eds), Avian Biology, Academic Press.
Peterson, B. J. and Fry, B. 1987. Stable isotopes in ecosystem studies. ‒ Annu. Rev. Ecol. Syst. 18: 293–320.
Phillips, D. L., Inger, R., Bearhop, S., Jackson, A. L., Moore, J. W., Parnell, A. C., Semmens, B. X. and Ward, E. J. 2014. Best practices for use of stable isotope mixing models in food-web studies. ‒ Can. J. Zool. 92: 823–835.
Phillips, R. A., Croxall, J. P., Silk, J. R. D. and Briggs, D. R. 2007. Foraging ecology of albatrosses and petrels from South Georgia: two decades of insights from tracking technologies. ‒ Aquat. Conserv. Mar. Freshwater Ecosyst. 17: S6–S21.
Polis, G.A. and Hurd, S.D. 1996. Linking marine and terrestrial food webs: Allochthonous input from the ocean supports high secondary productivity on small islands and coastal land communities. ‒ Am. Nat. 147: 396–423.
Post, D. M., Layman, C. A., Arrington, D. A., Takimoto, G., Quattrochi, J. and Montana, C. G. 2007. Getting to the fat
Supplementary material (Appendix JAV-01257 at < www.avianbiology.org/appendix/jav-01257 >). Appendix 1–3.