variability & bias yulia sofiatin department of epidemiology and biostatistics crp i
Post on 19-Dec-2015
225 views
TRANSCRIPT

Variability & BiasVariability & Bias
Yulia Sofiatin
Department of Epidemiology and Biostatistics
CRP I
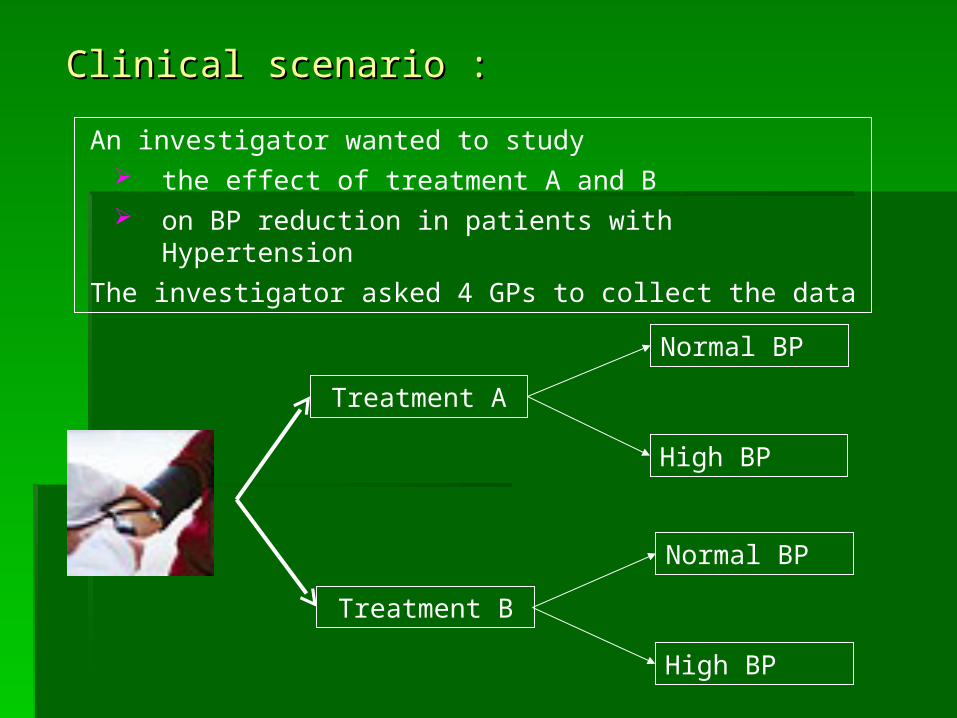
Clinical scenario :Clinical scenario :
An investigator wanted to study the effect of treatment A and B on BP reduction in patients with Hypertension
The investigator asked 4 GPs to collect the data
Treatment A
Treatment B
Normal BP
High BP
Normal BP
High BP
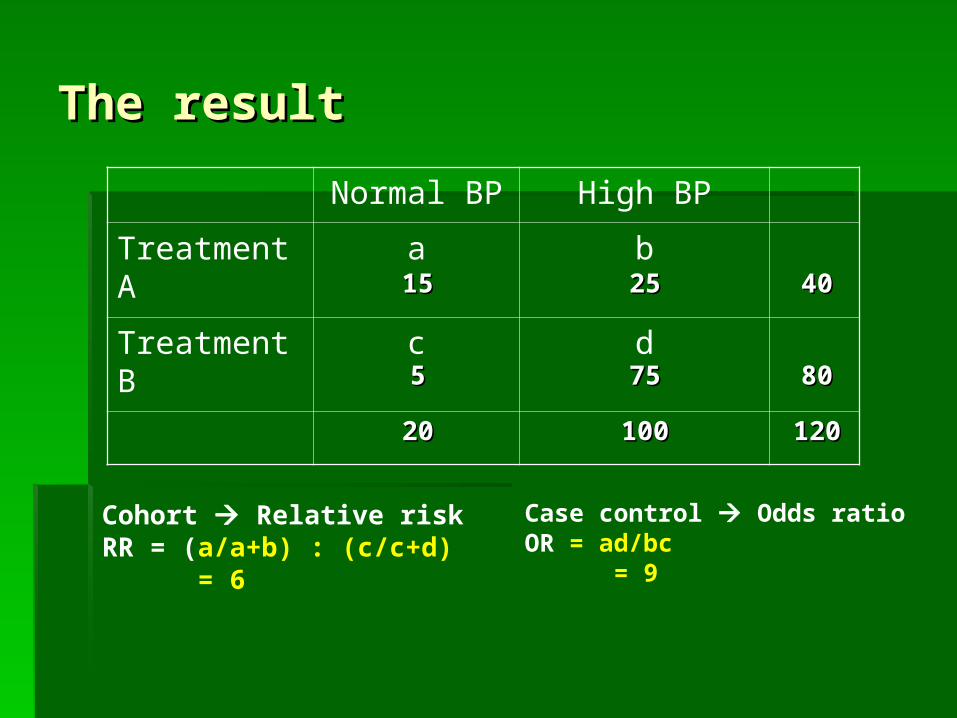
Normal BP High BP
Treatment A
a b
Treatment B
c d
1515 2525 4040
55 7575 8080
2020 100100 120120
The resultThe result
Cohort Relative risk RR = (a/a+b) : (c/c+d) = 6
Case control Odds ratioOR = ad/bc = 9
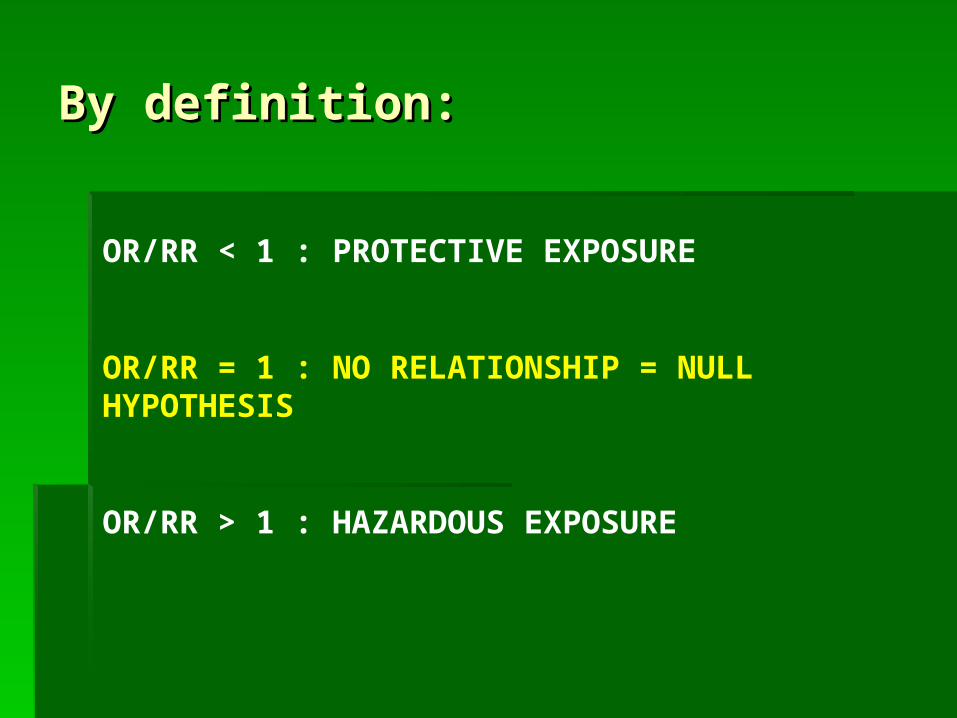
OR/RR < 1 : PROTECTIVE EXPOSURE
OR/RR = 1 : NO RELATIONSHIP = NULL HYPOTHESIS
OR/RR > 1 : HAZARDOUS EXPOSURE
By definition:By definition:

The measurement of blood pressure depends on :
- The patients
Variability
What kind of mistakes could occur during the study ?
- The GPs
- Manometer
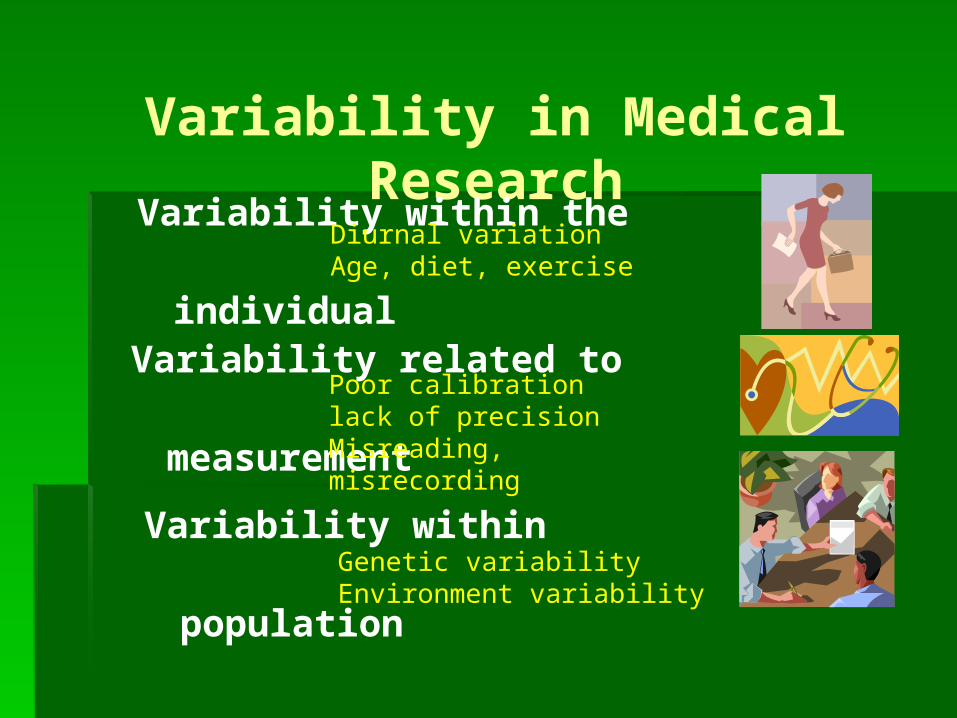
Variability in Medical Research
Variability within the
individual
Variability within
population
Variability related to
measurement
Diurnal variationAge, diet, exercise
Poor calibrationlack of precisionMisreading, misrecording
Genetic variabilityEnvironment variability
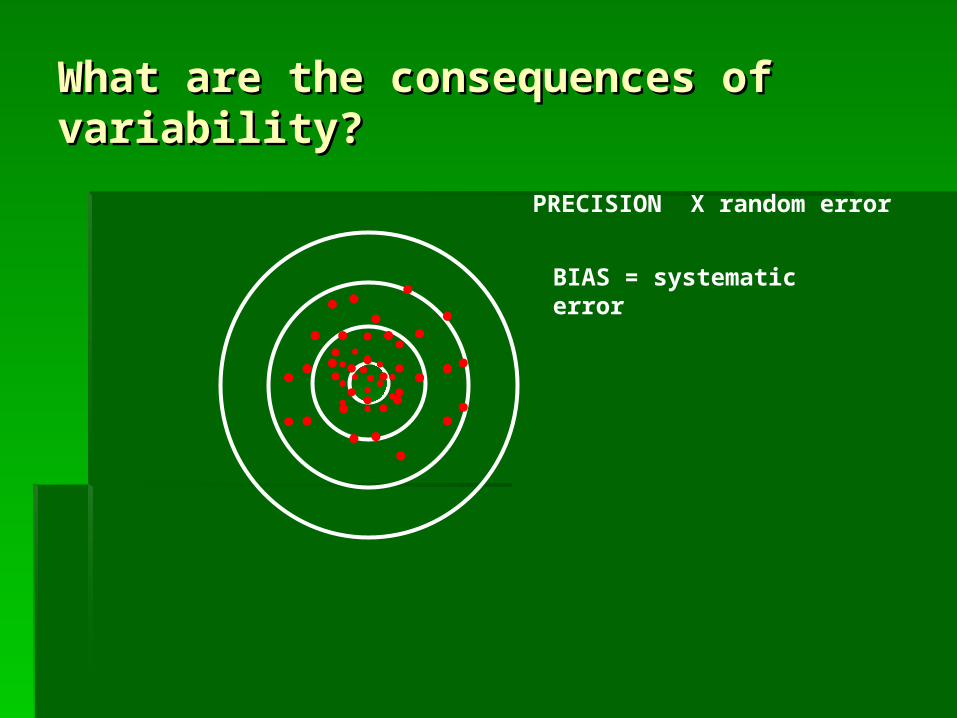
What are the consequences of What are the consequences of variability?variability?
BIAS = systematic error
PRECISION X random error
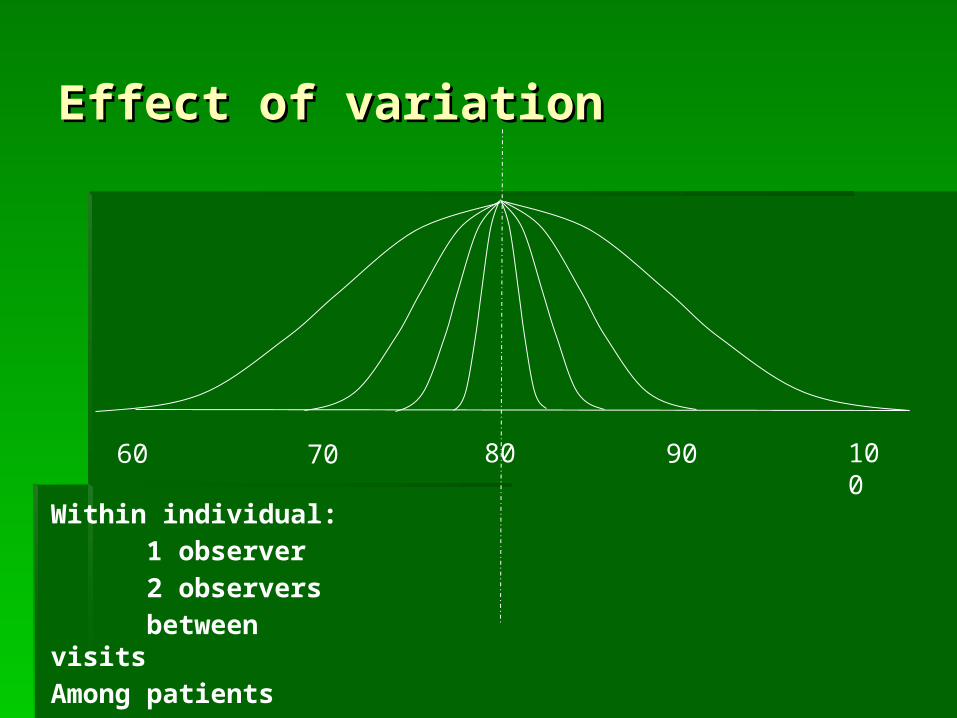
Effect of variationEffect of variation
807060 90 100
Within individual:1 observer2 observersbetween
visitsAmong patients
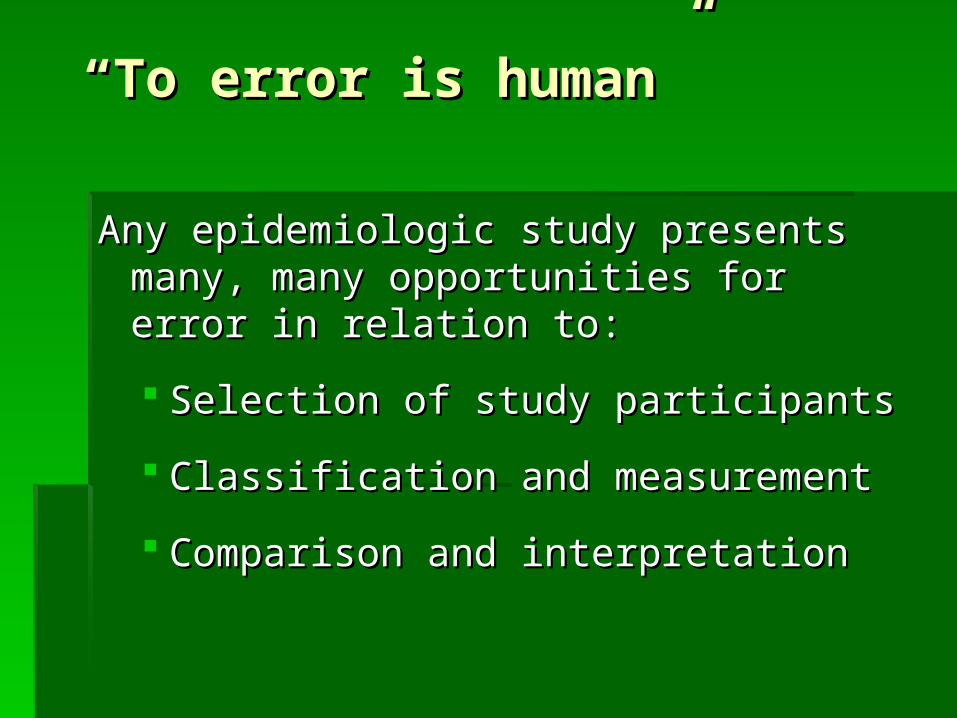
““To error is human”To error is human”
Any epidemiologic study presents Any epidemiologic study presents many, many opportunities for error many, many opportunities for error in relation to:in relation to:
Selection of study participantsSelection of study participants
Classification and measurementClassification and measurement
Comparison and interpretationComparison and interpretation
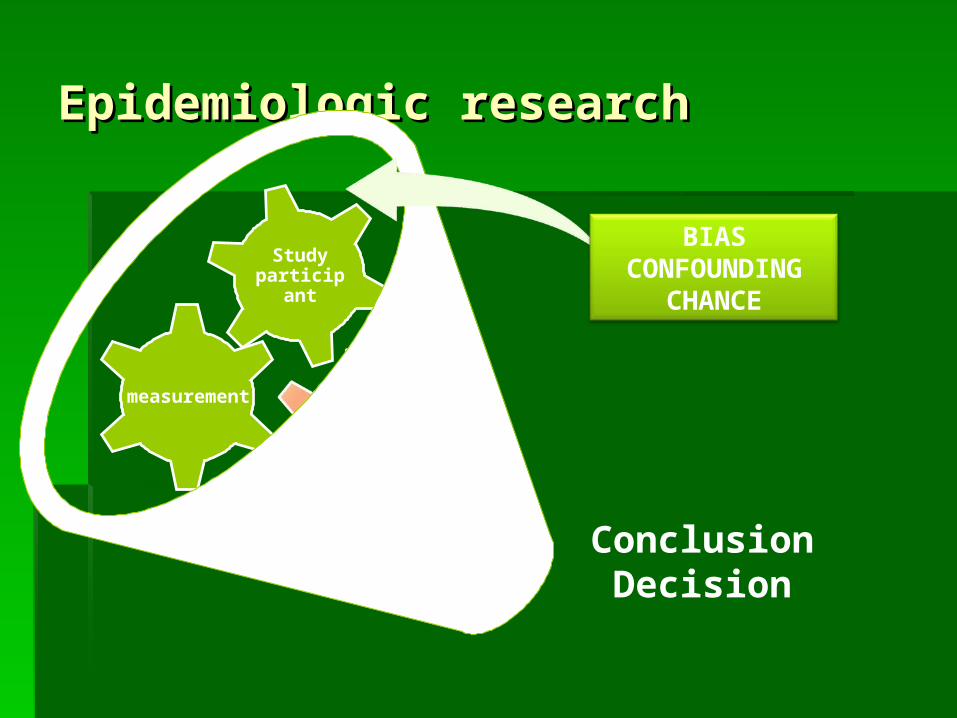
Epidemiologic researchEpidemiologic research
measurement
Study participa
nt
ConclusionDecision
BIASCONFOUNDING
CHANCE

1. HOSPITAL SETTING
CaseCase
(CP)(CP)ControlControl
ExposedExposed
(Asphyxia(Asphyxia))7070 5050 120120
Not exposedNot exposed 3030 5050 8080
100100 100100 200200
OR = ad/bc = 3500/1500 = 2.3
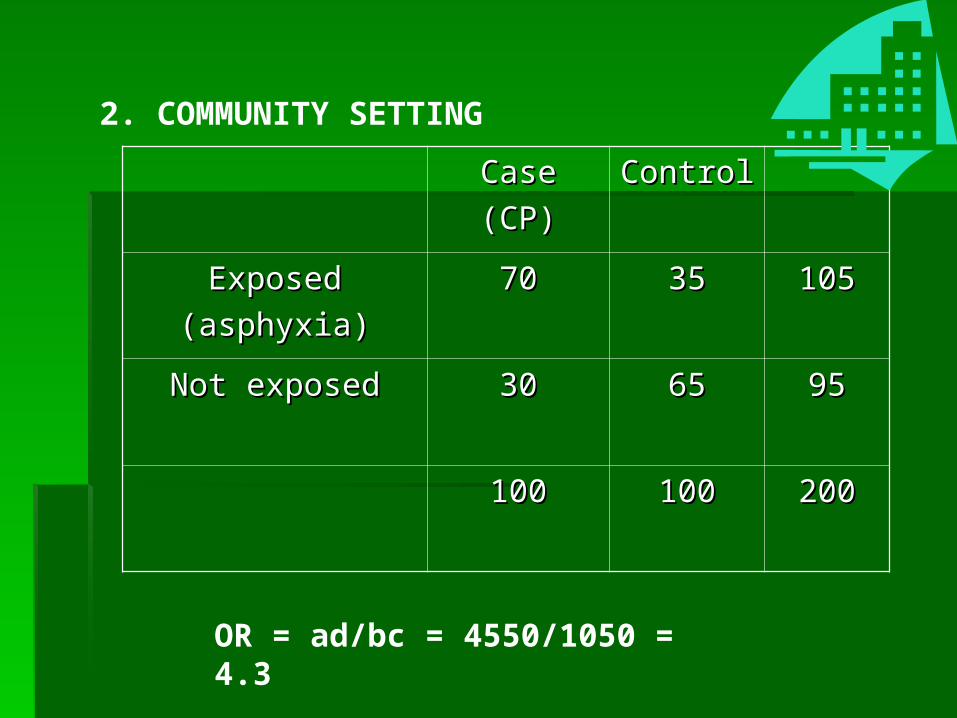
2. COMMUNITY SETTING
CaseCase
(CP)(CP)ControlControl
ExposedExposed
(asphyxia)(asphyxia)7070 3535 105105
Not exposedNot exposed 3030 6565 9595
100100 100100 200200
OR = ad/bc = 4550/1050 = 4.3

WHICH ONE IS THE WHICH ONE IS THE TRUTH?TRUTH?
What should we consider????What should we consider????
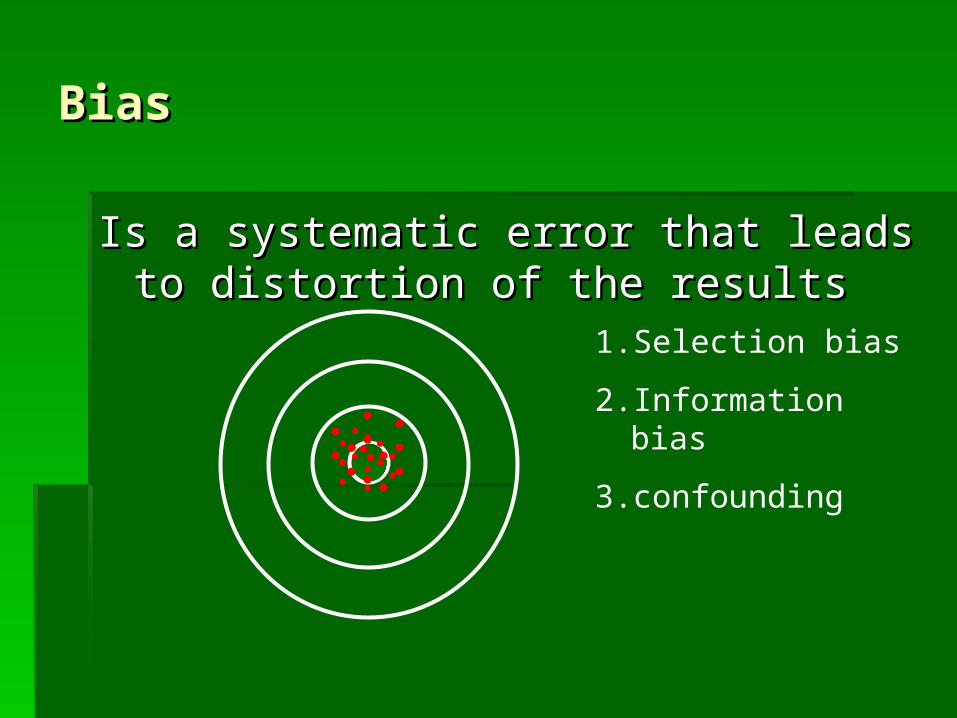
BiasBias
Is a systematic error that leads to Is a systematic error that leads to distortion of the resultsdistortion of the results
1. Selection bias
2. Information bias
3. confounding

Most common biasMost common bias

SELECTION BIASSELECTION BIAS

COHORT CASE CONTROL
Develop CAD
Did not develop CAD
Total CAD (+) CAD (-) Total
Highest quartile of serum cholesterol
85 462 547 38 34 72
Lowest three quartile of serum cholesterol
116 1511 1627 113 117 230
Total 201 1973 2174 151 151 302Odds ratio 2.40 1.16
Selective survival among the prevalent casesSelective survival among the prevalent cases
Prevalence-Incidence bias Prevalence-Incidence bias
Prevalence- incidencePrevalence- incidence
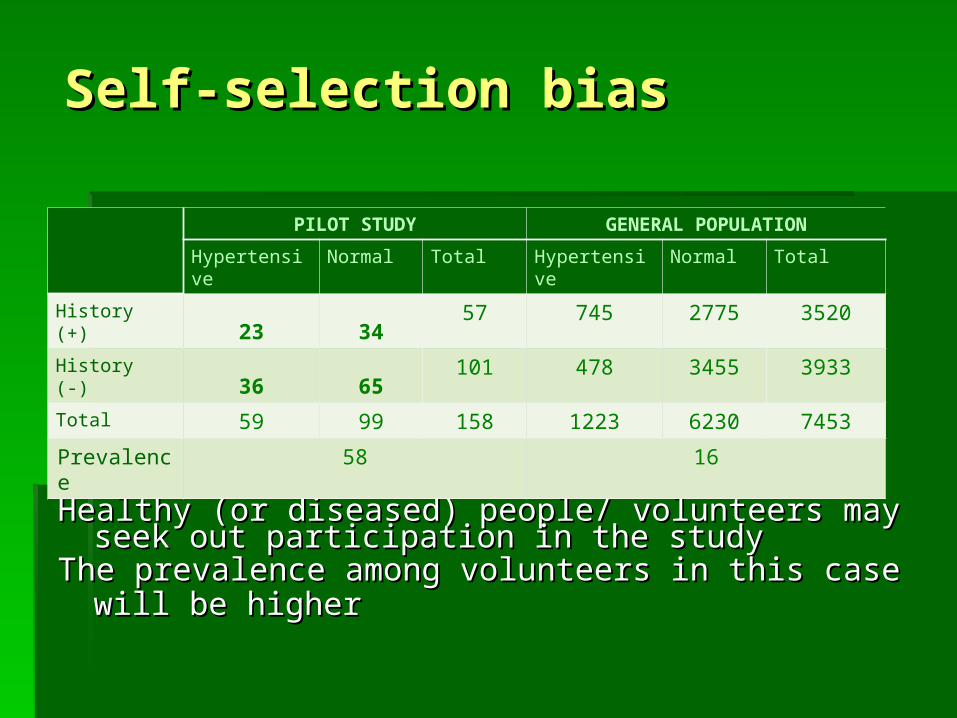
Self-selection bias Self-selection bias
Healthy (or diseased) people/ volunteers may seek Healthy (or diseased) people/ volunteers may seek out participation in the studyout participation in the study
The prevalence among volunteers in this case will The prevalence among volunteers in this case will be higherbe higher
PILOT STUDY GENERAL POPULATION
Hypertensive
Normal Total Hypertensive
Normal Total
History (+) 23 34 57 745 2775 3520
History (-) 36 65 101 478 3455 3933
Total 59 99 158 1223 6230 7453
Prevalence
58 16
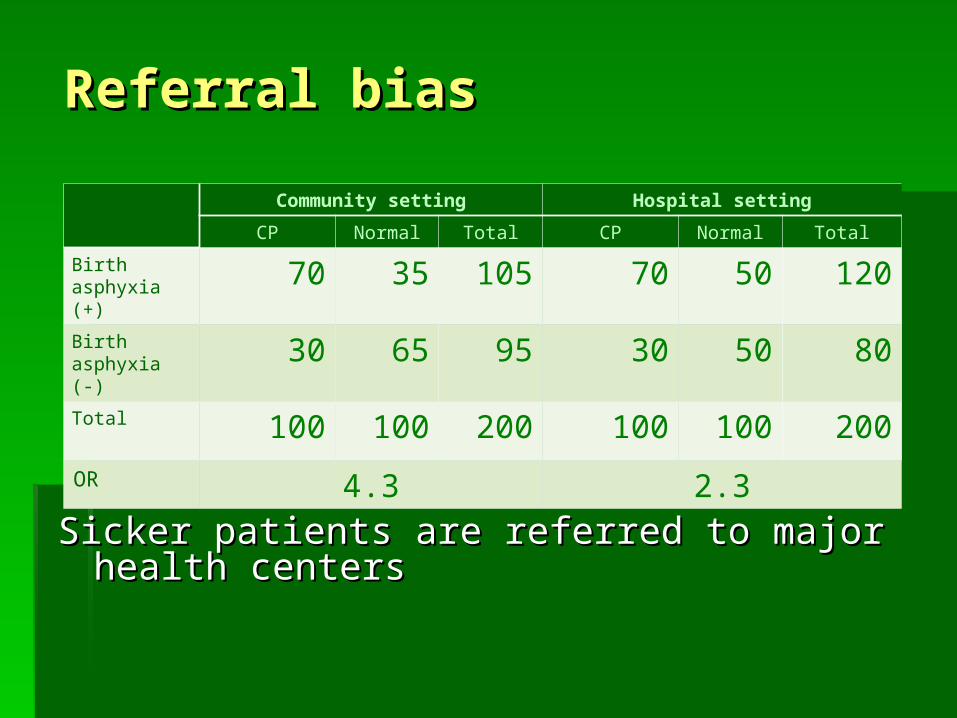
Referral biasReferral bias
Sicker patients are referred to major health Sicker patients are referred to major health centerscenters
Community setting Hospital setting
CP Normal Total CP Normal Total
Birth asphyxia (+) 70 35 105 70 50 120Birth asphyxia (-) 30 65 95 30 50 80Total 100 100 200 100 100 200
OR 4.3 2.3

Response BiasResponse Bias
Response Non response
Total
High school students
Teenage workers
Total
Characteristics of those who response are Characteristics of those who response are different to those who do not response different to those who do not response association will be biased ~ self-selectionassociation will be biased ~ self-selection
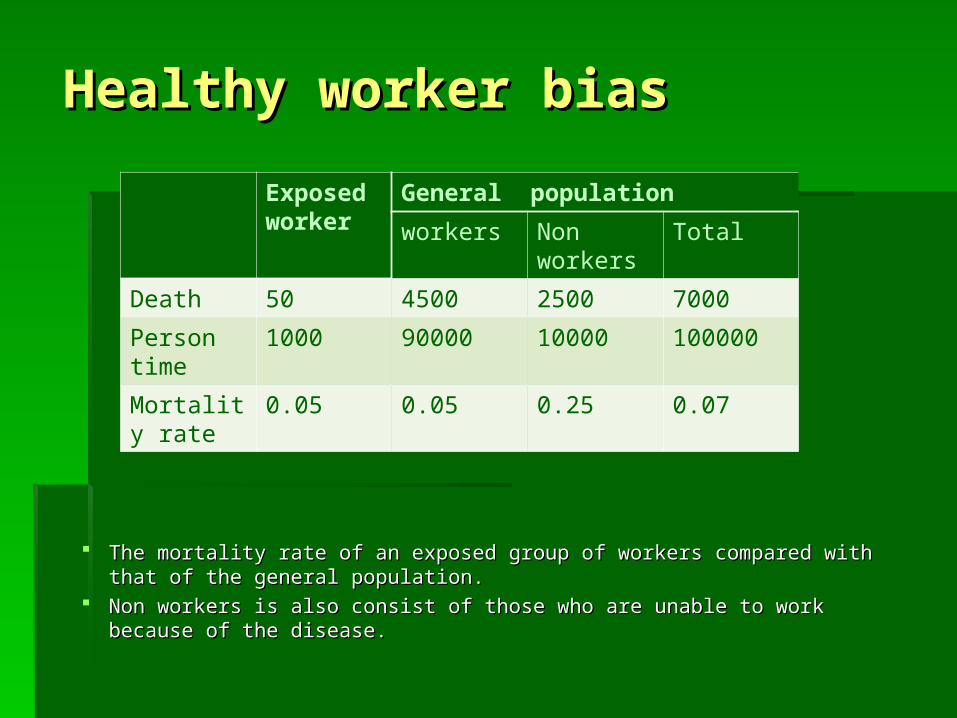
Healthy worker biasHealthy worker bias
Exposed worker
General population
workers Non workers
Total
Death 50 4500 2500 7000
Person time
1000 90000 10000 100000
Mortality rate
0.05 0.05 0.25 0.07
The mortality rate of an exposed group of workers compared with that of The mortality rate of an exposed group of workers compared with that of the general population.the general population.
Non workers is also consist of those who Non workers is also consist of those who are are unable to work because of the unable to work because of the disease.disease.
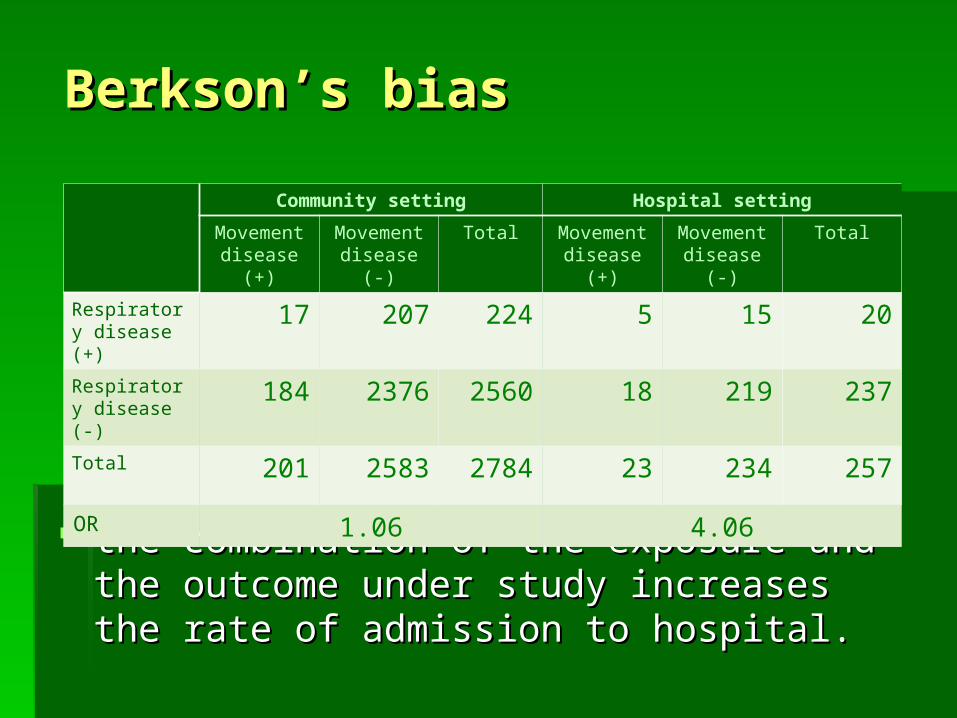
Berkson’s biasBerkson’s bias
the combination of the exposure and the the combination of the exposure and the outcome underoutcome under study increases the rate of study increases the rate of admission to hospital. admission to hospital.
Community setting Hospital setting
Movement disease
(+)
Movement disease (-)
Total Movement disease
(+)
Movement disease (-)
Total
Respiratory disease (+)
17 207 224 5 15 20
Respiratory disease (-)
184 2376 2560 18 219 237
Total 201 2583 2784 23 234 257OR 1.06 4.06

INFORMATION BIASINFORMATION BIAS
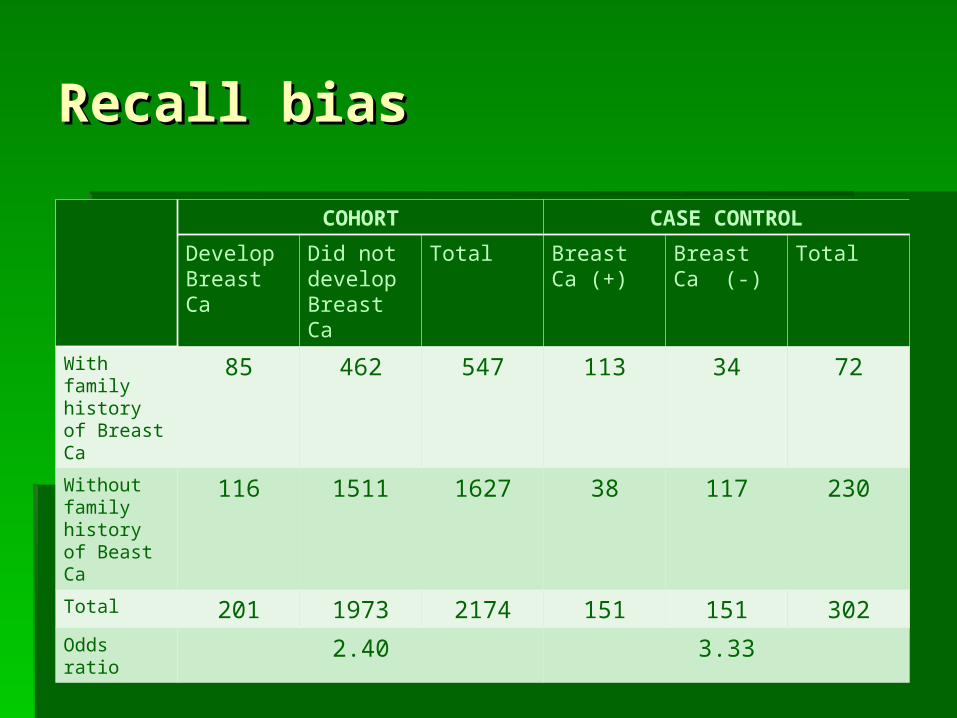
Recall biasRecall bias
COHORT CASE CONTROL
Develop Breast Ca
Did not develop Breast Ca
Total Breast Ca (+)
Breast Ca (-)
Total
With family history of Breast Ca
85 462 547 113 34 72
Without family history of Beast Ca
116 1511 1627 38 117 230
Total 201 1973 2174 151 151 302Odds ratio 2.40 3.33
Recall biasRecall bias
caused by differences in accuracy of caused by differences in accuracy of recalling past events by cases and recalling past events by cases and controlscontrols
There is a tendency for diseased There is a tendency for diseased people (or their relatives) to recall people (or their relatives) to recall past exposures more efficiently than past exposures more efficiently than healthy people (selective recall). healthy people (selective recall).

Non-respondent bias; Loss Non-respondent bias; Loss to follow upto follow up
There are a possibility of different There are a possibility of different condition among:condition among: Non-respondents to a survey from Non-respondents to a survey from
respondentsrespondents Volunteers from non-volunteersVolunteers from non-volunteers Late respondents from early Late respondents from early
respondents, respondents, study dropouts from those who study dropouts from those who
complete the studycomplete the study
Hawthorne BiasHawthorne Bias
How will you act if you know that you How will you act if you know that you are being watched?are being watched? NormalNormal BetterBetter WorseWorse
End-aversion bias End-aversion bias (Measurement bias)(Measurement bias)
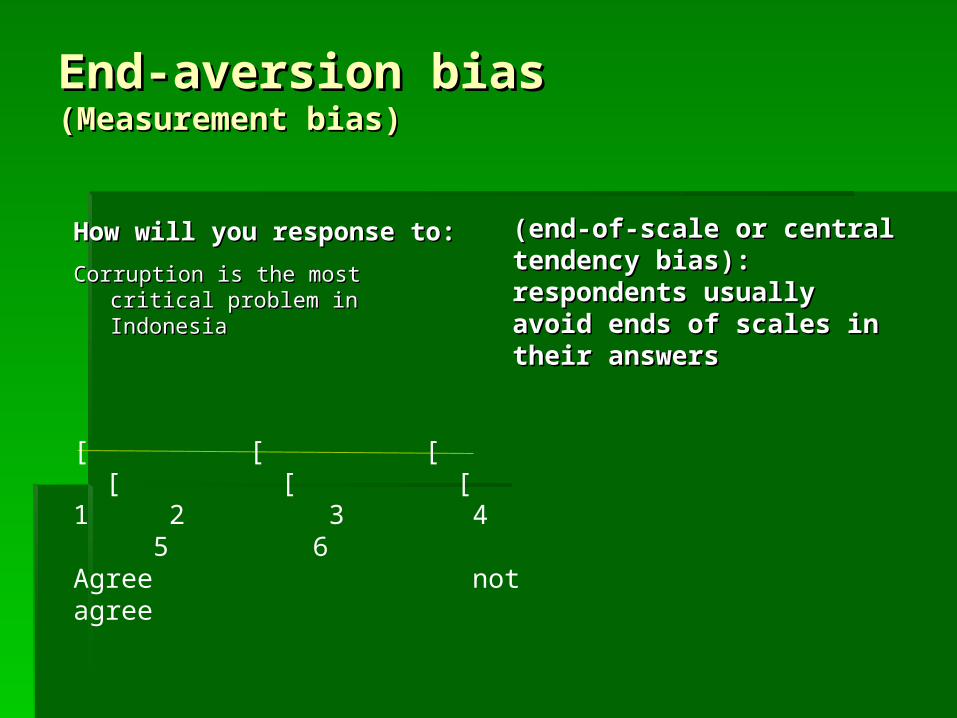
Corruption is the most critical Corruption is the most critical problem in Indonesiaproblem in Indonesia
How will you response to:How will you response to:(end-of-scale or (end-of-scale or central tendency central tendency bias): respondents bias): respondents usually avoid ends of usually avoid ends of scales in their answersscales in their answers
[ [ [ [ [ [1 2 3 4 5 6Agree not agree

Research QuestionResearch Question
What is the odds of suffering What is the odds of suffering influenza among people with and influenza among people with and without influenza immunizationwithout influenza immunization
What is the effect of different ‘case What is the effect of different ‘case definition’definition’ Definition ADefinition A Definition BDefinition B

Definition A Definition B
Disease (+)
Disease (-)
Total Disease (+)
Disease (-)
Total
Immunization (+)
85 61 146 125 92 151
Immunization (-)
66 90 156 26 69 151
Total 151 151 302 151 151 302Prevalence 0.56 0.4 0.83 0.61
Misclassification biasMisclassification bias
Caused by inaccuracy in measurement Caused by inaccuracy in measurement of classification of study variables. of classification of study variables.
The probability of misclassification The probability of misclassification may be the same in all study groups may be the same in all study groups (nondifferential misclassification) (nondifferential misclassification)
It may vary between groups It may vary between groups (differential misclassification) (differential misclassification) different ‘case definition’ between different ‘case definition’ between case and control groups.case and control groups.
