variability and resource utilization of bedside three-dimensional echocardiographic quantitative...
TRANSCRIPT

309
© 2006, the AuthorsJournal compilation © 2006, Blackwell Publishing, Inc.
Congenit Heart Dis.
2006;1:309–314
Blackwell Publishing IncMalden, USACHDCongenital Heart Disease© 2006 The Authors; Journal compilation © 2006 Blackwell Publishing, Inc.? 200616309314Original Article
Variability and Resource Utilization of 3D-LVVABaker et al.
Variability and Resource Utilization of Bedside Three-dimensional Echocardiographic Quantitative Measurements of Left Ventricular Volume in Congenital Heart Disease
George Baker, MD,* English Flack, MS,
†
Anthony Hlavacek, MD,* Karen Chessa, RDCS,* Dawn Fleming, RDCS,* Mark Scheurer, MD,
‡
and Girish Shirali, MBBS, FACC*
*Pediatric Cardiology and
†
College of Medicine, Medical University of South Carolina, Charleston, SC, USA;
‡
The Children’s Hospital, Boston, Mass, USA
A B S T R A C T
Objectives.
This study evaluated the variability and time resource utilization of bedside 3-dimensional echocardio-graphic left ventricular volume analysis (3D-LVVA) in congenital heart disease (CHD).
Background.
There are currently limited data on the resource utilization and variability of 3D-LVVA in the CHD.
Methods.
Four reviewers of varying experience levels were timed performing 15 on-scanner 3D-LVVAs. Inter- andintraobserver variability for left ventricular end-diastolic volume (LVEDV), end-systolic volume (LVESV), andejection fraction (LVEF) was evaluated.
Results.
Median age was 12.7 years (0.6–33 years). Diagnoses were: normal (n
=
4), cardiomyopathy (n
=
4), ven-tricular septal defect (n
=
2), and atrioventricular canal, tricuspid atresia, bicuspid aortic valve, left ventricularhypertrophy, and heart transplant (n
=
1 each). For interobserver variability, intraclass correlation coefficients (ICCs)for all possible combinations of reviewers were: LVEDV, 0.991–0.999 (
P
<
.01); LVESV, 0.98–0.99 (
P
<
.01); LVEF,0.95–0.98 (
P
<
.01). Bland–Altman plot mean differences (
±
2SD) were: LVEDV,
−
3
±
14%; LVESV,
−
5.4
±
21.4%;LVEF, 1.2
±
14.7%. Interobserver variability of LVESV was not dependent on ventricular volumes (
P
=
.25;
r
2
=
0.01) or heart rate (
P
=
.43;
r
2
=
0.003). For intraobserver variability, ICCs for 2 reviewers were LVEDV, 0.99,0.99 (
P
<
.01); LVESV, 0.99, 0.99 (
P
<
.01); and LVEF, 0.94, 0.94 (
P
<
.01), respectively. Bland–Altman plot meandifferences (
±
2SD) were: LVEDV,
−
1
±
9.2%; LVESV, 0
±
19.6%; LVEF,
−
2.2
±
24%.
Conclusion.
Reviewers with varying experience levels can accomplish 3D-LVVA at the bedside with acceptableinter- and intraobserver reproducibility, providing the rationale for integrating 3D-LVVA into the care of CHDpatients.
Key Words.
Three-dimensional Echocardiography; Left Ventricular Volume Analysis; Resource Utilization; Inter-
observer Variability; Intraobserver Variability
Introduction
hree-dimensional echocardiography (3DE)has evolved from a complex, time-consuming
process into a practical bedside tool. It has gainedsignificant clinical application in assisting inter-ventional catheterization procedures and improv-ing the visualization of anatomical structures.
1–5
3DE now uses matrix array transducers to rapidlyacquire full-volume data sets that encompassentire cardiac chambers. Current software toolspermit continuous direct measurement of myocar-dial wall deformation as well as 3-dimensional leftventricular volume analysis (3D-LVVA), without
T
geometrical assumptions.
6,7
Numerous studieshave validated the diagnostic potential of 3D-LVVA and its superior accuracy to 2-dimensionalechocardiography (2DE) (in comparison withmagnetic resonance imaging [MRI] as a gold stan-dard) in adults and children.
6,7
Increased sophisti-cation of software products, combined withincreased processing speed, has potentiallydecreased the time and labor involved in perform-ing 3D-LVVA.
Recently, 3D-LVVA software applications havebecome available on the echocardiographic scan-ner. Rapid, bedside 3D-LVVA to assess left ven-tricular function and cardiac output is likely to be

310
Baker et al.
Congenit Heart Dis.
2006;1:309–314
valuable for children, in whom 2DE measure-ments are limited by geometric assumptions andtime constraints, and serial invasive measurementshave limited practicality. While 3D-LVVA has thepotential to become part of the routine echocar-diographic evaluation, the integration of any newtechnology into mainstream clinical medicine is,in large part, dependent on its reproducibility inthe clinical setting, and the resource utilization itrequires.
To our knowledge, no study to date has ana-lyzed the reproducibility, variability, or resourceutilization of bedside 3D-LVVA in patients pre-senting to a congenital heart disease (CHD)echocardiographic laboratory. In this study, weevaluated the time necessary to accomplish bed-side 3D-LVVA by users with various levels ofexperience. Furthermore, we examined both theinterobserver and intraobserver variability of 3D-LVVA in the clinical setting of CHD.
Methods
Eighteen full-volume 3D data sets were selectedfrom routine echocardiograms that were per-formed in July and August of 2005. All data setswere obtained with a Philips iE33 echocardio-graphic scanner (Philips Medical Systems,Andover, Mass, USA) using an X3-1 full matrixarray transducer. The data sets were made anony-mous, then reviewed by 1 investigator (G.B.) toensure they contained the left ventricular cavitythroughout the entire cardiac cycle and did notcontain significant translational artifact. Threedata sets were excluded and 15 were selected. Thestudy was reviewed and approved by the Institu-tional Review Board on human research.
Four reviewers (1 attending echocardiographer,2 sonographers, and a senior cardiology fellow)analyzed each data set using the 3D volume quan-tification software on the bedside scanner (3DQAdvanced, Philips Medical Systems). All of thereviewers were familiar with the 3D quantificationsoftware, but had differing levels of experience.The reviewers rated their own level of experienceon a scale from 1 to 4 (1
=
little experience,2
=
some experience, 3
=
moderately experienced,and 4
=
very experienced).The 3D-LVVA is a multistep process beginning
with orienting the three 2-dimensional orthogonalplanes (apical 4-chamber, apical 2-chamber, andshort axis) so that they bisect the left ventricle andincorporate the true ventricular apex. The nextstage involves setting 5 anatomical landmarks (the
hinges of the mitral valve in the 2 orthogonalapical views, and the apical endocardium) in bothend-diastole and end-systole. This step allows theedge detection algorithm to build a 3D model ofthe endocardial border at end-diastole and end-systole, providing a 3D ejection fraction. Theoperator then examines the accuracy of theendocardial border detection and manually editsareas in which the tracking appears suboptimal.Once the operator is satisfied, he or she initiatesthe software to perform the volumetric analysis,which provides a cast of the left ventricular cavitythroughout the cardiac cycle. Time in seconds wasrecorded for each reviewer, with each data set,from the moment the data set was loaded into thesoftware until the initiation of the volumetricanalysis. Left ventricular end-diastolic volume(LVEDV), left ventricular end-systolic volume(LVESV), and left ventricular ejection fraction(LVEF) results were recorded for each 3D-LVVA.
Statistical Analysis
A 2-tailed, paired Student’s
t
-test was performedto compare the times of each combination ofreviewers. Both interobserver and intraobservervariability for LVEDV, LVESV, and LVEF wereanalyzed with multiple statistical methods. Toevaluate interobserver variability, regression anal-ysis was performed and regression lines were com-pared with the line of equality for assessment ofagreement and correlation. Intraclass correlationcoefficients (ICCs) with 95% confidence intervalswere calculated for all 6 possible combinations ofthe 4 reviewers for LVEDV, LVESV, and LVEF.
8
Interobserver agreement was further evaluated forall 3 indices using Bland–Altman analysis with95% limits of agreement by plotting the differencebetween measurements as a percent of the mean,against the mean of the measurements for 2observers (
P
<
.05 was considered significant).
9
The 3D-LVVA software has certain frame ratelimitations (17–22 fps), which could hypotheti-cally hinder appropriate end-systolic frame selec-tion in patients with smaller ventricular volumesor higher heart rates. To evaluate this, we exam-ined interobserver variability as a function of mea-sured ventricular volume, and separately, as afunction of heart rate. This was done by perform-ing a regression analysis between the coefficient ofvariability among LVESV measurements (stan-dard deviation/mean), and both ventricular vol-ume and heart rate.
To evaluate intraobserver variability, 3D-LVVAwas repeated by 2 of the reviewers approximately

Variability and Resource Utilization of 3D-LVVA
311
Congenit Heart Dis.
2006;1:309–314
1 month from the initial measurements. Thereviewers were blinded to their previous results.ICCs with 95% confidence intervals were calcu-lated for LVEDV, LVESV. and LVEF for eachobserver.
8
Intraobserver agreement was furtherevaluated using Bland–Altman analysis with 95%limits of agreement for LVEDV, LVESV, andLVEF.
9
Results
The median age of the study population was12.7 years (range 6 months
−
33 years); the medianbody surface area was 1.5 m
2
(range 0.34–2.04 m
2
).The patients’ diagnoses included: normal hearts(n
=
4), dilated cardiomyopathy (n
=
3), ventricu-lar septal defect (n
=
2), hypertrophic cardiomyop-athy (n
=
1), atrioventricular canal (n
=
1),tricuspid atresia (n
=
1), bicuspid aortic valve(n
=
1), left ventricular hypertrophy (n
=
1), andstatus post heart transplant (n
=
1).The median end-diastolic volume, end-systolic
volume, and ejection fraction were 80.3 mL (range8.2–209.3 mL), 34.2 mL (range 4.8–156.8 mL),and 54.6 (range 24.2–72.1), respectively (Figures1–3). The median time required for all 3D-LVVAswas 1 minute 27 seconds (range 45 seconds to7 minutes 37 seconds). The median times for theindividual reviewers were: sonographer A
=
59seconds (range 45 seconds to 1 minute 31 sec-onds); attending
=
1 minute 27 seconds (range1 minute 2 seconds to 2 minutes 46 seconds);third-year fellow
=
1 minute 26 seconds (range1 minute 17 seconds to 1 minute 51 seconds);sonographer B
=
2 minutes 15 seconds (range1 minute 43 seconds to 7 minutes 37 seconds).Fifty-nine out of the 60 timed 3D-LVVAs wereperformed in less than 3 minutes each (Figure 4).
Comparisons of each reviewer’s median time tothe median times for every other reviewer werecomputed. There appeared to be an inverse rela-
tionship between 3D-LVVA experience self-ratingscore and performance time (Figure 4). Sonogra-pher A had the shortest median time (
P
<
.05), andone of the highest self-rating scores, while sonog-rapher B had the longest median time (
P
<
.05)and the lowest self-rating score. In addition,sonographer B exhibited a learning curve over themonth separating the 2 sets of measurements per-formed for intraobserver analysis, during whichher mean performance time went from 2 minutes15 seconds to 1 minute 36 seconds. (
P
<
.01)(Figure 5).
Figure 1.
LVEDV results—all reviewers.
250
200
150
1 2 3
3D Data set
LV
ED
V (
ml)
4 5 6 7 8 9 10 11 12 13 14 15
100
50
0
Figure 2.
LVESV results—all reviewers.
160
120
80
40
1 2 3 4 5 6 7
3D Data set
LVE
SV
(m
l)
8 9 10 11 12 13 14 15
0
Figure 3.
LVEF results—all reviewers.
80
60
40
20
1 2 3
3D Data set
LV
EF
(%
)
4 5 6 7 8 9 10 11 12 13 14 150
Figure 4.
3D-LVVA performance times. SNA indicatessonographer A; SNB, sonographer B; ATT, attendingechocardiographer; TYF, third year pediatric cardiology fel-low; AVG, average. Number in parentheses is the reviewer’sexperience level (1
=
little experience; 2
=
some experience;3
=
moderately experienced; 4
=
very experienced).
8
7
3
2
1
0SNA (4)
Tim
e (M
inut
es)
SNB (2) ATT (4) TYF (3) AVG
312
Baker et al.
Congenit Heart Dis.
2006;1:309–314
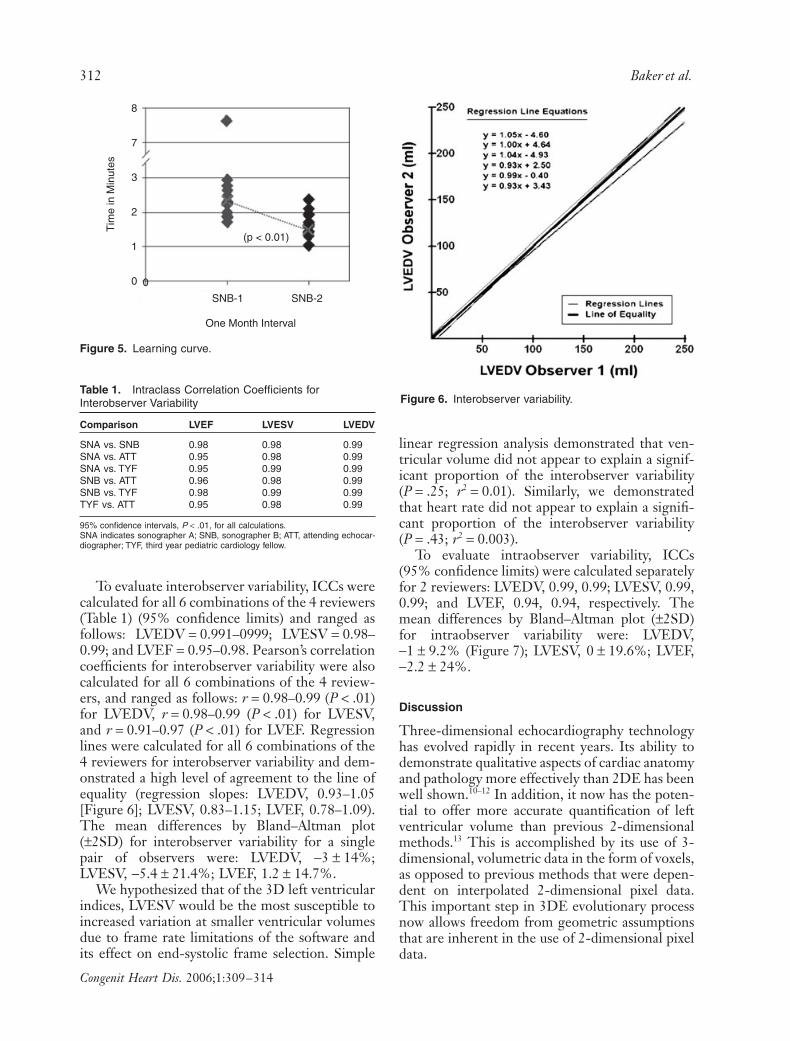
To evaluate interobserver variability, ICCs werecalculated for all 6 combinations of the 4 reviewers(Table 1) (95% confidence limits) and ranged asfollows: LVEDV
=
0.991–0999; LVESV
=
0.98–0.99; and LVEF
=
0.95–0.98. Pearson’s correlationcoefficients for interobserver variability were alsocalculated for all 6 combinations of the 4 review-ers, and ranged as follows:
r
=
0.98–0.99 (
P < .01)for LVEDV, r = 0.98–0.99 (P < .01) for LVESV,and r = 0.91–0.97 (P < .01) for LVEF. Regressionlines were calculated for all 6 combinations of the4 reviewers for interobserver variability and dem-onstrated a high level of agreement to the line ofequality (regression slopes: LVEDV, 0.93–1.05[Figure 6]; LVESV, 0.83–1.15; LVEF, 0.78–1.09).The mean differences by Bland–Altman plot(±2SD) for interobserver variability for a singlepair of observers were: LVEDV, −3 ± 14%;LVESV, −5.4 ± 21.4%; LVEF, 1.2 ± 14.7%.
We hypothesized that of the 3D left ventricularindices, LVESV would be the most susceptible toincreased variation at smaller ventricular volumesdue to frame rate limitations of the software andits effect on end-systolic frame selection. Simple
linear regression analysis demonstrated that ven-tricular volume did not appear to explain a signif-icant proportion of the interobserver variability(P = .25; r2 = 0.01). Similarly, we demonstratedthat heart rate did not appear to explain a signifi-cant proportion of the interobserver variability(P = .43; r2 = 0.003).
To evaluate intraobserver variability, ICCs(95% confidence limits) were calculated separatelyfor 2 reviewers: LVEDV, 0.99, 0.99; LVESV, 0.99,0.99; and LVEF, 0.94, 0.94, respectively. Themean differences by Bland–Altman plot (±2SD)for intraobserver variability were: LVEDV,−1 ± 9.2% (Figure 7); LVESV, 0 ± 19.6%; LVEF,−2.2 ± 24%.
Discussion
Three-dimensional echocardiography technologyhas evolved rapidly in recent years. Its ability todemonstrate qualitative aspects of cardiac anatomyand pathology more effectively than 2DE has beenwell shown.10–12 In addition, it now has the poten-tial to offer more accurate quantification of leftventricular volume than previous 2-dimensionalmethods.13 This is accomplished by its use of 3-dimensional, volumetric data in the form of voxels,as opposed to previous methods that were depen-dent on interpolated 2-dimensional pixel data.This important step in 3DE evolutionary processnow allows freedom from geometric assumptionsthat are inherent in the use of 2-dimensional pixeldata.
Figure 5. Learning curve.
8
7
3
(p < 0.01)
0
SNB-1
One Month Interval
Tim
e in
Min
utes
SNB-2
2
1
0
Table 1. Intraclass Correlation Coefficients for Interobserver Variability
Comparison LVEF LVESV LVEDV
SNA vs. SNB 0.98 0.98 0.99SNA vs. ATT 0.95 0.98 0.99SNA vs. TYF 0.95 0.99 0.99SNB vs. ATT 0.96 0.98 0.99SNB vs. TYF 0.98 0.99 0.99TYF vs. ATT 0.95 0.98 0.99
95% confidence intervals, P < .01, for all calculations.SNA indicates sonographer A; SNB, sonographer B; ATT, attending echocar-diographer; TYF, third year pediatric cardiology fellow.
Figure 6. Interobserver variability.

Variability and Resource Utilization of 3D-LVVA 313
Congenit Heart Dis. 2006;1:309–314
Prior 3DE approaches accomplished freedomfrom geometric assumptions at the cost of time byusing resource-intensive manipulations of datasets, which relegated 3DE to research laboratoriesand hindered its mainstream acceptance. Recenttechnologic advancements have led to rapid pro-cessing speeds and have made 3D-LVVA softwareapplications available on the echocardiographicscanner. While these advancements make 3D-LVVA more available to the clinician, they posethe challenge of evaluating what additional timeand resources must be expended for such analysis.To our knowledge, this is the first systematic effortto examine the reproducibility of this new bedsidetechnology outside the research environment, andits time resource utilization in a simulated clinicalenvironment.
The current study examined 3D-LVVA in asmall group of patients who span a wide range ofbody sizes and cardiac diagnoses. These patientsare representative of the population encounteredin the daily workflow of a pediatric echocardio-graphy laboratory. This study demonstrates that3D-LVVA can be accomplished rapidly at the bed-side using quantification software that is commer-cially available on the scanner. The median of all3D-LVVA performance times was approximately90 seconds, with only 1 of 60 analyses extendinglonger than 3 minutes. One could extrapolate thatperforming 3D-LVVA would likely add a few min-utes to the average echocardiogram. In addition,if this analysis were used in lieu of other forms ofLVVA, its effect on resource utilization perechocardiogram would be even less.
As one might expect, the reviewer’s self-ratedlevel of 3D-LVVA experience appeared to have aninverse relationship with median performancetime, suggesting that median performance timesfall with increased experience. However, the clin-
ical relevance of this effect is likely small given thatthe difference between the longest and shortestmedian performance time in our group was only1 minute 16 seconds. Interestingly, our least expe-rienced reviewer had a significant decrease inmean performance time over a 1-month interval,which suggests that median performance timecould potentially improve with increasedexperience.
Analyses of interobserver and intraobservervariability using multiple statistical methods dem-onstrated a high level of agreement and low levelof variability in a clinical, bedside environment.We hypothesized that variability would increasewith lower ventricular volumes and higher heartrates. As heart rate increases and ventricular vol-ume falls, it follows that frame rate limitationsmight interfere with appropriate end-systolicframe selection. In our study, neither heart ratenor ventricular volume contributed significantly tovariability in LVESV measurements. While thesample size of this study was powered for evalua-tion of inter- and intraobserver variability, it mayhave been too small to demonstrate the effects ofheart rate and ventricular volumes on variability.
LimitationsThe current study was not designed for assessmentof acquisition time. Additionally, there is potentialfor selection bias because the data sets selectedwere not sequential. This process was deliberatelychosen in order to tightly focus the objective ofthe study. We did not examine the accuracy ofmeasurements relative to a gold standard. How-ever, the accuracy of 3D-LVVA compared withMRI has been published recently from severalcenters.6,7 Finally, the current study examined onlyleft ventricular volumes, and did not evaluate theright ventricle. Tools for volume quantification of
Figure 7. Intraobserver variabil-ity (%) —Bland–Altman analysis.
10%
5%
0%
LVE
DV
% D
iffer
ence
(Obs
erva
tion
1 -
Obs
erva
tion
2)M
ean
LVE
DV
0 50 100 150 200 250
9.2 (+2SD)
–9.2 (–2SD)
(Mean Difference = 0)
–5%
–10%
Mean LVEDV [(Observation 1 + Observation 2)/2]–15%

314 Baker et al.
Congenit Heart Dis. 2006;1:309–314
the right ventricle remain cumbersome, thus pre-cluding their routine use.
Conclusion
Currently, rapid assessment of dynamic left ven-tricular volume by 3DE has significant clinicalutility, and is practical in the clinical setting ofCHD. In our study, users of varying experiencelevels were able to efficiently perform 3D-LVVAin a clinically acceptable amount of time withexcellent inter/intraobserver reproducibility. Asthis technology evolves, it is likely that the abilityto perform quantitative, dynamic assessment ofentire chambers and structures through the car-diac cycle will have important potential applica-tions in children and adults with CHD.
Corresponding Author: George Hamilton Baker,MD, Children’s Heart Program of South Carolina, 165Ashley Ave, PO Box 250915, Charleston, SC 29425,USA. Tel: (+1) 843-792-3300; Fax: (+1) 843-792-3284;E-mail: baker@ musc.edu
Accepted in final form: September 7, 2006.
References
1 Roman KS, Nii M, Golding F, Benson LE, Small-horn JF. Images in cardiovascular medicine. Real-time subcostal 3-dimensional echocardiography forguided percutaneous atrial septal defect closure.Circulation. 2004;109:e320–e321.
2 Hlavacek AM, Chessa K, Crawford FA, Shirali GS.Real-time three-dimensional echocardiography isuseful in the evaluation of patients with atrioventric-ular septal defects. Echocardiography. 2006;23:225–231.
3 Baker GH, Pereira NL, Hlavacek AM, Chessa K,Shirali GS. Transthoracic real-time three-dimen-sional echocardiography in the diagnosis anddescription of noncompaction of the ventricularmyocardium. Echocardiography. 2006;23:490–494.
4 Hlavacek AM, Lucas JF, Chessa K, Shirali GS.Three-dimensional color flow Doppler echocardio-graphy enhances visualization of the aortic arch.Echocardiography 2006 (in press).
5 Scheurer M, Ruff P, Bandisode VM, Shirali GS.Early experience with real-time three-dimensionalechocardiography for guiding endomyocardialbiopsy in children. Echocardiography. 2006;23:45–49.
6 Caiani EG, Corsi C, Zamorano J, et al. Improvedsemi-automated quantification of left ventricularvolumes and ejection fraction using 3-dimensionalechocardiography with a full matrix-array trans-ducer: comparison with magnetic resonance imag-ing. J Am Soc Echocardiogr. 2005;18:779–788.
7 Bu L, Munns S, Zhang H, et al. Rapid full volumedata acquisition by real-time 3-dimensionalechocardiography for assessment of left ventricularindexes in children: a validation study comparedwith magnetic resonance imaging. J Am Soc Echocar-diogr. 2005;18:299–305.
8 Muller R, Buttner P. A critical discussion of intrac-lass correlation coefficients. Stat Med. 1997;15:821–823.
9 Bland JM, Altman DG. Statistical methods forassessing agreement between two methods of clini-cal measurement. Lancet. 1986;1:307–310.
10 Chung R, Pepper J, Henein M. Images in cardiol-ogy: mitral valve anterior leaflet prolapse by realtime three-dimensional transthoracic echocardio-graphy. Heart. 2005;91:e55.
11 Nanda N, Lang R, Kisslo J, et al. Examination pro-tocol for three-dimensional echocardiography.Echocardiography. 2004;21:763–768.
12 El Muayed M, Burjonroppa SC, Croitoru M. Addedaccuracy with 3D echocardiographic imaging of val-vular vegetations. Echocardiography. 2005;22:361–362.
13 Kuhl HP, Schreckenberg M, Rulands D, et al.High-resolution transthoracic real-time three-dimensional echocardiography: quantitation of car-diac volumes and function using semi-automatedborder detection and comparison with cardiac mag-netic resonance imaging. J Am Coll Cardiol.2004;43:2083–2090.