vapor pressures and heats of - digital library/67531/metadc670628/m2/1/high...vapor pressures and...
TRANSCRIPT

DOE I PC92544--7'-2
VAPOR PRESSURES AND HEATS OF VAPORIZATION OF PRIMARY COAL TARS
E. M. SUUBERG (PRINCIPAL INVESTIGATOR) V, OJA (GRADUATE STUDENT) W.D, LILLY (STAFF)
DIVISION OF ENGINEERING BROWN UNIVERSITY PROVIDENCE, RI 02912 TEL. (401) 863-1420
QUARTERLY TECHNICAL PROGRESS REPORT 1 JULY, 1995- 30 SEPTEMBER, 1995
PREPARED FOR: U, S. DEPT. OF ENERGY PITTSBURGH ENERGY TECHNOLOGY CENTER P.O. BOX 10940 PITTSBURGH, PA 15236
DR, KAMALENDU DAS, METC, MORGANTOWN , WV TECHNICAL PROJECT OFFICER
"USDOE Patent Clearance is required prior to the publication of this document"
1. General Background
As the world continues to deplete its petroleum reserves, then heavy crude oil, coal liquids, and other heavy fossil fuels may be required to meet the world energy needs. Heavy fossil fuels contain molecules that are large and more aromatic and that contain more heteroatoms than those found in liquid crude oil.
There is also significant current interest in general area of coal pyrolysis, particularly with with respect to comprehensive models of this complicated phenomenon. This interest derives from central role of pyrolysis in all thermally driven coal conversion processes - gasification, combustion, liquefaction, mild gasification, or thermal benefication. There remain several key data needs in these application areas. Among them is a need for more reliable correlation for prediction of vapor pressure of heavy, primary coal tars. Such information is important in design of all coal conversion processes, in which the volatility of tarry products is of major concern.
The vapor pressure correlations that exist at present for coal tars are very crude and they are not considered reliable to even an order of magnitude when applied to tars. Sophisticated general correlative approaches are slowly being developed, based upon group contribution methods, or based upon some key functional features of the molecules. These are as yet difficult to apply to coal tars. The detailed group contribution methods, in which fairly precise structural information is needed, do not lend themselves well for application to very complex, poorly characterized coal tars. The methods based upon more global types of characterizations have not yet dealt much with the question of oxygenated functional groups. In short, only very limited correlations exist, and these are not considered reliable to even an order of magnitude when applied to tars.
The present project seeks to address this important gap in the near term by direct measurement of vapor pressures of coal tar fractions, by application of well-established techniques and modifications thereof. The principal objectives of the program are to: 1) obtain data on the vapor pressures and heats of vaporization of tars from a range of ranks of coal, 2) develop correlations based on a minimum set of conveniently measurable characteristics of the tars, 3) develop equipment that would allow performing such measurements in a reliable, straightforward fashion.

2. Result from this Quarter
A significant amount of time has been devoted during this quarter to extending the work on measurements of vapor pressures of tars. For this purpose, cellulose tar and cellulose tar related compounds have been selected as model systems. Cellulose tar has a much narrower distribution of molecular weights than does coal tar, and it is much more homogeneous. Thus it is better to develop the methods to be used for coal tars on this simpler model system first.
2.1. Vapor pressure and heat vaporization of primary cellulose tars.
In this laboratory, we have for some time been concerned with the behavior of cellulose during pyrolysis. This material is of some interest as a model for "biomass", an often- discussed alternate energy source. It was realized that this material presented both some interesting questions in its own right, as well as some interesting opportunities as another , simpler model for the kinds measurements we perform with coal tar. Cellulose releases copious amount of tar during pyrolysis. Mass transfer of tar plays key role in the cellulose pyrolysis. Under conditions in which the tar cannot rapidly escape the particle it cracks to char. This is similar to what happens during coal pyrolysis. As the vapor pressure of the tar may be a key factor in determining the escape rate, we decided therefore to extend these studies, using our equipment for vapor pressure measurements for primary cellulose tars.
The heat of vaporization of cellulose tars has not reported and the direct measurement of this latent heat by DSC proved to be impossible, because the cellulose tar was observed thermally degrade in such experiments. The enthalphy of sublimation of the tar has been estimated from the Clausius-Clapeyron equation, using suitable vapor pressure data obtained under very low temperature conditions, at which tars would not degrade.
A flash pyrolysis apparatus was used in to prepare the cellulose tars. This apparatus permits rapid electrical heating of the cellulose in the folds of a wire mesh. The fact that only a thin wire mesh that contains the particles becomes hot minimizes the cracking of tars in the reaction vessel. The tars may therefore be considered "primary" pyrolysis tars.
2.1.1. Vapor pressure of the cellulose tar related compounds
According to the literature [ 1, 2, 3, 4, 5, 6 ] the pyrolysis of the cellulose under vacuum and atmospheric pressure gives a tar containing various amounts of 1,6-anhydro- b-D-glycopyranose ( known as levoglucosan ), 1,6- anhydro-p-D-glycofuranose, a- and J3-D-glucose, disaccharides (cellobiose) and their further condensation products, consisting of various oligo- and polysaccharides (polymeric materials, that are similar to condensation products of levoglucosan ), and some dehydration products ( 3-deoxy-D-hexosulose and its isomer, levoglucosenone). It has shown also that pyrolytic reaction may produce a variety of products through concurrent and consecutive reactions. Vacuum or atmospheric pyrolysis of cellulose provides a tar fraction containing mainly 1,6-anhydro-P-D- condensation products ( 20 to 60 % of tars). The fraction of levoglucosan in this mixture varies, and depends upon conditions.
Because cellulose tar vapor pressures have not been previously determined, we set about to do so. In order to validate the work performed with the tars, we have first obtained results with model compounds. We have examined the vapor pressures of levoglucosan (of 99% purity, from Adrich Chemical company, Inc.) between 7land 112OC, D-p- glucose (of 99.5% purity from the Sigma Chemical Company) between 12land 130 O C , D-xylose ( of 99% purity, from Adrich Chemical company, Inc.) between 97 and 122 "C, cellobiose ( of 99% purity, from Adrich Chemical company, Inc.) between 201 and 215 OC, D-fructose ( of 99% purity, from Adrich Chemical company, Inc.) between 86 and 97 "C and sucrose ( of 99% purity, from Adrich Chemical company, Inc.) between 122 and 127 O C . The chemicals were used as supplied. As these materials are hygroscopic, 5% was evaporated as a precaution, before beginning actual data collection. The presumption was that any water present in the samples would be evaporated in this initial 5% mass loss.
The vapor pressures have been measured using the effusion technique described below. The data have been obtained in both the "forward" direction (the temperature was raised stepwise, during data collection) and in the "backward" direction (the temperature was decreased stepwise, after achieving the highest temperature of the experiment).
As these compounds are quite thermally labile, the differential scanning calorimeter was used to study the thermal behavior of the compounds in the temperature region of interest. The DSC would reveal where any thermally significant reaction events took place, so that the temperatures of measurement could be kept below such temperatures. The latent
d

heat of fusion of the samples could also be calculated from the DSC results. This latent heat is important, to the extent that any of the measured vapor pressure results would be extrapolated to higher temperatures, at which the materials of interest would be liquids, as opposed to solids.
The basic technique and the characterisitics of the effusion apparatus were described in more detail elsewhere ( 4th, 6th and 9th Quarterly Technical Progress Reports). To summarize the general technique, the vapor pressure is determined indirectly from the rate of the effusion of mass from a pinhole leek in a cell. The working equation for measurements by this method has the general form:
where PSat is the vapor pressure in mm Hg of the substance held at a temperature T, in Kelvins, w is the weight loss in grams during the effusion time interval t in seconds, A is the area of the orifice in cm2, M is the molecular weight of the effusing vapor in grams per mole, and Wo is a Clausing probability factor.
Analysis of the experimental data was performed using the Clausius-Clapeyron equation,
d ( l n P ) AHO =-- R
d ( 9 To use this equation, a simplifying assumption was made that A Ho , the enthalpy of
vaporization, was constant over the range of temperatures of interest. Thus integration of the Clausius-Clapeyron equation, for this assumption, yields:
B T + A = - - + A A He InP=-- R T
where A and B are constants. The cylindrical sample containers (cells) with 0.3 cm3 internal-volume were stamped
from stainless steel foil and closed hermetically by pressing the orifice plate to the cylinder, thus ensuring no leakage except through the orifice. A new cell was used for each substance studied. The effusion holes in the foil were made using fine drills and their diameter was detemined by use of an optical microscopy.
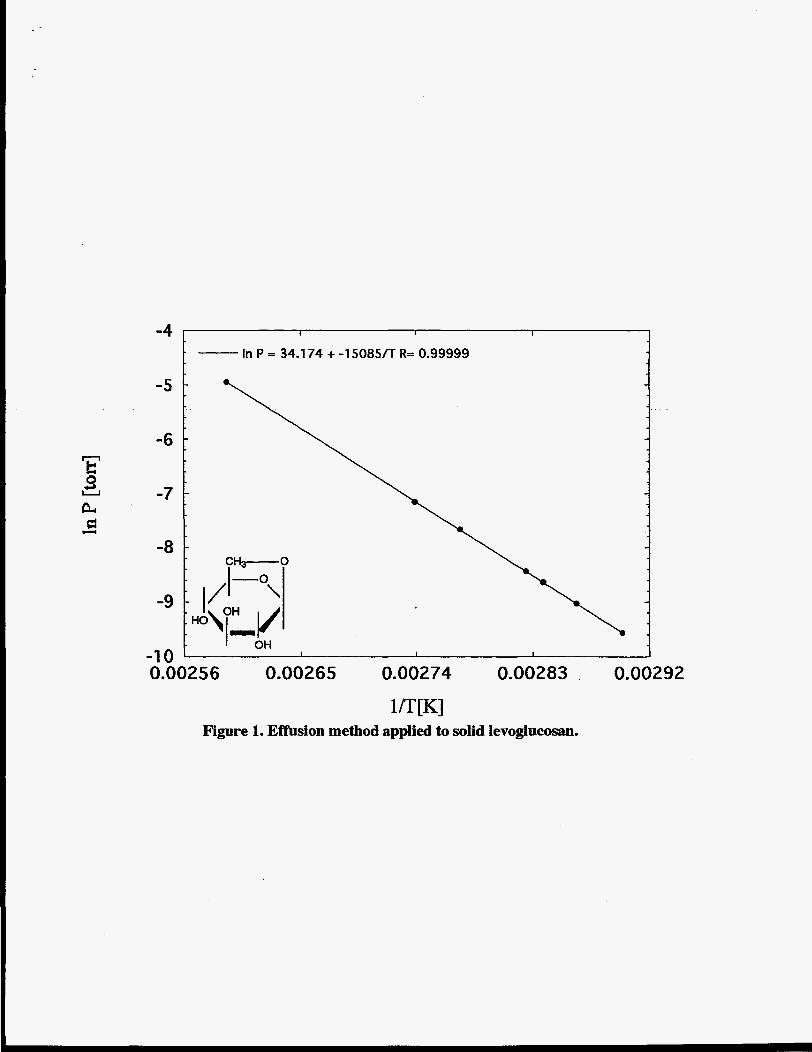
Levoglucosan or 1,6-anhydro-~-D-glycopyranose ( the major component of cellulose tar) was examined in the range of temperatures from 55 to 121OC. The most recent results

are shown in Figure 1. Figures 2,3 and 4 show the data obtained on D-xylose (or wood sugar), cellobiose and D-(P)-glucose. The vapor pressure data, plotted as In P versus l/T, are well represented by stright lines. The heats of sublimation obtained from these plots are 125, 158,301 and 201 kJ/mol respectively.
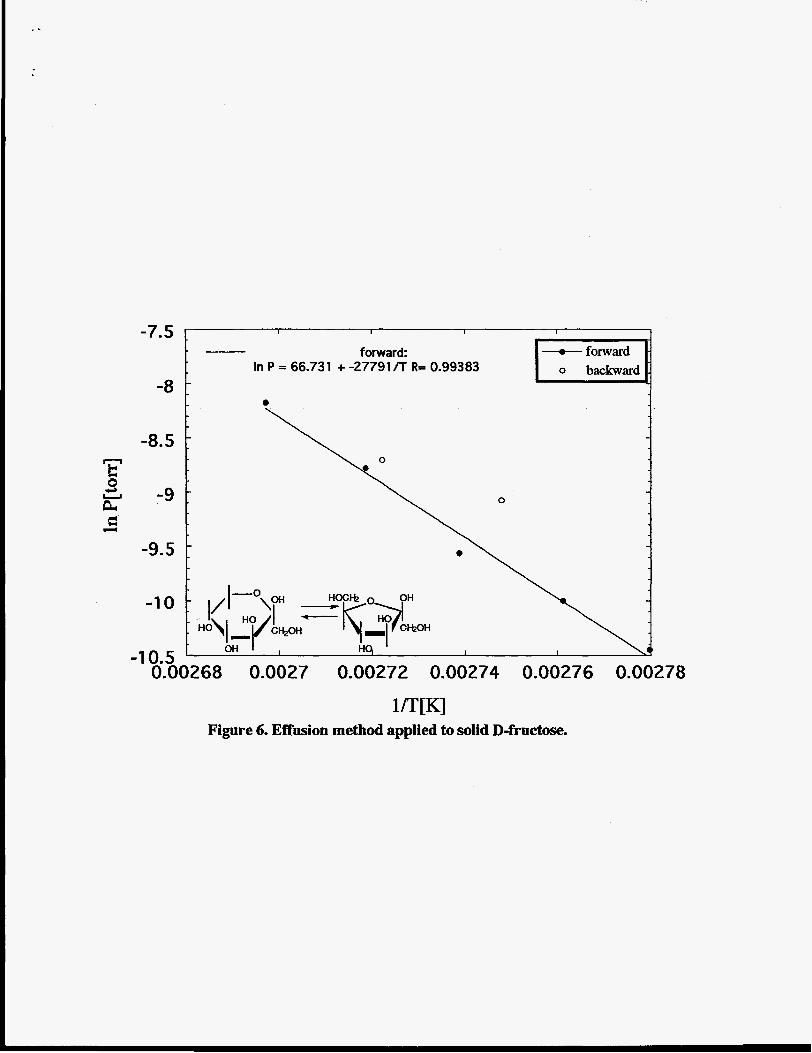
The data for sucrose and fructose are shown in Figures 5 and 6. These results are consodered to be of lower reliability than those presented in the earlier figures, because the experiments had to be carried out near the lower limit of operation of OUT apparatus. Nevertheless, they still show the general relationship between the vapor pressure and temperatrure. Figure 6, for fructose, is particularly interesting, in that the data from the forward experiments do not coincide with those for the backward experiments. As indicated on the figure, this compound is subject to an equilibration between two isomeric forms. It is possible that the isomerization is promoted by exposing the sample to higher temperatures, and thus the difference in vapor pressures is attibutable to the different isomeric forms.
Figure 7 shows a comparison between the four cellulose tar model compounds shown in Figures 1 through 4. The vapor pressure of levoglucosan appears to be greater and its latent heat of sublimation lower than the same quantities for the similar molecular weight compounds, D-xylose and D-glucose. This again serves as warning that the correlation of vapor pressures with molecular weight alone is quite risky. Crudely speaking, the comparison shows an uncertainty of at least an order of magnitude about a mean.
In closing, it should be noted that these materials are characterized by extremely low vapor pressures, considering their low molecular weights. This was anticipated, since sugars are practically non-volatile at near ambient temperatures. The low vapor pressures are attributable to the important role of hydrogen bonding interactions in these materials. The vapor pressures decrease monotonically with the number of hydroxyl groups that the sugars carry.
2.1.2. The vapor pressure of primary cellulose tar
The tars were prepared from two different cellulose samples. One was Whatman fibrous cellulose powder (CFll). This cellulose powder contains less than 0.009% ash. Some of the tars were prepared from Munktell's Filter paper, with an average ash content 0.007%. The cellulose samples were not dried prior to pyrolysis. The tars were felt to be similar from both sources, since earlier studies of pyrolysis had indicated that their
pyrolysis behaviors were similar. Thus the samples were pyrolyzed together, as described below.
The pyrolysis apparatus was the so-called wire mesh reactor. Pyrolysis involves holding cellulose sample in the folds of a fine stainless steel mesh which is electrically heated at the desired rate (See the Eighth Quarterly).
The cellulose samples consisted of two thin sheets of filter paper and with a layer of cellulose powder folded between them. This was necessary to prevent loss of the fine cellulose powder through the holes of the wire mesh. The total mass of cellulose samples used in this work was approximately 300 mg, in each pyrolysis experiment.
Tar production was carried out at a heating rate 200 "C/sec for 3 seconds, followed by a holding time 4 seconds at 6OOOC. Experiments were performed in an inert gas environment (5 psig of high purity nitrogen). These operating conditions were chosen based upon the literature on cellulose pyrolysis. It was shown that the tar yield increases with temperature to maximum at 700 "C and at these temperatures pyrolysis is completed in 5 to 10 seconds [ 6 1.
Materials that condensed on the cold walls of the pyrolysis reactor is termed condensed material. The condensed material was collected at room temperature, by supplying a flow of cooling water to the jacketed walls of the reactor. Some condensed material was also collected on a glass wool filter at the exit of the reactor. These materials were collected after reaction by washing the primary collection surfaces with the high purity methanol. This procedure left a small methanol insoluble residue in the reactor walls. The yield of char, which remains on the screen, was determined gravimetrically. The average yield of the char was 50%.
Condensed material includes tar, water, organic acids, and various low molecular weight hydrocarbons. The subsequent handling of this material was intended to prepare a tar sample, by evaporation of water and light hydrocarbons. Methanol was evaporated from the condensed material solution by drymg in a vacuum oven at room temperature for 12 hours, followed by additional vacuum drying at 45 OC for another 12 hours. It was previously shown in this laboratory that vacuum drying at temperature 45OC will result in loss of some light material. All components with a vapor pressure equal to or greater than that of naphthalene are lost, while there is better than 95% retention of materials of vapor pressure of anthracene. For comparison it may be noted that the vapor pressure of anthracene is of the order of 10-4 torr at the maximum temperature of drying, but levoglucosan, which is assumed to be the major component of the tar, has a vapor pressure of 10-6 torr at this temperature.
The cellulose tar was not fractionated prior to vapor pressure measurements. Earlier characterization work in this laboratory on a similar tar gave a fairly narrow molecular weight distribution centered near 200 daltons. The average molecular weight of the tar was determined using vapor -phase osmometry. The vapor phase osmometry was calibrated using P-D-glucose 0.04, 0.07 and 0.1 M solutions in methanol at 45 "C. The average molecular weight of the tar was determined to be 180 @mol using 123.8 and 25.3 gJ tar in methanol solutions. This value is in good agreement with literature values, and shows that the tar is close in molecular weight to single 6-carbon sugar residues.
The vapor pressure of the cellulose tar was measured using the effusion technique. The total amount of sample used was 14.13 mg. The experiments were carried out on two successive days. The results are shown in Figure 8. The experimental data are seen to largely follow the form expected from the Clausius-Clapeyron equation. As anticipated, the cellulose tar exhibited the same magnitude of vapor pressure as levoglucosan (the tar vapor pressure was about two times higher). Certain points clearly fell off of the main trend line of the data.
The vapor pressure of the tar was measured over the temperature interval 50 to 100 "C during the fmt day. As the effusion technique is a dynamic method, sample composition changes are expected to show their influence. Thus the two points at the lowest temperatures (50 and 51°C) were thought to be strongly influenced by the presence of a small amount of high volatility material that survived the drying (or was possibly re- adsorbed as the sample was handled during setup of the vapor pressure experiment). The sample was then heated up to 100°C and permitted to cool down. At this point, 800 pg, or about 6% of the sample had evaporated. The sample was then reheated and data were collected from 85°C to 65°C and up to 80°C. A total of 2.32 mg (or 16.4%) of the sample was evaporated during the first day of experiments.
The sample was left overnight in the inert gas environment, and data were again collected in the temperature range from 64 to 103°C. The difference between the first day's and the second day's runs is clearly visible, but not very significant. The small shift could be attributable to the loss of some material during the first series of experiments on the material. There is also the possibility of a composition change in the tars during the overnight period.
Following this second set of experiments, the tar was heated up to 140°C and the vapor pressure measured at 135°C. About 8.05 mg material was evaporated during the second run and heating to 140°C. Thus only about 3.78 mg, or 27%, was left at the time of the last measurement. It came as somewhat of a suprise that after heating up to 140°C, the vapor pressure seems to fall by about a factor of 100. It is not clear if this could be attributed to
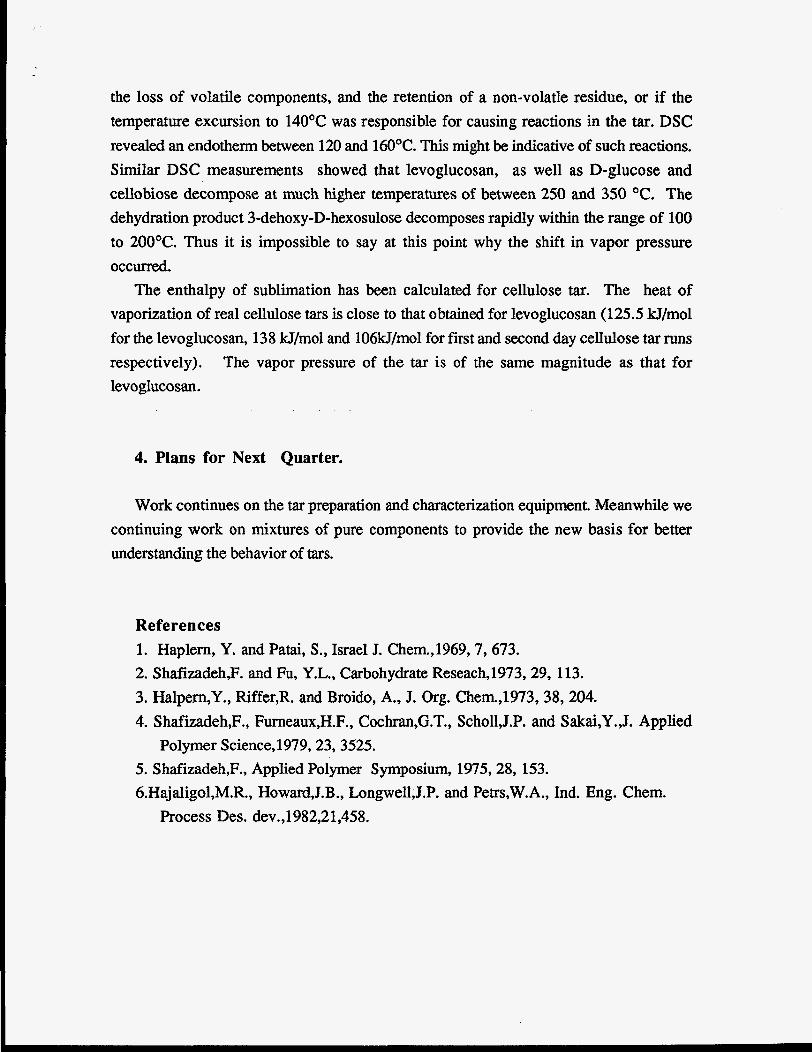
the loss of volatile components, and the retention of a non-volatle residue, or if the temperature excursion to 14OOC was responsible for causing reactions in the tar. DSC revealed an endotherm between 120 and 160OC. This might be indicative of such reactions. Similar DSC measurements showed that levoglucosan, as well as D-glucose and cellobiose decompose at much higher temperatures of between 250 and 350 OC. The dehydration product 3-dehoxy-D-hexosulose decomposes rapidly within the range of 100 to 200OC. Thus it is impossible to say at this point why the shift in vapor pressure occurred.
The enthalpy of sublimation has been calculated for cellulose tar. The heat of vaporization of real cellulose tars is close to that obtained for levoglucosan (125.5 kJ/mol for the levoglucosan, 138 kJ/mol and 106kJ/mol for first and second day cellulose tar runs respectively). The vapor pressure of the tar is of the same magnitude as that for levoglucosan.
4. Plans for Next Quarter.
Work continues on the tar preparation and characterization equipment. Meanwhile we continuing work on mixtures of pure components to provide the new basis for better understanding the behavior of tars.
References 1. Haplern, Y. and Patai, S., Israel J. Chem.,1969,7, 673. 2. Shafiiadeh,F. and Fu, Y.L., Carbohydrate Reseach,1973,29, 113. 3. Halpern,Y., Riffer,R. and Broido, A., J. Org. Chem.,1973,38, 204. 4. Shafizadeh,F., Furneaux,H.F., Cochran,G.T., Scholl,J.P. and Sakai,Y.,J. Applied
5. Shafiizadeh,F., Applied Polymer Symposium, 1975,28, 153. 6.Hajaligol,M.R., Howard,J.B., Longwel1,J.P. and Petrs,W.A., Ind. Eng. Chem
Polymer Science,1979,23, 3525.
Process Des. dev.,1982,21,458.
-4 I I I
In P = 34.1 74 + -1 5085/T R= 0.99999
-
-
-
-8 - -
-
-1 0 0.00256 0.00265 0.00274 0.00283 0.00292
I I I
1 f m I Figure 1. Effusion method applied to solid levoglucosan.

-6.5 I I I I I
-7
-7.5
-9
-9.5
-1 0 0.0025 0.00255 0.0026 0.00265 0.0027
1 f r [KI Figure 2. Effusion method applied to solid D-xylose.

-"." I-.!" P = 65:397 + -3626011 ' R= 0.99533 I
-
-
-
-
M O H
OH -1 1.5 I I I
0.00204 0.002057 0.002075 0.002092 0.0021 1
1IT [KI Figure 3. Effusion method applied to solid cellobiose.
Vapor pressure was examined in the temperature range from 205 to 215 OC.

-9
-9.5
-1 0
-1 0.5
-1 1 0.00246 0.00248 0.0025 0.00252 0.00254 0.00256 0.00258
CKI Figure 4. Effusion method appiied to solid D-glucose.

In P = 31.434 + -1 7056/T R= 0.99952 -10.4 - -
-10.6 - -
-10.8 - -
-
-
-
-1 1.6 I I I
0.00242 0.002444 0.002468 0.002492 0.0025 1 6 0.00254
Figure 5. Effusion method applied to solid sucrose. Vapor pressure was examined in the range of temperatures from 124 to 138 O C .
-7.5 ~ I I I I
forward -fornard - In P = 66.731 + -27791/T R= 0.99383 o backward -
-8 -
1 f m l Figure 6. Effusion method applied to solid D-fructose.


I .
n
-4 -. I I
e ceUulosetar(firstday) = cellulose tar (second day) o levoglucosan -5 r
-6 r
-7
-8 :
-9 ;
-10 I
0
m
0 .
0
0
e e
-1 1 I I I I I
0.0024 0.00256 0.00272 0.00288 0.00304 0.0032
[KI Figure 8. Effusion method applied to primary cellulose tar.
The open points show results for levoglucosan, for comparision.
DISCLAIMER
This report was prepared as an account of work sponsored by an agency of the United States Government. Neither the United States Government nor any agency thereof, nor any of their employees, makes any warranty, express or implied, or assumes any legal liability or responsi- bility for the accuracy, completeness, or usefulness of any information, apparatus, product, or process disclosed, or represents that its use would not infringe privately owned rights. Refer- ence herein to any specific commercial product, process, or service by trade name, trademark, manufacturer, or otherwise does not necessarily constitute or imply its endorsement, recom- mendation, or favoring by the United States Government or any agency thereof. The views and opinions of authors expressed herein do not necessarily state or reflect those of the United States Government or any agency thereof.