vaping, hookah use by us teens declines for first cigarettes are the most common vaping device, and...
TRANSCRIPT

Dec. 13, 2016 Contacts: Jared Wadley, 7349367819, [email protected] Janice Lee, 7346471083, [email protected] UM has a satellite uplink TV studio and an ISDN radio line for interviews.
Vaping, hookah use by US teens declines for first time ANN ARBOR—Teens are lighting up less often when it comes to ecigarettes and hookahs. A new study finds that the percentage of U.S. teens who vape declined in 2016—the first significant reversal of a rapid rise in adolescent vaping. The rate grew from nearzero levels of use in 2011 to one of the most common forms of adolescent substance use by 2015, researchers said. From 2015 to 2016, the percentage of adolescents who vaped in the last 30 days declined from 16 percent to 13 percent among 12thgrade students, from 14 percent to 11 percent among 10thgrade students, and from 8 percent to 6 percent among 8thgrade students. Each of these declines was statistically significant. These findings come from the University of Michigan's Monitoring the Future study, which tracks trends in substance use among students in 12th, 10th and 8th grades. Each year the national study, now in its 42nd year, surveys 40,000 to 50,000 students in about 400 public and private secondary schools throughout the United States. The survey includes questions on the use of vaping devices, which are batterypowered devices with a heating element that produce an aerosol, or vapor, inhaled by users. The vapors come in thousands of flavors, including options such as bubble gum and milk chocolate cream, which are likely attractive to younger teens. "Whether adolescent vaping has peaked or only paused is something we will be able to determine in the coming years," said Richard Miech, a senior investigator in the Monitoring the Future project. "In the past, we have seen new drugs follow a pattern in which use increases at a fast pace during a honeymoon period and then reverses course and declines as knowledge of the substance's drawbacks became known." Adolescents associated slightly greater potential harm with vaping in 2016 than they did the previous year, although overall they don't see them as particularly dangerous to use.

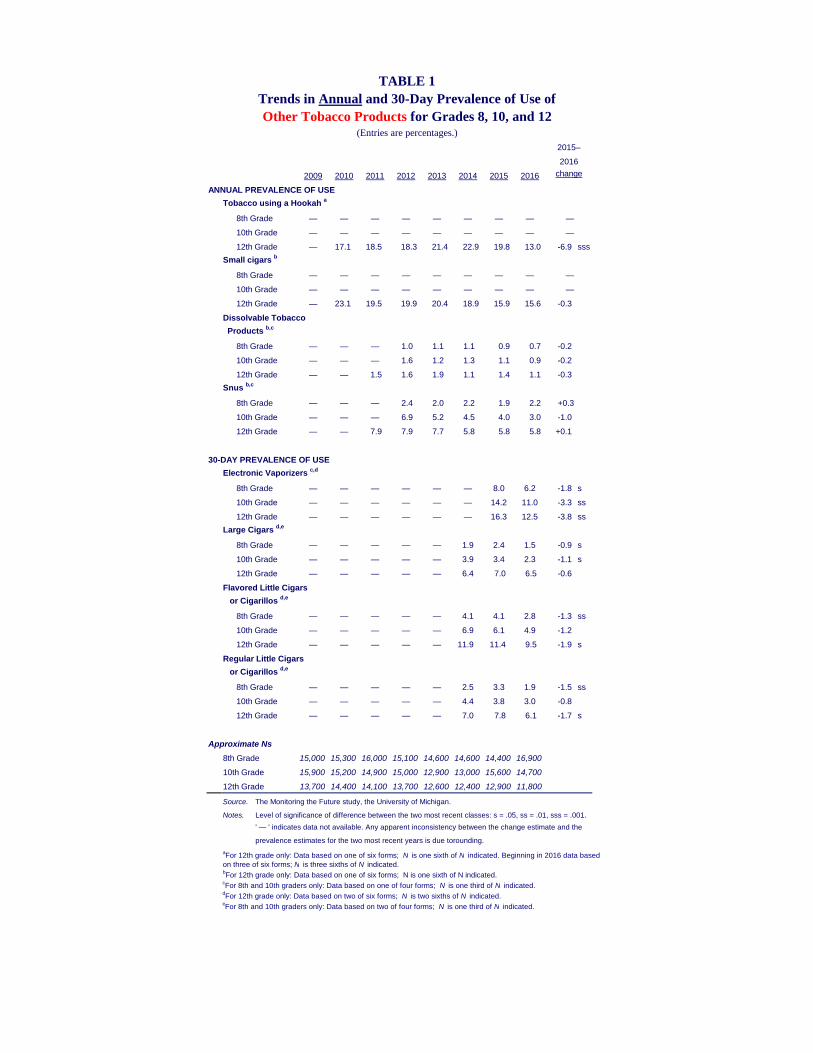
Ecigarettes are the most common vaping device, and from 2015 to 2016, the percentage of adolescents who believe that regular ecigarette use poses a risk of harm increased from 16 percent to 18 percent in 12th grade, from 17 percent to 19 percent in 10th grade, and from 19 percent to 21 percent in 8th grade. One potential harm of vaping is that it may lead to use of regular cigarettes. Miech, who has written on the subject, notes that an increasing number of studies show that vaping predicts future cigarette smoking, even among adolescents who had little predisposition to smoke when they started vaping. "Vaping may lead to friendship networks that encourage vapers to smoke," he said. "Also, vapers may come to believe the dangers of smoking are exaggerated if they do not experience any immediate health consequences from vaping." Hookah use Hookah use among U.S. 12thgrade students also declined in 2016, the first significant drop since the survey began tracking hookah use in 2010. From 2015 to 2016, use of a hookah in the past 12 months fell by more than onethird, from 20 percent to 13 percent among 12thgrade students (the survey tracks use only among 12thgrade students). A hookah user breathes in through a mouthpiece attached to a rubber hose in order to inhale tobacco smoke that passes through water. The tobacco smoke inhaled by a hookah user is just as dangerous as cigarette smoke. "Hookah use and vaping are two alternative cigarette products that rank among the most commonly used among U.S. youth," Miech said. "The decline in their use is important so that any reduction in cigarette smoking among U.S. teens is a real reduction in nicotine consumption, and not just a change from one form of nicotine use to another." Cigarettes Cigarette smoking among teens in grades 12, 10 and 8 continued a decades long decline in 2016 and reached the lowest levels recorded since annual tracking began 42 years ago. From 2015 to 2016, the percentage of youth who smoked in the past 30 days fell from 11.4 percent to 10.5 percent among 12thgrade students, from 6.3 percent to 4.9 percent among 10thgrade students, and from 3.6 percent to 2.6 percent among 8thgrade students. The oneyear declines in 10th and 8th grade were statistically significant. "Since the peak year in 1997, the proportion of students currently smoking has dropped by more than three quarters—an extremely important development for the health and longevity of this generation of Americans," said Lloyd Johnston, the principal investigator of the study.

Such a reduction can translate eventually into preventing hundreds of thousands of premature deaths as well as many serious diseases, he said. More than 400,000 Americans per year are estimated to die prematurely as a result of smoking cigarettes. Concerted efforts to reduce youth smoking appear to be paying off. These have included increased taxes on tobacco products, restrictions on advertising and promotion, limiting where smoking is permitted, broad based antismoking ad campaigns, educational programs in schools, removal of added flavoring to cigarettes (except menthol), and quit smoking programs and products becoming more available. Increases in the price of cigarettes charged by manufacturers have also played an important role. "While the improvements in the smoking numbers for just this one year are important, of course, the longer term declines are much more so," Johnston said. "Since teen smoking reached a peak around 1996 1997, the levels of past 30 day smoking have fallen by nearly 80 percent among 8th and 10th graders, and by more than 70 percent among 12th graders. Further, the proportional declines in daily smoking are even larger." One important cause of these declines in current smoking is that many fewer young people today have ever started to smoke. In 1996, 49 percent of 8th graders said they had tried cigarettes, but by 2016 only 10 percent said they had done so—a drop of almost 80 percent in smoking initiation over the past two decades. Illicit Drugs and Alcohol Declines in almost all illicit drugs took place in 2016, including marijuana use among 8th and 10thgrade students, synthetic marijuana and ecstasy. Alcohol use, including binge drinking, also declined. These findings, along with more results on these and other substances, are presented in a companion news release: myumi.ch/JYX4A The findings summarized here will be published in January in a forthcoming volume. The statistical breakdown by states are not available. Tables and figures Monitoring the Future
2009 2010 2011 2012 2013 2014 2015 2016
ANNUAL PREVALENCE OF USE
Tobacco using a Hookah a
8th Grade — — — — — — — — —
10th Grade — — — — — — — — —
12th Grade — 17.1 18.5 18.3 21.4 22.9 19.8 13.0 -6.9 sss
Small cigars b
8th Grade — — — — — — — — —
10th Grade — — — — — — — — —
12th Grade — 23.1 19.5 19.9 20.4 18.9 15.9 15.6 -0.3
Dissolvable Tobacco
Products b,c
8th Grade — — — 1.0 1.1 1.1 0.9 0.7 -0.2
10th Grade — — — 1.6 1.2 1.3 1.1 0.9 -0.2
12th Grade — — 1.5 1.6 1.9 1.1 1.4 1.1 -0.3
Snus b,c
8th Grade — — — 2.4 2.0 2.2 1.9 2.2 +0.3
10th Grade — — — 6.9 5.2 4.5 4.0 3.0 -1.0
12th Grade — — 7.9 7.9 7.7 5.8 5.8 5.8 +0.1
30-DAY PREVALENCE OF USE
Electronic Vaporizers c,d
8th Grade — — — — — — 8.0 6.2 -1.8 s
10th Grade — — — — — — 14.2 11.0 -3.3 ss
12th Grade — — — — — — 16.3 12.5 -3.8 ss
Large Cigars d,e
8th Grade — — — — — 1.9 2.4 1.5 -0.9 s
10th Grade — — — — — 3.9 3.4 2.3 -1.1 s
12th Grade — — — — — 6.4 7.0 6.5 -0.6
Flavored Little Cigars
or Cigarillos d,e
8th Grade — — — — — 4.1 4.1 2.8 -1.3 ss
10th Grade — — — — — 6.9 6.1 4.9 -1.2
12th Grade — — — — — 11.9 11.4 9.5 -1.9 s
Regular Little Cigars
or Cigarillos d,e
8th Grade — — — — — 2.5 3.3 1.9 -1.5 ss
10th Grade — — — — — 4.4 3.8 3.0 -0.8
12th Grade — — — — — 7.0 7.8 6.1 -1.7 s
Approximate Ns
8th Grade 15,000 15,300 16,000 15,100 14,600 14,600 14,400 16,900
10th Grade 15,900 15,200 14,900 15,000 12,900 13,000 15,600 14,700
12th Grade 13,700 14,400 14,100 13,700 12,600 12,400 12,900 11,800
Source. The Monitoring the Future study, the University of Michigan.
Notes. Level of significance of difference between the two most recent classes: s = .05, ss = .01, sss = .001.
' — ' indicates data not available. Any apparent inconsistency between the change estimate and the
prevalence estimates for the two most recent years is due torounding.
aFor 12th grade only: Data based on one of six forms; N is one sixth of N indicated. Beginning in 2016 data basedon three of six forms; N is three sixths of N indicated.bFor 12th grade only: Data based on one of six forms; N is one sixth of N indicated.cFor 8th and 10th graders only: Data based on one of four forms; N is one third of N indicated. dFor 12th grade only: Data based on two of six forms; N is two sixths of N indicated.eFor 8th and 10th graders only: Data based on two of four forms; N is one third of N indicated.
change
TABLE 1Trends in Annual and 30-Day Prevalence of Use of Other Tobacco Products for Grades 8, 10, and 12
(Entries are percentages.)
2015–
2016

1975 1976 1977 1978 1979 1980 1981 1982 1983 1984 1985 1986 1987 1988 1989 1990 1991 1992 1993 1994 1995(Years cont.)
Lifetime
8th Grade — — — — — — — — — — — — — — — — 44.0 45.2 45.3 46.1 46.4
10th Grade — — — — — — — — — — — — — — — — 55.1 53.5 56.3 56.9 57.6
12th Grade 73.6 75.4 75.7 75.3 74.0 71.0 71.0 70.1 70.6 69.7 68.8 67.6 67.2 66.4 65.7 64.4 63.1 61.8 61.9 62.0 64.2
30-Day
8th Grade — — — — — — — — — — — — — — — — 14.3 15.5 16.7 18.6 19.1
10th Grade — — — — — — — — — — — — — — — — 20.8 21.5 24.7 25.4 27.9
12th Grade 36.7 38.8 38.4 36.7 34.4 30.5 29.4 30.0 30.3 29.3 30.1 29.6 29.4 28.7 28.6 29.4 28.3 27.8 29.9 31.2 33.5
Daily
8th Grade — — — — — — — — — — — — — — — — 7.2 7.0 8.3 8.8 9.3
10th Grade — — — — — — — — — — — — — — — — 12.6 12.3 14.2 14.6 16.3
12th Grade 26.9 28.8 28.8 27.5 25.4 21.3 20.3 21.1 21.2 18.7 19.5 18.7 18.7 18.1 18.9 19.1 18.5 17.2 19.0 19.4 21.6
1/2 Pack+ per Day
8th Grade — — — — — — — — — — — — — — — — 3.1 2.9 3.5 3.6 3.4
10th Grade — — — — — — — — — — — — — — — — 6.5 6.0 7.0 7.6 8.3
12th Grade 17.9 19.2 19.4 18.8 16.5 14.3 13.5 14.2 13.8 12.3 12.5 11.4 11.4 10.6 11.2 11.3 10.7 10.0 10.9 11.2 12.4
Approximate Ns
8th Grade — — — — — — — — — — — — — — — — 17,500 18,600 18,300 17,300 17,500
10th Grade — — — — — — — — — — — — — — — — 14,800 14,800 15,300 15,800 17,000
12th Grade 9,400 15,400 17,100 17,800 15,500 15,900 17,500 17,700 16,300 15,900 16,000 15,200 16,300 16,300 16,700 15,200 15,000 15,800 16,300 15,400 15,400
TABLE 2Trends in Prevalence of Use of CIGARETTES in Grades 8, 10, and 12
(Entries are percentages.)
(Table continued on next page.)

2015–
1996 1997 1998 1999 2000 2001 2002 2003 2004 2005 2006 2007 2008 2009 2010 2011 2012 2013 2014 2015 2016
2016 change
Lifetime
8th Grade 49.2 47.3 45.7 44.1 40.5 36.6 31.4 28.4 27.9 25.9 24.6 22.1 20.5 20.1 20.0 18.4 15.5 14.8 13.5 13.3 9.8 -3.5 sss
10th Grade 61.2 60.2 57.7 57.6 55.1 52.8 47.4 43.0 40.7 38.9 36.1 34.6 31.7 32.7 33.0 30.4 27.7 25.7 22.6 19.9 17.5 -2.4 s
12th Grade 63.5 65.4 65.3 64.6 62.5 61.0 57.2 53.7 52.8 50.0 47.1 46.2 44.7 43.6 42.2 40.0 39.5 38.1 34.4 31.1 28.3 -2.8 s
30-Day
8th Grade 21.0 19.4 19.1 17.5 14.6 12.2 10.7 10.2 9.2 9.3 8.7 7.1 6.8 6.5 7.1 6.1 4.9 4.5 4.0 3.6 2.6 -1.0 ss
10th Grade 30.4 29.8 27.6 25.7 23.9 21.3 17.7 16.7 16.0 14.9 14.5 14.0 12.3 13.1 13.6 11.8 10.8 9.1 7.2 6.3 4.9 -1.5 ss
12th Grade 34.0 36.5 35.1 34.6 31.4 29.5 26.7 24.4 25.0 23.2 21.6 21.6 20.4 20.1 19.2 18.7 17.1 16.3 13.6 11.4 10.5 -0.9
Daily
8th Grade 10.4 9.0 8.8 8.1 7.4 5.5 5.1 4.5 4.4 4.0 4.0 3.0 3.1 2.7 2.9 2.4 1.9 1.8 1.4 1.3 0.9 -0.4 s
10th Grade 18.3 18.0 15.8 15.9 14.0 12.2 10.1 8.9 8.3 7.5 7.6 7.2 5.9 6.3 6.6 5.5 5.0 4.4 3.2 3.0 1.9 -1.1 sss
12th Grade 22.2 24.6 22.4 23.1 20.6 19.0 16.9 15.8 15.6 13.6 12.2 12.3 11.4 11.2 10.7 10.3 9.3 8.5 6.7 5.5 4.8 -0.7
1/2 Pack+ per Day
8th Grade 4.3 3.5 3.6 3.3 2.8 2.3 2.1 1.8 1.7 1.7 1.5 1.1 1.2 1.0 0.9 0.7 0.6 0.7 0.5 0.4 0.3 -0.1
10th Grade 9.4 8.6 7.9 7.6 6.2 5.5 4.4 4.1 3.3 3.1 3.3 2.7 2.0 2.4 2.4 1.9 1.5 1.5 1.2 1.0 0.6 -0.4 s
12th Grade 13.0 14.3 12.6 13.2 11.3 10.3 9.1 8.4 8.0 6.9 5.9 5.7 5.4 5.0 4.7 4.3 4.0 3.4 2.6 2.1 1.8 -0.3
Approximate Ns
8th Grade 17,800 18,600 18,100 16,700 16,700 16,200 15,100 16,500 17,000 16,800 16,500 16,100 15,700 15,000 15,300 16,000 15,100 14,600 14,600 14,400 16,900
10th Grade 15,600 15,500 15,000 13,600 14,300 14,000 14,300 15,800 16,400 16,200 16,200 16,100 15,100 15,900 15,200 14,900 15,000 12,900 13,000 15,600 14,700
12th Grade 14,300 15,400 15,200 13,600 12,800 12,800 12,900 14,600 14,600 14,700 14,200 14,500 14,000 13,700 14,400 14,100 13,700 12,600 12,400 12,900 11,800
Source. The Monitoring the Future study, the University of Michigan.
Notes. Level of significance of difference between the two most recent classes: s = .05, ss = .01, sss = .001. ' — ' indicates data not available.
Any apparent inconsistency between the change estimate and the prevalence estimates for the two most recent years is due to rounding.
TABLE 2 (cont.)Trends in Prevalence of Use of CIGARETTES in Grades 8, 10, and 12
(Entries are percentages.)

1975 1976 1977 1978 1979 1980 1981 1982 1983 1984 1985 1986 1987 1988 1989 1990 1991 1992 1993 1994 1995(Years cont.)
Perceived Risk a
8th Grade — — — — — — — — — — — — — — — — 51.6 50.8 52.7 50.8 49.8
10th Grade — — — — — — — — — — — — — — — — 60.3 59.3 60.7 59.0 57.0
12th Grade 51.3 56.4 58.4 59.0 63.0 63.7 63.3 60.5 61.2 63.8 66.5 66.0 68.6 68.0 67.2 68.2 69.4 69.2 69.5 67.6 65.6
Disapproval b
8th Grade — — — — — — — — — — — — — — — — 82.8 82.3 80.6 78.4 78.6
10th Grade — — — — — — — — — — — — — — — — 79.4 77.8 76.5 73.9 73.2
12th Grade 67.5 65.9 66.4 67.0 70.3 70.8 69.9 69.4 70.8 73.0 72.3 75.4 74.3 73.1 72.4 72.8 71.4 73.5 70.6 69.8 68.2
Availability c
8th Grade — — — — — — — — — — — — — — — — — 77.8 75.5 76.1 76.4
10th Grade — — — — — — — — — — — — — — — — — 89.1 89.4 90.3 90.7
Approximate Ns
8th Grade — — — — — — — — — — — — — — — — 17,500 18,600 18,300 17,300 17,500
10th Grade — — — — — — — — — — — — — — — — 14,800 14,800 15,300 15,800 17,000
12th Grade 2,800 2,900 3,100 3,800 3,300 3,200 3,600 3,600 3,300 3,300 3,300 3,000 3,300 3,300 2,800 2,600 2,600 2,700 2,800 2,600 2,600
TABLE 3Trends in Availability and Attitudes about Smoking 1 or More Packs
of Cigarettes per Day for Grades 8, 10, and 12(Entries are percentages.)
(Table continued on next page.)

1996 1997 1998 1999 2000 2001 2002 2003 2004 2005 2006 2007 2008 2009 2010 2011 2012 2013 2014 2015 2016
Perceived Risk a
8th Grade 50.4 52.6 54.3 54.8 58.8 57.1 57.5 57.7 62.4 61.5 59.4 61.1 59.8 59.1 60.9 62.5 62.6 62.4 62.1 63.0 61.2 -1.7
10th Grade 57.9 59.9 61.9 62.7 65.9 64.7 64.3 65.7 68.4 68.1 67.7 68.2 69.1 67.3 67.2 69.8 71.6 70.8 72.0 72.9 71.5 -1.4
12th Grade 68.2 68.7 70.8 70.8 73.1 73.3 74.2 72.1 74.0 76.5 77.6 77.3 74.0 74.9 75.0 77.7 78.2 78.2 78.0 75.9 76.5 +0.6
8th Grade 77.3 80.3 80.0 81.4 81.9 83.5 84.6 84.6 85.7 85.3 85.6 87.0 86.7 87.1 87.0 88.0 88.8 88.0 87.5 88.8 88.1 -0.7
10th Grade 71.6 73.8 75.3 76.1 76.7 78.2 80.6 81.4 82.7 84.3 83.2 84.7 85.2 84.5 83.9 85.8 86.0 86.1 88.0 88.3 88.5 +0.3
12th Grade 67.2 67.1 68.8 69.5 70.1 71.6 73.6 74.8 76.2 79.8 81.5 80.7 80.5 81.8 81.0 83.0 83.7 82.6 85.0 84.1 85.3 +1.3
8th Grade 76.9 76.0 73.6 71.5 68.7 67.7 64.3 63.1 60.3 59.1 58.0 55.6 57.4 55.3 55.5 51.9 50.7 49.9 47.2 47.0 45.6 -1.4
10th Grade 91.3 89.6 88.1 88.3 86.8 86.3 83.3 80.7 81.4 81.5 79.5 78.2 76.5 76.1 75.6 73.6 72.9 71.4 69.0 66.6 62.9 -3.6 ss
Approximate Ns
8th Grade 17,800 18,600 18,100 16,700 16,700 16,200 15,100 16,500 17,000 16,800 16,500 16,100 15,700 15,000 15,300 16,000 15,100 14,600 14,600 14,400 16,900
10th Grade 15,600 15,500 15,000 13,600 14,300 14,000 14,300 15,800 16,400 16,200 16,200 16,100 15,100 15,900 15,200 14,900 15,000 12,900 13,000 15,600 14,700
12th Grade 2,400 2,600 2,500 2,300 2,100 2,100 2,200 2,400 2,400 2,500 2,400 2,400 2,300 2,300 2,400 2,400 2,300 2,100 2,100 2,200 2,000
Source. The Monitoring the Future study, the University of Michigan.
Notes. Level of significance of difference between the two most recent classes: s = .05, ss = .01, sss = .001. ' — ' indicates data not available.
Any apparent inconsistency between the change estimate and the prevalence estimates for the two most recent years is due to rounding.
to get is shown. In 1992 only, availability data based on one of two forms; N is one half of N indicated. The question was not asked of 12th graders.
were: (1) No risk, (2) Slight risk, (3) Moderate risk, (4) Great risk, and (5) Can’t say, drug unfamiliar. The percentage saying great risk is shown. For 8th and 10th graders: Beginning in
1999, perceived risk data based on two of four forms; N is two thirds of N indicated. bThe question text was: Do you disapprove of people smoking one or more packs of cigarettes per day? Answer alternatives were: (1) Don’t disapprove, (2) Disapprove, and (3) Strongly
disapprove. For 8th and 10th graders, there was another category—Can’t say, drug unfamiliar—which was included in the calculation of these percentages. The percentage saying they
disapprove or strongly disapprove is shown. For 8th and 10th graders: Beginning in 1999, disapproval data based on two of four forms; N is two thirds of N indicated. cThe question text was: How difficult do you think it would be for you to get cigarettes, if you wanted some? Answer alternatives were: (1) Probably impossible, (2) Very difficult, (3) Fairly
difficult, (4) Fairly easy, (5) Very easy, and (8) Can’t say, drug unfamiliar (included in the calculation of these percentages). The percentage saying cigarettes are fairly easy or very easy
aThe question text was: How much do you think people risk harming themselves (physically or in other ways) if they smoke one or more packs of cigarettes per day? Answer alternatives
Disapproval b
Availability c
TABLE 3 (cont.)Trends in Availability and Attitudes about Smoking 1 or More Packs
of Cigarettes per Day for Grades 8, 10, and 12(Entries are percentages.)
2015–
2016
change

1991 1992 1993 1994 1995 1996 1997 1998 1999 2000 2001 2002 2003 2004 2005 2006 2007 2008 2009 2010 2011 2012 2013 2014 2015 2016
I would prefer to date people who don’t smoke8th Grade 77.8 76.0 75.2 74.1 73.6 70.9 72.3 74.5 76.9 77.2 79.4 80.6 79.6 81.0 81.2 81.2 82.8 82.6 81.3 81.5 81.7 83.7 80.9 80.2 81.7 80.6 -1.110th Grade 75.9 76.4 74.3 71.6 71.6 69.1 68.2 71.8 73.0 75.2 75.4 76.3 76.7 79.5 79.6 80.4 80.9 80.0 79.9 78.9 80.1 80.2 77.3 78.4 79.2 77.5 -1.612th Grade 74.0 72.3 70.4 69.0 66.0 66.0 63.9 66.0 64.4 70.0 68.5 72.3 71.8 72.0 74.8 76.7 76.6 75.2 74.9 73.3 74.7 77.5 75.4 73.7 73.1 74.2 +1.0
Smoking is a dirty habit8th Grade 71.4 70.8 70.3 68.4 68.4 67.9 67.7 68.2 70.0 70.8 72.3 74.1 71.6 74.3 73.7 74.8 75.8 75.0 73.6 72.4 72.9 75.1 72.0 70.7 70.9 71.2 +0.310th Grade 70.7 71.0 69.2 67.5 68.0 66.6 65.8 68.3 68.7 70.8 70.3 71.2 70.5 71.7 72.0 73.7 72.7 72.0 72.1 71.7 71.4 71.3 69.5 69.1 70.8 67.8 -3.1 ss12th Grade 71.6 73.1 71.8 68.0 68.2 67.5 70.0 70.5 69.7 73.5 71.6 74.5 73.3 72.6 74.9 77.1 76.7 73.5 73.4 73.1 72.4 73.0 70.7 70.9 67.1 69.5 +2.4
I think that becoming a smoker reflects poor judgment8th Grade 62.2 60.9 59.7 58.7 59.3 57.0 57.6 58.8 60.0 60.9 63.1 64.3 63.7 64.1 64.6 65.5 66.1 64.5 63.9 62.5 61.6 63.3 59.3 57.0 58.2 57.8 -0.410th Grade 57.5 59.0 57.3 54.2 53.7 52.9 50.1 53.9 54.7 56.5 55.4 59.3 56.8 58.8 59.4 61.5 60.3 60.6 59.6 59.1 57.4 57.2 54.8 52.3 54.1 51.3 -2.9 s12th Grade 61.0 60.7 59.4 58.1 55.1 54.9 56.2 54.7 55.5 58.9 57.2 59.8 56.6 56.0 60.3 61.9 61.7 58.1 57.7 54.4 55.5 54.1 52.3 47.5 45.5 47.1 +1.6
I strongly dislike being near people who are smoking8th Grade 53.8 52.1 52.9 51.1 49.7 45.7 46.6 48.5 48.7 50.1 52.2 54.0 54.4 57.0 55.7 55.4 56.8 57.9 55.9 55.2 56.9 59.0 58.6 57.4 58.3 58.2 -0.210th Grade 50.7 50.9 50.0 47.7 46.0 42.6 41.6 44.4 44.0 46.5 46.7 49.1 51.2 52.6 52.3 55.2 53.7 53.5 52.9 52.2 53.9 55.8 54.6 55.7 58.7 56.8 -1.912th Grade 48.9 49.4 48.6 47.4 44.2 42.3 38.3 41.0 39.3 41.3 43.3 47.4 47.6 46.5 47.8 49.7 50.2 47.9 48.7 49.1 49.5 52.4 50.7 53.2 51.1 53.4 +2.3
I personally don’t mind being around people who are smoking8th Grade 29.5 31.1 31.1 32.8 34.2 37.8 34.8 34.7 32.9 31.6 30.7 29.1 27.8 27.6 26.8 27.7 27.3 25.6 25.8 27.1 25.1 25.0 24.7 23.2 22.9 22.8 -0.110th Grade 33.1 35.0 35.1 36.8 38.5 42.8 41.1 39.7 38.8 38.1 35.5 34.7 32.2 30.0 30.4 30.8 30.4 29.2 30.4 30.3 28.6 28.9 28.9 26.9 24.3 23.8 -0.612th Grade 33.1 34.5 33.0 35.5 37.0 39.1 41.8 38.6 41.3 39.6 39.7 35.0 33.5 32.7 35.1 32.0 31.3 31.5 31.6 32.4 31.4 30.0 30.8 27.6 28.2 25.6 -2.6
The harmful effects of cigarettes have been exaggerated8th Grade 19.9 21.8 22.4 24.4 23.1 25.3 22.4 23.8 22.7 21.6 21.4 22.0 20.5 22.1 20.4 21.1 20.8 20.9 21.2 22.3 20.5 21.4 21.2 20.8 19.6 19.2 -0.410th Grade 16.4 17.9 18.8 18.9 19.3 20.0 19.5 20.1 19.3 18.8 17.3 18.0 19.5 17.8 17.5 17.4 18.3 18.5 18.6 17.8 18.1 18.3 19.2 18.1 16.5 15.9 -0.512th Grade 13.8 13.0 13.6 14.9 14.4 12.8 14.0 13.4 14.5 16.8 15.8 12.7 13.1 13.1 13.1 14.1 14.2 14.5 15.0 12.8 13.8 14.4 14.0 12.8 11.9 13.0 +1.1
Smokers know how to enjoy life more than nonsmokers8th Grade 4.9 5.0 5.4 6.3 5.9 6.7 5.4 5.8 6.1 5.4 5.5 5.2 5.3 5.9 5.4 5.7 5.1 5.2 5.6 6.7 5.6 5.8 6.0 6.5 5.6 6.1 +0.510th Grade 3.5 3.9 4.2 4.1 4.2 4.6 3.7 4.7 4.2 4.7 4.5 4.1 4.8 4.4 4.0 4.4 4.2 5.0 5.2 5.7 5.3 5.5 5.8 5.8 5.3 4.7 -0.612th Grade 3.6 3.3 3.5 3.8 4.0 3.5 3.2 3.8 4.3 3.7 5.5 4.1 3.5 3.5 3.4 3.8 3.2 4.2 3.9 8.1 7.7 3.9 5.7 5.1 5.8 5.5 -0.3
Source. The Monitoring the Future study, the University of Michigan.
Notes. For 8th graders: N s range from 6,249 to 8,005. For 10th graders: N s range from 6,135 to 7,807. For 12th graders: N s range from 1,795 to 3,112.
TABLE 4Trends in Various Attitudes toward Cigarette Use for Grades 8, 10, and 12
change
Percentage who report mostly agree or agree 2015–2016

1991 1992 1993 1994 1995 1996 1997 1998 1999 2000 2001 2002 2003 2004 2005
Approximate weighted N = 17,500 18,600 18,300 17,300 17,500 17,800 18,600 18,100 16,700 16,700 16,200 15,100 16,500 17,000 16,800
Total 14.3 15.5 16.7 18.6 19.1 21.0 19.4 19.1 17.5 14.6 12.2 10.7 10.2 9.2 9.3
Gender:
Male 15.5 14.9 17.2 19.3 18.8 20.6 19.1 18.0 16.7 14.3 12.2 11.0 9.6 8.3 8.7
Female 13.1 15.9 16.3 17.9 19.0 21.1 19.5 19.8 17.7 14.7 12.0 10.4 10.6 9.9 9.7
College Plans:
None or under 4 years 29.2 31.9 34.1 36.6 36.5 39.2 40.0 40.1 40.3 34.7 30.0 29.3 27.8 25.6 26.7
Complete 4 years 11.8 13.1 14.3 16.1 16.8 18.2 16.9 16.5 14.5 12.2 10.0 8.9 8.3 7.4 7.4
Region:
Northeast 13.7 14.4 15.0 17.8 18.6 22.1 18.0 15.6 15.7 13.7 11.4 9.1 7.7 7.2 7.8
Midwest 15.5 16.5 16.3 18.5 20.9 23.2 20.0 22.3 21.3 17.1 12.0 11.0 12.2 10.8 9.5 Table continued on next page.
South 15.7 17.0 18.2 19.5 19.4 21.1 21.0 21.1 18.7 14.7 14.3 13.0 11.7 10.3 11.6
West 10.0 12.2 16.4 18.0 16.5 17.1 17.1 15.1 12.1 12.2 9.3 7.5 7.0 7.4 6.3
Population Density:
Large MSA 12.8 15.0 14.1 15.5 16.5 19.4 15.8 16.4 12.7 12.1 9.3 7.5 7.7 7.7 6.7
Other MSA 14.9 15.3 17.8 20.7 19.4 21.4 19.7 17.7 16.0 13.1 11.6 10.6 9.8 8.9 9.8
Non-MSA 14.8 16.4 17.9 17.8 21.5 22.1 22.8 24.8 26.1 21.1 16.9 14.9 14.4 11.6 11.8
Parental Education: a
1.0–2.0 (Low) 26.2 24.1 23.3 26.1 25.3 26.5 26.9 26.7 26.6 22.0 20.3 20.3 17.5 15.8 16.6
2.5–3.0 16.4 16.9 19.8 20.6 22.7 24.4 22.4 23.9 23.5 19.6 16.4 14.5 14.8 12.2 13.4
3.5–4.0 13.9 14.9 17.4 20.1 20.8 21.4 20.9 21.4 17.0 14.7 12.6 10.5 9.6 9.6 10.5
4.5–5.0 10.1 13.3 12.5 14.9 14.9 18.4 16.2 14.2 12.3 10.2 8.3 7.8 6.7 6.7 5.9
5.5–6.0 (High) 11.3 11.5 13.3 15.1 14.5 17.3 15.3 13.8 12.2 9.8 6.9 5.8 6.0 5.2 4.3
Race/Ethnicity (2-year average): b
White — 16.2 17.8 18.9 20.7 22.7 22.8 21.5 20.1 17.7 14.7 12.0 10.9 10.0 9.4
African American — 5.3 6.6 8.7 8.9 9.6 10.9 10.6 10.7 9.6 8.2 7.7 6.9 6.9 7.1
Hispanic — 16.7 18.3 21.3 21.6 19.6 19.1 20.1 20.5 16.6 13.0 12.8 11.9 10.1 9.0
TABLE 5CIGARETTES: Trends in 30-Day Prevalence of Use by Subgroups in Grade 8
Percentage who used in last 30 days

2006 2007 2008 2009 2010 2011 2012 2013 2014 2015 2016
Approximate weighted N = 16,500 16,100 15,700 15,000 15,300 16,000 15,100 14,600 14,600 14,400 16,900
Total 8.7 7.1 6.8 6.5 7.1 6.1 4.9 4.5 4.0 3.6 2.6 -1.0 ss
Gender:
Male 8.1 7.5 6.7 6.7 7.4 6.2 4.6 4.0 3.5 3.3 2.5 -0.8
Female 8.9 6.4 6.7 6.0 6.8 5.7 4.9 4.7 4.2 3.7 2.6 -1.0 s
College Plans:
None or under 4 years 23.2 23.9 21.1 19.5 22.8 18.2 17.3 15.0 13.1 11.7 9.9 -1.7
Complete 4 years 7.1 5.4 5.5 5.3 5.7 5.1 3.9 3.8 3.1 2.8 2.0 -0.9 ss
Region:
Northeast 6.7 3.7 5.9 5.6 6.0 4.4 4.2 3.5 3.4 2.2 2.0 -0.1
Midwest 9.3 7.8 8.1 7.0 8.6 6.4 3.9 4.4 3.5 4.5 3.2 -1.3
South 10.9 8.6 7.7 7.7 8.5 6.8 6.9 5.8 4.6 4.0 3.0 -1.1 s
West 5.7 5.8 5.2 4.6 4.0 6.1 3.0 3.0 3.9 2.9 2.0 -0.9
Population Density:
Large MSA 6.4 4.7 5.2 4.2 4.8 4.0 3.6 2.5 2.8 2.2 1.4 -0.8
Other MSA 8.8 7.6 7.5 6.9 7.6 7.0 5.1 4.3 3.7 3.5 2.3 -1.2 s
Non-MSA 11.6 9.5 7.9 8.5 9.2 7.7 6.9 8.0 6.6 5.9 5.6 -0.3
Parental Education: a
1.0–2.0 (Low) 14.7 13.8 12.1 10.5 11.4 9.2 7.6 6.3 5.8 5.9 4.7 -1.3
2.5–3.0 12.5 10.2 8.7 8.8 10.2 9.8 7.4 6.5 6.2 4.6 3.6 -1.0
3.5–4.0 8.8 7.8 7.3 7.1 8.0 6.3 5.7 5.6 4.8 3.5 2.6 -0.9
4.5–5.0 5.5 3.9 4.7 4.4 4.9 3.9 3.0 2.4 2.6 2.5 2.0 -0.4
5.5–6.0 (High) 4.8 2.4 4.1 3.5 2.9 3.1 2.6 2.9 1.7 2.1 1.4 -0.7
Race/Ethnicity (2-year average): b
White 9.3 8.1 7.2 7.3 7.6 7.2 5.8 4.7 4.4 4.2 3.4 -0.8 s
African American 6.0 5.1 4.6 4.4 4.3 4.1 4.0 3.5 2.6 2.2 2.1 -0.1
Hispanic 8.8 8.0 7.0 6.5 6.7 6.9 5.5 4.0 3.5 3.0 2.5 -0.5
Source. The Monitoring the Future study, the University of Michigan.
Notes. Level of significance of difference between the two most recent classes: s = .05, ss = .01, sss = .001. ' — ' indicates data not available. Any apparent
inconsistency between the change estimate and the prevalence estimates for the two most recent years is due to rounding. See Table S1 for the
number of subgroup cases. See appendix B for definition of variables in table.aParental education is an average score of mother’s education and father’s education. See appendix B for details.bTo derive percentages for each racial subgroup, data for the specified year and the previous year have been combined to increase subgroup sample sizes
and thus provide more stable estimates. See appendix B for details on how race/ethnicity is defined.
2015-2016change
TABLE 5 (cont.)CIGARETTES: Trends in 30-Day Prevalence of Use by Subgroups in Grade 8
Percentage who used in last 30 days

1991 1992 1993 1994 1995 1996 1997 1998 1999 2000 2001 2002 2003 2004 2005
Approximate weighted N = 14,800 14,800 15,300 15,800 17,000 15,600 15,500 15,000 13,600 14,300 14,000 14,300 15,800 16,400 16,200
Total 20.8 21.5 24.7 25.4 27.9 30.4 29.8 27.6 25.7 23.9 21.3 17.7 16.7 16.0 14.9
Gender:
Male 20.8 20.6 24.6 26.6 27.7 30.1 28.2 26.2 25.2 23.8 20.9 16.7 16.2 16.2 14.5
Female 20.7 22.2 24.5 23.9 27.9 30.8 31.1 29.1 25.8 23.6 21.5 18.6 17.0 15.7 15.1
College Plans:
None or under 4 years 36.5 35.0 41.9 42.2 46.3 46.2 47.2 45.2 44.0 38.6 38.1 33.3 33.0 33.1 29.4
Complete 4 years 17.3 18.6 21.0 21.7 24.7 27.8 26.8 24.5 22.7 21.5 18.5 15.1 14.0 13.6 12.9
Region:
Northeast 22.4 21.9 27.1 24.5 27.8 31.7 29.3 30.1 28.0 23.9 18.1 15.9 16.6 16.6 14.9
Midwest 22.9 24.3 26.0 28.8 30.1 32.5 31.7 29.5 30.2 27.1 24.2 19.2 18.4 14.6 16.2 Table continued on next page.
South 21.2 19.8 24.0 25.7 30.8 33.4 32.2 29.8 26.3 25.5 23.5 19.6 18.2 20.4 16.4
West 16.7 20.2 21.2 20.1 19.6 20.8 23.2 19.6 17.5 16.8 15.0 14.1 12.5 10.9 10.9
Population Density:
Large MSA 19.7 21.6 22.5 22.3 23.3 26.2 26.6 22.5 22.9 23.1 17.3 14.2 13.1 12.0 11.7
Other MSA 20.3 20.3 23.8 26.3 28.9 31.1 28.9 26.6 25.0 21.3 20.5 17.6 16.6 16.6 14.7
Non-MSA 22.7 23.7 28.2 26.7 31.3 33.9 34.9 35.7 30.4 29.4 27.6 22.6 22.4 20.4 19.8
Parental Education: a
1.0–2.0 (Low) 23.5 28.4 29.5 26.4 30.9 28.7 28.2 28.0 30.5 29.3 22.5 21.4 23.4 19.3 16.4
2.5–3.0 24.1 23.3 28.0 29.1 33.2 33.8 33.2 33.0 29.6 26.8 25.7 22.4 21.2 19.9 19.7
3.5–4.0 20.4 20.6 24.8 26.0 27.8 31.6 30.9 27.3 26.0 25.3 21.1 17.4 16.2 17.8 15.7
4.5–5.0 18.5 19.5 20.1 22.6 25.9 28.7 28.5 25.7 22.4 21.2 18.9 15.1 13.4 12.6 12.5
5.5–6.0 (High) 18.5 18.9 21.4 20.7 21.8 27.8 24.6 22.5 21.4 19.1 17.1 12.7 11.6 10.8 10.8
Race/Ethnicity (2-year average): b
White — 24.1 26.0 27.8 29.7 32.9 34.4 33.2 30.8 28.2 25.7 22.4 20.0 18.7 17.6
African American — 6.6 7.5 9.8 11.5 12.2 12.8 13.7 12.5 11.1 11.1 9.8 8.9 9.2 8.7
Hispanic — 18.3 20.5 19.4 21.4 23.7 23.0 21.3 21.1 19.6 16.8 14.3 13.2 13.9 13.5
TABLE 6CIGARETTES: Trends in 30-Day Prevalence of Use by Subgroups in Grade 10
Percentage who used in last 30 days

2006 2007 2008 2009 2010 2011 2012 2013 2014 2015 2016
Approximate weighted N = 16,200 16,100 15,100 15,900 15,200 14,900 15,000 12,900 13,000 15,600 14,700
Total 14.5 14.0 12.3 13.1 13.6 11.8 10.8 9.1 7.2 6.3 4.9 -1.5 ss
Gender:
Male 13.4 14.6 12.7 13.7 15.0 13.4 12.0 10.5 7.7 6.1 5.0 -1.1
Female 15.5 13.3 11.9 12.5 12.1 10.0 9.6 7.5 6.6 6.3 4.4 -1.8 ss
College Plans:
None or under 4 years 32.7 30.1 30.1 29.0 32.5 28.5 27.6 23.3 19.4 17.6 14.5 -3.1
Complete 4 years 12.1 11.8 10.0 11.3 11.3 9.9 9.0 7.4 5.8 5.1 3.8 -1.3 ss
Region:
Northeast 11.8 13.1 10.1 11.1 12.1 12.2 10.9 7.2 6.7 6.1 4.4 -1.7
Midwest 18.1 17.1 14.5 12.9 14.5 11.8 9.7 9.3 8.0 7.0 4.7 -2.3 s
South 15.6 14.4 14.0 16.7 15.4 13.8 13.6 11.8 7.7 7.0 5.5 -1.6
West 10.9 11.1 9.6 10.1 11.1 8.5 7.6 6.9 5.8 4.7 4.5 -0.2
Population Density:
Large MSA 11.5 12.1 10.3 11.4 11.1 9.5 8.4 5.8 5.9 4.9 4.4 -0.5
Other MSA 13.3 13.9 12.3 13.0 13.5 11.5 10.2 9.5 6.0 5.7 4.3 -1.4
Non-MSA 22.4 17.2 15.4 16.1 17.5 15.7 15.4 13.0 12.3 10.4 7.2 -3.2 s
Parental Education: a
1.0–2.0 (Low) 20.4 17.5 15.7 18.2 18.8 14.6 15.4 12.8 9.7 9.3 5.5 -3.7 s
2.5–3.0 19.7 18.4 15.8 16.5 18.6 16.2 14.4 13.6 9.1 8.7 7.1 -1.6
3.5–4.0 15.5 14.7 13.9 13.8 15.1 12.7 11.2 10.2 8.4 7.8 5.3 -2.4 ss
4.5–5.0 10.8 11.3 9.6 10.9 10.0 8.6 9.6 6.0 5.2 5.0 3.5 -1.5 s
5.5–6.0 (High) 10.0 9.7 7.8 8.9 7.7 8.0 7.1 4.9 4.9 3.3 3.4 +0.1
Race/Ethnicity (2-year average): b
White 16.6 16.2 15.1 14.4 14.7 14.3 12.9 11.4 9.5 7.8 6.8 -1.0 ss
African American 8.0 7.1 6.5 6.8 6.7 7.1 6.7 5.3 4.2 3.8 2.6 -1.2 s
Hispanic 12.1 10.5 11.1 12.1 12.2 10.5 8.3 8.3 6.8 5.3 4.0 -1.2 ss
Source. The Monitoring the Future study, the University of Michigan.
Notes. Level of significance of difference between the two most recent classes: s = .05, ss = .01, sss = .001. ' — ' indicates data not available. Any apparent
inconsistency between the change estimate and the prevalence estimates for the two most recent years is due to rounding. See Table S2 for the
number of subgroup cases. See appendix B for definition of variables in table.aParental education is an average score of mother’s education and father’s education. See appendix B for details.bTo derive percentages for each racial subgroup, data for the specified year and the previous year have been combined to increase subgroup sample sizes
and thus provide more stable estimates. See appendix B for details on how race/ethnicity is defined.
2015-2016change
TABLE 6CIGARETTES: Trends in 30-Day Prevalence of Use by Subgroups in Grade 10
Percentage who used in last 30 days

1975 1976 1977 1978 1979 1980 1981 1982 1983 1984 1985 1986 1987 1988 1989 1990
Approximate weighted N = 9,400 15,400 17,100 17,800 15,500 15,900 17,500 17,700 16,300 15,900 16,000 15,200 16,300 16,300 16,700 15,200
Total 36.7 38.8 38.4 36.7 34.4 30.5 29.4 30.0 30.3 29.3 30.1 29.6 29.4 28.7 28.6 29.4
Gender:
Male 37.2 37.7 36.6 34.5 31.2 26.8 26.5 26.8 28.0 25.9 28.2 27.9 27.0 28.0 27.7 29.1
Female 35.9 39.1 39.6 38.1 37.1 33.4 31.6 32.6 31.6 31.9 31.4 30.6 31.4 28.9 29.0 29.2
College Plans:
None or under 4 years — 46.3 46.2 44.6 43.0 39.6 38.1 38.7 38.0 37.9 40.5 38.5 39.7 37.5 38.0 37.5
Complete 4 years — 29.8 29.4 27.4 26.0 22.3 22.3 22.1 23.3 22.7 22.8 24.0 24.3 24.4 24.1 25.4
Region:
Northeast 40.1 41.8 43.0 40.6 37.0 34.1 31.5 32.1 34.6 33.5 34.2 35.2 34.1 31.2 29.4 31.9
Midwest 39.5 41.3 40.5 39.0 36.6 31.5 32.4 33.5 33.2 31.4 34.1 32.5 31.7 31.1 34.9 34.0 Table continued on next page.
South 36.2 39.1 37.6 35.7 35.4 31.8 28.9 29.4 28.7 28.6 25.6 26.1 26.0 28.0 26.4 26.1
West 26.3 28.3 27.7 27.3 24.8 21.2 21.8 20.4 21.8 22.9 26.3 23.3 26.6 23.9 22.7 25.1
Population Density:
Large MSA 39.7 40.4 40.9 37.5 33.4 31.2 30.6 32.1 30.8 31.3 31.9 30.8 29.3 26.9 25.9 27.9
Other MSA 35.1 35.9 36.1 34.3 33.5 29.7 27.4 27.8 29.1 28.2 28.5 28.0 28.2 28.3 28.2 29.6
Non-MSA 36.7 40.9 39.2 39.4 36.4 30.9 30.9 31.2 31.5 29.3 30.8 31.0 31.8 31.4 32.2 30.4
Parental Education: a
1.0–2.0 (Low) 37.2 43.2 39.6 38.1 38.1 32.7 32.5 32.6 32.7 33.6 32.3 28.6 28.8 28.1 25.4 26.3
2.5–3.0 37.0 41.2 40.8 39.3 35.9 34.2 31.7 32.0 32.2 31.8 32.3 32.3 31.4 29.9 30.8 30.8
3.5–4.0 31.9 35.3 37.3 34.0 33.3 28.0 28.2 29.0 28.0 28.1 29.7 29.7 28.8 27.8 29.4 29.3
4.5–5.0 32.3 35.0 33.0 32.6 30.1 25.7 26.0 25.5 27.8 25.2 27.7 26.4 27.6 28.6 27.0 29.1
5.5–6.0 (High) 26.8 30.8 32.8 31.9 29.6 24.0 22.5 25.1 25.5 23.7 22.6 26.7 29.3 27.8 26.3 28.6
Race/Ethnicity (2-year average): b
White — — 38.3 37.6 36.0 33.0 30.5 30.7 31.3 31.2 31.3 31.9 32.1 32.2 32.2 32.3
African American — — 36.7 32.7 30.2 26.8 23.7 21.8 21.2 19.3 18.1 16.9 14.2 13.3 12.6 12.2
Hispanic — — 35.7 32.8 26.8 22.6 23.2 24.7 24.7 25.3 25.5 23.7 22.7 21.9 20.6 21.7
TABLE 7CIGARETTES: Trends in 30-Day Prevalence of Use by Subgroups in Grade 12
Percentage who used in last 30 days

1991 1992 1993 1994 1995 1996 1997 1998 1999 2000 2001 2002 2003 2004 2005
Approximate weighted N = 15,000 15,800 16,300 15,400 15,400 14,300 15,400 15,200 13,600 12,800 12,800 12,900 14,600 14,600 14,700
Total 28.3 27.8 29.9 31.2 33.5 34.0 36.5 35.1 34.6 31.4 29.5 26.7 24.4 25.0 23.2
Gender:
Male 29.0 29.2 30.7 32.9 34.5 34.9 37.3 36.3 35.4 32.8 29.7 27.4 26.2 25.3 24.8
Female 27.5 26.1 28.7 29.2 32.0 32.4 35.2 33.3 33.5 29.7 28.7 25.5 22.1 24.1 20.7
College Plans:
None or under 4 years 38.1 38.6 37.3 40.9 43.5 45.0 45.7 46.7 44.9 43.6 40.8 37.5 36.2 36.8 34.8
Complete 4 years 24.2 23.8 27.3 28.0 29.9 30.8 33.1 31.3 31.4 27.3 25.9 23.6 20.8 21.6 20.0
Region:
Northeast 30.5 29.6 34.2 33.2 34.4 38.5 40.6 35.9 34.2 33.1 30.3 27.3 25.0 25.9 22.0
Midwest 34.6 31.7 33.2 36.2 37.8 37.7 39.3 40.0 37.8 35.6 35.9 31.7 27.3 28.3 26.8 Table continued on next page.
South 25.4 26.4 29.0 30.7 33.5 33.2 35.0 34.3 36.2 29.6 25.9 27.2 24.3 24.6 24.6
West 23.2 22.8 22.9 24.0 26.5 24.4 30.5 29.1 27.6 28.1 25.2 19.4 20.7 20.1 17.5
Population Density:
Large MSA 26.2 25.6 29.5 29.0 33.9 32.1 34.9 32.9 30.0 27.4 27.3 24.8 18.9 20.8 20.8
Other MSA 29.3 26.9 29.8 31.1 31.7 32.6 35.7 34.2 35.0 31.5 28.2 26.2 25.1 26.3 22.6
Non-MSA 28.6 31.5 30.3 33.8 36.2 38.2 40.0 39.7 38.7 36.3 34.3 30.1 30.4 27.6 27.4
Parental Education: a
1.0–2.0 (Low) 31.3 27.1 26.5 26.2 31.2 31.5 31.2 32.3 33.0 31.3 24.8 20.9 23.5 21.0 19.1
2.5–3.0 28.7 30.3 30.4 32.8 35.0 35.5 36.5 36.0 37.3 32.2 31.5 28.9 27.0 28.7 27.3
3.5–4.0 28.4 27.8 29.9 31.4 33.2 33.2 35.6 36.7 35.0 32.8 30.3 28.6 24.3 26.3 24.8
4.5–5.0 26.9 25.8 30.1 32.0 32.6 34.5 37.5 34.2 32.4 30.2 29.3 25.0 22.6 23.8 21.8
5.5–6.0 (High) 27.1 25.5 30.5 30.4 34.0 32.9 38.5 33.1 34.4 27.4 25.0 25.3 21.0 19.9 18.0
Race/Ethnicity (2-year average): b
White 32.2 31.8 33.2 35.2 36.6 38.1 40.7 41.7 40.1 37.9 35.3 32.5 29.4 28.2 27.6
African American 10.6 8.7 9.5 10.9 12.9 14.2 14.3 14.9 14.9 14.3 13.3 12.1 10.0 10.1 10.7
Hispanic 24.0 25.0 24.2 23.6 25.1 25.4 25.9 26.6 27.3 27.7 23.8 21.3 19.0 18.5 17.1
Percentage who used in last 30 days
TABLE 7 (cont.)CIGARETTES: Trends in 30-Day Prevalence of Use by Subgroups in Grade 12

2006 2007 2008 2009 2010 2011 2012 2013 2014 2015 2016
Approximate weighted N = 14,200 14,500 14,000 13,700 14,400 14,100 13,700 12,600 12,400 12,900 11,800
Total 21.6 21.6 20.4 20.1 19.2 18.7 17.1 16.3 13.6 11.4 10.5 -0.9
Gender:
Male 22.4 23.1 21.5 22.1 21.9 21.5 19.3 18.4 15.2 13.0 12.7 -0.3
Female 20.1 19.6 19.1 17.6 15.7 15.1 14.5 13.2 11.6 9.1 8.1 -1.1
College Plans:
None or under 4 years 32.9 32.4 32.4 31.2 31.2 32.2 27.9 28.9 25.3 21.9 19.2 -2.6
Complete 4 years 18.6 19.0 17.6 17.3 16.3 15.6 14.7 13.0 10.8 8.9 8.4 -0.5
Region:
Northeast 23.1 23.8 19.7 18.9 18.2 17.8 18.8 17.0 11.7 10.8 10.9 +0.1
Midwest 23.6 24.7 22.1 25.7 21.5 21.8 21.0 16.5 13.8 12.7 12.0 -0.7
South 23.2 21.9 22.4 20.0 20.5 18.4 15.6 18.6 15.4 12.5 10.8 -1.7
West 15.0 15.8 15.8 14.7 15.3 16.4 13.9 12.1 11.9 8.6 8.3 -0.3
Population Density:
Large MSA 20.7 19.9 18.8 17.7 18.7 17.2 15.8 14.5 11.7 9.3 8.4 -0.9
Other MSA 20.3 20.8 19.5 19.1 17.9 18.1 15.6 15.5 12.9 10.5 9.9 -0.6
Non-MSA 25.3 25.9 24.3 25.5 23.1 22.3 23.1 20.9 17.8 17.0 15.1 -1.9
Parental Education: a
1.0–2.0 (Low) 21.1 20.5 18.5 19.9 17.0 18.2 17.0 18.2 14.8 12.9 9.9 -3.0
2.5–3.0 24.7 24.7 22.4 23.2 21.6 22.4 19.0 18.2 16.1 13.9 12.0 -1.9
3.5–4.0 22.9 21.6 21.3 21.0 20.9 19.6 20.1 18.5 14.2 12.2 11.9 -0.3
4.5–5.0 19.2 20.5 18.6 18.0 17.5 15.9 15.7 14.1 12.0 9.7 9.1 -0.7
5.5–6.0 (High) 17.4 18.4 19.2 15.3 12.8 14.3 11.2 9.5 9.4 7.5 7.6 +0.1
Race/Ethnicity (2-year average): b
White 25.9 24.9 24.7 23.9 22.9 22.2 21.2 19.4 17.5 15.0 13.2 -1.7 ss
African American 10.5 10.8 10.3 9.8 10.1 9.7 8.6 9.6 9.0 6.9 6.0 -0.9
Hispanic 16.0 15.3 15.0 15.7 15.0 14.3 13.2 12.4 11.4 9.6 8.2 -1.5 s
Source. The Monitoring the Future study, the University of Michigan.
Notes. Level of significance of difference between the two most recent classes: s = .05, ss = .01, sss = .001. ' — ' indicates data not available. Any apparent
inconsistency between the change estimate and the prevalence estimates for the two most recent years is due to rounding. See Table S3 for the
number of subgroup cases. See appendix B for definition of variables in table.aParental education is an average score of mother’s education and father’s education. See appendix B for details.bTo derive percentages for each racial subgroup, data for the specified year and the previous year have been combined to increase subgroup sample sizes
and thus provide more stable estimates. See appendix B for details on how race/ethnicity is defined.
2015-2016 change
TABLE 7 (cont.)CIGARETTES: Trends in 30-Day Prevalence of Use by Subgroups in Grade 12
Percentage who used in last 30 days

FIGURE 1
Cigarettes: Trends in 30-Day Use, Risk, Disapproval, and Availability
Grades 8, 10, and 12
Source. The Monitoring the Future study, the University of Michigan.
Use% who used in last 30 days
Risk% seeing "great risk" in smoking a pack
or more per day
Disapproval% disapproving of smoking a pack
or more per dayAvailability
% saying "fairly easy" or "very easy" to get
PE
RC
EN
T
0
20
40
60
80
100
YEAR
'74 '76 '78 '80 '82 '84 '86 '88 '90 '92 '94 '96 '98 '00 '02 '04 '06 '08 '10 '12 '14 '16
8th Grade10th Grade12th Grade
PE
RC
EN
T
0
20
40
60
80
100
YEAR
'74 '76 '78 '80 '82 '84 '86 '88 '90 '92 '94 '96 '98 '00 '02 '04 '06 '08 '10 '12 '14 '16
PE
RC
EN
T
0
20
40
60
80
100
YEAR
'74 '76 '78 '80 '82 '84 '86 '88 '90 '92 '94 '96 '98 '00 '02 '04 '06 '08 '10 '12 '14 '16
PE
RC
EN
T
0
20
40
60
80
100
YEAR
'74 '76 '78 '80 '82 '84 '86 '88 '90 '92 '94 '96 '98 '00 '02 '04 '06 '08 '10 '12 '14 '16