vanguard ohio long-term tax-exempt fund · a single theme unites ... even though supply in ohio...
TRANSCRIPT

Vanguard Ohio Long-Term Tax-Exempt Fund
Annual Report | November 30, 2017

Contents
Please note: The opinions expressed in this report are just that—informed opinions. They should not be considered promisesor advice. Also, please keep in mind that the information and opinions cover the period through the date on the front of thisreport. Of course, the risks of investing in your fund are spelled out in the prospectus.
See the Glossary for definitions of investment terms used in this report.About the cover: Nautical images have been part of Vanguard’s rich heritage since its start in 1975. For anincoming ship, a lighthouse offers a beacon and safe path to shore. You can similarly depend on Vanguard to putyou first––and light the way––as you strive to meet your financial goals. Our client focus and low costs,stemming from our unique ownership structure, assure that your interests are paramount.
Vanguard’s Principles for Investing Success
We want to give you the best chance of investment success. Theseprinciples, grounded in Vanguard’s research and experience, can put you onthe right path.
Goals. Create clear, appropriate investment goals.
Balance. Develop a suitable asset allocation using broadly diversified funds.
Cost. Minimize cost.
Discipline. Maintain perspective and long-term discipline.
A single theme unites these principles: Focus on the things you can control.We believe there is no wiser course for any investor.
Your Fund’s Performance at a Glance. . . . . . . . . . . . . . . . . . 1
Chairman’s Perspective. . . . . . . . . . . . . . . . . . . . . . . . . . . . . 3
Advisor’s Report. . . . . . . . . . . . . . . . . . . . . . . . . . . . . . . . . . . 7
Results of Proxy Voting. . . . . . . . . . . . . . . . . . . . . . . . . . . . 11
Fund Profile. . . . . . . . . . . . . . . . . . . . . . . . . . . . . . . . . . . . . .13
Performance Summary. . . . . . . . . . . . . . . . . . . . . . . . . . . . .14
Financial Statements. . . . . . . . . . . . . . . . . . . . . . . . . . . . . . 16
About Your Fund’s Expenses. . . . . . . . . . . . . . . . . . . . . . . . 41
Glossary. . . . . . . . . . . . . . . . . . . . . . . . . . . . . . . . . . . . . . . . 43

Your Fund’s Performance at a Glance
1
Total Returns: Fiscal Year Ended November 30, 2017
30-Day SECYield
Taxable-Equivalent
YieldIncomeReturns
CapitalReturns
TotalReturns
Vanguard Ohio Long-Term Tax-Exempt Fund 2.39% 4.44% 3.36% 3.16% 6.52%
Bloomberg Barclays OH Municipal Bond Index 5.39
Ohio Municipal Debt Funds Average 3.55
Ohio Municipal Debt Funds Average: Derived from data provided by Lipper, a Thomson Reuters Company.
The calculation of taxable-equivalent yield assumes a typical itemized tax return and is based on the 2017 maximum federal tax rate of43.4% and the maximum income tax rate for the state. Local taxes were not considered. Please see the prospectus for a detailedexplanation of the calculation.
• For the 12 months ended November 30, 2017, Vanguard Ohio Long-Term Tax-
Exempt Fund returned more than 6%. That performance put it well ahead of its
benchmark and almost 3 percentage points ahead of the average return of its
peer funds.
• Demand for municipal bonds rebounded from a slump in the wake of the U.S.
presidential election. Even though supply in Ohio picked up during the calendar year,
prices rose as cash flowed into this asset class.
• The fund’s structural tilt toward longer-dated and lower-quality securities compared
with its benchmark helped relative performance.
• Please note that the fund will adjust its security selection parameters in March.
This change is addressed in the Advisor’s Report, which begins on page 7.

2
Total Returns: Ten Years Ended November 30, 2017
Average
Annual Return
Ohio Long-Term Tax-Exempt Fund 4.62%
Bloomberg Barclays OH Municipal Bond Index 4.13
Ohio Municipal Debt Funds Average 3.39
Ohio Municipal Debt Funds Average: Derived from data provided by Lipper, a Thomson Reuters Company.
The figures shown represent past performance, which is not a guarantee of future results. (Current performance may be lower or higher than the performance data cited. For performance data current to the most recent month-end, visit our website at vanguard.com/performance.) Note, too, that both investment returns and principal value can fluctuate widely, so an investor’s shares, when sold, could be worth more or less than their original cost.
Expense RatiosYour Fund Compared With Its Peer Group
Fund
Peer Group
Average
Ohio Long-Term Tax-Exempt Fund 0.15% 1.01%
The fund expense ratio shown is from the prospectus dated March 28, 2017, and represents estimated costs for the current fiscal year. Forthe fiscal year ended November 30, 2017, the fund’s expense ratio was 0.15%. The peer-group expense ratio is derived from dataprovided by Lipper, a Thomson Reuters Company, and captures information through year-end 2016.
Peer group: Ohio Municipal Debt Funds.

Dear Shareholder,
In my more than 30 years at Vanguard,
I’ve seen both the best and worst that
the markets have to offer.
A bullish start The first part of my tenure, from 1986
through 1999, coincided with one of the
greatest bull markets in stocks and bonds.
To be sure, there were disruptions along
the way, including the 1987 stock market
crash and the 1997 Asian financial crisis.
But the overall experience was that of a
seemingly tireless bull, with investors
earning robust returns.
U.S. stocks climbed an average of about
19% a year during that period, and U.S.
bonds rose almost 9%.1
Of course, I paid close attention to such
sound investing practices as choosing
the right asset allocation, rebalancing in
a disciplined fashion, thinking long-term,
and—especially important—keeping costs
low. But even investors who didn’t focus
on these were doing well. It seemed
hard to go wrong when everything was
going right.
A tough second halfDuring the second part of my tenure,
the markets have been more challenging.
We’ve seen two severe corrections: the
2001–2002 dot-com bust and the brutal
2008–2009 Global Financial Crisis.
Chairman’s Perspective
Bill McNabbChairman and Chief Executive Officer
1 For calendar years 1986 through 1999, as measured by the Standard & Poor’s 500 Index and the Bloomberg Barclays U.S. Aggregate Bond Index.
3

Markets have clearly performed well
over the years since the crisis, but they’ve
done so against a backdrop of heightened
uncertainty fueled by postcrisis regulatory
changes and unprecedented monetary
policy stimulus—not to mention stubbornly
low economic growth, wage increases,
and inflation.
Those factors are reflected in the far
more modest market returns from 2000
through 2016: U.S. stocks gained an
average of about 6% a year and U.S.
bonds about 5%.2
In this more volatile, lower-return
environment, those sound investing
practices that may not have mattered
to some investors in the earlier period
actually mattered an awful lot.
What might the future hold?No one can say for certain what lies ahead
for the markets. However—and I realize
this isn’t necessarily what investors want
to hear—there are signs pointing to an
increasingly challenging environment for
both stocks and bonds.
Market Barometer Average Annual Total Returns
Periods Ended November 30, 2017
One Year Three Years Five Years
Stocks
Russell 1000 Index (Large-caps) 22.61% 10.73% 15.69%
Russell 2000 Index (Small-caps) 18.34 11.14 15.02
Russell 3000 Index (Broad U.S. market) 22.27 10.75 15.63
FTSE All-World ex US Index (International) 27.59 6.18 7.46
Bonds
Bloomberg Barclays U.S. Aggregate Bond Index
(Broad taxable market) 3.21% 2.11% 1.98%
Bloomberg Barclays Municipal Bond Index
(Broad tax-exempt market) 5.58 2.79 2.55
Citigroup Three-Month U.S. Treasury Bill Index 0.77 0.34 0.21
CPI
Consumer Price Index 2.20% 1.46% 1.39%
2 For calendar years 2000 through 2016, as measured by the S&P 500 Index and the Bloomberg Barclays U.S. Aggregate Bond Index.
4

Our economists recently issued Vanguard’s
economic and market outlook for 2018.
The report is packed with valuable insights
about the global economy, inflation, interest
rates, monetary policy, stock valuations,
and bond yields. (You can read it at
vanguard.com/research.)
A key takeaway is that investors should
anticipate more “muted”—that’s
economist-speak for “lower”—portfolio
returns over the next ten years.
Given that outlook, the sound investing
practices we’ve long promoted—
diversification, rebalancing, discipline,
and minimizing of costs—will be even
more important for investment success.
That’s true whether you’re an individual
investor, an institutional investor, or an
advisor working with clients.
Expectations for market returnsTo develop Vanguard’s outlook, our
economists use a proprietary statistical
model that looks at a variety of inputs—
valuations in particular—to run simulations
over extended periods.* The output from
the model includes ranges of potential
returns from various asset classes and
the probabilities of those outcomes.
For global stocks, the model projects
that average annual returns over the next
ten years could fall anywhere between
roughly 0% and more than 10%, with the
most likely outcome being 4.5%–6.5%.
That range is far from a certainty, but for
planning purposes, it’s a solid starting
point. And it’s significantly lower than
stocks’ long-term historical return of
about 10% per year. Largely because of
elevated valuations, the projected return
range for U.S. stocks over the next ten
years is even lower, at 3%–5%.
As for bonds, we expect action by the
Federal Reserve and other major central
banks to push yields a little higher,
especially for shorter-term bonds. That
upward movement would weigh on
bond prices. Investors, though, would
end up earning a little more income,
which over time should more than
offset any price declines.
The most likely range of average annual
returns for global bonds over the next ten
years is 2%–3%, according to our model.
That’s also significantly lower than the
long-term annual historical return of more
than 5%.
* IMPORTANT: The projections and other information generated by the Vanguard Capital Markets Model regarding the
likelihood of various investment outcomes are hypothetical in nature, do not reflect actual investment results, and are
not guarantees of future results. VCMM results will vary with each use and over time. For more information, see the
next page.
5

Being a silent partner isn’t enoughOne of our senior investment strategists,
Fran Kinniry, likes to say that investing is a
partnership between you and the markets.
Over the last 30 years, the markets have
done much of the work for us. But if our
outlook for muted returns is borne out,
investors will likely have to do more of the
heavy lifting. To stretch the analogy, you’ll
need to become the majority partner.
I know that’s easier said than done. But
boosting savings—putting an extra percent
or two away each year for retirement, or,
if you’ve already retired, drawing down
savings a little more slowly—is within
your control. These sacrifices can help
offset slimmer returns and pay off for
you in greater long-term financial security.
As always, thank you for investing
with Vanguard.
Sincerely,
F. William McNabb III
Chairman and Chief Executive Officer
December 14, 2017
IMPORTANT: The projections and other information generated by the Vanguard Capital Markets Model regarding the
likelihood of various investment outcomes are hypothetical in nature, do not reflect actual investment results, and are
not guarantees of future results. VCMM results will vary with each use and over time.
The VCMM projections are based on a statistical analysis of historical data. Future returns may behave differently from the historical patterns captured in the VCMM. More important, the VCMM may be underestimating extreme negative scenarios unobserved in the historical period on which the model estimation is based.
The VCMM is a proprietary financial simulation tool developed and maintained by Vanguard’s Investment Strategy Group. The model forecasts distributions of future returns for a wide array of broad asset classes. Those asset classes include U.S. and international equity markets, several maturities of the U.S. Treasury and corporate fixed income markets, international fixed income markets, U.S. money markets, commodities, and certain alternative investment strategies. The theoretical and empirical foundation for the Vanguard Capital Markets Model is that the returns of various asset classes reflect the compensation investors require for bearing different types of systematic risk (beta). At the core of the model are estimates of the dynamic statistical relationship between risk factors and asset returns, obtained from statistical analysis based on available monthly financial and economic data. Using a system of estimated equations, the model then applies a Monte Carlo simulation method to project the estimated interrelationships among risk factors and asset classes as well as uncertainty and randomness over time. The model generates a large set of simulated outcomes for each asset class over several time horizons. Forecasts are obtained by computing measures of central tendency in these simulations. Results produced by the tool will vary with each use and over time.
6

Advisor’s Report
7
For the 12 months ended November 30,
2017, Vanguard Ohio Long-Term Tax-
Exempt Fund returned 6.52%. That result
was better than the 5.39% return of the
fund’s benchmark, the Bloomberg Barclays
Ohio Municipal Bond Index, which includes
bonds across the maturity spectrum. The
fund’s return also surpassed the 3.55%
average return of peer-group funds.
The Long-Term Fund’s 30-day SEC yield
was little changed, finishing the period
at 2.39%.
The fund is permitted to invest in
securities that would generate income
distributions subject to the alternative
minimum tax (AMT); as of the end of
the fiscal year, however, it did not own
AMT bonds.
Please note that Vanguard is planning to
adjust the security selection parameters
for the fund’s investable universe at the
end of March. We are making this change
across our state municipal bond fund
lineup. Under the new parameters, we
will seek to maintain at least 80% of the
fund’s assets invested in investment-grade
securities and no more than 20% in
non-investment-grade securities at the
time of purchase. The previous security
selection policy required 75% in securities
rated A or better, up to 20% in securities
rated BBB, and only 5% in non-investment-
grade securities. The new parameters
provide greater flexibility with respect to
investment selection, and may result in a
higher risk profile for the fund.
Yields of Municipal Securities(AAA-Rated General Obligation Issues)
November 30, November 30,
Maturity 2016 2017
2 years 1.16% 1.57%
5 years 1.85 1.76
10 years 2.52 2.15
30 years 3.26 2.79
Source: Vanguard.

8
The investment environmentThe period began with a surge in optimism
heading into 2017 on the prospect of
the government’s policy agenda on tax
reform, infrastructure spending, and greater
deregulation—all of which were expected
to spark economic growth. That prompted
some investors to turn toward riskier
assets, pushing down bond prices while
many stock market indexes soared to
record highs.
The outlook dimmed a little in the new year,
however, as it became clear that the slate
of policy initiatives could prove harder to
implement than anticipated. Moreover,
inflation continued to disappoint, with
weak readings proving less transient
than expected and wage gains remaining
modest despite a strong labor market.
Bonds came back into favor, with prices of
longer-dated and lower-rated bonds ending
the 12 months significantly higher.
The macroeconomic backdrop remained
positive, with growth holding fairly
steady and solid job creation helping
push the national unemployment rate
to a 17-year low of 4.1%. The housing
and manufacturing sectors recorded
decent growth as well.
These developments likely played a part
in the Federal Reserve’s decisions to raise
rates three times during the period, lifting
its target range up to 1%–1.25%, and to
start reducing its $4.5 trillion balance sheet
in October. (The Fed raised rates again
in December 2017, after the close of
the fund’s fiscal year.)
Ohio’s economy grew a little slower
than that of the United States as a whole,
according to a gauge of current economic
conditions published monthly by the Federal
Reserve Bank of Philadelphia. The bank’s
index for the Buckeye State rose by less
than 2% from November 2016 through
October 2017, the latest month for which
data is available, while the increase at
the national level was well over 2%.
(Each state’s index incorporates data
on nonfarm payroll employment, the
jobless rate, average hours worked in
manufacturing, and inflation-adjusted
wage and salary payments.)
Ohio’s credit rating is very stable. It is
running a balanced budget, thanks in
part to vigilance on the part of the state
government to address imbalances as
they emerge. Although Ohio’s economic
growth rate has lagged that of the
nation overall, the state’s revenues have
managed to grow. Pension plans of local
governments, including school districts,
are still underfunded, but progress has
been made since the recession.
Although muni bond issuance at the
national level dipped compared to the
prior period, Ohio issuance from January
through November was up a little year
over year. It met with solid demand.

9
Management of the fundThe bond fund maintains a structural
overweight to securities toward the
long end of the yield curve relative to
its benchmark, which spans all maturities.
This stance helped its relative performance
for the fiscal year, as longer-dated securities
returned more than their shorter-dated
counterparts.
The fund’s overweight to lower-rated
investment-grade securities, and to the
A-rated segment in particular, also helped
relative performance.
Security selection remained another area
where we were able to add value, thanks
to our team of credit analysts. Selection in
a number of segments including local and
state general obligation bonds worked
out well. So did our positioning in certain
sectors including university revenue bonds.
Our holdings of premium callable bonds
performed well. Because these bonds
may be redeemed before maturity,
exposing investors to reinvestment risk,
they offer attractive yields and favorable
total return potential across many interest
rate scenarios.
Our allocation to very short-term, very
liquid securities proved a headwind for
performance.
The outlookIn spite of long-term structural
challenges—among them, slowing
productivity growth and demographic
headwinds—the U.S. economy should
surpass its long-term potential growth
rate of about 2% in 2018.
The unemployment rate has fallen to its
lowest level since 2000 and is likely to
move even lower. A return of upward
pressure on wages, along with stable
and broader global growth and some
recovery in commodity prices, may
cause inflation to clock in stronger than
the financial markets currently anticipate.
Our long-term inflation outlook, however,
remains unchanged.
Such a backdrop should justify the Fed
raising rates to at least 2% by the end of
2018. As for its balance sheet, the Fed will
likely want to stick to the framework and
timetable it has laid out, barring unexpected
incoming economic data or unintended
consequences in the bond market from
its tapering.
We have been closely monitoring
developments in Washington that could
affect municipal bonds. The new tax law
contains provisions that will marginally
affect the municipal bond market. The
largest change is the elimination of
issuers’ ability to issue advance refunding
bonds (bonds issued to effectively repay
10
existing debt at lower rates). This change
is expected to modestly reduce municipal
supply in 2018, but the reduction should
be offset by the reduced demand from
the lowering of personal and corporate tax
rates. So we do not expect large changes
to the municipal bond market as a result
of the tax law changes.
Volatility could well pick up from the very
low levels we’ve been experiencing.
The list of potential catalysts for rising
volatility is long and includes an inflation
surprise, gridlock over raising the federal
government debt ceiling, unfavorable
developments in trade negotiations,
and a rise in geopolitical tensions.
We nevertheless expect munis to continue
to offer relative stability and a steady stream
of income. Whatever the markets may
bring, our experienced team of portfolio
managers, traders, and credit analysts will
continue to seek out opportunities to add
to the fund’s performance.
Christopher W. Alwine, CFA, Principal,
Head of Municipal Group
James M. D’Arcy, CFA, Portfolio Manager
Vanguard Fixed Income Group
December 22, 2017
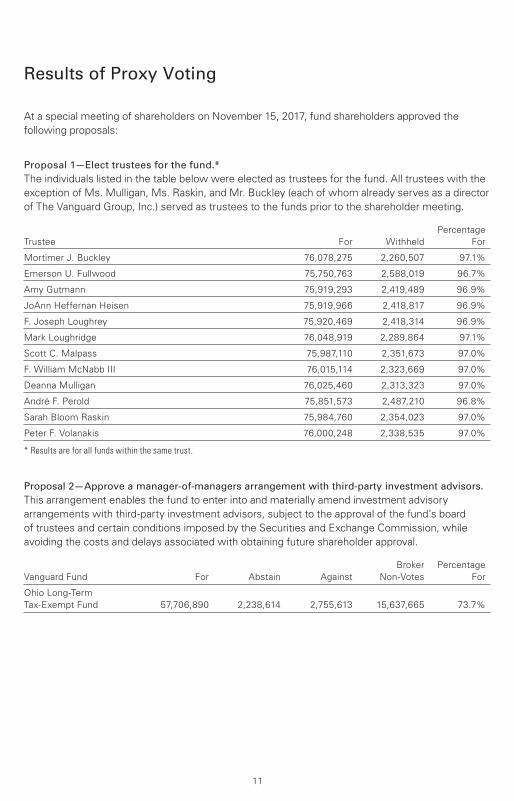
Results of Proxy Voting
At a special meeting of shareholders on November 15, 2017, fund shareholders approved the
following proposals:
Proposal 1—Elect trustees for the fund.*The individuals listed in the table below were elected as trustees for the fund. All trustees with the
exception of Ms. Mulligan, Ms. Raskin, and Mr. Buckley (each of whom already serves as a director
of The Vanguard Group, Inc.) served as trustees to the funds prior to the shareholder meeting.
Percentage
Trustee For Withheld For
Mortimer J. Buckley 76,078,275 2,260,507 97.1%
Emerson U. Fullwood 75,750,763 2,588,019 96.7%
Amy Gutmann 75,919,293 2,419,489 96.9%
JoAnn Heffernan Heisen 75,919,966 2,418,817 96.9%
F. Joseph Loughrey 75,920,469 2,418,314 96.9%
Mark Loughridge 76,048,919 2,289,864 97.1%
Scott C. Malpass 75,987,110 2,351,673 97.0%
F. William McNabb III 76,015,114 2,323,669 97.0%
Deanna Mulligan 76,025,460 2,313,323 97.0%
André F. Perold 75,851,573 2,487,210 96.8%
Sarah Bloom Raskin 75,984,760 2,354,023 97.0%
Peter F. Volanakis 76,000,248 2,338,535 97.0%
* Results are for all funds within the same trust.
Proposal 2—Approve a manager-of-managers arrangement with third-party investment advisors.This arrangement enables the fund to enter into and materially amend investment advisory
arrangements with third-party investment advisors, subject to the approval of the fund’s board
of trustees and certain conditions imposed by the Securities and Exchange Commission, while
avoiding the costs and delays associated with obtaining future shareholder approval.
Broker Percentage
Vanguard Fund For Abstain Against Non-Votes For
Ohio Long-Term
Tax-Exempt Fund 57,706,890 2,238,614 2,755,613 15,637,665 73.7%
11
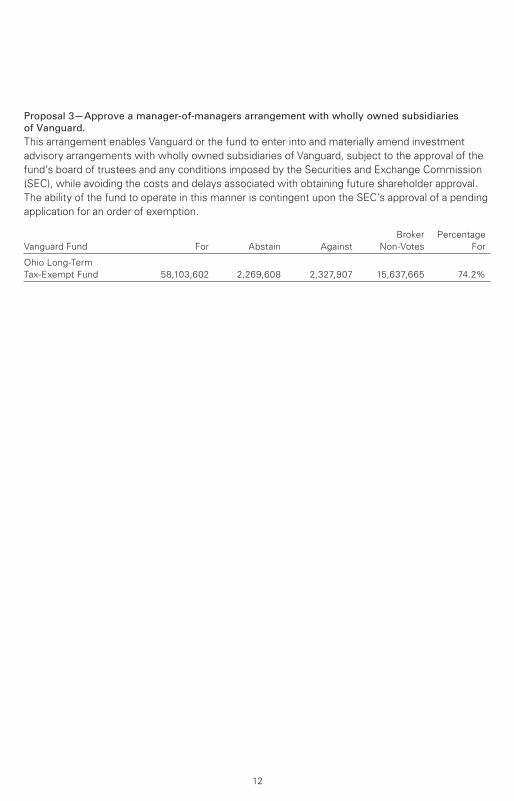
Proposal 3—Approve a manager-of-managers arrangement with wholly owned subsidiaries of Vanguard.This arrangement enables Vanguard or the fund to enter into and materially amend investment
advisory arrangements with wholly owned subsidiaries of Vanguard, subject to the approval of the
fund’s board of trustees and any conditions imposed by the Securities and Exchange Commission
(SEC), while avoiding the costs and delays associated with obtaining future shareholder approval.
The ability of the fund to operate in this manner is contingent upon the SEC’s approval of a pending
application for an order of exemption.
Broker Percentage
Vanguard Fund For Abstain Against Non-Votes For
Ohio Long-Term
Tax-Exempt Fund 58,103,602 2,269,608 2,327,907 15,637,665 74.2%
12

Ohio Long-Term Tax-Exempt Fund
Fund ProfileAs of November 30, 2017
1 The expense ratio shown is from the prospectus dated March 28, 2017, and represents estimated costs for the current fiscal year. Forthe fiscal year ended November 30, 2017, the expense ratio was 0.15%.
13
Financial Attributes
Fund
Bloomberg
Barclays
OH
Muni Bond
Index
Bloomberg
Barclays
Municipal
Bond
Index
Number of Bonds 397 1,543 50,546
Yield to Maturity
(before expenses) 2.6% 2.5% 2.5%
Average Coupon 4.6% 4.8% 4.7%
Average Duration 7.1 years 6.2 years 5.9 years
Average Stated
Maturity 17.2 years 13.4 years 13.0 years
Ticker Symbol VOHIX — —
Expense Ratio1 0.15% — —
30-Day SEC Yield 2.39% — —
Short-Term Reserves 4.9% — —
Volatility Measures
Bloomberg
Barclays OH
Muni Bond
Index
Bloomberg
Barclays
Municipal
Bond Index
R-Squared 0.98 0.97
Beta 1.06 1.08
These measures show the degree and timing of the fund’s fluctuations compared with the indexes over 36 months.
Distribution by Stated Maturity
(% of portfolio)
Under 1 Year 4.3%
1 - 3 Years 2.8
3 - 5 Years 1.9
5 - 10 Years 9.5
10 - 20 Years 41.7
20 - 30 Years 32.7
Over 30 Years 7.1
Distribution by Credit Quality (% of portfolio)
AAA 8.4%
AA 53.4
A 30.1
BBB 7.1
BB 0.2
Not Rated 0.8
Credit-quality ratings are obtained from Moody's and S&P, and the higher rating for each issue is shown. "Not Rated" is used to classify securities for which a rating is not available. Not rated securities include a fund's investment in Vanguard Market Liquidity Fund or Vanguard Municipal Cash Management Fund, each of which invests in high-quality money market instruments and may serve as a cash management vehicle for the Vanguard funds, trusts, and accounts. For more information about these ratings, see the Glossary entry for Credit Quality.
Investment Focus
Average Maturity
Short
High
Medium
Low
Med. Long
Credit Quality

All of the returns in this report represent past performance, which is not a guarantee of future results that may be achieved by the fund. (Current performance may be lower or higher thanthe performance data cited. For performance data current to the most recent month-end, visitour website at vanguard.com/performance.) Note, too, that both investment returns and principal value can fluctuate widely, so an investor’s shares, when sold, could be worth more or less than their original cost. The returns shown do not reflect taxes that a shareholder would pay
on fund distributions or on the sale of fund shares.
Ohio Long-Term Tax-Exempt Fund
Performance Summary
See Financial Highlights for dividend and capital gains information.
14
Cumulative Performance: November 30, 2007, Through November 30, 2017Initial Investment of $10,000
2017201620152014201320122011201020092008
$20,000
6,000
15,711
Average Annual Total Returns
Periods Ended November 30, 2017
OneYear
FiveYears
TenYears
Final Valueof a $10,000Investment
Ohio Long-Term Tax-Exempt Fund 6.52% 3.25% 4.62% $15,711
• • • • • • • •Bloomberg Barclays OH MunicipalBond Index 5.39 2.87 4.13 14,985
– – – – Ohio Municipal Debt Funds Average 3.55 1.80 3.39 13,957________ Bloomberg Barclays Municipal Bond
Index 5.58 2.55 4.38 15,347
Ohio Municipal Debt Funds Average: Derived from data provided by Lipper, a Thomson Reuters Company.

Ohio Long-Term Tax-Exempt Fund
15
Fiscal-Year Total Returns (%): November 30, 2007, Through November 30, 2017
Fiscal Year Income Returns Capital Returns Total Returns
BloombergBarclays OH
Muni BondIndex
Total Returns
2008 4.13% -7.74% -3.61% -6.73%
2009 4.76 8.85 13.61 15.73
2010 4.14 -0.08 4.06 4.20
2011 4.20 1.61 5.81 5.84
2012 3.88 7.20 11.08 9.28
2013 3.48 -7.76 -4.28 -2.71
2014 3.89 6.30 10.19 8.60
2015 3.46 0.44 3.90 3.55
2016 3.15 -2.64 0.51 -0.11
2017 3.36 3.16 6.52 5.39
Average Annual Total Returns: Periods Ended September 30, 2017 This table presents returns through the latest calendar quarter—rather than through the end of the fiscal period.
Securities and Exchange Commission rules require that we provide this information.
Ten Years
Inception Date One Year Five Years Income Capital Total
Ohio Long-TermTax-Exempt Fund 6/18/1990 1.07% 3.71% 3.86% 0.88% 4.74%

Ohio Long-Term Tax-Exempt Fund
Financial Statements
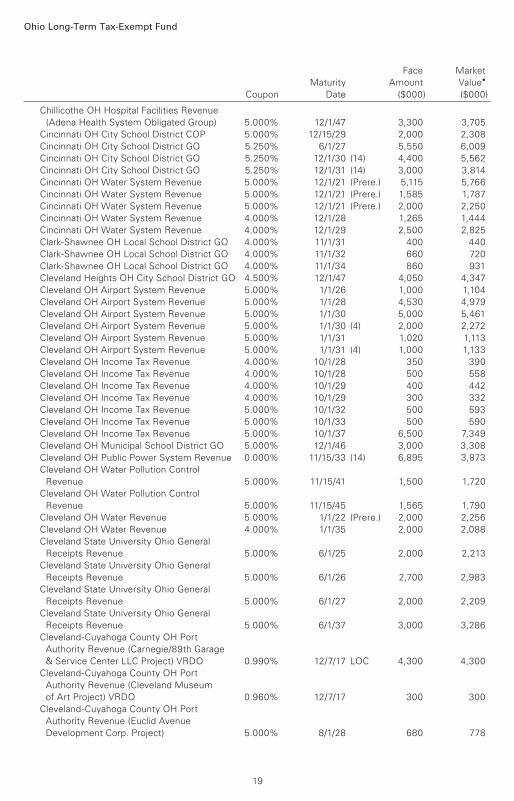
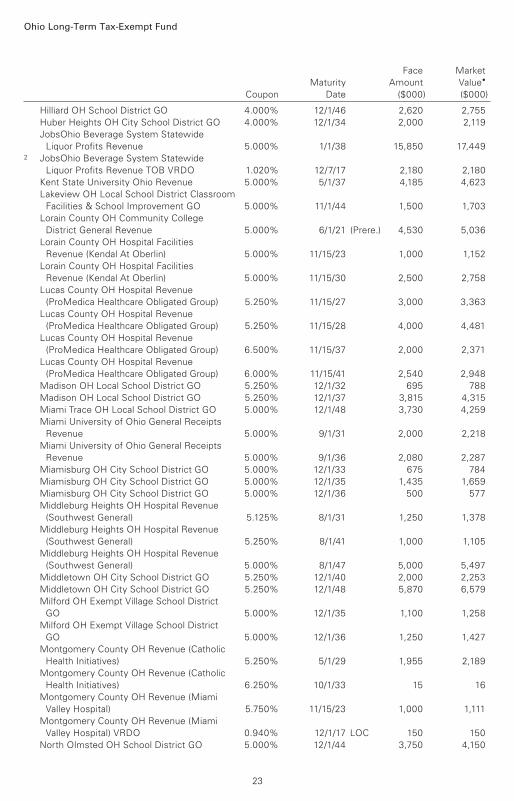
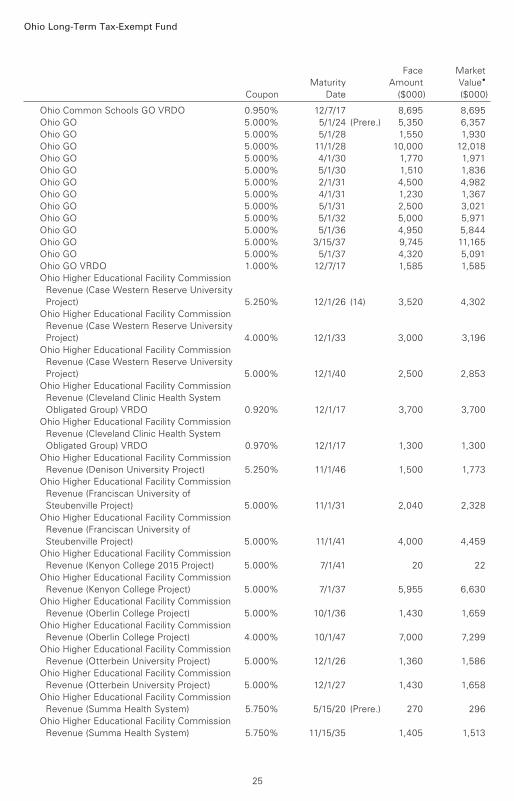
Statement of Net AssetsAs of November 30, 2017
Tax-Exempt Municipal Bonds (100.3%)
Ohio (99.9%)
Akron OH Bath & Copley Joint Township
Hospital District Revenue (Children’s
Hospital Medical Center of Akron) 5.000% 11/15/24 920 1,028
Akron OH Bath & Copley Joint Township
Hospital District Revenue (Children’s
Hospital Medical Center of Akron) 5.000% 11/15/38 5,045 5,636
Akron OH Bath & Copley Joint Township
Hospital District Revenue (Children’s
Hospital Medical Center of Akron) 5.000% 11/15/42 2,780 2,969
Akron OH Bath & Copley Joint Township
Hospital District Revenue (Summa
Health System Obligated Group) 5.250% 11/15/46 7,000 7,837
Akron OH Income Tax Revenue
(Community Learning Centers) 5.000% 12/1/33 1,500 1,6831 Akron OH Income Tax Revenue
(Community Learning Centers) 4.000% 12/1/28 285 3151 Akron OH Income Tax Revenue
(Community Learning Centers) 4.000% 12/1/29 610 6641 Akron OH Income Tax Revenue
(Community Learning Centers) 4.000% 12/1/30 1,700 1,828
Allen County OH Hospital Facilities Revenue
(Catholic Healthcare Partners) 5.250% 9/1/27 4,015 4,389
Allen County OH Hospital Facilities Revenue
(Catholic Healthcare Partners) 5.000% 5/1/33 6,270 6,840
Allen County OH Hospital Facilities Revenue
(Catholic Healthcare Partners) 5.000% 6/1/38 8,000 8,495
Allen County OH Hospital Facilities Revenue
(Catholic Healthcare Partners) 5.000% 5/1/42 10,000 10,809
Allen County OH Hospital Facilities Revenue
(Catholic Healthcare Partners) VRDO 0.960% 12/1/17 LOC 7,030 7,030
Allen County OH Hospital Facilities Revenue
(Mercy Health) 4.000% 11/1/44 115 118
American Municipal Power Ohio Inc.
Revenue 5.250% 2/15/22 70 71
American Municipal Power Ohio Inc.
Revenue 5.250% 2/15/23 120 121
Face Market
Maturity Amount Value•
Coupon Date ($000) ($000)
The fund reports a complete list of its holdings in regulatory filings four times in each fiscal year, at
the quarter-ends. For the second and fourth fiscal quarters, the lists appear in the fund’s semiannual
and annual reports to shareholders. For the first and third fiscal quarters, the fund files the lists with
the Securities and Exchange Commission on Form N-Q. Shareholders can look up the fund’s Forms
N-Q on the SEC’s website at sec.gov. Forms N-Q may also be reviewed and copied at the SEC’s
Public Reference Room (see the back cover of this report for further information).
16

Ohio Long-Term Tax-Exempt Fund
American Municipal Power Ohio Inc.
Revenue 5.250% 2/15/27 60 60
American Municipal Power Ohio Inc.
Revenue 5.000% 2/15/39 7,000 7,947
American Municipal Power Ohio Inc.
Revenue 5.000% 2/15/42 5,880 6,661
American Municipal Power Ohio Inc.
Revenue (Fremont Energy Center Project) 5.000% 2/15/24 3,500 3,897
American Municipal Power Ohio Inc.
Revenue (Fremont Energy Center Project) 5.000% 2/15/31 3,000 3,315
American Municipal Power Ohio Inc.
Revenue (Fremont Energy Center Project) 5.000% 2/15/37 10,415 11,372
American Municipal Power Ohio Inc.
Revenue (Fremont Energy Center Project) 5.000% 2/15/42 10,780 11,708
American Municipal Power Ohio Inc.
Revenue (Hydroelectric Projects) 5.000% 2/15/46 4,000 4,500
American Municipal Power Ohio Inc.
Revenue (Hydroelectric Projects) 5.000% 2/15/46 4,750 5,362
American Municipal Power Ohio Inc.
Revenue (Meldahl Hydroelectric Project) 4.000% 2/15/41 1,500 1,537
American Municipal Power Ohio Inc.
Revenue (Meldahl Hydroelectric Project) 5.000% 2/15/46 3,000 3,364
American Municipal Power Ohio Inc.
Revenue (Prairie State Energy
Campus Project) 5.000% 2/15/26 2,000 2,321
American Municipal Power Ohio Inc.
Revenue (Prairie State Energy
Campus Project) 5.000% 2/15/29 8,365 9,626
American Municipal Power Ohio Inc.
Revenue (Prairie State Energy
Campus Project) 5.250% 2/15/30 600 674
American Municipal Power Ohio Inc.
Revenue (Prairie State Energy
Campus Project) 5.250% 2/15/31 2,500 2,808
American Municipal Power Ohio Inc.
Revenue (Prairie State Energy
Campus Project) 5.000% 2/15/35 2,000 2,345
American Municipal Power Ohio Inc.
Revenue (Prairie State Energy
Campus Project) 5.000% 2/15/38 2,000 2,330
Apollo Career Center Joint Vocational
School District Ohio GO 5.000% 12/1/38 4,700 5,153
Berea OH City School District GO 4.000% 12/1/47 (15) 750 780
Berea OH City School District GO 4.000% 12/1/53 (15) 2,750 2,8551 Bluffton OH Hospital Facilities Revenue
(Blanchard Valley Health System) 5.000% 12/1/29 1,010 1,1771 Bluffton OH Hospital Facilities Revenue
(Blanchard Valley Health System) 4.000% 12/1/34 2,000 2,065
Bowling Green State University Ohio
Revenue 5.000% 6/1/28 300 357
Bowling Green State University Ohio
Revenue 5.000% 6/1/29 375 444
Bowling Green State University Ohio
Revenue 5.000% 6/1/31 750 881
Face Market
Maturity Amount Value•
Coupon Date ($000) ($000)
17

Ohio Long-Term Tax-Exempt Fund
Bowling Green State University Ohio
Revenue 5.000% 6/1/33 575 668
Bowling Green State University Ohio
Revenue 5.000% 6/1/34 1,565 1,808
Bowling Green State University Ohio
Revenue 5.000% 6/1/35 1,000 1,151
Bowling Green State University Ohio
Revenue 5.000% 6/1/42 1,000 1,140
Bowling Green State University Ohio
Revenue 5.000% 6/1/45 3,250 3,700
Bowling Green State University Ohio
Student Housing Revenue (CFP I LLC -
State University Project) 5.750% 6/1/20 (Prere.) 2,000 2,193
Bowling Green State University Ohio
Student Housing Revenue (CFP I LLC -
State University Project) 6.000% 6/1/20 (Prere.) 2,000 2,205
Butler County OH Hospital Facilities
Revenue (Kettering Health Network) 6.375% 4/1/36 1,360 1,554
Butler County OH Hospital Facilities
Revenue (Kettering Health Network) 5.625% 4/1/41 2,000 2,191
Butler County OH Hospital Facilities
Revenue (UC Health) 5.500% 11/1/20 (Prere.) 1,390 1,537
Butler County OH Hospital Facilities
Revenue (UC Health) 5.750% 11/1/20 (Prere.) 1,305 1,454
Butler County OH Hospital Facilities
Revenue (UC Health) 5.250% 11/1/29 4,000 4,359
Butler County OH Hospital Facilities
Revenue (UC Health) 4.000% 11/15/30 1,010 1,074
Butler County OH Hospital Facilities
Revenue (UC Health) 4.000% 11/15/31 1,075 1,140
Butler County OH Hospital Facilities
Revenue (UC Health) 5.500% 11/1/40 2,770 3,031
Butler County OH Hospital Facilities
Revenue (UC Health) 5.000% 11/15/45 5,000 5,608
Butler County OH Transportation
Improvement District Tax Allocation
Revenue 4.000% 12/1/27 615 678
Butler County OH Transportation
Improvement District Tax Allocation
Revenue 4.000% 12/1/28 2,200 2,404
Centerville OH Health Care Revenue
(Graceworks Lutheran Services) 5.250% 11/1/37 1,500 1,613
Chagrin Falls OH Exempted Village School
District GO 4.000% 12/1/35 300 322
Chagrin Falls OH Exempted Village School
District GO 4.000% 12/1/36 500 535
Chagrin Falls OH Exempted Village School
District GO 4.000% 12/1/47 1,435 1,516
Chillicothe OH Hospital Facilities Revenue
(Adena Health System Obligated Group) 5.000% 12/1/27 1,000 1,185
Chillicothe OH Hospital Facilities Revenue
(Adena Health System Obligated Group) 5.000% 12/1/37 1,400 1,587
Chillicothe OH Hospital Facilities Revenue
(Adena Health System Obligated Group) 4.000% 12/1/42 500 509
Face Market
Maturity Amount Value•
Coupon Date ($000) ($000)
18
Ohio Long-Term Tax-Exempt Fund
Chillicothe OH Hospital Facilities Revenue
(Adena Health System Obligated Group) 5.000% 12/1/47 3,300 3,705
Cincinnati OH City School District COP 5.000% 12/15/29 2,000 2,308
Cincinnati OH City School District GO 5.250% 6/1/27 5,550 6,009
Cincinnati OH City School District GO 5.250% 12/1/30 (14) 4,400 5,562
Cincinnati OH City School District GO 5.250% 12/1/31 (14) 3,000 3,814
Cincinnati OH Water System Revenue 5.000% 12/1/21 (Prere.) 5,115 5,766
Cincinnati OH Water System Revenue 5.000% 12/1/21 (Prere.) 1,585 1,787
Cincinnati OH Water System Revenue 5.000% 12/1/21 (Prere.) 2,000 2,250
Cincinnati OH Water System Revenue 4.000% 12/1/28 1,265 1,444
Cincinnati OH Water System Revenue 4.000% 12/1/29 2,500 2,825
Clark-Shawnee OH Local School District GO 4.000% 11/1/31 400 440
Clark-Shawnee OH Local School District GO 4.000% 11/1/32 660 720
Clark-Shawnee OH Local School District GO 4.000% 11/1/34 860 931
Cleveland Heights OH City School District GO 4.500% 12/1/47 4,050 4,347
Cleveland OH Airport System Revenue 5.000% 1/1/26 1,000 1,104
Cleveland OH Airport System Revenue 5.000% 1/1/28 4,530 4,979
Cleveland OH Airport System Revenue 5.000% 1/1/30 5,000 5,461
Cleveland OH Airport System Revenue 5.000% 1/1/30 (4) 2,000 2,272
Cleveland OH Airport System Revenue 5.000% 1/1/31 1,020 1,113
Cleveland OH Airport System Revenue 5.000% 1/1/31 (4) 1,000 1,133
Cleveland OH Income Tax Revenue 4.000% 10/1/28 350 390
Cleveland OH Income Tax Revenue 4.000% 10/1/28 500 558
Cleveland OH Income Tax Revenue 4.000% 10/1/29 400 442
Cleveland OH Income Tax Revenue 4.000% 10/1/29 300 332
Cleveland OH Income Tax Revenue 5.000% 10/1/32 500 593
Cleveland OH Income Tax Revenue 5.000% 10/1/33 500 590
Cleveland OH Income Tax Revenue 5.000% 10/1/37 6,500 7,349
Cleveland OH Municipal School District GO 5.000% 12/1/46 3,000 3,308
Cleveland OH Public Power System Revenue 0.000% 11/15/33 (14) 6,895 3,873
Cleveland OH Water Pollution Control
Revenue 5.000% 11/15/41 1,500 1,720
Cleveland OH Water Pollution Control
Revenue 5.000% 11/15/45 1,565 1,790
Cleveland OH Water Revenue 5.000% 1/1/22 (Prere.) 2,000 2,256
Cleveland OH Water Revenue 4.000% 1/1/35 2,000 2,088
Cleveland State University Ohio General
Receipts Revenue 5.000% 6/1/25 2,000 2,213
Cleveland State University Ohio General
Receipts Revenue 5.000% 6/1/26 2,700 2,983
Cleveland State University Ohio General
Receipts Revenue 5.000% 6/1/27 2,000 2,209
Cleveland State University Ohio General
Receipts Revenue 5.000% 6/1/37 3,000 3,286
Cleveland-Cuyahoga County OH Port
Authority Revenue (Carnegie/89th Garage
& Service Center LLC Project) VRDO 0.990% 12/7/17 LOC 4,300 4,300
Cleveland-Cuyahoga County OH Port
Authority Revenue (Cleveland Museum
of Art Project) VRDO 0.960% 12/7/17 300 300
Cleveland-Cuyahoga County OH Port
Authority Revenue (Euclid Avenue
Development Corp. Project) 5.000% 8/1/28 680 778
Face Market
Maturity Amount Value•
Coupon Date ($000) ($000)
19

Ohio Long-Term Tax-Exempt Fund
Cleveland-Cuyahoga County OH Port
Authority Revenue (Euclid Avenue
Development Corp. Project) 5.000% 8/1/30 3,020 3,431
Cleveland-Cuyahoga County OH Port
Authority Revenue (Euclid Avenue
Development Corp. Project) 5.000% 8/1/39 3,000 3,352
Columbus OH City School District GO 0.000% 12/1/29 (4) 2,000 1,399
Columbus OH City School District GO 5.000% 12/1/33 3,000 3,530
Columbus OH City School District GO 5.000% 12/1/42 500 580
Columbus OH City School District School
Facilities Construction & Improvement GO 5.000% 12/1/32 2,825 3,339
Columbus OH City School District School
Facilities Construction & Improvement GO 5.000% 12/1/47 1,480 1,712
Columbus OH GO 5.000% 7/1/23 (Prere.) 2,500 2,921
Columbus OH GO 5.000% 7/1/23 (Prere.) 1,260 1,472
Columbus OH GO 4.000% 4/1/27 1,025 1,175
Columbus OH GO 4.000% 8/15/27 2,855 3,198
Columbus OH GO 5.000% 2/15/28 7,435 9,111
Columbus OH GO 4.000% 4/1/30 5,015 5,588
Columbus OH GO 5.000% 7/1/30 2,700 3,234
Columbus OH GO 4.000% 4/1/31 2,060 2,288
Columbus OH GO 4.000% 4/1/33 1,000 1,095
Columbus OH Sewer Revenue 5.000% 6/1/26 3,255 3,903
Columbus OH Sewer Revenue 5.000% 6/1/29 2,000 2,406
Columbus OH Sewer Revenue 5.000% 6/1/31 1,000 1,178
Columbus OH Sewer Revenue 5.000% 6/1/32 2,600 3,095
Cuyahoga County OH (Convention Hotel
Project) COP 4.000% 12/1/34 1,320 1,379
Cuyahoga County OH (Convention Hotel
Project) COP 5.000% 12/1/36 1,000 1,118
Cuyahoga County OH Economic
Development Revenue (Med Mart/
Convention Center Project) 5.000% 12/1/24 4,000 4,390
Cuyahoga County OH Excise Tax Revenue
(Sports Facilities Improvement Project) 5.000% 12/1/27 1,880 2,136
Cuyahoga County OH Hospital Revenue
(MetroHealth System) 5.000% 2/15/28 3,000 3,366
Cuyahoga County OH Hospital Revenue
(MetroHealth System) 5.000% 2/15/30 2,000 2,217
Cuyahoga County OH Hospital Revenue
(MetroHealth System) 5.000% 2/15/37 2,500 2,703
Cuyahoga County OH Hospital Revenue
(MetroHealth System) 5.250% 2/15/47 4,000 4,368
Cuyahoga County OH Hospital Revenue
(MetroHealth System) 5.500% 2/15/52 2,500 2,772
Cuyahoga County OH Hospital Revenue
(MetroHealth System) 5.000% 2/15/57 2,700 2,859
Cuyahoga County OH Hospital Revenue
(MetroHealth System) 5.500% 2/15/57 2,000 2,206
Cuyahoga County OH Public Library Fund
Special Obligation Revenue 4.000% 12/1/32 1,840 1,946
Cuyahoga County OH Sales Tax Revenue 5.000% 12/1/32 1,900 2,236
Cuyahoga County OH Sales Tax Revenue 5.000% 12/1/34 2,775 3,247
Cuyahoga County OH Sales Tax Revenue 5.000% 12/1/35 4,485 5,231
Face Market
Maturity Amount Value•
Coupon Date ($000) ($000)
20

Ohio Long-Term Tax-Exempt Fund
Cuyahoga County OH Sales Tax Revenue
(Quicken Loans Arena Project) 4.000% 1/1/26 740 823
Cuyahoga County OH Sales Tax Revenue
(Quicken Loans Arena Project) 4.000% 1/1/27 500 555
Cuyahoga County OH Sales Tax Revenue
(Quicken Loans Arena Project) 5.000% 1/1/29 1,065 1,254
Cuyahoga County OH Sales Tax Revenue
(Quicken Loans Arena Project) 5.000% 1/1/30 1,000 1,174
Cuyahoga County OH Sales Tax Revenue
(Quicken Loans Arena Project) 5.000% 1/1/31 615 720
Cuyahoga OH Community College District
Revenue 5.000% 2/1/29 1,000 1,171
Dublin OH Special Obligation Revenue 5.000% 12/1/42 3,485 3,982
Dublin OH Special Obligation Revenue 5.000% 12/1/44 1,920 2,190
Elyria OH City School District GO 5.000% 12/1/29 505 597
Elyria OH School District GO 4.000% 12/1/51 4,685 4,817
Euclid OH City School District GO 4.750% 1/15/54 5,000 5,372
Fairfield County OH Hospital Facilities
Revenue (Fairfield Medical Center) 5.000% 6/15/43 4,250 4,429
Forest Hills OH Local School District GO 5.000% 12/1/46 2,000 2,280
Franklin County OH Convention Facilities
Authority Revenue 5.000% 12/1/30 4,435 5,223
Franklin County OH GO 5.000% 12/1/31 3,000 3,552
Franklin County OH Health Care Facilities
Improvement Revenue (Ohio Presbyterian
Retirement Services Project) 5.625% 7/1/26 2,800 2,979
Franklin County OH Health Care Facilities
Improvement Revenue (OPRS Communities) 6.125% 7/1/40 4,110 4,555
Franklin County OH Hospital Facilities
Revenue (OhioHealth Corp.) 5.000% 5/15/31 5,000 5,665
Franklin County OH Hospital Facilities
Revenue (OhioHealth Corp.) 5.000% 5/15/34 2,610 2,997
Franklin County OH Hospital Facilities
Revenue (OhioHealth Corp.) 5.000% 11/15/36 3,640 3,986
Franklin County OH Hospital Facilities
Revenue (OhioHealth Corp.) 5.000% 5/15/45 4,640 5,242
Franklin County OH Hospital Improvement
Revenue (Nationwide Children’s Hospital
Project) 5.000% 11/1/28 1,590 1,920
Franklin County OH Hospital Improvement
Revenue (Nationwide Children’s Hospital
Project) 5.000% 11/1/33 2,600 3,068
Franklin County OH Hospital Improvement
Revenue (Nationwide Children’s Hospital
Project) 4.000% 11/1/36 1,110 1,162
Franklin County OH Hospital Improvement
Revenue (Nationwide Children’s Hospital
Project) 4.000% 11/1/38 775 808
Franklin County OH Hospital Improvement
Revenue (Nationwide Children’s Hospital
Project) 4.000% 11/1/39 1,290 1,342
Franklin County OH Hospital Improvement
Revenue (Nationwide Children’s Hospital
Project) 5.000% 11/1/42 7,000 7,576
Face Market
Maturity Amount Value•
Coupon Date ($000) ($000)
21

Ohio Long-Term Tax-Exempt Fund
Franklin County OH Hospital Improvement
Revenue (Nationwide Children’s Hospital
Project) 4.000% 11/1/44 2,300 2,384
Franklin County OH Hospital Improvement
Revenue (Nationwide Children’s Hospital
Project) 4.000% 11/1/47 2,420 2,504
Franklin County OH Revenue (Trinity Health
Corp.) 4.000% 12/1/46 3,880 3,985
Franklin County OH Revenue (Trinity Health
Corp.) 5.000% 12/1/46 1,500 1,700
Fremont City OH School District GO 5.000% 1/15/33 1,000 1,152
Fremont City OH School District GO 4.000% 1/15/55 2,000 2,052
Greene County OH Hospital Facilities
Revenue (Kettering Health Network
Obligated Group Project) 5.500% 4/1/39 2,500 2,623
Hamilton County OH Healthcare Facilities
Revenue (Christ Hospital Project) 5.250% 6/1/32 3,150 3,546
Hamilton County OH Healthcare Facilities
Revenue (Christ Hospital Project) 5.000% 6/1/42 5,300 5,841
Hamilton County OH Healthcare Facilities
Revenue (Christ Hospital Project) 5.500% 6/1/42 3,000 3,403
Hamilton County OH Healthcare Revenue
(Life Enriching Communities) 5.000% 1/1/32 1,750 1,884
Hamilton County OH Healthcare Revenue
(Life Enriching Communities) 5.000% 1/1/42 2,000 2,120
Hamilton County OH Healthcare Revenue
(Life Enriching Communities) 5.000% 1/1/46 4,450 4,792
Hamilton County OH Healthcare Revenue
(Life Enriching Communities) 5.000% 1/1/46 2,000 2,115
Hamilton County OH Healthcare Revenue
(Life Enriching Communities) 5.000% 1/1/51 1,400 1,502
Hamilton County OH Hospital Facilities
Revenue (Cincinnati Children’s Hospital
Medical Center) 5.000% 5/15/34 1,000 1,146
Hamilton County OH Hospital Facilities
Revenue (TriHealth Obligated Group) 4.125% 8/15/37 20 21
Hamilton County OH Hospital Facilities
Revenue (TriHealth Obligated Group) 5.000% 8/15/42 5,000 5,639
Hamilton County OH Hospital Facilities
Revenue (TriHealth Obligated Group) 4.250% 8/15/47 3,000 3,131
Hamilton County OH Hospital Facilities
Revenue (TriHealth Obligated Group) 5.000% 8/15/47 3,000 3,370
Hamilton County OH Hospital Facilities
Revenue (UC Health) 5.000% 2/1/30 1,360 1,522
Hamilton County OH Hospital Facilities
Revenue (UC Health) 5.000% 2/1/44 2,500 2,730
Hamilton County OH Sales Tax Revenue 5.000% 12/1/29 5,000 5,961
Hamilton County OH Sales Tax Revenue 5.000% 12/1/30 1,500 1,779
Hamilton County OH Sales Tax Revenue 5.000% 12/1/32 5,000 5,516
Hamilton County OH Sewer System Revenue 5.000% 12/1/22 3,000 3,442
Hamilton County OH Sewer System Revenue 5.000% 12/1/32 1,525 1,795
Hamilton OH City School District GO 5.000% 12/1/34 1,500 1,730
Harrison Hills Ohio City School District
Ohio GO 4.000% 11/1/54 2,720 2,798
Face Market
Maturity Amount Value•
Coupon Date ($000) ($000)
22
Ohio Long-Term Tax-Exempt Fund
Hilliard OH School District GO 4.000% 12/1/46 2,620 2,755
Huber Heights OH City School District GO 4.000% 12/1/34 2,000 2,119
JobsOhio Beverage System Statewide
Liquor Profits Revenue 5.000% 1/1/38 15,850 17,4492 JobsOhio Beverage System Statewide
Liquor Profits Revenue TOB VRDO 1.020% 12/7/17 2,180 2,180
Kent State University Ohio Revenue 5.000% 5/1/37 4,185 4,623
Lakeview OH Local School District Classroom
Facilities & School Improvement GO 5.000% 11/1/44 1,500 1,703
Lorain County OH Community College
District General Revenue 5.000% 6/1/21 (Prere.) 4,530 5,036
Lorain County OH Hospital Facilities
Revenue (Kendal At Oberlin) 5.000% 11/15/23 1,000 1,152
Lorain County OH Hospital Facilities
Revenue (Kendal At Oberlin) 5.000% 11/15/30 2,500 2,758
Lucas County OH Hospital Revenue
(ProMedica Healthcare Obligated Group) 5.250% 11/15/27 3,000 3,363
Lucas County OH Hospital Revenue
(ProMedica Healthcare Obligated Group) 5.250% 11/15/28 4,000 4,481
Lucas County OH Hospital Revenue
(ProMedica Healthcare Obligated Group) 6.500% 11/15/37 2,000 2,371
Lucas County OH Hospital Revenue
(ProMedica Healthcare Obligated Group) 6.000% 11/15/41 2,540 2,948
Madison OH Local School District GO 5.250% 12/1/32 695 788
Madison OH Local School District GO 5.250% 12/1/37 3,815 4,315
Miami Trace OH Local School District GO 5.000% 12/1/48 3,730 4,259
Miami University of Ohio General Receipts
Revenue 5.000% 9/1/31 2,000 2,218
Miami University of Ohio General Receipts
Revenue 5.000% 9/1/36 2,080 2,287
Miamisburg OH City School District GO 5.000% 12/1/33 675 784
Miamisburg OH City School District GO 5.000% 12/1/35 1,435 1,659
Miamisburg OH City School District GO 5.000% 12/1/36 500 577
Middleburg Heights OH Hospital Revenue
(Southwest General) 5.125% 8/1/31 1,250 1,378
Middleburg Heights OH Hospital Revenue
(Southwest General) 5.250% 8/1/41 1,000 1,105
Middleburg Heights OH Hospital Revenue
(Southwest General) 5.000% 8/1/47 5,000 5,497
Middletown OH City School District GO 5.250% 12/1/40 2,000 2,253
Middletown OH City School District GO 5.250% 12/1/48 5,870 6,579
Milford OH Exempt Village School District
GO 5.000% 12/1/35 1,100 1,258
Milford OH Exempt Village School District
GO 5.000% 12/1/36 1,250 1,427
Montgomery County OH Revenue (Catholic
Health Initiatives) 5.250% 5/1/29 1,955 2,189
Montgomery County OH Revenue (Catholic
Health Initiatives) 6.250% 10/1/33 15 16
Montgomery County OH Revenue (Miami
Valley Hospital) 5.750% 11/15/23 1,000 1,111
Montgomery County OH Revenue (Miami
Valley Hospital) VRDO 0.940% 12/1/17 LOC 150 150
North Olmsted OH School District GO 5.000% 12/1/44 3,750 4,150
Face Market
Maturity Amount Value•
Coupon Date ($000) ($000)
23

Ohio Long-Term Tax-Exempt Fund
North Olmsted OH School District GO 4.000% 12/1/48 1,495 1,535
North Royalton OH City School District GO 4.000% 12/1/33 1,000 1,071
North Royalton OH City School District GO 4.000% 12/1/34 1,500 1,601
North Royalton OH City School District GO 5.000% 12/1/47 7,000 8,014
Northeast OH Medical University Revenue 5.000% 12/1/42 475 502
Northeast OH Regional Sewer District
Revenue 4.000% 11/15/34 2,500 2,706
Northeast OH Regional Sewer District
Revenue 4.000% 11/15/37 2,500 2,681
Northeast OH Regional Sewer District
Revenue 4.000% 11/15/43 4,000 4,253
Northeast OH Regional Sewer District
Revenue (Wastewater Revenue
Improvement) 5.000% 11/15/31 2,100 2,462
Northeast OH Regional Sewer District
Revenue (Wastewater Revenue
Improvement) 5.000% 11/15/32 1,000 1,169
Northeast Ohio Regional Sewer District
Wastewater Revenue 5.000% 5/15/23 (Prere.) 4,685 5,449
Northeast Ohio Regional Sewer District
Wastewater Revenue 5.000% 5/15/23 (Prere.) 12,430 14,457
Northeast Ohio Regional Sewer District
Wastewater Revenue 5.000% 11/15/28 1,650 1,957
Northeast Ohio Regional Sewer District
Wastewater Revenue 5.000% 11/15/39 1,020 1,171
Northeast Ohio Regional Sewer District
Wastewater Revenue 4.000% 11/15/49 9,000 9,337
Northwest Local School District Ohio GO 5.000% 12/1/40 1,650 1,865
Northwest Local School District Ohio GO 5.000% 12/1/45 3,760 4,233
Northwest Local School District Ohio GO 4.000% 12/1/50 3,780 3,877
Ohio Air Quality Development Authority
Revenue (Columbus Southern Power Co.
Project) 5.800% 12/1/38 2,000 2,131
Ohio Air Quality Development Authority
Revenue (Ohio Valley Electric Corp.
Project) 5.625% 10/1/19 3,000 3,100
Ohio Capital Facilities Lease-Appropriation
Revenue (Administrative Building Fund
Projects) 5.000% 4/1/21 (Prere.) 2,670 2,952
Ohio Capital Facilities Lease-Appropriation
Revenue (Administrative Building Fund
Projects) 5.000% 4/1/36 2,765 3,244
Ohio Capital Facilities Lease-Appropriation
Revenue (Adult Correctional Building Fund
Projects) 5.000% 10/1/27 1,475 1,800
Ohio Capital Facilities Lease-Appropriation
Revenue (Adult Correctional Building Fund
Projects) 5.000% 10/1/28 1,750 2,129
Ohio Capital Facilities Lease-Appropriation
Revenue (Adult Correctional Building Fund
Projects) 5.000% 10/1/29 1,320 1,598
Ohio Capital Facilities Lease-Appropriation
Revenue (Adult Correctional Building Fund
Projects) 5.000% 10/1/35 1,500 1,682
Face Market
Maturity Amount Value•
Coupon Date ($000) ($000)
24
Ohio Long-Term Tax-Exempt Fund
Ohio Common Schools GO VRDO 0.950% 12/7/17 8,695 8,695
Ohio GO 5.000% 5/1/24 (Prere.) 5,350 6,357
Ohio GO 5.000% 5/1/28 1,550 1,930
Ohio GO 5.000% 11/1/28 10,000 12,018
Ohio GO 5.000% 4/1/30 1,770 1,971
Ohio GO 5.000% 5/1/30 1,510 1,836
Ohio GO 5.000% 2/1/31 4,500 4,982
Ohio GO 5.000% 4/1/31 1,230 1,367
Ohio GO 5.000% 5/1/31 2,500 3,021
Ohio GO 5.000% 5/1/32 5,000 5,971
Ohio GO 5.000% 5/1/36 4,950 5,844
Ohio GO 5.000% 3/15/37 9,745 11,165
Ohio GO 5.000% 5/1/37 4,320 5,091
Ohio GO VRDO 1.000% 12/7/17 1,585 1,585
Ohio Higher Educational Facility Commission
Revenue (Case Western Reserve University
Project) 5.250% 12/1/26 (14) 3,520 4,302
Ohio Higher Educational Facility Commission
Revenue (Case Western Reserve University
Project) 4.000% 12/1/33 3,000 3,196
Ohio Higher Educational Facility Commission
Revenue (Case Western Reserve University
Project) 5.000% 12/1/40 2,500 2,853
Ohio Higher Educational Facility Commission
Revenue (Cleveland Clinic Health System
Obligated Group) VRDO 0.920% 12/1/17 3,700 3,700
Ohio Higher Educational Facility Commission
Revenue (Cleveland Clinic Health System
Obligated Group) VRDO 0.970% 12/1/17 1,300 1,300
Ohio Higher Educational Facility Commission
Revenue (Denison University Project) 5.250% 11/1/46 1,500 1,773
Ohio Higher Educational Facility Commission
Revenue (Franciscan University of
Steubenville Project) 5.000% 11/1/31 2,040 2,328
Ohio Higher Educational Facility Commission
Revenue (Franciscan University of
Steubenville Project) 5.000% 11/1/41 4,000 4,459
Ohio Higher Educational Facility Commission
Revenue (Kenyon College 2015 Project) 5.000% 7/1/41 20 22
Ohio Higher Educational Facility Commission
Revenue (Kenyon College Project) 5.000% 7/1/37 5,955 6,630
Ohio Higher Educational Facility Commission
Revenue (Oberlin College Project) 5.000% 10/1/36 1,430 1,659
Ohio Higher Educational Facility Commission
Revenue (Oberlin College Project) 4.000% 10/1/47 7,000 7,299
Ohio Higher Educational Facility Commission
Revenue (Otterbein University Project) 5.000% 12/1/26 1,360 1,586
Ohio Higher Educational Facility Commission
Revenue (Otterbein University Project) 5.000% 12/1/27 1,430 1,658
Ohio Higher Educational Facility Commission
Revenue (Summa Health System) 5.750% 5/15/20 (Prere.) 270 296
Ohio Higher Educational Facility Commission
Revenue (Summa Health System) 5.750% 11/15/35 1,405 1,513
Face Market
Maturity Amount Value•
Coupon Date ($000) ($000)
25

Ohio Long-Term Tax-Exempt Fund
Ohio Higher Educational Facility Commission
Revenue (Summa Health System) 5.750% 11/15/40 3,260 3,502
Ohio Higher Educational Facility Commission
Revenue (University of Dayton Project) 5.000% 12/1/29 2,575 2,910
Ohio Higher Educational Facility Commission
Revenue (University of Dayton Project) 5.625% 12/1/41 2,000 2,210
Ohio Higher Educational Facility Commission
Revenue (University of Dayton Project) 5.000% 12/1/44 4,330 4,830
Ohio Higher Educational Facility Commission
Revenue (Xavier University Project) 5.750% 11/1/18 (Prere.) 4,000 4,159
Ohio Higher Educational Facility Commission
Revenue (Xavier University Project) 5.000% 5/1/24 1,000 1,140
Ohio Higher Educational Facility Commission
Revenue (Xavier University Project) 5.000% 5/1/25 1,500 1,718
Ohio Higher Educational Facility Commission
Revenue (Xavier University Project) 5.000% 5/1/27 1,000 1,147
Ohio Higher Educational Facility Commission
Revenue (Xavier University Project) 5.000% 5/1/32 2,185 2,439
Ohio Higher Educational Facility Commission
Revenue (Xavier University Project) 5.000% 5/1/32 1,000 1,121
Ohio Higher Educational Facility Commission
Revenue (Xavier University Project) 5.000% 5/1/33 750 837
Ohio Hospital Facilities Revenue (Cleveland
Clinic Health System) 5.000% 1/1/32 2,500 2,7523 Ohio Hospital Revenue (Cleveland Clinic
Health System Obligated Group) 5.500% 1/1/19 (Prere.) 6,600 6,875
Ohio Hospital Revenue (Cleveland Clinic
Health System Obligated Group) 5.000% 1/1/28 2,000 2,455
Ohio Hospital Revenue (Cleveland Clinic
Health System Obligated Group) 5.000% 1/1/32 1,000 1,195
Ohio Hospital Revenue (Cleveland Clinic
Health System Obligated Group) 5.000% 1/1/33 2,050 2,440
Ohio Hospital Revenue (Cleveland Clinic
Health System Obligated Group) 4.000% 1/1/34 2,175 2,330
Ohio Hospital Revenue (Cleveland Clinic
Health System Obligated Group) 4.000% 1/1/36 3,125 3,317
Ohio Hospital Revenue (Cleveland Clinic
Health System Obligated Group) 4.000% 1/1/39 3,000 3,163
Ohio Hospital Revenue (Cleveland Clinic
Health System Obligated Group) 4.000% 1/1/43 6,000 6,273
Ohio Hospital Revenue (University
Hospitals Health System Inc.) 5.000% 1/15/28 6,560 7,386
Ohio Hospital Revenue (University
Hospitals Health System Inc.) 5.000% 1/15/29 2,000 2,246
Ohio Hospital Revenue (University
Hospitals Health System Inc.) 5.000% 1/15/36 20 22
Ohio Hospital Revenue (University
Hospitals Health System Inc.) 5.000% 1/15/41 7,000 7,523
Ohio Hospital Revenue (University
Hospitals Health System Inc.) 4.000% 1/15/46 25 26
Ohio Housing Finance Agency Residential
Mortgage Revenue 6.200% 9/1/33 1,065 1,091
Ohio Housing Finance Agency Residential
Mortgage Revenue 4.100% 3/1/42 960 999
Face Market
Maturity Amount Value•
Coupon Date ($000) ($000)
26

Ohio Long-Term Tax-Exempt Fund
Ohio Infrastructure Improvement GO 5.000% 9/1/30 7,000 8,141
Ohio Infrastructure Improvement GO 5.000% 9/1/37 3,000 3,435
Ohio Juvenile Correctional Capital Facilities
Revenue 5.000% 4/1/27 1,000 1,183
Ohio Major New State Infrastructure Project
Revenue 5.000% 12/15/28 4,175 5,004
Ohio Parks & Recreation Capital Facilities
Revenue 5.000% 2/1/30 3,615 4,186
Ohio State University General Receipts
Revenue 5.000% 6/1/38 8,045 9,058
Ohio State University General Receipts
Revenue 5.000% 12/1/39 5,250 6,091
Ohio State University General Receipts
Revenue VRDO 0.940% 12/7/17 455 455
Ohio State University General Receipts
Revenue VRDO 0.950% 12/7/17 25,400 25,400
Ohio Turnpike Commission Turnpike Revenue 5.000% 2/15/20 (Prere.) 3,000 3,219
Ohio Turnpike Commission Turnpike Revenue 5.000% 2/15/25 4,500 5,149
Ohio Turnpike Commission Turnpike Revenue 0.000% 2/15/37 9,095 4,499
Ohio Turnpike Commission Turnpike Revenue 0.000% 2/15/38 7,000 3,318
Ohio Turnpike Commission Turnpike Revenue 5.250% 2/15/39 4,050 4,609
Ohio Turnpike Commission Turnpike Revenue 0.000% 2/15/40 5,000 2,192
Ohio Turnpike Commission Turnpike Revenue 0.000% 2/15/41 10,000 4,214
Ohio Turnpike Commission Turnpike Revenue 0.000% 2/15/43 5,820 2,265
Ohio University General Receipts Revenue 5.000% 12/1/28 610 681
Ohio University General Receipts Revenue 5.000% 12/1/33 1,000 1,116
Ohio University General Receipts Revenue 5.000% 12/1/39 2,000 2,214
Ohio University General Receipts Revenue 5.000% 12/1/42 1,450 1,580
Ohio University General Receipts Revenue 5.000% 12/1/44 1,605 1,854
Ohio University General Receipts Revenue 5.000% 12/1/45 5,000 5,772
Ohio Water Development Authority Drinking
Water Assistance Fund Revenue 4.000% 12/1/30 5,900 6,504
Ohio Water Development Authority Fresh
Water Revenue 5.000% 12/1/33 2,220 2,657
Ohio Water Development Authority Fresh
Water Revenue 5.000% 12/1/34 1,555 1,848
Ohio Water Development Authority Pollution
Control Revenue (Water Quality) 5.000% 12/1/29 1,000 1,194
Ohio Water Development Authority Revenue
(TimkenSteel Project) VRDO 0.980% 12/7/17 LOC 4,100 4,100
Ohio Water Development Authority Water
Pollution Control Loan Fund Revenue 5.000% 6/1/29 4,845 5,927
Ohio Water Development Authority Water
Pollution Control Loan Fund Revenue 5.000% 12/1/31 2,450 2,965
Princeton OH City School District GO 5.000% 12/1/26 500 588
Princeton OH City School District GO 5.000% 12/1/36 1,500 1,710
Revere OH Local School District GO 5.000% 12/1/42 3,025 3,340
Revere OH Local School District GO 5.000% 12/1/45 2,300 2,537
Ross County OH Hospital Facilities Revenue
(Adena Health System) 5.750% 12/1/18 (Prere.) 10,040 10,476
Rossford OH Exempted Village School
District GO 4.000% 12/1/53 2,180 2,244
Sandusky OH School District GO 5.000% 11/1/47 2,690 2,960
Face Market
Maturity Amount Value•
Coupon Date ($000) ($000)
27

Ohio Long-Term Tax-Exempt Fund
Scioto County OH Hospital Facilities
Revenue (Southern Ohio Medical Center) 5.500% 2/15/18 (Prere.) 4,000 4,033
Scioto County OH Hospital Facilities
Revenue (Southern Ohio Medical Center) 5.750% 2/15/18 (Prere.) 1,800 1,816
South-Western City OH School District GO 5.000% 12/1/36 1,700 1,899
Southeastern Ohio Port Authority Hospital
Facilities Revenue (Marietta Area Health
Care Inc. Obligated Group) 5.500% 12/1/29 1,000 1,093
Southeastern Ohio Port Authority Hospital
Facilities Revenue (Marietta Area Health
Care Inc. Obligated Group) 5.000% 12/1/35 1,125 1,174
Southwest Licking OH Local School District
School Facilities Construction &
Improvement GO 4.000% 11/1/34 500 540
Southwest Licking OH Local School District
School Facilities Construction &
Improvement GO 4.000% 11/1/42 4,650 4,911
Springboro OH Community City School
District GO 5.250% 12/1/32 (4) 1,050 1,306
Streetsboro OH City School District GO 5.250% 12/1/20 (Prere.) 1,965 2,171
Tallmadge OH City School District GO 4.000% 10/1/53 2,030 2,082
Toledo OH City School District GO 5.000% 12/1/28 4,730 5,461
Toledo OH Waterworks Revenue 5.000% 11/15/29 1,150 1,374
Toledo OH Waterworks Revenue 5.000% 11/15/37 3,125 3,631
Toledo OH Waterworks Revenue 5.000% 11/15/38 4,000 4,435
Toledo-Lucas County OH Port Authority
Student Housing Revenue (CHF-Toledo,
LLC - The University of Toledo Project) 5.000% 7/1/34 1,000 1,045
Toledo-Lucas County OH Port Authority
Student Housing Revenue (CHF-Toledo,
LLC - The University of Toledo Project) 5.000% 7/1/39 1,000 1,040
Tri Valley OH Local School District GO 5.500% 12/1/19 (14) 1,255 1,296
University of Akron Ohio General Receipts
Revenue 5.000% 1/1/26 (4) 6,980 7,443
University of Akron Ohio General Receipts
Revenue 5.000% 1/1/30 10 12
University of Akron Ohio General Receipts
Revenue 5.000% 1/1/33 2,000 2,300
University of Akron Ohio General Receipts
Revenue 5.000% 1/1/33 2,975 3,385
University of Cincinnati Ohio General
Receipts Revenue 5.000% 6/1/30 1,890 2,125
University of Cincinnati Ohio General
Receipts Revenue 5.000% 6/1/31 1,000 1,123
University of Cincinnati Ohio General
Receipts Revenue 5.000% 6/1/39 1,050 1,211
University of Cincinnati Ohio General
Receipts Revenue 5.000% 6/1/46 2,000 2,282
University of Cincinnati Ohio General
Receipts Revenue 5.000% 6/1/47 3,525 4,056
University of Toledo Ohio General
Receipts Revenue 5.000% 6/1/29 1,000 1,090
Face Market
Maturity Amount Value•
Coupon Date ($000) ($000)
28

Ohio Long-Term Tax-Exempt Fund
Warren County OH Health Care Facilities
Improvement Revenue (Otterbein Homes
Project) 4.000% 7/1/44 30 31
Warren County OH Health Care Facilities
Improvement Revenue (Otterbein Homes
Project) 5.000% 7/1/31 870 974
Warren County OH Health Care Facilities
Improvement Revenue (Otterbein Homes
Project) 5.750% 7/1/33 600 700
Warren County OH Health Care Facilities
Improvement Revenue (Otterbein Homes
Project) 5.000% 7/1/39 1,000 1,103
Warren County OH Health Care Facilities
Improvement Revenue (Otterbein Homes
Project) 5.500% 7/1/39 1,225 1,388
Westlake OH City School District GO 5.000% 12/1/29 1,505 1,782
Westlake OH City School District GO 5.000% 12/1/30 1,440 1,699
Westlake OH City School District GO 4.000% 12/1/43 5,400 5,669
Westlake OH Special Obligation Revenue
(American Greetings/Crocker Park Public
Improvement Project) 5.000% 12/1/30 1,350 1,597
Westlake OH Special Obligation Revenue
(American Greetings/Crocker Park Public
Improvement Project) 5.000% 12/1/32 1,395 1,642
Willoughby-Eastlake City OH School
District GO 5.000% 12/1/46 1,000 1,141
Winton Woods City OH School District GO 4.000% 11/1/53 2,000 2,031
Wood County OH Hospital Facilities
Revenue (Wood County Hospital) 5.000% 12/1/32 975 1,046
Wood County OH Hospital Facilities
Revenue (Wood County Hospital) 5.000% 12/1/42 2,500 2,643
Woodridge OH School District GO 5.000% 12/1/46 3,605 4,059
Woodridge OH School District GO 4.000% 12/1/50 4,020 4,143
Wright State University Ohio General
Revenue 5.000% 5/1/26 3,030 3,258
Wright State University Ohio General
Revenue 5.000% 5/1/31 3,350 3,572
1,193,589
Guam (0.4%)
Guam Government Business Privilege Tax
Revenue 5.000% 11/15/33 2,000 2,191
Guam Government Waterworks Authority
Water & Waste Water System Revenue 5.500% 7/1/43 2,300 2,572
4,763
Total Tax-Exempt Municipal Bonds (Cost $1,156,736) 1,198,352
Face Market
Maturity Amount Value•
Coupon Date ($000) ($000)
29

Ohio Long-Term Tax-Exempt Fund
Other Assets and Liabilities (-0.3%)
Other Assets
Investment in Vanguard 72
Receivables for Investment Securities Sold 8,432
Receivables for Accrued Income 15,563
Receivables for Capital Shares Issued 1,070
Variation Margin Receivable—Futures Contracts 51
Other Assets 129
Total Other Assets 25,317
Liabilities
Payables for Investment Securities Purchased (26,510)
Payables for Capital Shares Redeemed (319)
Payables for Distributions (869)
Payables to Vanguard (1,007)
Variation Margin Payable—Futures Contracts (117)
Other Liabilities (28)
Total Liabilities (28,850)
Net Assets (100%)
Applicable to 95,149,414 outstanding $.001 par value shares of
beneficial interest (unlimited authorization) 1,194,819
Net Asset Value Per Share $12.56
At November 30, 2017, net assets consisted of:
Amount
($000)
Paid-in Capital 1,147,239
Undistributed Net Investment Income 1
Accumulated Net Realized Gains 6,008
Unrealized Appreciation (Depreciation)
Investment Securities 41,616
Futures Contracts (45)
Net Assets 1,194,819
• See Note A in Notes to Financial Statements.
1 Security purchased on a when-issued or delayed-delivery basis for which the fund has not taken delivery as of November 30, 2017.
2 Security exempt from registration under Rule 144A of the Securities Act of 1933. Such securities may be sold in transactions exempt from registration, normally to qualified institutional buyers. At November 30, 2017, the value of this security represented 0.2% of net assets.
3 Securities with a value of $521,000 have been segregated as initial margin for open futures contracts.
A key to abbreviations and other references follows the Statement of Net Assets.
Amount
($000)
See accompanying Notes, which are an integral part of the Financial Statements.
30

Ohio Long-Term Tax-Exempt Fund
Key to Abbreviations
ARS—Auction Rate Security.
BAN—Bond Anticipation Note.
COP—Certificate of Participation.
CP—Commercial Paper.
FR—Floating Rate.
GAN—Grant Anticipation Note.
GO—General Obligation Bond.
PILOT—Payments in Lieu of Taxes.
PUT—Put Option Obligation.
RAN—Revenue Anticipation Note.
TAN—Tax Anticipation Note.
TOB—Tender Option Bond.
TRAN—Tax Revenue Anticipation Note.
VRDO—Variable Rate Demand Obligation.
VRDP—Variable Rate Demand Preferred.
(ETM)—Escrowed to Maturity.
(Prere.)—Prerefunded.
Scheduled principal and interest payments are guaranteed by:
(1) MBIA (Municipal Bond Investors Assurance).
(2) AMBAC (Ambac Assurance Corporation).
(3) FGIC (Financial Guaranty Insurance Company).
(4) AGM (Assured Guaranty Municipal Corporation).
(5) BIGI (Bond Investors Guaranty Insurance).
(6) Connie Lee Inc.
(7) FHA (Federal Housing Authority).
(8) CapMAC (Capital Markets Assurance Corporation).
(9) American Capital Access Financial Guaranty Corporation.
(10) XL Capital Assurance Inc.
(11) CIFG (CDC IXIS Financial Guaranty).
(12) AGC (Assured Guaranty Corporation).
(13) BHAC (Berkshire Hathaway Assurance Corporation).
(14) NPFG (National Public Finance Guarantee Corporation).
(15) BAM (Build America Mutual Assurance Company).
(16) MAC (Municipal Assurance Corporation).
(17) RAA (Radian Asset Assurance Inc.).
(18) SBLF (Michigan School Bond Loan Fund).
(19) TPSF (Texas Permanent School Fund).
The insurance does not guarantee the market value of the municipal bonds.
LOC—Scheduled principal and interest payments are guaranteed by bank letter of credit.
31

Ohio Long-Term Tax-Exempt Fund
Derivative Financial Instruments Outstanding as of Period End
Futures Contracts
($000)
Value and
Number of Unrealized
Long (Short) Notional Appreciation
Expiration Contracts Amount (Depreciation)
Long Futures Contracts
5-Year U.S. Treasury Note March 2018 146 16,986 (62)
2-Year U.S. Treasury Note March 2018 79 16,938 (12)
10-Year U.S. Treasury Note March 2018 135 16,746 (106)
30-Year U.S. Treasury Bond March 2018 12 1,821 —
(180)
Short Futures Contracts
Ultra 10-Year U.S. Treasury Note March 2018 (90) (11,985) 94
Ultra Long U.S. Treasury Bond March 2018 (29) (4,781) 41
135
(45)
Unrealized appreciation (depreciation) on open futures contracts is required to be treated as realized
gain (loss) for tax purposes.
See accompanying Notes, which are an integral part of the Financial Statements.
32

Year Ended
November 30, 2017
($000)
Investment Income
Income
Interest 38,756
Total Income 38,756
Expenses
The Vanguard Group—Note B
Investment Advisory Services 156
Management and Administrative 1,321
Marketing and Distribution 183
Custodian Fees 16
Auditing Fees 36
Shareholders’ Reports and Proxy 29
Trustees’ Fees and Expenses 1
Total Expenses 1,742
Net Investment Income 37,014
Realized Net Gain (Loss)
Investment Securities Sold 6,919
Futures Contracts (275)
Realized Net Gain (Loss) 6,644
Change in Unrealized Appreciation (Depreciation)
Investment Securities 28,106
Futures Contracts (45)
Change in Unrealized Appreciation (Depreciation) 28,061
Net Increase (Decrease) in Net Assets Resulting from Operations 71,719
Statement of Operations
Ohio Long-Term Tax-Exempt Fund
See accompanying Notes, which are an integral part of the Financial Statements.
33

Statement of Changes in Net Assets
Ohio Long-Term Tax-Exempt Fund
See accompanying Notes, which are an integral part of the Financial Statements.
Year Ended November 30,
2017 2016
($000) ($000)
Increase (Decrease) in Net Assets
Operations
Net Investment Income 37,014 36,114
Realized Net Gain (Loss) 6,644 5,875
Change in Unrealized Appreciation (Depreciation) 28,061 (40,291)
Net Increase (Decrease) in Net Assets Resulting from Operations 71,719 1,698
Distributions
Net Investment Income (36,996) (36,115)
Realized Capital Gain1 (4,999) (4,862)
Total Distributions (41,995) (40,977)
Capital Share Transactions
Issued 164,311 235,303
Issued in Lieu of Cash Distributions 29,925 27,781
Redeemed (160,553) (111,500)
Net Increase (Decrease) from Capital Share Transactions 33,683 151,584
Total Increase (Decrease) 63,407 112,305
Net Assets
Beginning of Period 1,131,412 1,019,107
End of Period2 1,194,819 1,131,412
1 Includes fiscal 2017 and 2016 short-term gain distributions totaling $1,381,000 and $0, respectively. Short-term gain distributions are treated as ordinary income dividends for tax purposes.
2 Net Assets—End of period includes undistributed (overdistributed) net investment income of $1,000 and ($1,000).
34

For a Share Outstanding Year Ended November 30,
Throughout Each Period 2017 2016 2015 2014 2013
Net Asset Value, Beginning of Period $12.23 $12.62 $12.63 $11.93 $12.96
Investment Operations
Net Investment Income .4011 .408 .427 .444 .454
Net Realized and Unrealized Gain (Loss)
on Investments .385 (.331) .055 .749 (1.003)
Total from Investment Operations .786 .077 .482 1.193 (.549)
Distributions
Dividends from Net Investment Income (.401) (.408) (.427) (.444) (.454)
Distributions from Realized Capital Gains (.055) (.059) (.065) (.049) (.027)
Total Distributions (.456) (.467) (.492) (.493) (.481)
Net Asset Value, End of Period $12.56 $12.23 $12.62 $12.63 $11.93
Total Return2 6.52% 0.51% 3.90% 10.19% -4.28%
Ratios/Supplemental Data
Net Assets, End of Period (Millions) $1,195 $1,131 $1,019 $965 $902
Ratio of Total Expenses to Average Net Assets 0.15% 0.15% 0.16% 0.16% 0.16%
Ratio of Net Investment Income to
Average Net Assets 3.20% 3.17% 3.39% 3.60% 3.69%
Portfolio Turnover Rate 34% 15% 21% 23% 28%
1 Calculated based on average shares outstanding.
2 Total returns do not include account service fees that may have applied in the periods shown. Fund prospectuses provide information about any applicable account service fees.
Financial Highlights
See accompanying Notes, which are an integral part of the Financial Statements.
Ohio Long-Term Tax-Exempt Fund
35

Notes to Financial Statements
Ohio Long-Term Tax-Exempt Fund
Vanguard Ohio Long-Term Tax-Exempt Fund is registered under the Investment Company Act of
1940 as an open-end investment company, or mutual fund. The fund invests in debt instruments of
municipal issuers whose ability to meet their obligations may be affected by economic and political
developments in the state.
A. The following significant accounting policies conform to generally accepted accounting principles
for U.S. investment companies. The fund consistently follows such policies in preparing its financial
statements.
1. Security Valuation: Securities are valued as of the close of trading on the New York Stock
Exchange (generally 4 p.m., Eastern time) on the valuation date. Bonds and temporary cash
investments are valued using the latest bid prices or using valuations based on a matrix system
(which considers such factors as security prices, yields, maturities, and ratings), both as furnished
by independent pricing services. Securities for which market quotations are not readily available, or
whose values have been affected by events occurring before the fund’s pricing time but after the
close of the securities’ primary markets, are valued by methods deemed by the board of trustees
to represent fair value.
2. Futures Contracts: The fund uses futures contracts to invest in fixed income asset classes with
greater efficiency and lower cost than is possible through direct investment, to add value when
these instruments are attractively priced, or to adjust sensitivity to changes in interest rates. The
primary risks associated with the use of futures contracts are imperfect correlation between
changes in market values of bonds held by the fund and the prices of futures contracts, and the
possibility of an illiquid market. Counterparty risk involving futures is mitigated because a regulated
clearinghouse is the counterparty instead of the clearing broker. To further mitigate counterparty
risk, the fund trades futures contracts on an exchange, monitors the financial strength of its clearing
brokers and clearinghouse, and has entered into clearing agreements with its clearing brokers. The
clearinghouse imposes initial margin requirements to secure the fund’s performance and requires
daily settlement of variation margin representing changes in the market value of each contract.
Futures contracts are valued at their quoted daily settlement prices. The notional amounts of
the contracts are not recorded in the Statement of Net Assets. Fluctuations in the value of the
contracts are recorded in the Statement of Net Assets as an asset (liability) and in the Statement
of Operations as unrealized appreciation (depreciation) until the contracts are closed, when they
are recorded as realized futures gains (losses).
During the year ended November 30, 2017, the fund’s average investments in long and short
futures contracts represented 3% and 1% of net assets, based on the average of the notional
amounts at each quarter-end during the period.
3. Federal Income Taxes: The fund intends to continue to qualify as a regulated investment
company and distribute all of its income. Management has analyzed the fund’s tax positions
taken for all open federal income tax years (November 30, 2014–2017), and has concluded
that no provision for federal income tax is required in the fund’s financial statements.
4. Distributions: Distributions from net investment income are declared daily and paid on the first
business day of the following month. Annual distributions from realized capital gains, if any, are
recorded on the ex-dividend date.
36

Ohio Long-Term Tax-Exempt Fund
5. Credit Facility: The fund and certain other funds managed by The Vanguard Group (“Vanguard”)
participate in a $3.1 billion committed credit facility provided by a syndicate of lenders pursuant to a
credit agreement that may be renewed annually; each fund is individually liable for its borrowings, if
any, under the credit facility. Borrowings may be utilized for temporary and emergency purposes,
and are subject to the fund’s regulatory and contractual borrowing restrictions. The participating
funds are charged administrative fees and an annual commitment fee of 0.10% of the undrawn
amount of the facility; these fees are allocated to the funds based on a method approved by the
fund’s board of trustees and included in Management and Administrative expenses on the fund’s
Statement of Operations. Any borrowings under this facility bear interest at a rate based upon the
higher of the one-month London Interbank Offered Rate, federal funds effective rate, or overnight
bank funding rate plus an agreed-upon spread.
The fund had no borrowings outstanding at November 30, 2017, or at any time during the period
then ended.
6. Other: Interest income is accrued daily. Premiums and discounts on debt securities purchased
are amortized and accreted, respectively, to interest income over the lives of the respective
securities. Security transactions are accounted for on the date securities are bought or sold.
Costs used to determine realized gains (losses) on the sale of investment securities are those
of the specific securities sold.
B. In accordance with the terms of a Funds’ Service Agreement (the “FSA”) between Vanguard
and the fund, Vanguard furnishes to the fund investment advisory, corporate management,
administrative, marketing, and distribution services at Vanguard’s cost of operations (as defined
by the FSA). These costs of operations are allocated to the fund based on methods and guidelines
approved by the board of trustees. Vanguard does not require reimbursement in the current period
for certain costs of operations (such as deferred compensation/benefits and risk/insurance costs);
the fund’s liability for these costs of operations is included in Payables to Vanguard on the
Statement of Net Assets.
Upon the request of Vanguard, the fund may invest up to 0.40% of its net assets as capital in
Vanguard. At November 30, 2017, the fund had contributed to Vanguard capital in the amount
of $72,000, representing 0.01% of the fund’s net assets and 0.03% of Vanguard’s capitalization.
The fund’s trustees and officers are also directors and employees, respectively, of Vanguard.
C. Various inputs may be used to determine the value of the fund’s investments. These inputs are
summarized in three broad levels for financial statement purposes. The inputs or methodologies
used to value securities are not necessarily an indication of the risk associated with investing in
those securities.
Level 1—Quoted prices in active markets for identical securities.
Level 2—Other significant observable inputs (including quoted prices for similar securities, interest
rates, prepayment speeds, credit risk, etc.).
Level 3—Significant unobservable inputs (including the fund’s own assumptions used to determine
the fair value of investments). Any investments valued with significant unobservable inputs are
noted on the Statement of Net Assets.
37

Ohio Long-Term Tax-Exempt Fund
The following table summarizes the market value of the fund’s investments as of November 30,
2017, based on the inputs used to value them:
Level 1 Level 2 Level 3
Investments ($000) ($000) ($000)
Tax-Exempt Municipal Bonds — 1,198,352 —
Futures Contracts—Assets1 51 — —
Futures Contracts—Liabilities1 (117) — —
Total (66) 1,198,352 —
1 Represents variation margin on the last day of the reporting period.
D. Capital gain distributions are determined on a tax basis and may differ from realized capital
gains for financial reporting purposes. Differences may be permanent or temporary. Permanent
differences are reclassified among capital accounts in the financial statements to reflect their tax
character. Temporary differences arise when gains or losses are recognized in different periods for
financial statement and tax purposes. These differences will reverse at some time in the future.
For tax purposes, at November 30, 2017, the fund had short-term and long-term capital gains of
$15,000 and $6,252,000, respectively, available for distribution. Short-term gain distributions are
treated as ordinary income dividends for tax purposes.
At November 30, 2017, the cost of investment securities for tax purposes was $1,157,040,000.
Net unrealized appreciation of investment securities for tax purposes was $41,312,000, consisting
of unrealized gains of $44,690,000 on securities that had risen in value since their purchase and
$3,378,000 in unrealized losses on securities that had fallen in value since their purchase.
E. During the year ended November 30, 2017, the fund purchased $408,156,000 of investment
securities and sold $371,914,000 of investment securities, other than temporary cash investments.
The fund purchased securities from and sold securities to other Vanguard funds or accounts
managed by Vanguard or its affiliates, in accordance with procedures adopted by the board of
trustees in compliance with Rule 17a-7 of the Investment Company Act of 1940. For the year
ended November 30, 2017, such purchases and sales were $184,274,000 and $183,570,000,
respectively; these amounts are included in the purchases and sales of investment securities
noted above.
38
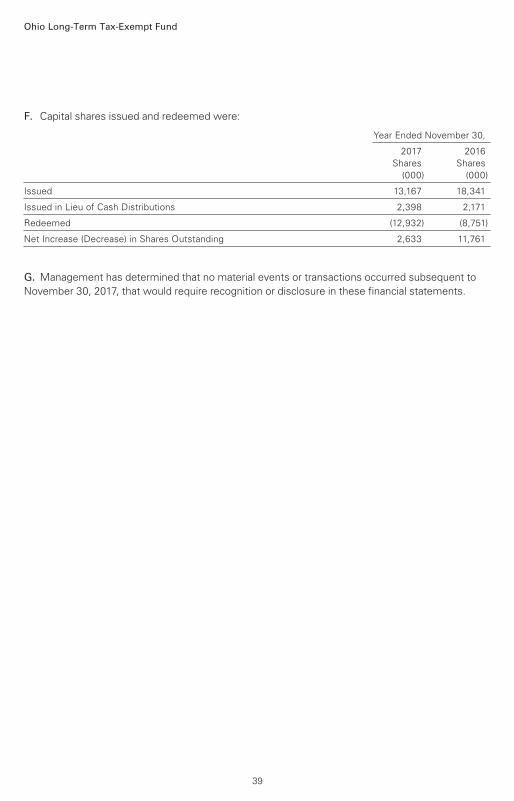
Ohio Long-Term Tax-Exempt Fund
F. Capital shares issued and redeemed were:
Year Ended November 30,
2017 2016
Shares Shares
(000) (000)
Issued 13,167 18,341
Issued in Lieu of Cash Distributions 2,398 2,171
Redeemed (12,932) (8,751)
Net Increase (Decrease) in Shares Outstanding 2,633 11,761
G. Management has determined that no material events or transactions occurred subsequent to
November 30, 2017, that would require recognition or disclosure in these financial statements.
39

To the Board of Trustees of Vanguard Ohio Tax-Free Funds and the Shareholders of Vanguard Ohio
Long-Term Tax-Exempt Fund
In our opinion, the accompanying statement of net assets and the related statements of operations
and of changes in net assets and the financial highlights present fairly, in all material respects, the
financial position of Vanguard Ohio Long-Term Tax-Exempt Fund (constituting Vanguard Ohio
Tax-Free Funds, hereafter referred to as the “Fund”) as of November 30, 2017, the results of its
operations for the year then ended, the changes in its net assets for each of the two years in the
period then ended and the financial highlights for each of the five years in the period then ended,
in conformity with accounting principles generally accepted in the United States of America. These
financial statements and financial highlights (hereafter referred to as “financial statements”) are
the responsibility of the Fund’s management. Our responsibility is to express an opinion on these
financial statements based on our audits. We conducted our audits of these financial statements in
accordance with the standards of the Public Company Accounting Oversight Board (United States).
Those standards require that we plan and perform the audit to obtain reasonable assurance about
whether the financial statements are free of material misstatement. An audit includes examining,
on a test basis, evidence supporting the amounts and disclosures in the financial statements,
assessing the accounting principles used and significant estimates made by management, and
evaluating the overall financial statement presentation. We believe that our audits, which included
confirmation of securities as of November 30, 2017 by correspondence with the custodian and
brokers, provide a reasonable basis for our opinion.
/s/PricewaterhouseCoopers LLP
Philadelphia, Pennsylvania
January 16, 2018
Report of Independent Registered Public Accounting Firm
Special 2017 tax information (unaudited) for Vanguard Ohio Long-Term Tax-Exempt Fund
This information for the fiscal year ended November 30, 2017, is included pursuant to provisions
of the Internal Revenue Code.
The fund designates 100% of its income dividends as exempt-interest dividends.
The fund distributed $3,814,000 as capital gain dividends (20% rate gain distributions) to
shareholders during the fiscal year.
40

About Your Fund’s Expenses
41
As a shareholder of the fund, you incur ongoing costs, which include costs for portfolio management,
administrative services, and shareholder reports (like this one), among others. Operating expenses,
which are deducted from a fund’s gross income, directly reduce the investment return of the fund.
A fund’s expenses are expressed as a percentage of its average net assets. This figure is known as
the expense ratio. The following examples are intended to help you understand the ongoing costs (in
dollars) of investing in your fund and to compare these costs with those of other mutual funds. The
examples are based on an investment of $1,000 made at the beginning of the period shown and held
for the entire period.
The accompanying table illustrates your fund’s costs in two ways:
• Based on actual fund return. This section helps you to estimate the actual expenses that you
paid over the period. The ”Ending Account Value“ shown is derived from the fund‘s actual return,
and the third column shows the dollar amount that would have been paid by an investor who started
with $1,000 in the fund. You may use the information here, together with the amount you invested,
to estimate the expenses that you paid over the period.
To do so, simply divide your account value by $1,000 (for example, an $8,600 account value divided
by $1,000 = 8.6), then multiply the result by the number given for your fund under the heading
”Expenses Paid During Period.“
• Based on hypothetical 5% yearly return. This section is intended to help you compare your
fund‘s costs with those of other mutual funds. It assumes that the fund had a yearly return of 5%
before expenses, but that the expense ratio is unchanged. In this case—because the return used is
not the fund’s actual return—the results do not apply to your investment. The example is useful in
making comparisons because the Securities and Exchange Commission requires all mutual funds to
calculate expenses based on a 5% return. You can assess your fund’s costs by comparing this
hypothetical example with the hypothetical examples that appear in shareholder reports of other
funds.
Note that the expenses shown in the table are meant to highlight and help you compare ongoingcosts only and do not reflect transaction costs incurred by the fund for buying and sellingsecurities. Further, the expenses do not include any purchase, redemption, or account servicefees described in the fund prospectus. If such fees were applied to your account, your costswould be higher. Your fund does not carry a “sales load.”
The calculations assume no shares were bought or sold during the period. Your actual costs may
have been higher or lower, depending on the amount of your investment and the timing of any
purchases or redemptions.
You can find more information about the fund’s expenses, including annual expense ratios, in the
Financial Statements section of this report. For additional information on operating expenses and
other shareholder costs, please refer to your fund’s current prospectus.

42
Six Months Ended November 30, 2017
Ohio Long-Term Tax-Exempt Fund
Beginning
Account Value
5/31/2017
Ending
Account Value
11/30/2017
Expenses
Paid During
Period
Based on Actual Fund Return $1,000.00 $1,012.01 $0.76
Based on Hypothetical 5% Yearly Return 1,000.00 1,024.32 0.76
The calculations are based on expenses incurred in the most recent six-month period. The fund’s annualized six-month expense ratio forthat period is 0.15%. The dollar amounts shown as “Expenses Paid” are equal to the annualized expense ratio multiplied by the averageaccount value over the period, multiplied by the number of days in the most recent six-month period, then divided by the number of days inthe most recent 12-month period (183/365).

Glossary
43
30-Day SEC Yield. A fund’s 30-day SEC yield is derived using a formula specified by the U.S.
Securities and Exchange Commission. Under the formula, data related to the fund’s security
holdings in the previous 30 days are used to calculate the fund’s hypothetical net income for that
period, which is then annualized and divided by the fund’s estimated average net assets over the
calculation period. For the purposes of this calculation, a security’s income is based on its current
market yield to maturity (for bonds), its actual income (for asset-backed securities), or its
projected dividend yield (for stocks). Because the SEC yield represents hypothetical annualized
income, it will differ—at times significantly—from the fund’s actual experience. As a result, the
fund’s income distributions may be higher or lower than implied by the SEC yield.
Average Coupon. The average interest rate paid on the fixed income securities held by a fund. It
is expressed as a percentage of face value.
Average Duration. An estimate of how much the value of the bonds held by a fund will fluctuate
in response to a change in interest rates. To see how the value could change, multiply the
average duration by the change in rates. If interest rates rise by 1 percentage point, the value of
the bonds in a fund with an average duration of five years would decline by about 5%. If rates
decrease by a percentage point, the value would rise by 5%.
Average Stated Maturity. The average length of time until fixed income securities held by a fund
reach maturity and are repaid using the maturity date of the security. The figure reflects the
proportion of fund assets represented by each security; it also reflects any futures contracts held.
In general, the longer the average stated maturity, the more a fund’s share price will fluctuate in
response to changes in market interest rates.
Average Weighted Maturity. The average length of time until fixed income securities held by a
fund reach maturity and are repaid. The figure reflects the proportion of fund assets represented
by each security.
Beta. A measure of the magnitude of a fund’s past share-price fluctuations in relation to the ups
and downs of a given market index. The index is assigned a beta of 1.00. Compared with a given
index, a fund with a beta of 1.20 typically would have seen its share price rise or fall by 12%
when the index rose or fell by 10%. For this report, beta is based on returns over the past 36
months for both the fund and the index. Note that a fund’s beta should be reviewed in conjunction
with its R-squared (see definition). The lower the R-squared, the less correlation there is between
the fund and the index, and the less reliable beta is as an indicator of volatility.
Credit Quality. Credit-quality ratings are measured on a scale that generally ranges from AAA
(highest) to D (lowest). Credit-quality ratings are obtained from Moody’s and S&P, and the higher
rating for each issue is used. ”Not Rated” is used to classify securities for which a rating is not
available. Not rated securities include a fund’s investment in Vanguard Market Liquidity Fund or
Vanguard Municipal Cash Management Fund, each of which invests in high-quality money market
instruments and may serve as a cash management vehicle for the Vanguard funds, trusts, and
accounts.
Expense Ratio. A fund’s total annual operating expenses expressed as a percentage of the fund’s
average net assets. The expense ratio includes management and administrative expenses, but
does not include the transaction costs of buying and selling portfolio securities.

44
Inception Date. The date on which the assets of a fund (or one of its share classes) are first
invested in accordance with the fund’s investment objective. For funds with a subscription period,
the inception date is the day after that period ends. Investment performance is measured from
the inception date.
R-Squared. A measure of how much of a fund’s past returns can be explained by the returns
from the market in general, as measured by a given index. If a fund’s total returns were precisely
synchronized with an index’s returns, its R-squared would be 1.00. If the fund’s returns bore no
relationship to the index’s returns, its R-squared would be 0. For this report, R-squared is based
on returns over the past 36 months for both the fund and the index.
Short-Term Reserves. The percentage of a fund invested in highly liquid, short-term securities
that can be readily converted to cash.
Yield to Maturity. The rate of return an investor would receive if the fixed income securities held
by a fund were held to their maturity dates.

BLOOMBERG is a trademark and service mark of Bloomberg Finance L.P. BARCLAYS is a trademark and service mark
of Barclays Bank Plc, used under license. Bloomberg Finance L.P. and its affiliates, including Bloomberg Index Services
Limited (BISL) (collectively, Bloomberg), or Bloomberg’s licensors, own all proprietary rights in the Bloomberg Barclays
OH Municipal Bond Index (Index or Bloomberg Barclays Index).
Neither Barclays Bank Plc, Barclays Capital Inc., or any affiliate (collectively Barclays) or Bloomberg is the issuer or
producer of the Ohio Long-Term Tax-Exempt Fund and neither Bloomberg nor Barclays has any responsibilities, obligations
or duties to investors in the Ohio Long-Term Tax-Exempt Fund. The Index is licensed for use by The Vanguard Group, Inc.
(Vanguard) as the sponsor of the Ohio Long-Term Tax-Exempt Fund. Bloomberg and Barclays’ only relationship with
Vanguard in respect of the Index is the licensing of the Index, which is determined, composed and calculated by BISL,
or any successor thereto, without regard to the Issuer or the Ohio Long-Term Tax-Exempt Fund or the owners of the
Ohio Long-Term Tax-Exempt Fund.
Additionally, Vanguard may for itself execute transaction(s) with Barclays in or relating to the Index in connection
with the Ohio Long-Term Tax-Exempt Fund. Investors acquire the Ohio Long-Term Tax-Exempt Fund from Vanguard and
investors neither acquire any interest in the Index nor enter into any relationship of any kind whatsoever with Bloomberg
or Barclays upon making an investment in the Ohio Long-Term Tax-Exempt Fund. The Ohio Long-Term Tax-Exempt Fund
is not sponsored, endorsed, sold or promoted by Bloomberg or Barclays. Neither Bloomberg nor Barclays makes any
representation or warranty, express or implied regarding the advisability of investing in the Ohio Long-Term Tax-Exempt
Fund or the advisability of investing in securities generally or the ability of the Index to track corresponding or relative
market performance. Neither Bloomberg nor Barclays has passed on the legality or suitability of the Ohio Long-Term
Tax-Exempt Fund with respect to any person or entity. Neither Bloomberg nor Barclays is responsible for and has not
participated in the determination of the timing of, prices at, or quantities of the Ohio Long-Term Tax-Exempt Fund to be
issued. Neither Bloomberg nor Barclays has any obligation to take the needs of the Issuer or the owners of the Ohio
Long-Term Tax-Exempt Fund or any other third party into consideration in determining, composing or calculating the Index.
Neither Bloomberg nor Barclays has any obligation or liability in connection with administration, marketing or trading of
the Ohio Long-Term Tax-Exempt Fund.
45

The licensing agreement between Bloomberg and Barclays is solely for the benefit of Bloomberg and Barclays and not for
the benefit of the owners of the Ohio Long-Term Tax-Exempt Fund, investors or other third parties. In addition, the licensing
agreement between Vanguard and Bloomberg is solely for the benefit of Vanguard and Bloomberg and not for the benefit
of the owners of the Ohio Long-Term Tax-Exempt Fund, investors or other third parties.
NEITHER BLOOMBERG NOR BARCLAYS SHALL HAVE ANY LIABILITY TO THE ISSUER, INVESTORS OR TO OTHER THIRD
PARTIES FOR THE QUALITY, ACCURACY AND/OR COMPLETENESS OF THE BLOOMBERG BARCLAYS INDEX OR ANY
DATA INCLUDED THEREIN OR FOR INTERRUPTIONS IN THE DELIVERY OF THE BLOOMBERG BARCLAYS INDEX. NEITHER
BLOOMBERG NOR BARCLAYS MAKES ANY WARRANTY, EXPRESS OR IMPLIED, AS TO RESULTS TO BE OBTAINED BY
THE ISSUER, THE INVESTORS OR ANY OTHER PERSON OR ENTITY FROM THE USE OF THE BLOOMBERG BARCLAYS
INDEX OR ANY DATA INCLUDED THEREIN. NEITHER BLOOMBERG NOR BARCLAYS MAKES ANY EXPRESS OR IMPLIED
WARRANTIES, AND EACH HEREBY EXPRESSLY DISCLAIMS ALL WARRANTIES OF MERCHANTABILITY OR FITNESS FOR
A PARTICULAR PURPOSE OR USE WITH RESPECT TO THE BLOOMBERG BARCLAYS INDEX OR ANY DATA INCLUDED
THEREIN. BLOOMBERG RESERVES THE RIGHT TO CHANGE THE METHODS OF CALCULATION OR PUBLICATION, OR
TO CEASE THE CALCULATION OR PUBLICATION OF THE BLOOMBERG BARCLAYS INDEX, AND NEITHER BLOOMBERG
NOR BARCLAYS SHALL BE LIABLE FOR ANY MISCALCULATION OF OR ANY INCORRECT, DELAYED OR INTERRUPTED
PUBLICATION WITH RESPECT TO ANY OF THE BLOOMBERG BARCLAYS INDEX. NEITHER BLOOMBERG NOR
BARCLAYS SHALL BE LIABLE FOR ANY DAMAGES, INCLUDING, WITHOUT LIMITATION, ANY SPECIAL, INDIRECT
OR CONSEQUENTIAL DAMAGES, OR ANY LOST PROFITS AND EVEN IF ADVISED OF THE POSSIBLITY OF SUCH,
RESULTING FROM THE USE OF THE BLOOMBERG BARCLAYS INDEX OR ANY DATA INCLUDED THEREIN OR WITH
RESPECT TO THE OHIO LONG-TERM TAX-EXEMPT FUND.
None of the information supplied by Bloomberg or Barclays and used in this publication may be reproduced in any manner
without the prior written permission of both Bloomberg and Barclays Capital, the investment banking division of Barclays
Bank Plc. Barclays Bank Plc is registered in England No. 1026167. Registered office 1 Churchill Place London E14 5HP.
© 2017 Bloomberg. Used with Permission.
Source: Bloomberg Index Services Limited. Copyright 2017, Bloomberg. All rights reserved.
46

The People Who Govern Your Fund
The trustees of your mutual fund are there to see that the fund is operated and managed in your
best interests since, as a shareholder, you are a part owner of the fund. Your fund’s trustees also
serve on the board of directors of The Vanguard Group, Inc., which is owned by the Vanguard
funds and provides services to them on an at-cost basis.
A majority of Vanguard’s board members are independent, meaning that they have no affiliation
with Vanguard or the funds they oversee, apart from the sizable personal investments they have
made as private individuals. The independent board members have distinguished backgrounds
in business, academia, and public service. Each of the trustees and executive officers oversees
201 Vanguard funds.
Information for each trustee and executive officer of the fund appears below. The mailing address
of the trustees and officers is P.O. Box 876, Valley Forge, PA 19482. More information about the
trustees is in the Statement of Additional Information, which can be obtained, without charge,
by contacting Vanguard at 800-662-7447, or online at vanguard.com.
Interested Trustee1
F. William McNabb III
Born 1957. Trustee Since July 2009. Chairman
of the Board. Principal Occupation(s) During the
Past Five Years and Other Experience: Chairman
of the Board of The Vanguard Group, Inc., and
of each of the investment companies served by
The Vanguard Group, since January 2010; Chief
Executive Officer and Director of The Vanguard
Group and President and Chief Executive Officer
of each of the investment companies served by
The Vanguard Group, since 2008; Director of
Vanguard Marketing Corporation; President of
The Vanguard Group (2008–2017); Managing
Director of The Vanguard Group (1995–2008).
Independent Trustees
Emerson U. Fullwood
Born 1948. Trustee Since January 2008. Principal
Occupation(s) During the Past Five Years and Other
Experience: Executive Chief Staff and Marketing
Officer for North America and Corporate Vice
President (retired 2008) of Xerox Corporation
(document manage ment products and services);
Executive in Residence and 2009–2010
Distinguished Minett Professor at the Rochester
Institute of Technology; Lead Director of SPX
FLOW, Inc. (multi-industry manufacturing);
Director of the United Way of Rochester, the
University of Rochester Medical Center, Monroe
Community College Foundation, North Carolina
A&T University, and Roberts Wesleyan College;
Trustee of the University of Rochester.
Rajiv L. Gupta
Born 1945. Trustee Since December 2001.2
Principal Occupation(s) During the Past Five
Years and Other Experience: Chairman and
Chief Executive Officer (retired 2009) and
President (2006–2008) of Rohm and Haas Co.
(chemicals); Director of Arconic Inc. (diversified
manufacturer), HP Inc. (printer and personal
computer manufacturing), and Delphi Automotive
plc (automotive components); Senior Advisor at
New Mountain Capital.
Amy Gutmann
Born 1949. Trustee Since June 2006. Principal
Occupation(s) During the Past Five Years and
Other Experience: President of the University
of Pennsylvania; Christopher H. Browne
1 Mr. McNabb is considered an “interested person,” as defined in the Investment Company Act of 1940, because he is an officer of the Vanguard funds.
2 December 2002 for Vanguard Equity Income Fund, the Vanguard Municipal Bond Funds, and the Vanguard State Tax-Exempt Funds.

Distinguished Professor of Political Science,
School of Arts and Sciences, and Professor
of Communication, Annenberg School for
Communication, with secondary faculty appoint-
ments in the Department of Philosophy, School
of Arts and Sciences, and at the Graduate School
of Education, University of Pennsylvania; Trustee
of the National Constitution Center.
JoAnn Heffernan Heisen
Born 1950. Trustee Since July 1998. Principal
Occupation(s) During the Past Five Years and
Other Experience: Corporate Vice President
and Member of the Executive Committee
(1997–2008), Chief Global Diversity Officer
(retired 2008), Vice President and Chief
Information Officer (1997–2006), Controller
(1995–1997), Treasurer (1991–1995), and
Assistant Treasurer (1989–1991) of Johnson
& Johnson (pharmaceuticals/medical devices/
consumer products); Director of Skytop Lodge
Corporation (hotels) and the Robert Wood
Johnson Foundation; Member of the Advisory
Board of the Institute for Women’s Leadership
at Rutgers University.
F. Joseph Loughrey
Born 1949. Trustee Since October 2009.
Principal Occupation(s) During the Past Five
Years and Other Experience: President and Chief
Operating Officer (retired 2009) of Cummins Inc.
(industrial machinery); Chairman of the Board of
Hillenbrand, Inc. (specialized consumer services),
Oxfam America, and the Lumina Foundation for
Education; Director of the V Foundation for
Cancer Research; Member of the Advisory
Council for the College of Arts and Letters
and Chair of the Advisory Board to the Kellogg
Institute for International Studies, both at the
University of Notre Dame.
Mark Loughridge
Born 1953. Trustee Since March 2012. Principal
Occupation(s) During the Past Five Years and
Other Experience: Senior Vice President and
Chief Financial Officer (retired 2013) at IBM
(information technology services); Fiduciary
Member of IBM’s Retirement Plan Committee
(2004–2013); Member of the Council on
Chicago Booth.
Scott C. Malpass
Born 1962. Trustee Since March 2012. Principal
Occupation(s) During the Past Five Years and
Other Experience: Chief Investment Officer and
Vice President at the University of Notre Dame;
Assistant Professor of Finance at the Mendoza
College of Business at Notre Dame; Member of
the Notre Dame 403(b) Investment Committee,
the Board of Advisors for Spruceview Capital
Partners, the Board of Catholic Investment
Services, Inc. (investment advisor), and the
Board of Superintendence of the Institute for
the Works of Religion; Chairman of the Board of
TIFF Advisory Services, Inc. (investment advisor).
André F. Perold
Born 1952. Trustee Since December 2004.
Principal Occupation(s) During the Past Five Years
and Other Experience: George Gund Professor of
Finance and Banking, Emeritus at the Harvard
Business School (retired 2011); Chief Investment
Officer and Co-Managing Partner of HighVista
Strategies LLC (private investment firm);
Overseer of the Museum of Fine Arts Boston.
Peter F. Volanakis
Born 1955. Trustee Since July 2009. Principal
Occupation(s) During the Past Five Years and
Other Experience: President and Chief Operating
Officer (retired 2010) of Corning Incorporated
(communications equipment); Chairman of the
Board of Trustees of Colby-Sawyer College;
Member of the Board of Hypertherm, Inc.
(industrial cutting systems, software, and
consumables).

Executive Officers
Glenn Booraem
Born 1967. Investment Stewardship Officer Since
February 2017. Principal Occupation(s) During the
Past Five Years and Other Experience: Principal of
The Vanguard Group, Inc.; Treasurer (2015–2017),
Controller (2010–2015), and Assistant Controller
(2001–2010) of each of the investment companies
served by The Vanguard Group.
Christine M. Buchanan
Born 1970. Treasurer Since November 2017.
Principal Occupation(s) During the Past Five Years
and Other Experience: Principal of The Vanguard
Group, Inc.; Treasurer of each of the investment
companies served by The Vanguard Group;
Global Head of Vanguard Fund Administration
at The Vanguard Group; Partner at KPMG LLP
(2005–2017).
Thomas J. Higgins
Born 1957. Chief Financial Officer Since
September 2008. Principal Occupation(s) During
the Past Five Years and Other Experience: Principal
of The Vanguard Group, Inc.; Chief Financial Officer
of each of the investment companies served by
The Vanguard Group; Treasurer of each of the
investment companies served by The Vanguard
Group (1998–2008).
Peter Mahoney
Born 1974. Controller Since May 2015. Principal
Occupation(s) During the Past Five Years and
Other Experience: Principal of The Vanguard
Group, Inc.; Controller of each of the investment
companies served by The Vanguard Group; Head
of International Fund Services at The Vanguard
Group (2008–2014).
Anne E. Robinson
Born 1970. Secretary Since September 2016.
Principal Occupation(s) During the Past Five Years
and Other Experience: Managing Director of The
Vanguard Group, Inc.; General Counsel of The
Vanguard Group; Secretary of The Vanguard Group
and of each of the investment companies served
by The Vanguard Group; Director and Senior Vice
President of Vanguard Marketing Corporation;
Managing Director and General Counsel of Global
Cards and Consumer Services at Citigroup
(2014–2016); Counsel at American Express
(2003–2014).
Michael Rollings
Born 1963. Finance Director Since November 2017.
Principal Occupation(s) During the Past Five Years
and Other Experience: Managing Director of
The Vanguard Group, Inc.; Director of Vanguard
Marketing Corporation; Treasurer of each of the
investment companies served by The Vanguard
Group (February 2017–November 2017); Executive
Vice President and Chief Financial Officer of
MassMutual Financial Group (2006–2016).
Vanguard Senior Management Team
Mortimer J. Buckley Chris D. McIsaac
Gregory Davis James M. Norris
John James Thomas M. Rampulla
Martha G. King Karin A. Risi
John T. Marcante
Chairman Emeritus and Senior Advisor
John J. Brennan
Chairman, 1996–2009
Chief Executive Officer and President, 1996–2008
Founder
John C. Bogle
Chairman and Chief Executive Officer, 1974–1996

P.O. Box 2600
Valley Forge, PA 19482-2600
Connect with Vanguard® > vanguard.com
Fund Information > 800-662-7447
Direct Investor Account Services > 800-662-2739
Institutional Investor Services > 800-523-1036
Text Telephone for PeopleWho Are Deaf or Hard of Hearing > 800-749-7273
This material may be used in conjunctionwith the offering of shares of any Vanguardfund only if preceded or accompanied bythe fund’s current prospectus.
All comparative mutual fund data are from Lipper, aThomson Reuters Company, or Morningstar, Inc., unlessotherwise noted.
You can obtain a free copy of Vanguard’s proxy votingguidelines by visiting vanguard.com/proxyreporting or bycalling Vanguard at 800-662-2739. The guidelines arealso available from the SEC’s website, sec.gov. Inaddition, you may obtain a free report on how your fundvoted the proxies for securities it owned during the 12months ended June 30. To get the report, visit eithervanguard.com/proxyreporting or sec.gov.
You can review and copy information about your fund atthe SEC’s Public Reference Room in Washington, D.C. Tofind out more about this public service, call the SEC at202-551-8090. Information about your fund is alsoavailable on the SEC’s website, and you can receivecopies of this information, for a fee, by sending arequest in either of two ways: via email addressed [email protected] or via regular mail addressed to thePublic Reference Section, Securities and ExchangeCommission, Washington, DC 20549-1520.
CFA® is a registered trademark owned by CFA Institute.
© 2018 The Vanguard Group, Inc.All rights reserved.Vanguard Marketing Corporation, Distributor.
Q960 012018