vam bulletin 21 - lgc group science/nmi landing p… · gm food testing valid measurements ......
TRANSCRIPT

UK Analytical Partnership
A comparison of contaminated soil data
VAM in the environmental sector
Turning a negative into a positive: GM food testing
Valid measurements of stratosphericcomposition
A n L G C p u b l i c a t i o n i n s u p p o r t o f t h e N a t i o n a l M e a s u r e m e n t S y s t e m I s s u e N º 2 1 A u t u m n 1 9 9 9
VAM BULLETIN

Editor’s note
Contents
2 V A M B U L L E T I N
E D I T O R ’ S N O T E A N D C O N T E N T S
Cover photograph by Andrew Brookes
Alison GillespieEditor020 8943 7563
General enquiries about VAM to:VAM Helpdesk 020 8943 7393
LGC’s address:LGCQueens RoadTeddingtonMiddlesex TW11 0LY
The DTI VAM programme:
The DTI’s programme on ValidAnalytical Measurement (VAM) is anintegral part of the UK NationalMeasurement System. The VAMprogramme aims to help analyticallaboratories demonstrate the validity oftheir data and to facilitate mutualrecognition of the results of analyticalmeasurements.
The VAM programme sets out thefollowing six principles of good analyticalpractice, backed up by technical supportand management guidance, to enablelaboratories to deliver reliable resultsconsistently and thereby improveperformance.
1. Analytical measurements should bemade to satisfy an agreed requirement.
2. Analytical measurements should bemade using methods and equipmentwhich have been tested to ensure theyare fit for their purpose.
3. Staff making analytical measurementsshould be both qualified and competentto undertake the task.
4. There should be a regular independentassessment of the technical performanceof a laboratory.
5. Analytical measurements made in onelocation should be consistent with thoseelsewhere.
6. Organisations making analyticalmeasurements should have well definedquality control and quality assuranceprocedures.
Editorial
UK Analytical Partnership ..................3
Guest column
A comparison of contaminated
soil data .............................................4
Focus on sectors
VAM in the environmental sector........6
Contributed articles
Turning a negative into a positive:
GM food testing ...............................10
The analysis of metal speciation
using LC-MS ...................................13
Putting the quality into
air quality measurements...................18
Valid measurements of
stratospheric composition..................21
Case study
VAM in the chemical
standards industry ............................25
Statistics in context
Measurement uncertainty and cause and effect analysis ....................28
VAM in education
Teaching chemistry today .................32
Schools PT competition....................33
Reference materials update ................34
VAM news
VAM 2000-03 ..................................34
PT for out-of-laboratory measurements of contaminated land ............................35
VAM products and services.................36
Chemical nomenclature
How to confuse people......................38
Forthcoming events .............................39
Contact points......................................40
Welcome to VAM Bulletin 21.This edition includes four articles with an
environmental analysis theme. The ‘Focus onsectors’ section describes a market research studyexamining the perceptions of analysis of allparties involved in the investigation ofcontaminated land, from the producers ofanalytical data to the users of data such asinsurers and investors.
Our editorial outlines the UK AnalyticalPartnership, a networked organisation aiming toimprove analytical science in the UK. UKAPrepresents an alliance between key stakeholdersfrom industry, academia, research councils and
government. Strategic priorities in the areas of innovation, skills and regulation andcompetitiveness will be addressed.
I would like to thank all readers of theBulletin who have returned the questionnairewhich was sent to you with the last Bulletin.This has enabled us to update our records andensure that you continue to receive your personalcopy of the VAM Bulletin. If you have notreceived a questionnaire please contact the VAMHelpdesk.
I would like to thank the authors for theircontributions to this issue which I hope you willenjoy reading.

UK Analytical Partnership
3 V A M B U L L E T I N
E D I T O R I A L
Peter Lyne,LGC
Analytical science in the UK is laggingbehind” – this was one of the conclu-
sions made by the Chemicals Panel in thefirst round of the national Foresight exercise.When an important technology-based sector(which employs around 200,000 Britons andhas an annual turnover estimated at some £7 billion) is highlighted in this way, theremust be an opportunity to do better.
Although a number of initiatives havetried to address the issue, the mostpromising has evolved from a studycommissioned by DTI ChemicalsDirectorate in 1998. The study, conductedby the BLMS consultancy consortium,collected views from across the supplier anduser-base for analysis, looking at the currentstate of the discipline and sector, withpossible routes to improvement. The reportpresented a structured view of the analyticalscience environment and highlightedchanging practices and cultures within andbeyond that environment which need to betaken into account for the future. In movingtowards firm recommendations for action,the final report steered away from theinevitable elements of whinging in favour ofa more forward-looking and positiveplatform for bringing about significantimprovements.
The ‘analytical community’ are adisparate group. Practitioners are active inmany industrial and public sectors, inacademia, in a wide array of contractanalysis and instrument suppliers, and asindividual consultants. The first recom-mendation of the BLMS report was that it is only possible to engage such a broadcommunity through an initiative based onopen networking. Achieving this will be aconsiderable challenge. Inevitably, opennetworks have to be ‘grown’. This processrelies on a small number of willing andenthusiastic individuals who can be broughttogether to ‘seed’ the process (a SteeringNetwork – which was the second recommen-dation of the report). This network mustsign up to terms of reference based on visionand commitment. Members must take amore strategic view than has been taken in
the past and have the capacity to identifyperformance measures and track progressagainst strategic goals based on key priorities(the third recommendation). The over-arching vision is to make the UK move from aposition where we are ‘lagging behind’ in globalterms to one where we become ‘world class’.
there is wide agreement on the need for better co-ordination of the
analytical supply chain
In view of the breadth of the world ofanalysis, it is valuable to identify the themeswhich are key to analytical science making adifference to the UK economy. The BLMSreport suggested the areas of Innovation,Skills Development and Regulation &Competitiveness for individual AdvisoryNetworks. These will work closely with theSteering Network, identifying priority topicsfor action and the means to deliver them(recommendation four). In order to providethe open and inclusive network environmentrequired to inform and deliver againstpriority areas, the four highlighted networksmust develop effective interfaces to a widecommunity, providing project teams forimplementation and networks to allowregular feedback on activities and progress.In doing this, it is important to include manycontacts beyond the traditional analyticalcommunity (recommendation five). Theresulting networked organisation was namedthe UK Analytical Partnership (UKAP).
The package of recommendations wasrolled out at a workshop held in November1998, attended by representatives ofindustry (large and small, users andsuppliers of analysis), academia, the supplybase, consultants, research councils,societies and associations, and government.A resource map was constructed to provide astock-take of current initiatives, activitiesand resources of current relevance to theworld of analysis; this alone revealed themagnitude of activity and resource alreadybeing invested in the ‘analytical industry’and the need for better co-ordination andinformation. Syndicates then had an initialattempt to identify strategic priority areas ineach of the themes, leading to initial terms ofreference and launch agendas for each of thefour core networks. A mechanism for
populating the core organisation was put inplace and all networks are now active andcommitted to make the changes required tomove analysis in the UK from ‘lagging’ to‘world class’.
In UKAP’s early days, there is not (yet) aformal action plan. However there is wideagreement on the need for better co-ordination of the analytical supply chain, inthe provision and exploitation of high calibrescience, the development and continuousimprovement of skilled analytical scientists,the effective underpinning by good science ofresponses to regulatory demands and the‘pull-through’ of the analytical productbehind enhancing the competitiveness of UKindustry. With the second phase of thenational Foresight process now under way, itis both timely and appropriate for UKAP toalign itself closely with the Foresight processand infrastructure. To this end, it isanticipated that UKAP will be established asa formal Associate Programme, contributingto the Foresight Knowledge Pool andbenefiting from the wider networks availablethrough the process.
While new funding is not available tounderpin the UKAP initiative, DTI and theAnalytical Division of The Royal Society ofChemistry have both pledged their support.Each will sponsor the work of four networkco-ordinators, who will provide the dynamic‘glue’ for the core network organisation.Their names and contact details are:
Steering Group Network Co-ordinator:Peter Lyne, LGC020 8943 7316 [email protected]
Innovation Advisory Group Network Co-ordinator:David Ferguson, consultant to RSC020 7440 [email protected]
Skills Advisory Group Network Co-ordinator:Brian Woodget, consultant to RSC01438 [email protected]
Regulation & Competitiveness AdvisoryGroup Network Co-ordinator:Peter Frier, LGC020 8943 [email protected]
“

HazelDavidson,GeochemGroup Ltd
Background
EAGLE (Environmental Analysis Groupfor Laboratory Excellence) was formed
in June 1996 in conjunction with theNational Measurement System Directorateof the DTI to enable the department to haveaccess to peer groups of commercialanalytical laboratories in different marketsectors. The laboratories chosen, in additionto being privately owned, had also to besignificant providers of third party analyticalservices and, specifically, should not beprincipally research laboratories. Theobjective of the group is to aid the DTI inimproving the quality of laboratory data byassisting with the development of methods,commenting on matters pertaining tolaboratory quality and testing referencematerials. Similar groups have been set upfor food laboratories (FALCON) and formedical laboratories (MERLIN).
The organisations currently participatingin EAGLE are:
Analytical & Environmental Services
AlControl
Chemex International
Bodycote Altech
Cleanaway
East of Scotland Water
Geochem Group
SAL
Hyder Environmental
Severn Trent Laboratories
Robertson Laboratories
Thames Water – WQC
When analysing soil samples for therange of parameters commonly found incontaminated land, it is generally agreed thatthe results obtained are dependent upon themethods of analysis used. Currently,methods are not specified in the UK, andtherefore considerable variation in resultscan occur between laboratories, even thoughthey may be using accredited methods.
The above laboratories all participate inproficiency testing schemes, and this group,plus many other laboratories and scientists,have voiced their concern regarding theapparent lack of improvement in the spread ofdata for soils analysis being reported by themany laboratories involved within theschemes. It was decided, amongst the EAGLEmembers, that they would compare their datawith each other in an attempt to discover thecauses of this spread, and to suggest ways ofnarrowing the range of results.
It quickly became apparent that smallvariations in methodology caused significantdifferences in the data, and once theEAGLE laboratories had agreed on acommon method for a particular parameter,a marked reduction in the spread of resultswas achieved.
Discussion of data
The EAGLE data from one round of
CONTEST were plotted as simple line graphs,
and superimposed upon these is a range of data
from other laboratories participating within the
CONTEST scheme. As over seventy labora-
tories take part in the testing, which would be
difficult to display graphically, it was decided
to select the ten worst Z-scores and the ten
best Z-scores to plot against the EAGLE
data. These graphs and the data sets for four
parameters are reproduced with this article.
4 V A M B U L L E T I N
G U E S T C O L U M N
A comparison of contaminated soil data
Figure 1: Zinc in prepared soil
Figure 2: Arsenic in prepared soil
LAB EAGLE CONTEST1 120 1332 136 1383 141 1324 138 1785 139 866 122 2377 125 1308 103 1019 101 191
10 118 12611 13912 43013 16914 13115 10616 13817 11718 16919 13620 140
MEAN 124 156RANGE 101–141 86–430
LAB EAGLE CONTEST1 14 142 16 03 20 164 15 135 13 256 14 237 13 148 14 159 16 8
10 16 1411 2112 1713 714 1115 1016 1417 918 619 1420 0
MEAN 15.1 12.6RANGE 13–20 0–25

5 V A M B U L L E T I N
G U E S T C O L U M N
Zinc
This metal should be one of the easierparameters to analyse spectropho-tometrically, either by AAS or ICP, andevidence from analysis of standard solutionsdoes confirm that the majority oflaboratories perform adequately in terms ofinstrumentation methods. The large spreadof results (Figure 1) appears to arise fromthe different extraction methods used tosolubilise the metals in the soil samples. Forexample, the original composition of aquaregia in the different laboratories variedbetween 1:1 and 1:3 nitric to hydrochloricacid, and an acid to soil ratio ranging from 1 in 7 to 1 in 30. The range of data from theEAGLE laboratories (101 – 141) is muchcloser than the range from the otherlaboratories (86 – 430).
Arsenic
This element is much more difficult toanalyse, due to the poor signal tobackground ratio at the relevant wave-lengths. Therefore variation in extractionefficiency is compounded by variation in
accuracy of measurement technique in theother laboratories, although the EAGLEdata set (Figure 2) is fairly tight.
Polyaromatic hydrocarbons
Organic analysis is generally accepted tobe more problematic than inorganicparameters, and this is affirmed by thespread of data (15 – 980) found in the non -EAGLE laboratories (Figure 3). Again, thespread may be caused by differences both inextraction methods and final analysis.
Complex cyanide
This data set (Figure 4) is very interesting,
in that the EAGLE laboratories had agreed
on a stabilisation and extraction method, but
not on the measurement of the final stage of
the analysis. As this sample was derived from
an ex-gasworks site we expected high levels
of cyanide – the EAGLE laboratories ranged
from 2650 – 5430. The worrying aspect of the
other laboratories data is the spread from
54 – 5444, particularly with respect to the lower
results, when the sample contains a minimum
of 3000 mg/kg of complex cyanide.
Conclusions
Comparison of the EAGLE data setswith those of the other laboratoriesparticipating in the CONTEST scheme,clearly demonstrates the increased spread ofdata due to variations in the methods usedby different laboratories. It is thereforeapparent that the use of controlledmethodologies assists in ensuringcomparability of results, particularly ifdifferent laboratories are used.
Method specification
The EAGLE group has now
commenced an initiative to improve the
quality of contaminated land analysis by
means of an agreed specification. This is an
opportune time for trying to improve
matters, as much of the responsibility for
contaminated land has been transferred from
the Department of the Environment,
Transport and the Regions (DETR) to the
Environment Agency (EA). With the
imminent publication of the new regulations,
and as these will be based on a risk
assessment approach to contaminated land,
then the requirements for good quality
laboratory data and comparability between
laboratories is essential. The principle
objective is therefore to create a specification
which is acceptable to the EA and to the
industry. This specification must allow large
numbers of samples to be analysed fairly
quickly, to achieve detection limits which
comply with current guidelines, to be robust,
and able to be implemented by the majority
of laboratories – in other words, to be fit for
purpose. Whilst the methods will not be as
prescriptive as those of BSI or British Gas,
all the critical details which are known to
cause significant variations will be specified.
It is envisaged that the specification
will include:
• a list of methods covered
• specification of each method and its
critical details
• specification for a method validation
protocol
• method performance targets
• proficiency scheme participation
(CONTEST)
• proficiency scheme performance targets
• provision for reviewing and revising
methods and performance targets.
Figure 3: Total PAHs in prepared soil
Figure 4: Complex cyanide in prepared soil
LAB EAGLE CONTEST1 74.1 88.92 71.6 131.43 38.0 75.94 61.3 84.15 88.1 15.36 75.1 557 63.4 1708 70.3 79.69 81.5 980*
10 61.211 53.912 80.013 77.214 19115 11416 74.217 88.018 73.019 54.920 113
MEAN 73.1 133.0RANGE 61.3–88.1 15.3–980
LAB EAGLE CONTEST1 3015 52032 5430 49743 4225 56444 2650 30095 4527 51506 3040 26707 5380 30158 3300 1899 375
10 224011 331612 410013 129814 265015 5416 189317 5418 243119 422520 5380
MEAN 3157 2983RANGE 2650–5430 54–5644

6 V A M B U L L E T I N
A steering group was set up in June thisyear, including representatives from theEnvironment Agency, UKAS, DTI, BritishGas, Scottish Contaminated Land Forum(SCLF), Scottish Environment ProtectionAgency (SEPA), plus CONTEST/LGC, andthey are currently preparing the specificationfor limited circulation and discussion. It isthe intention of the group for UKAS to actas a certification body when auditing soilslaboratories, and that only laboratoriesemploying specified methods will becertified. The support from both regulatory
bodies and the industry is such that datafrom uncertified laboratories is unlikely to beaccepted by the majority of end users andregulators.
The certification is in addition to theaccreditation process, and it is onlylaboratories who are accredited and meet therequirements of the specification who will becertified. In addition, a minimumparticipation level will be specified withrespect to the numbers of parametersanalysed, both within CONTEST and thecertification scheme.
It is recognised that certain laboratoriesmay have difficulties implementing parts ofthis specification, but for standards toprogress and to gain uniformity ofinterlaboratory data, a standard specificationis the only way forward. However, it isimportant to allow for new developments intechnology and knowledge, and the steeringboard, having completed the setting uptasks, will change its role into that of areview group to enable further improve-ments and progress to be implemented asquickly as possible.
AlisonGillespie,Jim Finnamoreand Sue Upton,LGC
Introduction
The reliability of laboratory analyticaldata has assumed great importance in
the environmental sector. This is exemplifiedby contaminated land, where unreliable siteinvestigation data may have a significanteffect on land transactions and brownfielddevelopment, causing costly delays or theabortion of projects. On the basis oflaboratory analysis, expensive remedialaction may also be commissioned when nonewas necessary (false positive error), or noaction might be endorsed when a responsewas warranted (false negative error).Unnecessary remedial action translates intoan unnecessary cost to industry, whilstineffective risk management results inpotential damage to the environment, harmto human health and legal liability.
This article describes the key findings ofa research study, conducted under the VAMProgramme, designed to evaluate the
perception of those parties involved directlyor indirectly in contaminated land projectsof the importance of chemical analyticalmeasurements in making appropriate riskmanagement decisions. This group includeslandowners, developers, consultants,financiers, investors and regulators from theenvironmental and planning divisions ofvarious local authorities.
Background
Industrialisation in the UK has left a
legacy of land contamination. Much of this
contamination will continue to be treated in
the course of land transactions and through
the planning regime. Residual contamination
will also be managed through the proposed
contaminated land regime, which places a
statutory duty on local authorities and the
Environment Agency to investigate sites
suspected of containing ‘contaminated land’
and to act accordingly.
UK policy on contaminated land follows
the ‘suitable for use’ approach, which accepts
that a different standard of remediation may
be appropriate for different end uses of a
site. Fundamental to any contaminated land
risk assessment is the principle that an
adverse effect may only occur if a
contaminant source and receptor are linked
by an effective pathway. These three
elements combined form a ‘pollution
G U E S T C O L U M N
F O C U S O N S E C T O R S
VAM in the environmental sectorUser Reliance on analytical data
Investors/ Financiers • Protect financial stake• Avoid acquisition of liability
Developers • Assess development potential of site• Formulate development plan
Regulators • Comply with duties under Environment Act 1995 in managing risks of contaminated land
• Grant planning permission with due consideration of contamination risks
Landowners • Establish asset value• Identify financial and legal liabilities• Assist in formulating (dis)investment strategy
Consultants • Assess risks and provide defensible and transparent advice
Technology vendors • Design appropriate site-specific remedial solution• Monitor effectiveness of remediation and demonstrate
‘close out’ criteria
Table 1: ‘Users’ of data in an environmental ‘landcontamination’ context and their reliance on analytical data to support decision making

7 V A M B U L L E T I N
F O C U S O N S E C T O R S
linkage’. The management of contaminated
land risk is often based on the findings of site
investigations where analytical data are
compared to prescribed standards or risk-
based values in order to assess the
significance of contamination.Analytical data will be relied upon by
a range of ‘users’ (see Table 1) to make key decisions regarding the degree ofcontamination on a site and the need toundertake remedial measures.
Market research study
The primary objective of the study was‘to evaluate perceptions of parties associatedwith all aspects of land contamination(actual and potential) of the importance ofanalytical measurements in making soundrisk management decisions’. This translatedinto a series of secondary objectives, whichwere to explore and quantify:• the relative importance attached to
accurate analysis in contaminated landinvestigation
• the awareness of the implications ofunreliable, poor quality data
• the current methods, if any, forimproving and testing data quality
• the indicators of reputablelaboratories/consultants
• the criteria used to procure high qualitylaboratories and consultants
• inconsistencies in laboratorymeasurements within, and between,laboratories, and the effect on users’confidence in laboratory analysis
• the awareness of accreditation and itsimportance as a selection criteria forprocuring laboratory services.An independent market research
company, Business Planning and ResearchInternational (BPRI), were appointed tocarry out the research study which wasconducted in two phases. Firstly, a series of14 face to face interviews were held withregulators, technology vendors/consultants,major landowners and investors, duringwhich detailed qualitative informationemerged. This helped to identify some of thekey issues surrounding contaminated landanalysis. Using these findings, the secondphase of the research comprised a series of15 minute focused telephone interviews withsamples from the target audiences, asoutlined in Table 2. Some of the key
findings to emerge from the study arepresented above.
Usage and importance ofchemical analysis
The majority (77%) of chemical analysis
conducted by local authorities, landowners
and consultants is carried out using external
contractors, with just under one in four of
the organisations surveyed conducting
analysis in-house. Only one in ten local
authorities and landowners directly
commission analysis, relying in the main on
consultants to procure or provide the
laboratory services.
Those respondents who conduct or
directly commission analysis were asked to
rank five factors, identified in the qualitative
research stage of this study, in order of
importance in making risk management
decisions relating to contaminated land
analysis. The responses, detailed in Table 3,
show a high degree of commonality in their
interpretation of the importance of the
factors, clearly indicating that the top three
factors are site inspection, interpretation of
results in the context of the site and
sampling. Chemical analysis was consistently
viewed as less important than these three
factors. As one consultant at the qualitative
research stage said of the importance of the
pre-analysis work: “rubbish in, rubbish out”! Landowners and regulators who directly
commission analytical measurements wereasked for their views of the importance ofreliable chemical analysis for two differentscenarios. The first scenario was theimportance of reliable chemical analysiswhen initially exploring a site. As Figure 1shows, 85% view this as important and halfas ‘very important’, although one in ten didnot think it important at all. The secondscenario was the importance of chemicalanalysis in responding to a regulatoryenforced action. Whilst the overallproportion that view analysis as important isthe same, the strength of feeling increases
User Number of Detailed breakdowninterviews
Regulators 26 5 London Borough Councils9 Metropolitan Councils5 Unitary Councils7 District Councils
Consultants/ Technology vendors 24
Major landowners 24
Other Groups (Influencers) 26 9 Investors5 Financiers9 Developers3 Insurers
Table 2: Breakdown of respondents to telephone questionnaire
Base: All conducting or directly commissioning analysis (47)
Table 3: Importance of factors in making risk management decisions – Average ranking
Ranking Total Regulators Consultants Landowners Other groups
1 Site Sampling Site Site Siteinspection inspection inspection inspection
2 Interpret Interpret Interpret Interpret Interpret results results results results resultsin context in context in context in context in contextof site of site of site of site of site
3 Sampling Site Sampling Sampling Samplinginspection
4 Chemical Chemical Chemical Chemical Chemicalanalysis analysis analysis analysis analysis
5 Transport Transport Transport Transport Transportof sample of sample of sample of sample of sample

8 V A M B U L L E T I N
F O C U S O N S E C T O R S
with three quarters of the sample nowconsidering chemical analysis as ‘veryimportant’ in this context.
Consultants and technology vendorswere asked a similar question about theimportance of chemical analysis whenexploring a site for a client and in providingrisk management advice to a client. When itcomes to providing risk management advice,all respondents said that analysis was‘very/fairly important’ (three quarters said‘very important’) compared to 75% in initialsite exploration. Results from the qualitativeresearch suggested that the reason for thismay be that, with experience, someconsultants can make most of theirassessments of a site by looking at previoususe of the site and a ground inspection. Theimportance of analysis in providing riskmanagement advice was summed up by thestatement of one consultant in the qualitativeresearch who said “…it is of paramountimportance to us and our clients that theresults are representative, because it is thedifference between doing nothing andspending a small fortune.”
Confidence in analytical measurement
Respondents were asked how confidentthey were in the results of analyticalmeasurements (Figure 2). In general,confidence is fairly high with approximatelyfour out of five respondents ‘very confident’o r ‘ f a i r l y con f i den t ’ i n ana l y t i c a lmeasurements. Lowest levels of confidenceare found amongst the local authorities andother groups. This confidence in analyticalmeasurement is reflected in the level ofconfidence which respondents indicated theyhad in making decisions based on chemicalanalysis (Figure 3).
Poor analytical data and inconsistencies in
laboratory analysis
The qualitative stage of the researchidentified the following four key implicationsof making risk management decisions on thebasis of unreliable data:• risk to public health & safety and the
environment• financial liability• risk of providing poor advice to clients • damage to reputation.
Base: Regulators & landowners conducting or commissioning analysis (20)
Figure 1: Importance of reliable chemical analysis – Regulators & landowners
Base: All (except landowners who do not directly or indirectly commission chemical analysis) (95)
Figure 2: Confidence in analytical measurement
Base: All (except landowners who do not directly or indirectly commission chemical analysis) (95)
Figure 3: Confidence in making decisions based on chemical analysis

9 V A M B U L L E T I N
F O C U S O N S E C T O R S
Figure 4 shows the data from thequantitative survey and clearly demonstratesthe cost that can be incurred either throughliability, unnecessary work or through poordecision making based on unreliable data.
Of some concern is the fact that theoverall experience of unreliable dataamongst the respondents was quite high(41%). However, once broken down byaudience, this figure appears to be heavilyinfluenced by the experience of consultants,which is at least three times those of theother groups. This response is perhaps notthat surprising given the volume of analysisconsultants encounter and the fact that therespondent need only have experiencedunreliable data once to give a yes response.
Those respondents who have hadexperience of unreliable laboratory analyticaldata were asked for their opinions on howserious the implications were in making riskmanagement decisions. Unsurprisingly theyall view the implications as serious withnearly two thirds saying ‘very serious’.Factors identified as being major causes ofinconsistent or inaccurate data were methodof sampling, competence of the laboratoryperforming the analysis and method ofanalysis, with method of transportation alsoplaying a role.
Indicators of reputablelaboratories and knowledge
of accreditation
Respondents were read a list of factorsidentified at the qualitative stage of theresearch as important in identifyingreputable laboratories. They were asked torate the importance of these indicators on ascale of one to five, where five is veryimportant and one is not at all important.
The results based on the top two positions(i.e the factors considered most important)are presented in Figure 5 and show that thetop three indicators are accreditation, pastexperience of the laboratory and thelaboratory’s experience of the specificmethodology. Interestingly, price came lowdown in the list of factors identified.
Respondents were asked if they tested thereliability of third party data and if so, whatwere the most common methods employed.There is a marked difference betweenconsultants and non-consultants with 79% ofconsultants checking the reliability of thirdparty data compared to only 28% of the otherrespondents. The most common methodsemployed are duplicates/repeat analysis (59%),blanks (28%), sensitivity checks (23%),Proficiency Testing schemes (21%) and spikedsamples (15%). Nearly all the respondents whocheck data reliability (93%) say they find themethods they employ to be reasonably effectivewith one in three considering them to be ‘veryeffective’. Those who do not test reliability ofthird party data say they generally rely onanother party to do it for them.
Over half the respondents were aware ofat least one accreditation or ProficiencyTesting scheme, although there were markeddifferences by audience, with consultantspossessing the highest level of awareness(nearly 100%) followed by regulators (60%),landowners (just less than 50%) and others(less than 25%). Most of those who know ofany schemes named NAMAS (88%)followed by CONTEST (20%) andAQUACHECK (16%) although viewsvaried significantly in terms of knowledgeand understanding of the various schemes.
Base: All
Figure 4: Implications of unreliable data in making riskmanagement decisions on land contamination

Ginny Saunders,Jason Sawyerand HelenParkes, LGC
Whilst the very public debate aroundthe controversial safety, ethical and
consumer issues of genetically modified(GM) foods has received high profileattention, a second debate among DNA analysts has also been underway.DNA analysts have been quietly yetconscientiously discussing the analyticalchallenges associated with the detection of
GM ingredients in a variety of foodstuffs.This challenge, although the subject of muchinvestigation at various UK laboratories forsome time, was somewhat focused by theintroduction of EU labelling requirements inSeptember 1998. The legislation specificallyrequires all food, whether packed or soldloose, to be appropriately labelled if itcontains GM soya or maize, ‘except when
1 0 V A M B U L L E T I N
F O C U S O N S E C T O R S
Quality and cost issues
A particular area of interest to thoseinvolved in chemical analysis is therelationship between quality and cost inmaking risk management decisions.Respondents were asked to rate each of thefactors shown in Figure 6 on a scale of oneto five, where five is very important and oneis not at all important. The results clearlyindicate that quality of sampling, analysisand consultant is paramount and that cost ofanalysis is a secondary consideration.
Conclusions
This research study has identified a range
of views regarding the importance of reliable
analytical data in contaminated land studies.
As might be expected, consultants and
technology vendors are more aware of issues
affecting quality in analytical measurement
than landowners and investors, who either do
not regard analysis as important or else rely on
advice from consultants. Many of the
respondents have had experience of unreliable
analysis which has affected their confidence in
analytical measurement and the decisions on
which it is based. One potential area of
concern is the emphasis placed on the
repeatability and consistency of results as a
means of checking quality, which clearly does
not address the problem of analytical bias. The
information collected in this study provides a
useful platform for developing guidance to all
groups involved in contaminated land on the
quality aspects of measurement.
Base: All who commission chemical analysis directly with a laboratory (65)
Figure 5: Importance of factors in identifying reputable laboratories
Base: All *Note: Excludes consultants/technology vendors
Figure 6: Importance of quality and cost factors in making riskmanagement decisions
C O N T R I B U T E D A R T I C L E S
Turning a negative into apositive: GM food testing

neither protein nor DNA resulting from thegenetic modification is present’. Therefore, fora food product containing soya or maize tobe exempt from labelling, or to be labelled‘does not contain GM material’, the retaileror supplier must be assured of a negativeanalytical result for the detection of GMprotein or DNA. Two of the major questionsbeing asked at LGC are: • with what level of confidence can
the current technology produce anegative result
• whether negative results are toofrequently obtained when analysingsome of the more processed, complexand composite GM positive foods.
Laboratories providing an analytical
service in support of the legislation need
therefore to apply techniques for GM
detection that are sufficiently:
• specific to detect the GM protein
or DNA against a background of
non-GM analytes
• sensitive to detect low levels of the
GM analytes
• reproducible so that a result obtained
in one laboratory is comparable to that
obtained in another
• robust so that the degree of processing
of the various foodstuffs does not affect
the quality of the result.
These criteria should ensure theproduction of valid analytical data that trulyrepresents the GM status of a wide variety ofraw and processed foods.
For several years LGC has beendeveloping and validating DNA-basedmethods which can be applied to GM cropsand foods1. The ‘foreign’ DNA introducedduring the genetic engineering process(Figure 1) can act as a ‘tag’ or marker forgenetically modified plants. Detection ofthese ‘foreign’ genetic markers in food cantherefore be used as the basis for thedevelopment of methods to detect GMproducts in the food chain. In a geneticallymodified organism there may be severalDNA markers that can be used for thisdetection, these are:• the new gene(s) introduced into
the organism to elicit the required new characteristic, e.g. a herbicideresistant gene
• the ‘start’ (promoter e.g.-35S) and ‘stop’(terminator e.g. nos 3’) DNA sequences,which flank the introduced gene and actas ‘molecular switches’ to ensure thatthe introduced gene functions properly
• selectable markers such as genes conferring
antibiotic resistance (e.g. nptII encodes
for Kanamycin resistance), which are
introduced into the plant to aid selection
and development of the GM plant.The first step in the analysis involves
extracting DNA from the food sample.Because of the wide variety of foodstuffs thatmay be tested and the almost infinite rangeof sample matrix types, DNA extractionprocesses may have to be optimised for aspecific matrix. Purification of extractedDNA at this stage may be critical to thesuccess of the analysis because any co-extracted PCR inhibitory compounds maygive rise to false negative results. Thetargeted genetic markers are detected using avery specific and sensitive DNAamplification and detection technique calledthe polymerase chain reaction (PCR). ThePCR rapidly copies, or amplifies the DNAtarget (the GM markers) to give millions ofcopies of the specific DNA fragment, whichis then typically identified by simple gelelectrophoretic analysis and visual detectionof specific bands as illustrated for GM soyadetection in Figure 2.
The technique may sound straight-forward, but the debate over the production
1 1 V A M B U L L E T I N
C O N T R I B U T E D A R T I C L E S
Figure 1: Insertion of a foreign gene into a crop plant
Figure 2: PCR detection of GM material in DNA extracted froma range of soya flour standards using soya specific primers(lectin), GM detection primers (GM) and both sets of primerstogether as a multiplex reaction, the lectin acting as the internalPCR control. Lanes 1, 6 and 11 were DNA negative controls; lanes 2, 7, and 12 DNA extracted from 0% GM soya;lanes 3, 8 and 13 DNA extracted from 0.1% GM soya; lanes 4, 9 and 14 DNA extracted from 0.5% GMsoya; lanes 5, 10 and 15 DNA extracted from 2% GM soya.
M 1 2 3 4 5 6 7 8 9 10 11 12 13 14 15 M
200bp -

1 2 V A M B U L L E T I N
of valid results is very real and based onexperience. The first validation issues thatarise during the analytical process are due tothe complex and wide ranging food matricestested. DNA extracted from different foodsproduces DNA that varies considerably withrespect to purity, yield and state ofdegradation. Although DNA is considered tobe a much more robust analyte than mostproteins, it will still degrade underconditions such as excessive heating,physical force and extremes of pH2. Tomatopuree is a prime example of a common GMfood matrix, affected by all three of the aforementioned degradation affects, from which itis difficult to extract ‘quality’ DNA, i.e.DNA which is of high molecular weight andfree from co-extracted compounds.
Further validation issues andopportunities for false negative results areencountered during PCR. PCR is anenzymatic reaction that can be adverselyaffected by various compounds includingcations, carbohydrates, tannins, phenolicsand salts, all commonly found in foodstuffs3.In addition, the size, yield and integrity ofthe target to be amplified may also affect theresults obtained, for example smaller targetsmay be more efficiently amplified in highlyprocessed matrices where target DNA isdegraded4. Finally, the fact that differentgenes are targeted for amplification can alsolead to varying amplification efficiencies, andif a given target amplifies too inefficiently theproduct may not be detected by gelelectrophoresis.
If the production of false negative, andindeed false positive results are to beavoided, appropriate quality controlmeasures are of paramount importance.Such controls might include amplification ofa matrix-specific target serving as an internalPCR control. This would add confidence tothe results obtained for a number of reasons.Firstly, it would establish the fact that DNAhad been extracted from the matrix. This isnot however always possible; for examplemany highly refined oils do not containresidual plant DNA and therefore cannot betested using DNA-based technology.Secondly, a PCR internal control wouldestablish the purity and integrity of the DNA
by indicating that total PCR inhibition wasnot occurring or whether PCR amplificationefficiency was affected. Some furtherthought should be given to the proviso thatsuch a control should be appropriate ormatrix matched. It should originate from thesame organism as the GM target, be ofapproximately the same size as the GMtarget, and if possible be present atapproximately the same concentration. Itmight not be considered appropriate to use avery high copy number control target if theGM target is only present at trace levels.The inclusion of blank or negative extractionand PCR controls should be standardpractice for all PCR applications.
the absolute presence or absence of GM DNA
is difficult to prove in many products
No GM food matrix standards arecurrently available and due to the wide rangeof foods that could potentially be tested thisapproach may not gain popular support. Asan alternative, a range of pure ingredient(GM soya and maize standards are alreadyavailable) or DNA standard targets could bedeveloped. These would add confidence tothe analysis by testing the PCR approachused and establishing a detection level thatcould be directly compared from laboratoryto laboratory. As with many types of lowlevel or trace analyses, detection of ananalyte at or around the detection thresholdlevel can produce conflicting results ifrepeated several times. DNA standardscould therefore assist in defining an industrythreshold level above which a confidentpositive could be assigned.
An alternative to testing end product,and therefore usually highly complex andprocessed foods, could be the direct testingof raw ingredients where the risk of falsenegative results is greatly reduced. Underthese circumstances absolute traceability ofingredients would need to be ensured during the food preparation processes,however an advantage is that a wide range ofrelated products could all be assessed fromthe smaller range of initial ingredients,
saving time and money. As discussed, the absolute presence or
absence of GM DNA is difficult to prove inmany products. Negative analytical resultsdemonstrate absence of detectable DNA,that is DNA which may be present but maynot be efficiently amplified for reasonsdiscussed above. This stated, it is theresponsibility of the testing laboratory andthe analyst to ensure that every appropriatemeasure has been taken to detect the GMDNA if present. This can be achieved byintimate knowledge of the methodologiesused and professional knowledge of whenmatrix specific adaptations are required.Thorough validation of the methodologiesand the use of appropriate controls andstandards will help determine whether thedata is fit for purpose and benchmarkanalytical performance both within alaboratory and between laboratories.
Acknowledgements
The authors would like to thank HelenGregory for providing the data contained inFigure 2.
REFERENCES
1. Parkes H C, ‘Food for thought’,
Chemistry in Britain, 1999, 35, 32–34.
2. Hupfer C, Hotzel H, Sachse K, Engel K-
H, ‘Detection of genetic modification in
heat treated products from Bt maize by
polymerase chain reaction’, Z.
Lebensm. Unters Forsch A, 1998, 206,
203–207.
3. Bickley J, Hopkins D, Inhibitors and
enhancers of PCR. In: Analytical
Molecular Biology: Quality and
Validation, Eds. G C Saunders & H C
Parkes. RSC Publication. Cambridge,
UK, 1999.
4. Straub J A, Hertel C and Hammes W P,
‘Limits of a PCR-based detection
method for genetically modified soya
beans in wheat bread production’, Z.
Lebensm. Unters Forsch A, 1999, 208,
77–82.
C O N T R I B U T E D A R T I C L E S

1 3 V A M B U L L E T I N
C O N T R I B U T E D A R T I C L E S
ChrisHarrington,LGC
Introduction
Measurement of the total amount of
a metal in a particular sample
matrix actually reveals very little, if anything,
about its possible mobility, toxicity or
biochemical function. In environmental
terms, the total level of a metal gives no
information concerning its persistence,
or the biogeochemical state of the
element. Equally, the analysis of the total
metal concentration in biomedical samples
gives no indication of toxicity, or the risk
and site of bioaccumulation1. Of equal
interest when evaluating the nutritional role
of a particular metal, is the importance of
chemical structure to its biological
function. To provide answers to these
questions it is necessary to determine the
actual chemical form, or speciation, of
the element under investigation. The
following definition of metal speciation
highlights the fundamental points which
distinguish this subject:
Metal speciation is “the qualitativeidentification and the quantitativedetermination, of the individual chemical
forms that comprise the total concentrationof a given trace element in a sample2”.
This definition illustrates the important
characteristics of metal speciation, namely;
the structural identification of the metal
species of interest; its accurate measurement
in the presence of other interfering
compounds; and the fact that the sum
concentration of the metal species present,
equals the total concentration of the metal.
It is this last point which sets this area apart
from the measurement of other chemical
classes e.g. pesticide residue analysis, where
the mass balance between the total organic
carbon content does not match the sum
concentration of all the pesticides in a given
sample. Three of the most important
classifications of metal species are:1) Organometallic compounds occur with
many different elements e.g. mercury,arsenic, lead, tin, etc. and arise when ametal forms a covalent bond with acarbon atom. This class of metalcompound has very important conse-quences in terms of toxicity effects, e.g.methylmercury chloride is approximatelyten times more toxic than inorganicmercury chloride, but much less toxicthan dimethylmercury. On the otherhand, the most abundant form of arsenicin fish tissues is the organoarseniccompound, arsenobetaine, which ismuch less toxic than inorganic arsenic3.Organometallic compounds also behavedifferently to inorganic forms in terms ofenvironmental mobility, e.g. the methy-lation of mercury in water leads to anaccumulation of monomethyl mercury inthe organic rich sediment fraction,compared to inorganic mercury, and to alesser extent generation of volatiledimethylmercury facilitates evaporationfrom the system, transferring themercury from the hydrosphere to theatmosphere. Some organometallic formsare also more likely to penetrate lipidmembranes and accumulate in tissue. A recent example of this is theidentification of the active ingredient ofantifouling coatings, tributyltin, inhuman blood and liver samples4.
2) The oxidation state of an elementpresent in a particular system has amajor impact on its toxicity andfunction. The toxicity of chromium isdetermined by its oxidation state5, suchthat the Cr (VI) species is carcinogenicand can damage DNA, whereas Cr (III)is the detoxified form, which is essentialto human health within a specificconcentration range. The same applies
to non-essential elements e.g. arsenic,where As (III) is more toxic than As (V).
3) Biochemically important essential metals
are a significant class of metal species,
which control a number of functions
important to life6. The speciation of
metals such as copper and zinc in
biological systems determines the
structure and function of numerous
enzymes and co-enzymes. A number of
metals are important components of
certain proteins e.g. iron in haemo-
globin. These metalloproteins are
involved in the transportation and
function of many metals within
multicellular organisms. Equally, cellular
concentrations of non-essential elements
are regulated by proteins such as
metallothionein.
Analytical methods
There are numerous analytical
procedures available for the analysis of trace
elemental speciation in environmental,
clinical, food and many other samples.
State-of-the-art-techniques are based on
coupling powerful separation technology
(GC, HPLC, CE, SFC) to sensitive element
specific detectors (CV/HG-, AAS, MIP-
AES, ICP-MS). In most cases methods
based on gas chromatography require the
organometallic compounds to be derivatised,
so as to confer thermal stability. The
requirements of the detection system are for
a low limit of detection, because the levels of
metal species present are much lower than
the total metal content of the sample.
However, detection of the metal containing
species is made easier when the technique
used is specific to the element of interest,
and this can also reduce the degree of
sample preparation necessary.
In this article three examples of metal
speciation analysis are used to illustrate the
three main analytical concerns identified at
the start of this article. Table 1 summarises
the general experimental conditions for the
three illustrative studies.
The analysis of metal speciationusing LC-MS

1 4 V A M B U L L E T I N
1. The structural identificationof methylmercury in
fish tissue
As a result of its extensive industrial use,mercury and mercury containing chemicalsare ubiquitous global pollutants, which canhave a toxicological impact over vastdistances. An important facet of thebiogeochemistry of mercury is its propensityto be methylated in the environment.Methylmercury (MeHg) makes up approx-imately 0.1 to 1.5% of the total mercury insediments and about 2% of the totalmercury in seawater. However, it isbiomagnified in the marine food chain andvirtually all (80-90%) of the total mercury infish is present as MeHg. The consumptionof fish therefore represents the single mostimportant exposure route to methylmercuryfor the general public. One of the firstscientifically documented incidents involvingmercury pollution occurred in MinamataBay, Japan and related to the accumulationof monomethyl mercury in fish and thesubsequent poisoning of the localinhabitants7. This episode was a turningpoint in the analysis of environmental levelsof toxic metals, because it highlighted theneed to measure all the chemical forms
present in a system, to provide a clearassessment of environmental risk.
Recent studies at LGC have been aimedat developing methods for the speciation ofmercury in fish tissue using highperformance liquid chromatography coupledto inductively coupled plasma massspectrometry (HPLC-ICP-MS)8. A widerange of different HPLC methods areavailable for the speciation of mercury andthe most recent have been reviewed9. Themethod developed here involves dissolutionof the sample using a weak base and heatingin a microwave oven for approximately 15minutes. A chromatogram for the analysis ofa 10 ngg-1 standard of 4 mercury containingcompounds is shown in Figure 1 (a).
The main drawback with using ICP-MSas the method of detection is that it does notprovide structural information on thecompounds under investigation, and soidentification is made solely on retentiontimes referenced to standards. This isunsatisfactory because it relies on the use ofpure standards, which are usuallyunavailable or not obtainable in a pureenough form, also the retention times can be
C O N T R I B U T E D A R T I C L E S
Conditions Methylmercury Tributyltin chloride Heme-iron
Sample Fish tissue Marine sediment Foodstuff
Column Kromasil Kromasil Progel250 x 4.6mm i.d., 5µm 150 x 2.1mm i.d., 5µm 300 x 7mm i.d., 10 µm
Mobile phase Methanol (50%), Acetonitrile (65%), Tris HCl buffer,Water (50%), Acetic acid (10%), pH 7.2.2-Mercaptoethanol Water (25%),(0.05%). (% v/v). Triethylamine
(0.05%). (% v/v).
Flow rate 1.0 0.2 1.0(mlmin-1)
Injection loop (µl) 50 50 50
Interface Cooled spray Cooled spray Direct to nebuliserchamber, addition chamber, additionof oxygen of oxygen
Detector Q-ICP-MS1 Q-ICP-MS1 SF-ICP-MS2
APCI-MS
Ion (m/z) 202. ICP 116, 120 56292 – 295 APCI
Further details 10, 8 14 23(ref.)
1Q-ICP-MS, quadrupole ICP-MS2 SF-ICP-MS, sector field ICP-MS
Table 1: General analytical conditions for the three studieschosen to illustrate the state-of-the-art analysis of metalspeciation in biological and environmental samples. All threemethods are based on the use of HPLC coupled to ICP-MS.
Figure 1 (a): Separation of different mono substituted mercury species by HPLC coupled to inductively coupledplasma mass spectrometry (ICP-MS) using the conditionsdetailed in Table 1. The concentration of each component of the standard was 10 ngg-1.

1 5 V A M B U L L E T I N
confounded in the presence of a complexsample matrix, or an unidentified mercurycontaining compound.
To overcome this problem, thechromatographic separation was developedso as to be compatible with a molecular massspectrometry method, in this caseatmospheric pressure chemical ionizationmass spectrometry (APCI-MS)10. Figure 1 (b)shows a chromatogram for the samestandard solution as in Figure 1 (a). It isevident from comparison of the twochromatograms that the separation isidentical in both cases, but with APCI-MSdetection, the mass spectra corresponding toeach peak can be used to identify thecompound present. The mass spectrum for a10 ngg-1 standard of MeHg is shown inFigure 2. The most abundant ion clustercorresponds to an adduct formed betweenMeHg and a component of the mobile phase(2-mercaptoethanol). The ions monitoredfor methylmercury were m/z 292, 293, 295,and their abundance can be used to identifythe compound present. Table 2 shows theisotopic abundance for a spiked fish tissuesample compared to a standard andtheoretical abundances. This work hasdemonstrated that it is possible to quantifythe mercury compounds in fish tissue downto the low ngg-1 level using ICP-MS, andconfirm their identity by APCI-MS, thusproviding greater validation of the method.
2. High accuracymeasurement of tributyltin
chloride in marine sediments
Organotin compounds are a class ofchemical widely used in industry for anumber of applications, but particularly asstabilisers for plastics, as catalysts and asbiocides. One particular compound used asa biocide on marine vessels is tributyltin,which is the active ingredient in manyantifouling coatings. This compound hasbeen described as the most toxic substanceever deliberately introduced into the marineenvironment11. The leaching of TBT intothe waters around harbours, docks and areasof high boating activity has been shown toadversely affect non-target organisms such asmussels, dog whelks and oysters11,12.Recognition of these effects has led directlyto restriction of the use of antifoulingcoatings containing TBT within Europe.
C O N T R I B U T E D A R T I C L E S
Figure 1 (b): Separation of different mercury species by HPLC coupled to atmospheric chemical ionisation massspectrometry (APCI-MS), using the conditions detailed in Table 1. 1 = Inorganic, 2 = methyl, 3 = ethyl, 4 = phenyl.Standard concentration was 10 ngg-1 for each component.
Figure 2: Mass spectrum for a 10 ngg-1 standard ofmethylmercury chloride. The most abundant ion at m/z 295corresponds to a methylmercury/2-mercaptoethanol adduct, whereas the cluster at m/z 371 corresponds to amethylmercury/2-mercaptoethanol adduct containing 2 2-mercaptoethanol groups and loss of 2 protons.
1 6 V A M B U L L E T I N
The numerous analytical procedures forthe speciation of organotin compounds usingdifferent forms of HPLC in a wide range ofsample matrices have been reviewed13.Previous work at LGC has established the useof HPLC-ICP-MS and LC-API-MS for theanalysis of TBT in sediments14.
The accurate measurement of metalspecies is fraught with difficulties, such as:maintaining the integrity of the analyteduring the extraction phase; the inaccuracyof external calibration due to matrix effects;and the time consuming and expensivenature of standard additions calibration.These problems have proved so difficult toovercome that a number of Europeancertification exercises aimed at measuringmetal species in sediment, have encounteredproblems that have resulted in re-certification of standard reference materials15
or possible artefactual analyte formationduring extraction16.
One way forward in this area, is the
development of technologies based upon on-
line isotope dilution mass spectrometry
(IDMS). The use of calibration with an
internal standard cannot correct for signal
suppression effects generated by the matrix,
if the components of the matrix do not elute
at the same time and with the same
magnitude as both the analyte peak and the
internal standard. Standard additions can
compensate for this effect, but for standard
reference material certification at least five
spiked standards for each replicate are
necessary to give acceptable uncertainty
values. This is both time consuming and
expensive. The overriding advantage of
using IDMS calibration is that the
isotopically enriched spike acts as the perfect
internal standard, because it closely mimics
the analyte of interest. Once equilibrated
with the analyte, any sample losses do not
affect the result, but more importantly, any
matrix effects which can affect the
measurement process are completely
accounted for.Previous studies at LGC have looked at
the high accuracy measurement of totalmetal concentrations in solution, bydeveloping a structured IDMS procedure17.Using this technology many common errorsand necessary corrections have been shownto be negated or eliminated. The accuracyachieved for the measurement of total metalconcentration in blind trial solutions istypically to within 1% (relative toconcentration) at the 95% confidencelevel18,19). Current studies are aimed atextending this approach to the high accuracymeasurement of organotin compounds byon-line isotope dilution mass spectrometry(IDMS).
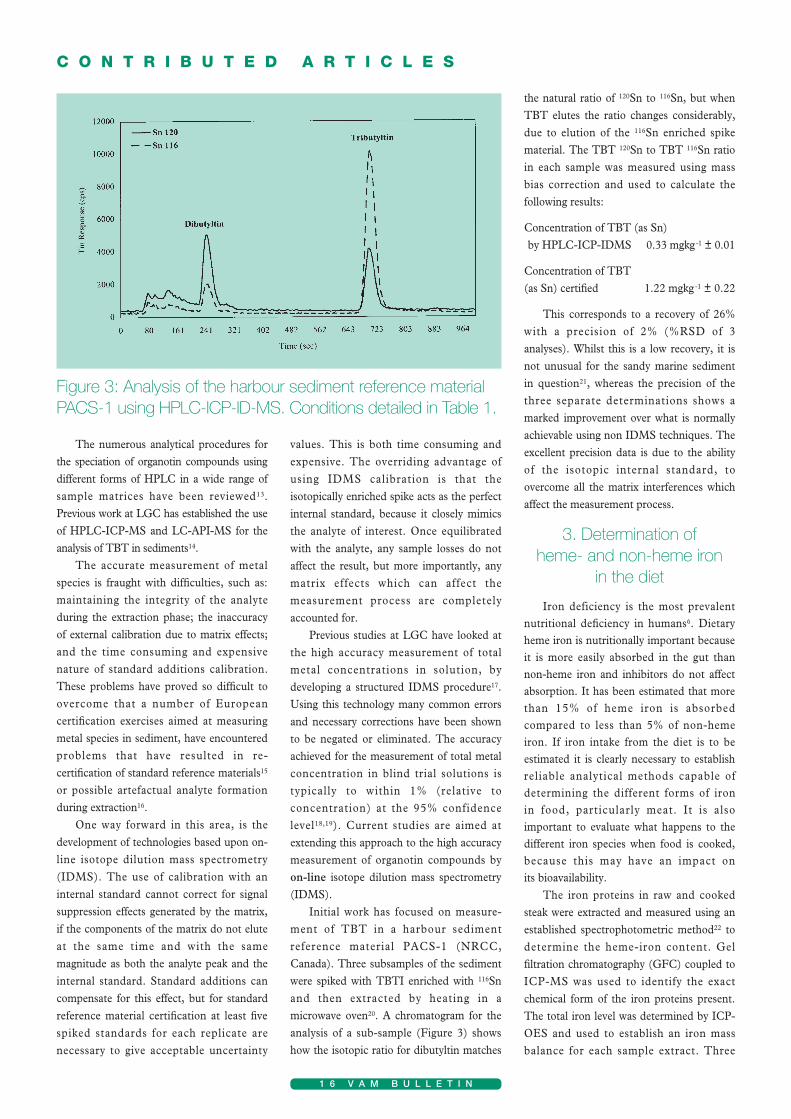
Initial work has focused on measure-ment of TBT in a harbour sedimentreference material PACS-1 (NRCC,Canada). Three subsamples of the sedimentwere spiked with TBTI enriched with 116Snand then extracted by heating in amicrowave oven20. A chromatogram for theanalysis of a sub-sample (Figure 3) showshow the isotopic ratio for dibutyltin matches
the natural ratio of 120Sn to 116Sn, but whenTBT elutes the ratio changes considerably,due to elution of the 116Sn enriched spikematerial. The TBT 120Sn to TBT 116Sn ratioin each sample was measured using massbias correction and used to calculate thefollowing results:
Concentration of TBT (as Sn) by HPLC-ICP-IDMS 0.33 mgkg-1 ± 0.01
Concentration of TBT (as Sn) certified 1.22 mgkg-1 ± 0.22
This corresponds to a recovery of 26%with a precision of 2% (%RSD of 3analyses). Whilst this is a low recovery, it isnot unusual for the sandy marine sedimentin question21, whereas the precision of thethree separate determinations shows amarked improvement over what is normallyachievable using non IDMS techniques. Theexcellent precision data is due to the abilityof the isotopic internal standard, toovercome all the matrix interferences whichaffect the measurement process.
3. Determination of heme- and non-heme iron
in the diet
Iron deficiency is the most prevalentnutritional deficiency in humans6. Dietaryheme iron is nutritionally important becauseit is more easily absorbed in the gut thannon-heme iron and inhibitors do not affectabsorption. It has been estimated that morethan 15% of heme iron is absorbedcompared to less than 5% of non-hemeiron. If iron intake from the diet is to beestimated it is clearly necessary to establishreliable analytical methods capable ofdetermining the different forms of iron in food, particularly meat. It is alsoimportant to evaluate what happens to thedifferent iron species when food is cooked,because this may have an impact on its bioavailability.
The iron proteins in raw and cookedsteak were extracted and measured using anestablished spectrophotometric method22 todetermine the heme-iron content. Gelfiltration chromatography (GFC) coupled toICP-MS was used to identify the exactchemical form of the iron proteins present.The total iron level was determined by ICP-OES and used to establish an iron massbalance for each sample extract. Three
C O N T R I B U T E D A R T I C L E S
Figure 3: Analysis of the harbour sediment reference materialPACS-1 using HPLC-ICP-ID-MS. Conditions detailed in Table 1.

1 7 V A M B U L L E T I N
different iron containing compounds werepresent in the raw meat extracts (Figure 4);one was present at the same concentration inthe blank, the second corresponds to theheme-iron containing protein myoglobin, andthe third peak remained unidentified but hada mass of approximately 9 kDa, as indicated
by its elution time from the column.The iron mass balance for the two
component proteins and the totalconcentration in the extract (Table 3) is verygood for the raw and rare samples, butworsens on cooking. The myoglobin peakdisappears on cooking the steak before
extraction (Figure 5), however theconcentration of heme-iron determinedspectrophotometrically remains the same asthe raw sample (Table 3). A possibleexplanation for this is that myoglobin breaksdown on heating and so does not elute from the column, but the heme-iron group remains intact, so is measuredspectrophotometrically. Further work isneeded to elucidate the exact fate of heme-iron during the heating process.
Conclusions
This article identifies the main analyticalpoints of importance which have to beconsidered during the analysis of metalspeciation in a number of different situations.The use of a combined mass spectrometryapproach, utilising elemental and moleculartechniques has been shown to improve thevalidation of the speciation of metals. Thework described in this report has alsodemonstrated the improvements in accuracyand precision attainable for the measurementof environmentally and toxicologicallyimportant organometallic compounds, byusing an on-line IDMS approach.Measurement of the total level of metal incombination with speciation analysis, hashelped to ensure reliable results in the absenceof a suitable standard reference material.
Acknowledgments
The majority of work described in thispaper was supported by the VAMprogramme. The heme-iron work wassupported under contract with the UKGovernment’s Ministry of Agriculture,Fisheries and Food.
A number of colleagues at LGC havecontributed to this work including; SteveWhite, Julie Romeril, Pete Sutton, BenFairman, Sheila Merson, Selvarani Elahi andPunithavatay Ponnampalavanar.
The tributyltin iodide spiking materialused in this work was kindly donated by theUniversity of Plymouth.
REFERENCES
1. R Cornelis, In: Metal Speciation in the
Environment, Brockaert J A C, Gucer S,
and Adams F, (Editors), Proceedings of
the NATO Advanced Study Institute on
Metal Speciation in the Environment,
Cesme, Turkey, 1989, p30.
C O N T R I B U T E D A R T I C L E S
m/z 295 m/z 293 m/z 292
Theory 100 77.3 54.9
Standard 100 76.8 ± 0.11 53.7 ± 0.09
Sample 100 76.9 ± 0.52 53.9 ± 0.46
Table 2: Mean ion abundances (expressed as % with respectto m/z 295) for the methylmercury (II) ions monitored in theselected ion monitoring (SIM) mode ± standard deviation (n=5).Sample spiked with 40 µg kg-1 of analyte prior to extraction.
Temper- Spectro- HPLC-ICP-MS ICP-OESature photometry
Sample °C Heme-iron Myoglobin Unknown Total iron Total ironmg/kg mg/kg mg/kg mg/kg mg/kg
Raw – 18.7 ± 0.311 – – 20.5 ± 1.01 20.7 ± 0.5Rare 60 17.0 2.24 4.99 7.23 7.18Medium 70 15.0 0.92 3.69 4.61 5.17Well done 80 17.0 0.75 1.65 2.40 4.30
1 Mean concentration ± standard deviation for 6 samples.
Table 3: Concentration of iron metalloproteins (as iron) in rawand cooked meats, determined by HPLC-ICP-MS and aspectrophotometric method. Also shown are the total ironconcentrations in the extracts, determined by ICP-OES and bysummation of all the iron containing HPLC peaks. Results forthe cooked meats were obtained for two separate experiments,carried out on different dates within a 3 month period.
Figure 4: HPLC-ICP-MS chromatogram for the iron content ofa steak sample after cooking at 60°C, made up in the mobilephase, with a dilution factor of 10 (no internal standard added).

2. Brockaert J A C, Gucer S, and Adams F
(Eds), Metal Speciation in the
Environment, Proceedings of the NATO
Advanced Study Institute on Metal
Speciation in the Environment, Cesme,
Turkey, 1989.
3. Craig P J , Organometallic Compounds in
the Environment, Longman, London, 1986.
4. Pearce F, New Scientist, 17 July 1999, p23.
5. Flint G N, Carter S V, Fairman B,
Contact Dermatitis, 1998, 39, 316.
6. Reddy M B, Chidambaram M V, and
Bates G W, In: Iron Transport in Microbes,
Plants, and Animals (Winkelmann G, van
der Helm D and Neilands J B, eds.),
VCH, New York, pp429–443.
7. Smith W and Smith A, Minamata, Holt,
Reinhart and Winston, New York, 1975.
8. Harrington C F and Catterick T, J. Anal.
At. Spectrom., 1997, 12, 1053.
9. Harrington C F, Accepted by Trends in
Anal. Chem., Special Issue on
Speciation, 2000.
10. Harrington C F, Romeril J and Catterick T,
Rapid Comm. Mass Spec., 1998, 12, 911.
11. Maguire R J, Appl. Organomet. Chem.,
1987, 1, 475.
12. Nicklin S, and Robson M W, Appl.
Organomet. Chem., 1988, 2, 487.
13. Harrington C F, Eigendorf G K and
Cullen W R, Appl. Organomet. Chem.,
1996, 10, 339.
14. Fairman B, White S and Catterick T, J.
Chromatography, 1998, 794, 211–218.
15. Measurements and Testing Newsletter,
December 1998, Vol. 6, No.2, p3.
16. Quevauviller P and Horvat M, Anal.
Chem., 1999, 71, 155A.
17. Catterick T, Fairman B, and Harrington
C, J. Anal. Atom. Spectrom., 1998, 13,
1009–1013.
18. Catterick T, Fairman B, Sargent M and
Webb K, VAM Bulletin, Autumn 1997,
17, 13.
19. Catterick T and Fairman B, VAM
Bulletin, Autumn 1997, 17, 16.
20. Arnold C G, Berg M, Muller S R,
Dommann U and Schwarzenbach R P,
Anal. Chem., 1998, 70, 3094–3101.
21. Hill S, Personal Communication, July
1999.
22. Hornsey H C, J. Sci. Food Agric., 1956,
p534.
23. Harrington C F, Elahi S, Merson S A and
Ponnampalavanar P, in preparation for
Analytical Chemistry.
C O N T R I B U T E D A R T I C L E S
1 8 V A M B U L L E T I N
Figure 5: HPLC-ICP-MS chromatograms for the iron content ofa raw and cooked steak extract, made up in the mobile phasewith a dilution factor of 10. Ferritin added as internal standard.
Paul Quincey,NPL
Controlling problems with air qualityused to be simple. You found out what
the sources of the pollutants were; you madesure that emissions were reduced; you watched
the problem go away. That, crudely,describes how the urban smogs seen inBritain in the 1940s and 1950s wereeradicated, largely through the Clean Air Actof 1956 which put tight curbs on coalburning in towns and cities. Where was theneed for accurate, reliable measurements?
The pollutants causing problems todayhave more complex origins than the sulphur
dioxide and smoke from coal burning, whichled directly to adverse health effects. Motorvehicles have replaced coal-burning as thedominant source of pollutants in urbanareas, but the pollutants of most currentconcern to health – ozone and fine particles– have to be considered as arising within amuch wider context of atmosphericchemistry over large geographical areas.
Putting the quality into air quality measurements

Ozone, for example, has higher concen-trations in rural areas, away from the mainsources of pollutants that lead to itsformation, because in towns it is destroyedby higher concentrations of nitrogenmonoxide. Also, its concentrations arehighest in the south of England because ofits lower latitude and because of contri-butions from continental Europe. Althoughless dramatic than ‘pea-soupers’, studies haveestimated that at least 10,000 prematuredeaths each year in the UK are currentlyassociated with air pollution, and the largerise in respiratory problems such as asthmais also likely to be linked to air quality.
Recent and up-coming air qualityregulation, originating both from the UKGovernment and the European Union, isbased on setting upper limits for theconcentrations of an expanding number ofindividual pollutants, as measured in the airbreathed by some substantial fraction of thepopulation. Accurate measurements aretherefore needed to apply the legislation, togauge trends, to refine models of atmos-pheric chemistry which can predict futurelevels, and to help with studies of medicaleffects, which in many cases are notquantitatively established.
What pollutants?
The field of air quality is concerned withcomponents of the atmosphere close toground level which are linked to detrimentaleffects, particularly on people. These do notinclude any of the principal components in air – nitrogen, oxygen, argon, carbondioxide and water vapour – and all relevantpollutants are present only in ‘trace’amounts, typically measured in parts perbillion by molar ratio (ppb). The range ofpollutants measured depends to some extenton established practice, and the followingpollutants are those which are mostcommonly measured, and which also featuremost prominently in regulation:
Other pollutants of interest includemetals, such as lead, cadmium, arsenic,mercury and nickel, polycyclic aromatic hydro-carbons (PAHs), such as benzo[a]pyrene,and dioxins, which are all usually analysedafter collection of particles on filters.
Traceability, from physics to chemistry
Even though the concentrations of airpollutants would be considered very low inmost types of analysis, the available methodsof sampling and quantifying the pollutants inthe table are relatively mature – theexception being PM10, which will bereturned to later. For most gaseous species,air can be drawn directly into the analyticalinstrument, where the pollutant is measuredwithout any need for pre-concentration orany other sample preparation. Benzene and1,3-butadiene are typically collected over asampling period by absorption onto a passivesolid sorbent, before being injected into agas chromatograph, but in all these cases themeasurement process is amenable tocalibration by directly introducing a sample ofknown concentration into the sampling line.
The pollutants causingproblems today have morecomplex origins than the
sulphur dioxide and smokefrom coal burning
The measurements provide an interestingrange of approaches for realising traceability.In most physical measurements, say ofvoltage, it is generally acknowledged thataccurate primary standards can be made, byreference to SI definitions, and thatcalibrations should be made to thesestandards either directly or through a shorttraceability chain. This is similar to the casefor carbon monoxide, where mixtures at thesevery low concentrations can be made reliably
from first principles, for example by weighingthe pure components, and kept stable in gascylinders. Calibration can then be performedusing such mixtures with confidence. At theother extreme, ozone cannot be kept as astable, known calibration mixture for a usefullength of time because of its reactivity. Incommon with much of analytical chemistry,ozone measurements achieve traceabilitythrough side-by-side comparisons of analysersand by an adequately defined and recognisedreference method, in this case a particulardesign of photometer.
For moderately reactive gases such assulphur dioxide and benzene it is possible tomake stable reference mixtures, but this ismore difficult than for carbon monoxide. Inthese cases cylinder gas mixtures are used tocalibrate analysers in the field, but these are characterised and rechecked by reference to the most appropriate laboratorymethod, for example a dynamic absolutecalibration technique.
Automatic monitoringnetworks in the UK
The Department of the Environment,
Transport and the Regions funds an
extensive network of air quality monitoring
sites throughout the country, which has built
up over many years to the present size of
about 100 sites. They are used both to
supply good quality data to inform
government policy, and to assess any
instances of concentrations exceeding their
specified limit values. Their locations have
been carefully chosen to represent typical
human exposure in a variety of roadside,
urban and rural situations. They monitor
some or all of the pollutants listed in the
table above with automatically operated
sites, generally producing hourly data which
is made widely available, for example via the
internet. The Department has long
appreciated the need to ensure the validity of
the data, and appoints Quality Assurance/
Quality Control Units (currently NPL and
AEA Technology) to calibrate the field
instruments and process the ratified data,
independent of the Management Unit
responsible for operating and maintaining
the sites.
These QA/QC Units visit all the sites
two or four times per year to carry out
calibrations and instrument checks, which
C O N T R I B U T E D A R T I C L E S
1 9 V A M B U L L E T I N
Pollutant Typical concentration
ozone 0 – 100 ppb
nitrogen dioxide 0 – 150 ppb
sulphur dioxide 0 – 200 ppb
carbon monoxide 0 – 10 ppm
benzene 0 – 2 ppb
1,3-butadiene 0 – 0.5 ppb
PM10 particulates 0 – 200 µg/m3

2 0 V A M B U L L E T I N
are used to produce the ratified data, or to
delete data if a serious fault is found. Both
Units use calibration gas cylinders certified
at NPL to the national standards developed
under the VAM programme. All portable
ozone photometers which are used as
transfer standards to calibrate the field ozone
analysers are in turn calibrated using the
national reference photometer maintained at
NPL. In this way very clear and direct
traceability is achieved between a large
number of field measurements and the
national standards.
International comparisons
One advantage of linking the UK’smeasurements so directly to a singlereference laboratory is the ease with whichinternational harmonisation can be assessed.As the UK’s national standards laboratory,NPL participates in regular internationalcomparisons for key measurements,organised by metrological organisations suchas BIPM and EUROMET. For air qualitymeasurements these are complemented byexercises arranged by the European UnionJoint Research Centre at Ispra, and also byjointly funded European Framework 4projects. One of these in particular, knownas HAMAQ (HArmonisation ofMeasurements of Air Quality) has beeninvestigating the agreement achievedbetween European standards laboratoriesunder good laboratory conditions, so thatvalid figures can be used to calculate theuncertainty of field measurements. Theproject is co-ordinated by NPL and is partlyfunded by the VAM programme.
Particulates
Airborne particulates make a good casehistory of a tricky measurement problem. Asa visible and irritating pollutant, suspendedsolids and droplets have been quantified formany decades by a variety of ad-hocmethods. These have generally involvedcollecting the particulates on a filter, andeither gauging the blackening of the filter,weighing the collected mass, or quantifyingit in some other way (such as by itsattenuation of beta radiation produced by alow-level radioactive source).
Standardisation has taken place alongtwo lines: collection of the particulates, andits subsequent quantification. In the firstarea, larger particles are deliberatelyexcluded, on the grounds that they do notreach human lungs when inhaled, and henceare unlikely to be the cause of health effects.The commonly measured PM10 componentrefers to particles less than about 10 µm indiameter, PM2.5 to those less than 2.5 µm,and so on. This size selection is generallyachieved using inlet designs which removelarger particles by viscous drag. Differentdesigns have different cut-off distributionsand maintenance requirements, andstandard reference designs have been chosen– in Europe the European Committee forStandardisation (CEN) has defined standardinlet designs for PM10, although there is notyet an EU standard for PM2.5.
Quantification is currently concernedpredominantly with the collected mass, sothat by making use of the known volume ofair which passed through the collector, theunit of measurement (µg/m3) followsdirectly. Mass measurement is in principle astraightforward process, but in the last fewyears a more complex picture has emerged,in which the measured mass can vary by atleast 50%, depending on the composition ofthe particulate matter and the temperatureregime during the time between collection
C O N T R I B U T E D A R T I C L E S
One of the more remote automatic monitoring sites
Inside a monitoring site

2 1 V A M B U L L E T I N
and weighing. This has raised the parallelissues of standardisation, ensuring thatdifferent people can be confident they aremeasuring the same thing, and purpose –deciding which of many variations to themeasurement method is most informativewith regard to health effects. Given that newstudies of health effects are likely to takemany years, standard methods suitable forenforcing legislation for particulates acrossEurope are proceeding pragmatically.
EU/CEN developments
Where harmonised methods are needed
to enable European Union Directives to be
properly applied across all member states,
CEN is mandated to produce the necessary
written standards. In the case of air quality,
Working Groups within the CEN Technical
Committee 264 are preparing unusually
comprehensive standards which will specify
reference methods and their performance,
instrument performance tests, quality
control procedures and other items designed
to ensure that measurements made
throughout the Union have an uncertainty
demonstrably within the limits set out in the
Directives. NPL staff, being closely involved
both in the validation of measurements and
the practical operation of monitoring sites,
are actively involved in many of these
working groups.
Looking forward
Even as the immediate air qualitymeasurement requirements are being dealtwith, a number of other important issues forthe future are taking shape. For example,there is a need to investigate pollutantsbeyond the ‘traditional’ set, such as PAHs,to clarify their effects on health. In generalthis will mean measurements which are moredifficult in terms of calibration andvalidation, but developing technologies suchas combined gas chromatography and massspectroscopy make reliable analysis morefeasible. Because they have not beenmonitored systematically in the past, theirhealth effects are poorly understood.Likewise, the particulate measurement issuesneed to be clarified and resolved.
Outdoor air quality needs to be seen inthe context of actual personal exposure. Wespend the majority of the time indoors,
breathing air which has a large set of addedcomponents from furniture and cleaningmaterials, for example, often at much higherconcentrations than are found outdoors.These need reliable measurement techniquesand investigation.
Also, the small scale geographical
variations in concentration need to be
investigated to determine pollution ‘hot
spots’ which would otherwise be missed.
This will need a combination of simpler,
lower cost analysis techniques such as
sampling by diffusion tubes, which can be
used in large numbers for a local survey, and
modelling software, which can predict
concentrations based on knowledge of the
geography, local sources (including roads),
meteorology and atmospheric chemistry. It
goes without saying that such models are
only as good as the measurements used to
validate them.
Together with the growing realisation
that air quality is a truly international
problem needing international co-ordination
for its solution, it is clear that there will be a
need to support air quality measurement for
many years to come.
C O N T R I B U T E D A R T I C L E S
Bill Bell andTom Gardiner,NPL
Introduction
The discovery of the springtimeAntarctic ozone hole by Joe Farman
and his colleagues of the British AntarcticSurvey in 1985 gave rise to a global researcheffort aimed at understanding the causes ofthe hole. A US led measurement campaignduring 1987 established that the primarycause of the hole was an ozone destroyingcatalytic cycle involving chlorine, in the formof chlorine monoxide (ClO), in the lower
stratosphere (at altitudes of 15 – 25 km).Most of this chlorine is released by thephotolysis of manmade chlorofluorocarbons(CFCs) in the stratosphere. The role ofchlorine in catalytically destroying ozone hadbeen hypothesised earlier in work datingback to the 1970s by Sherwood Roland,Mario Molina and Paul Crutzen for whichthe trio received the Nobel Prize forChemistry in 1995. However the detailedmechanism of the observed polar ozonedestruction, involving heterogeneousreactions on polar stratospheric clouds, wasnot foreseen. These polar stratosphericclouds, consisting largely of condensed waterand nitric acid, are formed only at the lowtemperatures (less than 193 K) found in thewinter polar stratosphere.
During the later part of the 1980sattention turned to the question of whether a
similar hole could exist over the northernpolar regions. Initial French and GermanArctic measurement campaigns werefollowed in 1991–92 by the first coordinatedEuropean campaign – EASOE (theEuropean Arctic Stratospheric OzoneExperiment) involving over 200 scientists.This campaign showed that the samemechanisms were taking place in thenorthern polar regions and that the Arcticpolar stratosphere was primed for significantozone depletion. Also around this time newsatellite data was published in 1991 whichshowed that, in addition to the springtimepolar ozone depletion, a long term decline of0.6% per year was evident in thestratospheric ozone concentrations at mid-latitudes (40°N – 50°N) – coincident withthe region of highest population density inEurope. A second coordinated European
Valid measurements ofstratospheric composition

2 2 V A M B U L L E T I N
campaign was mounted (SESAME – theSecond European Stratospheric Arctic andMid-latitude Experiment) during 1994–95aimed at investigating the springtime polarozone loss as well as the links between thepolar region and mid-latitudes. Thiscampaign was followed by a third Europeancampaign in 1998–99 (THESEO – the ThirdEuropean Stratospheric Experiment onOzone) with greater emphasis on the linksbetween the mid-latitude and sub-tropicalstratosphere. Some of the techniques used tomake these specialized analytical measure-ments are described in this article.
Measurement requirements
The concentration of ozone in thestratosphere is controlled by a complex set ofinterrelated reactions involving chlorinecompounds (including HCl, ClONO2,HOCl, and ClO), nitrogen compounds(including NO, NO2, N2O, HNO3 andN2O5) and hydrogen compounds (includingOH, H2O and CH4). The concentration ofall of these compounds in the lowerstratosphere is very low – for example ozoneis present at concentrations of 1-10 ppm.The most abundant chlorine reservoirspecies, HCl and ClONO2, are present ateven lower concentrations of around 1–3ppb. Furthermore, the distribution of thesecompounds is not uniform and, at a givenlocation, is changing with time as
compounds are advected by stratosphericwinds. The requirement is therefore forhighly sensitive multi-species monitoringtechniques with sufficiently high accuraciesand precision to test models of stratosphericprocesses and to yield new insights intofactors controlling stratospheric ozoneconcentrations. These measurements can bemade remotely from the ground, aircraft orballoons or can be made in-situ fromstratospheric balloons or high altitudeaircraft. NPL have developed both types ofinstrument for remote, long-term (weeks –months) groundbased measurements and forin-situ ‘snapshot’ measurements fromstratospheric balloons and aircraft.
Fourier Transform Infrared(FTIR) Spectrometry
The Fourier Transform spectrometerdeveloped for the remote sensing ofstratospheric composition operates bymeasuring the infrared spectrum of directsunlight transmitted through the atmospherein the 2.4 – 13.3 µm spectral region. Almostall heteronuclear molecules have vibration-rotation absorption bands in the mid-infraredregion of the spectrum and therefore manyimportant stratospheric compounds can beidentified, and quantified, from theseatmospheric spectra. The high resolution ofthe instrument (0.003 cm-1) allowsabsorption features to be discriminated in the
presence of strong interfering absorptions. Inaddition, the form of the spectral lineshapesobserved are dependent on the distributionof the absorber in the atmosphere. The highspectral resolution therefore allows theretrieval of altitude profiles of the compoundof interest in some cases. An example of theatmospheric spectrum of the R1 line of HCl,together with the retrieved profile of HCl,taken from measurements in Kiruna, Swedenduring March 1998, is shown in Figure 1.
Vertical column concentrations andprofiles are calculated using non-linearfitting routines employing sophisticated line-by-line spectral calculations. These routinestake into account the effect of the instrumentresolution, atmospheric pressure andtemperature profiles as well as spectral data.The spectral data are obtained from avalidated database.
During the EASOE campaign of1991/92 NPL measurements of HCl from asite in Northern Sweden1 together withsatellite measurements of ClO from theMicrowave Limb Sounder onboard theUpper Atmosphere Research satellite wereinstrumental in showing that the samechlorine activation processes were takingplace over the Arctic that were known to betaking place over the Antarctic.
During the SESAME campaign of1994/95 NPL measurements fromAberdeen, UK, during the period November1994 – March 1995 were used to detect, forthe first time using FTIR, stratospheric ClOwhen airmasses of polar origin passed overthe measurement site2. Also at this time theFTIR datasets were used to test newlydeveloped global three dimensional chemicaltransport models3. As part of the recentTHESEO campaign the NPL FTIR wasdeployed at Calar Alto Observatory inSouthern Spain (see Figure 2). The mainobjective of these latter measurements is toinvestigate mixing processes which link thesub tropical and mid-latitude stratosphere.
Validation of FTIRmeasurements
Established in 1991, the global Networkfor the Detection of Stratospheric Change(NDSC) is a network of monitoring stationsspanning the Arctic to the Antarctic. Eachmonitoring site is equipped with a range ofadvanced instruments, including lidar,FTIR, UV-Visible spectrometers/radiometers
C O N T R I B U T E D A R T I C L E S
Figure 1: (left) Atmospheric spectrum of HCl taken from Kiruna,Sweden during March 1998. (right) Number density profileretrieved from the same spectrum.

and millimetre wave radiometers for themeasurement of stratospheric composition.The aims of the network are to monitor longterm (10–20 year) trends in the compositionof the stratosphere in order to: provide anearly warning of significant stratosphericchange; to provide an independentcalibration of satellite datasets and toprovide datasets for the testing of models ofstratospheric chemistry and transport. NPLprovide the main UK contribution to thenetwork by validating the FTIRmeasurements made at NDSC sites. A majorcomponent of this validation programme hasincluded a series of side-by-side instrumentintercomparisons during the period 1992 –present. During this time the NPL mobileFTIR has been operated alongsideinstruments in Switzerland, Spitzbergen(Norway), Sweden, California, New Zealandand Canada. These intercomparisons haveshown that if rigorous checks are made onthe instrument performance then agreementof 1–3% can be achieved for most importantspecies measured by FTIR4. These figurescompare well with the estimated measure-ment uncertainties.
Near infrared diode laser spectrometry
The recent availability of narrowlinewidth, high power near-infrared diodelasers has allowed the development oflightweight and highly-sensitive gas sensors,which do not require cryogenic cooling and
can operate autonomously in hostileenvironments. Such sensors have enabledimportant scientific issues in stratosphericchemistry and transport to be addressed. Atunable diode laser absorption spectrometer(TDLAS) has been developed to makerapid, high sensitivity in-situ measurementsof trace atmospheric species. The TDLAShas been initially configured to make in-situmeasurements of stratospheric methaneconcentrations on board both short (6hours) and long (25 days) duration balloonflights (see Figures 3 and 4).
The instrument combines secondharmonic wavelength modulation spec-troscopy with a folded optical path of 100metres, specially designed to enabledetection of absorptions of less than one partin 106 (with a one second time constant).The key system features are thesemiconductor laser and detector, themultiple-pass optical cell, and the electroniccontrol system. The laser used is a fibre-coupled distributed feedback semiconductordevice. The high power (1 to 10 mW) andgood beam quality of the laser enable longoptical paths to be used. The detector usedis an extended wavelength range InGaAsdetector which operates out to 2.2 µm. Thisdetector monitors both the modulated lasersignal and the DC laser power level. TheDC power is used to normalise the secondharmonic signal, and enables directabsorption measurements to be made forcalibration purposes. The electronic systemincludes the laser control unit, the phase
2 3 V A M B U L L E T I N
C O N T R I B U T E D A R T I C L E S
Figure 2: The solar tracking telescope assembly (part of the NPL groundbased FTIR) as deployed atCalar Alto Observatory, Sierra des Filabres during THESEO, January – March 1999
Figure 3: A stratospheric balloon launch fromKiruna during the THESEO campaign
Figure 4: The TDLAS instrument

2 4 V A M B U L L E T I N
sensitive detection system and an optionaltelemetry unit. Overall system control anddata acquisition is performed by aruggedised miniature PC which alsoprovides on-board data storage.
The gas concentrations are derived bynon-linear least-squares fitting of a syntheticsecond harmonic spectrum to a recordedspectrum, using the entire lineshape toconstrain the deduced concentration.
The output signal from the instrument iscalibrated prior to each flight over a range ofpressures using gas standards preparedgravimetrically at NPL to a concentrationaccuracy of 1%. This calibration determinesthe absorption response factor which relatesthe output voltage of the detection system tothe optical absorption depth. During balloonflights the pressure inside the cell ismonitored using a pressure transducer whichgives 0.1 mbar accuracy, calibrated over atemperature range of +100°C to -54°C.Semiconductor sensors are used to measurethe temperature of the air in the cell with anaccuracy of 0.5°C.
Figure 5 shows some examples ofindividual second harmonic spectra of theR(5) transition of the 2nd overtone band ofmethane taken at different pressures (solidline). The synthetic fits to these spectra arealso shown (crosses). The noise level onthese spectra indicate a minimum detectableabsorption of less than 1x10⁻⁶ (for a onesecond time constant). Under typicalstratospheric conditions this corresponds toa methane detection limit of 1.4 ppb.Although the instrument has been initiallyconfigured to measure methane there are anumber of other chemical species that couldbe measured using this instrument.
The laser spectrometer has been flownon a series of balloon flights from mid- andnorthern-latitudes as part of THESEOduring 1998–99. Some preliminary resultsfrom these flights are given in Figure 6,which shows a comparison of the verticalprofile of methane measured at mid-latitudeswhich that measured inside the cold Arcticvortex. Measurements of tracer species likemethane play a vital role in the study ofatmospheric dynamics and transport.
Summary
The measurement of low concentrationsof important stratospheric trace constituentsinvolved in controlling ozone concentrations
is a very challenging measurement problem.Advanced optical instruments for the remoteand in situ measurement of a range of keycompounds at concentrations ranging from1 ppb – 1 ppm have been deployed successfullyas part of large international measurementcampaigns. The validation of thesemeasurements has involved carefulinstrument characterisation, the develop-ment and testing of sophisticated spectralfitting algorithms, the use of validatedspectral databases, and rigorous instrumentintercomparisons.
Acknowledgements
NPL acknowledges the support of theGlobal Atmosphere Division of theDepartment of the Environment, Transportand Regions and the Commission of theEuropean Union for support throughout theEASOE, SESAME and THESEOcampaigns as well as ongoing support forNPL’s contribution to the NDSC.
REFERENCES
1. Bell W et al, Column measurements of
stratospheric trace species over Are,
Sweden in the winter of 1991–92,
Geophys. Res. Lett., 21, no.13,1347, 1994.
2. Bell W et al, Measurements of stratos-
pheric chlorine monoxide (ClO) from
groundbased FTIR observations, J.
Atm. Chem., 24, 285, 1996.
3. Bell W et al, Groundbased FTIR measure-
ments of stratospheric trace species
from Aberdeen during winter and spring
1993/94 and 1994/95 and comparison
with a 3D model, J. Atm. Chem., 30,
119, 1998.
4. Paton-Walsh C et al, An uncertainty
budget for groundbased Fourier
transform infrared column measure-
ments of HCl, HF, N2O and HNO3
deduced from results of side-by-side
instrument intercomparisons, J. Geophys.
Res., 102, D7, 8867, April 20, 1997.
C O N T R I B U T E D A R T I C L E S
Figure 5: Measured and simulated second harmonic methanespectra at different pressures
Figure 6: Examples of the vertical profile of stratosphericmethane measured with the TDLAS instrument

2 5 V A M B U L L E T I N
Steve Foster,VickersLaboratoriesand JohnFrancis, LGC
This is the third in a series of casestudies of the business benefits of
VAM. Companies often perceive themerit in sharing their own stories of thetangible financial and technical benefitsof the VAM approach. It is hoped thatthese articles will provide enough detailto be of value beyond the industrialsector directly involved, to a wide rangeof businesses engaged in analyticalscience.
Summary
This case study details the response of acompany manufacturing chemical standardsto an analytical problem highlighted by itsquality control procedures.
One of the activities of Vickers
Laboratories has been the preparation and
QA of standard solutions for colour
measurement. A series of solutions failed
their QA checks and the incident was
investigated. Initially, the pattern of errors
indicated a systematic bias in either the
production or analytical (QA) phase. The
company first checked the production
process and found it to be operating
satisfactorily. It then turned to the relatively
straightforward analytical procedure, and
traced the fault to the use of unsuitable parts
in a colour comparator instrument. Having
rectified the problem, the company was able
to discontinue expensive product re-testing,
adjustment and re-formulation work.The study illustrates that good quality
control and records management (VAM
principle 6) were important in detecting ananomaly even in a fairly simple technicalprocess. The company was able to undertakeproactive remedial action, minimisingcustomer concern. The value of inter-laboratory comparison work (VAM principle5) is highlighted by the success of acollaborative approach here in not merelyresolving the problem but opening thecompany to methodological improvement,reducing analysis time.
Business background
Vickers Laboratories is a small privatelyowned company with 25 employees and aturnover close to £1.7m. There are fourbusiness areas:• re-packing of bulk chemicals• manufacture of a range of monomers
used to produce contact lenses, and soldunder the trade name Optomer
• manufacture of solutions for industrialend use (typically to non-chemicalcompanies that need effect chemicals)
• manufacture of precision solutions foron-line water quality testing at treatmentworks (including tests for chlorine, ironand aluminium flocculants, and tests forimpurities such as ammonia, nitrate,phosphate and manganese).
Technical background
Colour measurements can be aconvenient and efficient means for thecharacterisation of an analytical sample or amanufactured product. It may be necessaryto show that the colour of a product fallswithin its specifications, or that a reactiveproduct has the required potency, madevisible through a colour change. Samplesmay be graded according to their colours, ora colour reaction may be carried out toprovide specific chemical information. Theterm colour measurement can imply a simplevisual comparison with standard colours, ormeasurements made electronically and oftenexpressed in terms of colour scales ratherthan transmittance or absorbance units.
Colour in water supplies is an importantparameter aesthetically, but also because it isan indicator of organic content that mayinterfere with the chlorination process. TheHazen scale is widely used for thecomparison of coloured waters, such asenvironmental samples. Hazen solutionsconsist of a prescribed mixture of inorganicchemicals, and, although established for overa century (Hazen A, ‘A new color-standardfor natural waters’, Am Chem J, 14:300-310,1892), are still a feature of internationalstandards. Further details may be found inHongve D and Åkesson G, ‘Spectrophotometricdetermination of water colour in Hazenunits’, Water Research, 30:2771-2775, 1996.
Colour measurements can be a convenient andefficient means for thecharacterisation of an
analytical sample
Colour comparator instruments allow thevisual comparison of water samples with discsof standard colour intensity, expressed inHazen or alternative units. The sample isbrought into the field of view along with oneor more standard filters, with which it can beeither matched or compared. The filters aresupplied as a graded series, and are built into acomparator disc for convenience of handlingand alignment. The accuracy and precision ofvisual colour determination are improved ifthe light source and angle of vision arestandardised; sound instrument design shouldensure that even a simple and inexpensivecolour comparator meets these requirements.
The problem
Vickers Laboratories manufacturestandards for colour comparisons, the colourintensity being expressed in Hazen units.These standards consist of potassiumhexachloroplatinate and cobalt chloride,dissolved in dilute hydrochloric acid. Amaster batch (500 Hazen units) is firstprepared according to ASTM and British
C A S E S T U D Y
VAM in the chemical standards industry

Standards by mixing weighed orvolumetrically determined amounts of thesechemicals according to the prescribed recipe.The master batch is then diluted with dilutehydrochloric acid to produce the full rangeof standard solutions.
During a particular period in themanufacture of Hazen standard solutions,successive batches of the solutions failedquality control checks, which were beingperformed with a colour comparator againsta standard coloured glass disc. The qualityassurance system at Vickers Laboratoriesquite rightly regarded repeated failures as amatter for investigation rather than simplyre-testing, adjustment or re-formulation ofthe master batch. An Incident Report Formwas accordingly completed, and a detailedinvestigation was begun.
Scoping the investigation
There were many potential sources ofvariability relating to both the productionand analytical aspects of preparing theHazen standards, but the incidentinvestigation nevertheless had to be cost-effective. It was therefore necessary toprioritise troubleshooting activities, and sothe pattern of QC failures was examined as aguide to their underlying cause.
Six standard solutions were preparedwith target values spread across the range 10to 200 Hazen units; all were discovered to be5 Hazen units weaker than their respectivetarget values when tested with the colourcomparator. Thus, all solutions fell outsidethe product specification (± 2 Hazen units)in the same direction. Random variationssuch as pipetting errors would not explainsuch a systematic deviation, and so theinvestigation subsequently concentrated onsystematic sources of variability.
Troubleshooting theproduction process
Fresh Hazen standard solutions werenext prepared directly from the rawmaterials, and compared with thoseproduced by dilution from the 500 Hazenunit master batch. These two methods ofmanufacture produced solutions withidentical Hazen values. It was concludedthat the indirect method of manufacture, bydilution from a master batch, is as valid asthe direct method and therefore that the QA
problem was unlikely to be associated withthe liquid handling procedures.
Attention was then turned on the rawmaterials used to produce Hazen standardsolutions. The control of raw materials hasoften been a weak point in qualitymanagement systems, and part of theexplanation for this is that upstreamproduction processes are not transparentwhen materials are supplied by oneorganisation to another. The productionconditions for chemical raw materials,whether processed continuously or inbatches, inevitably vary (albeit withinprescribed tolerances) over time and place.The customer is made aware of this at thepoint of supply through a batch or lotnumber; however, sometimes more than onenumber is given, and the informationconveyed by each number is not necessarilymade clear. To add to the confusion, mostdownstream processes require several rawmaterials obtained from different sources.
Raw materials control may be enforcedthrough the quality management system ofthe producer, provided that the upstreamprocesses can be checked and audited bydownstream users. Vickers Laboratoriesinvestigated batch-to-batch variation byworking backwards from its records of thebatch numbers used to produce its Hazenstandard solutions. These records enabledthe company to obtain the appropriatecertificates of analysis from its suppliers. Onthis occasion, no association was foundbetween the data provided on the certificatesof analysis and the non-compliant Hazenstandard solutions.
Troubleshooting the analysis
A visually read colour comparisonmethod is disarmingly straightforwardcompared to most analytical methods. Thepossible sources of bias can be groupedaround the operator and the instrument.
In this investigation, no operator biascould be demonstrated. Even colourblindness did not prevent one operator fromobtaining results in agreement with theconsensus values derived from a group ofoperators performing the same test.
The comparator was of robustconstruction, but there was a question as towhether the filters contained in thecomparator disc had remained stable afterprolonged use. To investigate this possibility,
Vickers Laboratories bought a newcomparator disc with a calibrationcertificate. The results obtained with the old and new comparator discs were inagreement, which demonstrated that the olddisc was still fit for purpose.
Since all sources of variability whichwere evident to the investigators at the timehad now been exhausted, a full instrumentcomparison was carried out to confirm thatthe deviation was real. Vickers Laboratoriescontacted a specialist instrument manu-facturer, Tintometer, for an evaluation of thelatest model of high performance colouranalyser. The results obtained for the Hazenstandard solutions with the Tintometerinstrument were within the specification of ±2 Hazen units applicable to each targetvalue. Results obtained at this stage with aUV spectrophotometric method used byYorkshire Water Laboratories were also inagreement with the specification. The sourceof the problem was therefore confirmed tobe with the original colour comparatorinstrument, since both alternative methodshad given results in accordance with thevalue predicted from the production recipe.
Once the source of bias had been re-emphasised for the investigators in this way,it was relatively straightforward to examinethe history of the visual colour comparator,because there was a full instrument logincluding details of accessory parts. The logrevealed that sample tubes of incorrectoptical path length had been purchased, andthe design of these incompatible partsaccounted for the pattern of bias observedduring QA procedures. This source of biaswas not considered during the earlier stagesof the investigation, but it was neverthelesstraced eventually by the application of areasoned investigative approach.
Remedial action and further developments
The company had consideredcircumventing the non-compliance bydeveloping a modified formulation for itsHazen standard solutions. The effects ofvarying the concentrations of all the rawmaterials were considered, and a re-optimised formulation containing extrapotassium hexachloroplatinate wasidentified. It was fortunate that a solution tothe QA problem was found and that thisalternative product was never required, since
2 6 V A M B U L L E T I N
C A S E S T U D Y
2 7 V A M B U L L E T I N
the cost of the extra potassium hexa-chloroplatinate was significant.
Unfortunately, the QA problem alsobecame a problem for the company’scustomers. Deliveries of Hazen standardsolutions had been made which were up to 25%too strongly coloured. When the customersreceived the new, accurately preparedsolutions, they noticed the difference andcomplained. Vickers Laboratories respondedproactively by contacting all its customersand conducting a product recall. It had alsolearnt lessons for the future and in particularthe need to use equipment which has beentested to ensure that it is fit for purpose (inline with the second VAM principle).
This incident investigation led to newthinking on the analytical requirement forquality control of Hazen standard solutions.Colour comparison methods are usefulbecause they acquire direct analytical data
about colour as it is perceived by consumersand non-specialists. However, such methodsdo not necessarily provide fundamental dataexpressed in terms of optical wavelengths.Contacts between Vickers Laboratories and Yorkshire Water Laboratories hadrevealed that the latter was using UVspectrophotometry for the quality control ofHazen standard solutions. It was decidedthat QA of Hazen standard solutions couldbenefit in terms of both cost and qualityfrom the objectivity and speed of thespectrophotometric technique, whichexpresses colour in terms of its componentwavelengths. A range of Hazen standardsolutions were analysed by colourmeasurement and by wavelength scanning in the UV spectrophotometer. This con-firmed that particular absorption propertiesof the solutions were proportional to colour expressed in Hazen units. The
Hazen standard solutions are now testedroutinely by UV spectrophotometry.
The business benefits of VAM
An important difference between
analysis in a production environment and a
regulatory environment is that a producer
can influence both production and analytical
parameters, whereas an analyst working to
regulatory limits must accept the given
sample. (This also applies to a production
analyst if the analytical work has been
outsourced.) The VAM programme
recognises a need for flexibility in the choice
of quality management systems appropriate
to the role of analysis in a business.
Recognised formal systems in the BS EN
ISO 9000 series, or well-designed in-house
systems, support a coherent approach to
quality management of all the business
processes of the organisation.
In the present case, suspicion fell first on
the production process and only later on the
relatively simple analytical procedure. A
collaborative approach, in the spirit of the
fifth VAM principle, confirmed that the
problem lay with the analytical procedure
and led to a solution.
In accordance with the VAM programme,
Vickers Laboratories was operating a quality
system which responded to circumstances
and encouraged improvement. The
successful completion of an incident
investigation in response to repeated QC
failures eliminated the costs associated with
adjustment and re-testing of product. Plans
for a re-developed and more costly product
were also rendered unnecessary.
The incident investigation provided a
sound experimental basis for customer
advice, much preferable to a customer
discovering the problem at a later stage,
publicising it and forcing the manufacturer
to defend its product without itself having a
full understanding of the facts.
The VAM programme stresses the
importance of definition of the analytical
requirement. The quality control problem
encountered by Vickers Laboratories helped
to clarify the analytical requirement by
challenging the existing methodology. Inter-
laboratory comparison work then led to the
adoption of a method better suited to the
analytical requirement, with benefits in
terms of both cost and quality.
C A S E S T U D Y

Vicki Barwick,LGC
This is the sixth article in a series of short papers introducing
basic statistical methods of use inanalytical science.
Introduction
The previous articles in this series havefocused on a number of statistical techniqueswhich are of use to the analyticalchemist1,2,3,4,5. Many of the techniquesdiscussed are essential also for the evaluationof measurement uncertainty. The aim of thisarticle is to give a brief introduction to theconcepts of measurement uncertainty andthen to focus on one of the key stages ofuncertainty evaluation – the identification ofthe contributory sources of uncertainty foran analytical method.
What is measurementuncertainty?
The International Organisation for
Standardisation (ISO) defines measurement
uncertainty as6:
“A parameter associated with the result of ameasurement, that characterises the dispersion ofthe values that could reasonably be attributed tothe measurand.”
A more straightforward definition is,
“The part of the result given after the ±.”Analytical chemists are generally familiar
with the concepts of error and systematic
and random effects. Error is defined as the
difference between the test result and the
accepted reference or ‘true’ value7. Random
error is the component of the error which, in
the course of a number of test results
obtained for the same sample, varies in an
unpredictable way7. Systematic error on the
other hand is the component of the error
which remains constant or varies in a
predictable way7. These definitions highlight
the key differences between error and
uncertainty. Whilst error is a differencebetween the result and the true value,
uncertainty is a range which encompasses
the true value. In addition, uncertainty
combines both random and systematic
effects into a single overall measure of the
reliability of the result. Therefore, when we
quote a result such as, “the amount of lead in
the paint sample is 22.7 ±4.8 mg kg-1”, we are
saying that, after taking into account all possible
sources of uncertainty for the procedure
used to determine the lead content, we believe
the true lead content to be somewhere
between 17.9 and 27.5 mg kg-1Note 1.
Evaluating measurementuncertainty
The evaluation of measurementuncertainty is discussed in detail in the ISOGuide to the Expression of Uncertainty inMeasurement8. This guide has beeninterpreted for analytical chemistry byEurachem9. The key stages in uncertaintyevaluation are illustrated in Figure 1 and abrief summary follows.
Stage 1 Specify what is being measured
The first stage is to write down acomplete statement of what is beingmeasured. For example, is it the total amountof lead in paint that is required, or theamount that can be extracted into a stomachacid simulant? The mathematical expressionwhich will be used to calculate the result ofthe analysis should also be written down. Atthis stage a flow diagram illustrating the keystages in the method may be useful. This willhelp with stage 2 of the procedure.
Stage 2 Identify sources of uncertainty
The aim of this stage is to produce astructured list of all the possible sources ofuncertainty for the method. At this stage it isnot necessary to be concerned with how theindividual uncertainties might be quantified.A useful starting point for this process is the mathematical expression for the resultwhich was written down in stage 1. Theuncertainties associated with the parametersin this expression will contribute to theuncertainty in the final result. However, bearin mind that there are nearly always othermethod parameters which contribute to theuncertainty but do not appear in themathematical expression (e.g. extractionconditions, matrix effects, environmentalfactors etc). A flow diagram illustrating themain stages of the method will help in theiridentification. A useful approach toidentifying sources of uncertainty is aprocedure used in business management, i.e.cause and effect analysis. This is discussed indetail later in the article.
Stage 3 Quantify uncertainty componentsOnce all the uncertainties have been
identified they must be quantified. However,it is generally unnecessary to try to evaluateall of the components separately. It is oftenpossible to plan experiments which evaluatethe performance of the method as whole, forexample precision and recovery studies.With careful planning such experiments can
2 8 V A M B U L L E T I N
S T A T I S T I C S I N C O N T E X T
Measurement uncertainty andcause and effect analysis
Figure 1: The uncertaintyestimation process
Note 1: An uncertainty statement must always be accompanied by an indi-cation of the level of confidence. This will be discussed in more detail later.

2 9 V A M B U L L E T I N
be used to evaluate a number of sources ofuncertainty simultaneously. This approach isdiscussed in detail elsewhere10, 11, 12. Inaddition, some components will not make asignificant contribution to the combineduncertainty. Indeed, unless there are a largenumber of them, uncertainty componentsthat are less than one third of the largestuncertainty need not be evaluated in detail.
Stage 4 Convert uncertainty estimates
to standard deviationsDepending on how they were evaluated,
the uncertainty estimates obtained in stage 3may well be expressed in different forms(e.g. standard deviations, confidenceintervals, rectangular distributions). Beforethe combined uncertainty can be calculatedfrom these individual contributions, theymust all be converted to the same form. Thecombined uncertainty for the method will beexpressed as a standard uncertainty. This issimply an uncertainty expressed as astandard deviation. The individualuncertainty components must therefore alsobe expressed as standard deviations. Thecalculation of standard deviations wascovered in the first article in the series1. Therules for converting different types ofuncertainty statements to standarddeviations are given in the ISO andEurachem uncertainty guides8, 9.
Stage 5 Calculate the combined uncertainty
Once all the individual uncertainty
contributions have been converted to
standard uncertainties, they are combined
using standard rules for combining variances
(remember that variance is simply the
standard deviation squared). Figure 2
illustrates the simplest rule for combining
uncertainties. If u1 and u2 represent the
standard uncertainties associated with two
independent parameters which affect the
result, the combined uncertainty, uc, is
calculated from the square root of the
sum of their squares (commonly known
as calculating the ‘root sum of squares’).
The diagram also illustrates why small
uncertainty components will not make a
significant contribution to the combined
uncertainty. If u1 is much greater than u2
then uc will be approximately equal to u1.
The exact form of the expression used to
calculate the combined uncertainty depends
on the relationship between the result and
the individual uncertainty contributions.
The relevant expressions are given in the
Eurachem Guide9.
Stage 6 Calculate the expanded uncertaintyThe final stage of the process is to
calculate the expanded uncertainty. This is
equivalent to calculating a confidence
interval1, and is required to give increased
confidence that the uncertainty quoted will
encompass the true value. The expanded
uncertainty is obtained by multiplying the
combined uncertainty obtained in stage 5 by
a coverage factor, k. For approximately 95%
confidence, k is usually taken as 2.
Cause and effect analysis – a useful tool in uncertainty
estimation
The identification of sources ofuncertainty (stage 2) is one of the key stages inuncertainty evaluation. Without a detailed listof the possible sources of uncertainty for amethod it will not be possible to produce acomplete uncertainty budget. One approachto obtaining this list is by using cause andeffect diagrams (also known as ‘fishbone’diagrams because of their shape). Theprinciples of the construction of cause andeffect diagrams are described fully elsewhere13,and detailed discussions of their applicationto uncertainty estimation, with examples,have been published10,14. The remainder ofthis article describes the construction ofcause and effect diagrams for uncertaintyestimation, illustrated using the example of amethod for the determination of all-transretinol (vitamin A) in milk formula forinfants. A flow diagram illustrating the mainstages of this method is given in Figure 3.
S T A T I S T I C S I N C O N T E X T
Figure 2: Combininguncertainties
Figure 3: Flow diagram illustrating the main stages in the methodfor the determination of all-trans retinol in infant formula

Constructing a cause and effect diagram
A cause and effect diagram consists of ahierarchical structure of ‘causes’ which feedinto a single outcome or ‘effect’. In terms ofuncertainty estimation, the ‘effect’ is theuncertainty in the result obtained from theanalysis. The ‘causes’ are the uncertaintiesassociated with the individual stages of themethod, as these will all contribute to theuncertainty in the result. The main stages inthe construction of a cause and effectdiagram are outlined below.(i) Write the complete equation used to
calculate the result, including anyintermediate calculations. The para-meters in the equation form the mainbranches of the diagram. For the exampleof the determination of all-trans retinolin infant formula, the equation used tocalculate the final result (Call-trans in µg100 g-1) is shown as equation (1):
Call-trans =AS x VF x CSTD x 100 (1)
ASTD x WS
where AS is the peak area recorded for
the sample solution; ASTD is the peak
area recorded for the standard solution;
VF is the final volume of the sample
solution (ml); WS is the weight of sample
taken for analysis (g) and CSTD is the
concentration of the standard solution
(µg ml-1).
The first stage in the construction of
the cause and effect diagram is shown in
Figure 4.
(ii) Consider each branch in turn and add
additional branches representing effects
which will contribute to the uncertainties
in the parameters identified in (i). For
example, the uncertainty in a weighing
operation will have contributions from
the balance precision and calibration.
Branches representing these terms
should therefore feed into the main
branch representing that weight.
(iii) For each branch added in (ii), add
further branches representing any
additional contributory factors.
Continue the process until the effects
become sufficiently small.
The relevant cause and effect diagram
for the determination of all-trans retinol
is shown in Figure 5.
Refinement of the cause andeffect diagram
The cause and effect diagram in Figure5 can be considered complete, in as much asit contains all the possible sources ofuncertainty for the method. However, thediagram is quite complex and a number ofterms are duplicated. For example, the
branches representing uncertainties indetector response, integration, injectionvolume and HPLC performance appearfeeding into both the sample peak area andstandard peak area branches. In addition,there are a number of branches representingvarious precision contributions. Refinementof the diagram involves the resolution ofduplicate terms and rearrangement of the
3 0 V A M B U L L E T I N
S T A T I S T I C S I N C O N T E X T
Figure 4: First stage of cause and effect diagram
Figure 5: Complete cause and effect diagram
Figure 6: Refined cause and effect diagram

3 1 V A M B U L L E T I N
S T A T I S T I C S I N C O N T E X T
branches to clarify contributions and grouprelated causes. This process results in asimplified cause and effect diagram which canbe used as a check-list to ensure that all sourcesof uncertainty have been considered in theuncertainty budget. A number of cases ariseand the following rules should be applied.• Cancelling effects: remove both
instances from the list. For example, in aweight by difference, two weights aredetermined and both are subject to thebalance zero bias. This bias will cancelout of the weight by differencecalculation and can therefore beremoved from the diagram. In thisexample, the same auto-injector is usedto inject both the sample and thestandard onto the HPLC. Any bias inthe amount injected will affect bothequally and therefore cancel.
• Similar effects, same time: combineinto a single input. For example, theprecision associated with a number ofoperations can be combined into anoverall ‘precision’ term representing therun-to-run variability of the method as awhole. In Figure 5, a number of termsrelating to precision appear (WS
precision, CSTD precision etc). Theseindividual precision terms willcontribute to the overall precision of themethod. They can therefore conve-
niently be grouped on a single mainbranch representing the precision of themethod as a whole (see Figure 6). Inaddition, there are a number of branchesrepresenting parameters which affect theamount of the analyte which may beextracted from the sample (saponi-fication conditions, extraction conditionsetc). Such terms can be grouped on asingle branch representing theuncertainty associated with the recoveryof all-trans retinol from the sample. Thisis particularly useful as precision andrecovery data are commonly availablefrom method validation studies and suchdata can be used as the basis of theuncertainty estimate.
• Similar effects, different instances:re-label. It is common to find similarlynamed parameters in the diagram whichactually represent different instances ofsimilar effects. These must be clearlydistinguished before proceeding. Forexample, there may be several instancesof parameters such as ‘pipettecalibration’ which refer to the calibrationuncertainties associated with differentpipettes. It is important to be clear aboutwhich stages in the method theseparameters refer to.Figure 6 shows the refined cause and
effect diagram for the method for the
determination of all-trans retinol. Twobranches, Rm and Rs, warrant furtherexplanation. These branches representdifferent contributions to the uncertaintyassociated with recovery. Rm represents thebest available estimate of the recovery for themethodNote 2. Ideally it is evaluated from theanalysis of a certified reference material(CRM). If none is available, alternativessuch as spiked samples are used. However,whatever the reference point used todetermine Rm, the results will only representthe recovery observed for a particular sampleor limited range of samples. In reality, themethod scope will often cover a range ofsamples covering different matrices and/oranalyte concentrations. The recovery for thetest samples may well vary from thatobserved for the sample(s) used to evaluateRm. This is an additional source ofuncertainty which needs to be taken intoaccount. It is represented in the cause andeffect diagram by the Rs branch.
Use of a cause and effect diagram in uncertainty
evaluation
Having completed and refined the causeand effect diagram, how can it be used in anuncertainty study? The cause and effectprocess results in a detailed picture of the
Figure 7: Information used in the evaluation of the measurement uncertainty for the determinationof all-trans retinol in infant formula
Note 2: Recovery is defined as the ratio of the observed value to thereference value.

3 2 V A M B U L L E T I N
S T A T I S T I C S I N C O N T E X T
sources of uncertainty that need to beconsidered in the uncertainty budget. Notethat this does not mean that they will allhave to be quantified separately. Forexample, precision and recovery studies cancover many sources of uncertainty. Therefined cause and effect diagram can be usedas an aid to experimental design, and as acheck list to make sure that all sources ofuncertainty have been accounted for.Careful planning of experiments cansignificantly reduce the amount of workrequired. If a precision study is planned sothat as many of the experimental parametersas possible are varied during the study, thenthe individual sources of variability in themethod will not require separate evaluation.If information is already available for amethod, for example from validation studies,it can be compared with the cause and effectdiagram to determine what additional data ifany are required.
The uncertainty for the all-trans retinol
method discussed here was evaluated from
precision and recovery studies, ruggedness
testing12, data produced by the suppliers of
the balances, volumetric glassware and
standards used and data previously
published in the literature. Figure 7 indicates
the information used in the evaluation of
each source of uncertainty.
Conclusions
Cause and effect diagrams are a useful
tool in uncertainty evaluation. They are easy
to construct and allow the analyst to obtain a
clear picture of the sources of uncertaintyand the relationship between them. Suchdiagrams are a useful aid to experimentaldesign and allow the coverage of existingdata to be readily established.
A further important advantage of thecause and effect approach is that it helps toensure that all sources of uncertainty havebeen correctly accounted for in theuncertainty budget, i.e. none have beenmissed and none have been counted morethan once.
REFERENCES
1. Statistics in context: Exploring and sum-
marising the results of measurements,
VAM Bulletin, 16, 20–22, Spring 1997.
2. Statistics in context: Significance testing,
VAM Bulletin, 17, 18–21, Autumn 1997.
3. Statistics in context: Regression and
calibration, VAM Bulletin, 18, 18–21,
Spring 1988.
4. Statistics in context: Missing values,
outliers, robust statistics and non-
parametric methods, VAM Bulletin, 19,
22–27, Autumn 1998.
5. Statistics in context: Analysis of
variance (ANOVA), VAM Bulletin, 20,
28–31, Spring 1999.
6. International vocabulary of basic and
general standard terms in metrology,
ISO, Geneva, Switzerland, 1993.
7. ISO 3534-1 Statistics – Vocabulary and
symbols – Part 1: Probabil ity and
general statistical terms, ISO, Geneva,
Switzerland, 1993.
8. Guide to the expression of uncertainty in
measurement, ISO, Geneva, Switzerland,
1993.
9. Eurachem: Quantifying uncertainty in
analytical measurement, Laboratory of
the Government Chemist, London, UK,
1995.
10. Estimating uncertainty: reconciliation
using a cause and effect approach, S. L. R.
Ellison, V. J. Barwick, Accreditation and
Quality Assurance, 3, 101–105, 1998.
11. Estimating measurement uncertainty
using a cause and effect and recon-
ciliation approach Part 2: Measurement
uncertainty estimates compared with
collaborative trial expectation, V. J.
Barwick, S. L. R. Ellison, Analytical
Communications, 35, 377–383, 1998.
12. Protocol for uncertainty evaluation from
validation data, V. J. Barwick, S. L. R.
Ell ison, VAM technical report no.
LGC/VAM/1998/088 (available on VAM
website).
13. ISO 9004-4, Total Quality Management
Part 2. Guidelines for quality improve-
ment, ISO, Geneva, Switzerland, 1993.
14. Using validation data for ISO
measurement uncertainty estimation.
Part 1. Principles of an approach using
cause and effect analysis, S. L. R.
Ellison, V. J. Barwick, Analyst, 123,
1387–1392, 1998.
Eighty chemistry teachers descended onLoughborough University at the end of
June to attend the Teaching ChemistryToday Forum. This was the third teachers’forum organised by LGC, this time withLoughborough University and AstraZenecaand with sponsorship from the RSCAnalytical Chemistry Trust Fund and theVAM programme.
The forum’s aims were to give teachers anopportunity to see analytical chemistry in
action and to understand the principle of fitfor purpose analytical measurements in thework place. Dr Elizabeth Prichard set thescene for the two days by stressing why thereis a need for analytical chemists with a goodknowledge of the accuracy and precision ofmeasurements. Dr Tim Catterick borrowedan expression from Shakespeare when he gavea talk entitled ‘Much ado about almostnothing’. He explained the excitement inanalytical chemistry of being able to measure
almost nothing with an appropriate degree ofaccuracy and precision. Dr ChristopherBurgess gave an entertaining talk on datahandling showing the value of pictorialrepresentation of data. It helped stimulate newideas for teachers to use in the class room. DrKay Stephenson’s (Salters Science Teacher ofthe year) talk generated a lot of discussionabout the teaching of chemistry in the futureand the problems that would have to be faced,e.g. the chemistry curriculum is A-level is
V A M I N E D U C A T I O N
Teaching chemistry today

3 3 V A M B U L L E T I N
V A M I N E D U C A T I O N
3 3 V A M B U L L E T I N
overcrowded and needs to be slimmed down. Sheoutlined how she had used the Basic LaboratorySkills pack (see VAM Products and Services) toallow students to discover for themselves theadvantages of using more accurate dilutiontechniques when conducting an investigationinto the effect of concentration on pH. This hadenabled them to draw conclusions from theirexperiments which previously had not been possible.
The teachers particularly enjoyed thechance to put on a lab coat and do somepractical analytical chemistry. The practicalsession was based on the scenario where a deadbody had been found in a nearby river andthe teachers had to perform a set of analyses todetermine whether the cause of death was an
accident or something more sinister. The rangeof teachers skills was wide, some teacherscould talk knowingly about the practicalproblems of using Gas Chromatography andHigh Performance Liquid Chromatographywhereas other teachers had never set up aTLC. They found that putting the theoryinto practice and getting analyticalmeasurements fit for purpose required thedevelopment of good laboratory skills.
The visit to AstraZeneca where theytackled another analytical problem was an eyeopener to many teachers. A new set oflaboratory buildings had just been completed –we were there before most of the staff hadmoved in! Brand new equipment, automation,
remote controlled instrumentation so youdon’t even have to leave your desk to change asetting, the list goes on and on. For manyteachers, this was utopia and far removed fromthe conditions in which they have to work. Yetall the staff who worked at AstraZeneca, fromthe Chief Executive to the most junior memberof staff, had all got one thing in common. Theyhad all been to school and many had chosen acareer in chemistry because of the good qualityscience teaching they had received at school.
It was a successful forum for allconcerned and it opened the eyes of manyteachers to the importance of analyticalchemistry in today’s world and the need forvalid analytical measurements.
Sixty three schools and colleges (centres)took part in the 1999 Proficiency
Testing competition and fifty five centres(261 groups of students representing over1000 individuals) returned completed scriptsby the deadline set.
We made the assessment of how wellcentres performed on the basis of thestatistical analysis of the final results (usingZ-scores). This is how real Proficiency Testingschemes are run and was considered to bethe fairest method.
Evidence of good laboratory practiceand comments on uncertainty associatedwith the practical, highlighted in the reports,were taken into consideration in the secondphase of the assessment when selecting awinner and runners up.
Regrettably some groups obtained poorZ-scores; common causes of poor resultsincluded:• not allowing for the dilution of the sample• transcription errors• calculation errors• incorrect standardisation of the sodium
hydroxide solution• incorrect use of pipettes• adding excess indicator – based on the
philosophy that the more indicator youadd, the better the result!In the competition students were encouraged
to give their ideas on the uncertaintiesassociated with the analysis. The estimation ofuncertainty in analytical chemistry is a complexproblem and this applies even to titrations.In fact an acid/base titration can have over10 stages where an uncertainty can be intro-duced into the procedure. It was encour-
aging to discover that a number of studentgroups appreciated this problem. Somegroups even managed to put a figure to thesize of the uncertainty due to differentfactors in the procedure.
The winning centre
This year’s winning centre was JohnLeggott College (Scunthorpe). In this centreall the 39 students followed the procedurewhich corresponds most closely to what LGCanalysts consider to be ‘best practice’ andconsequently achieved excellent Z-scoresand wrote good reports showing a good under-standing of analytical procedures and theirassociated uncertainties. Mr Neil Barker (headof chemistry) on behalf of the college receivedfrom Dr Elizabeth Prichard (LGC) the prizeof £100 and a framed ‘winner’s’ certificatesigned by the Chief Executive of LGC, andthe Director of the Nuffield Foundation.
There were three other centres, whoperformed excellently but in each case theirperformance was marred by a single mistake.These centres were awarded ‘runners-up’prizes. Taunton School, The HulmeGrammar School and Winchester Collegeeach received a cheque for £50 and a signedand framed ‘runner’s-up’ certificate.
Our thanks to Somerset ScientificServices; LGC at Runcorn and LGC atTeddington who hosted the presentation ofthe prizes to the runners up.
The future
It is our intention to run the proficiencytesting competition for another three years.
Our target is to get 100 centres a year toparticipate in the competition. Preference willbe given to new centres or centres that haveonly taken part in one previous competition.That way, we hope to make contact with asmany centres as possible. We will widen thescope of the competition to include Scottishand possibly international centres. We willwork with Nuffield Science to identify andtarget centres with significant numbers of A-Level Chemistry students who would benefitfrom taking part in the competition.
Sponsorship
The VAM programme along with Kodak
Research and Development, Harrow and
Nuffield Science has sponsored the
competition for the last three years.
However, we are looking for sponsors (along
with LGC and Nuffield Science) to keep the
competition running for the next three years.
This would be suitable for a company:a) interested in becoming more involved in the
teaching of chemistry in the class room, or b) increasing the awareness of the company
name amongst the next generation ofscientists.If you think you might be interested in
sponsoring the Proficiency Testingcompetition, then for further informationplease contact:
Pete Houlgate, LGCTel: 020 8943 7457Fax: 020 8943 2767Email: [email protected]
Schools PT competition

R E F E R E N C E M A T E R I A L S U P D A T E
3 4 V A M B U L L E T I N
LGC’s Office of Reference Materials(ORM) continues to supply an
expanding array of reference materials inorder to enhance the analytical capability oflaboratories worldwide. The fifth edition ofthe catalogue is now available. This providesa single source for reference materials andcontains details of the materials available fromthe world’s leading producers. Over 2500materials are listed with details of certifiedconstituents or properties. A wide variety ofsample matrices and analytes is covered asmay be seen from the contents list.• Biomedical – Blood, Serum & Plasma,
Urine, Bone & Tissue, Hair, Purity,Miscellaneous
• Environment – Waters, Soils,Sediments, Sludges, Ash & Particulate,Rocks, Clays & Minerals, Plants
• Food & Agriculture – Dairy Products,Cereal, Meat, Fish, Vegetation, Alcohol,Fertilisers, Miscellaneous
• Industrial Raw Materials & Products –Coals & Cokes, Oils, Ores, Refractories& Carbides, Cement, Glass & Ceramics,Metals, Cosmetics, Miscellaneous
• Occupational Hygiene – Filter Media,Paint, Asbestos, Miscellaneous
• Inorganic & Organic Standards –Elemental Analysis, SpectrometricSolutions, Chromatographic Standards,
Pesticides, Stoichiometry, Organo-Metallic Compounds, InorganicSolutions, Inorganic Compounds,Organic Solutions, Organic Compounds
• Thermal Properties – Enthalpy & HeatCapacity, Melting, Freezing & TriplePoints, Flash Point, Miscellaneous
• Particle & Surface Properties – ParticleSize, Surface Area, Miscellaneous
• Optical Properties – Molecular Absorption& Luminescence, Refractive Index,Miscellaneous
• Miscellaneous Physical Properties – IonActivity, Electrical Properties, Viscosity,Polymeric Properties, MiscellaneousContact LGC’s Office of Reference
Materials (ORM) for a free copy of the newcatalogue (Issue 5).
LGC is working on the preparation of anumber of candidate reference materials (seetable). It is hoped some of these will beavailable before the end of the year.
LGC’s Reference Materials AdvisoryService (REMAS) will be pleased to offerfree advice if you have problems locating thedesired material (see back cover).
ORM staff will be pleased to discuss ref-erence materials and meet potential customersat the following conferences and exhibitions:
ILMAC, Switzerland – October 1999CIA, Singapore – December 1999Pittcon, New Orleans – March 2000
Reference materials updateMaterials under preparation
Matrix Certified constituent
Orange juice Degrees brix
Saccharin Purity
BHT Purity
Dairy cattle feed Proximates & nutrient elements
Poultry feed Proximates & nutrient elements
Strawberry leaves Nutrient & contaminant elements
Soft drink Food colours
Processed cheese Proximates
Processed meat Proximates & hydroxyproline
Sterilised cream Proximates & nutrient elements
Rice pudding Proximates & nutrient elements
Many readers of the VAM Bulletin willknow that the current VAM
programme started in October 1997 and willbe completed in September 2000. Athoughthe next (fifth) programme is not scheduledto start until October 2000, we are alreadywell into its formulation. On behalf of DTI,LGC is leading on the development of thechemical and biochemical components ofthe programme. Central to this exercise willbe the need to ensure that, as an integralcomponent of the National MeasurementSystem, the new programme will continue to
meet the overall objectives of:• enabling individuals and organisations
in the UK to make measurementscompetently and accurately, and todemonstrate the validity of suchmeasurements
• co-ordinating the UK’s measurementsystem with those of other countries.The proposed basic theme for the
chemical programme is to improve thecomparability of day to day measurementsbeing undertaken in the UK by capitalisingon the international developments being
undertaken through the CCQM, a sub-group of the International Committee onWeights and Measures (CIPM), to achieveequivalence in chemical measurement. Thiswill involve working with UK laboratories todevelop the tools and infrastructure tobroaden the scope of the internationalintercomparisons in order to ensure thesestudies encapsulate a wide range of analysesof importance to trade, health & safety andthe environment.
As part of the formulation process LGCwill carry out extensive consultations to help
V A M N E W S
VAM 2000 – 03

3 5 V A M B U L L E T I N
V A M N E W S
identify needs and develop the content of thenew programme. Over the next few monthswe will be holding a series of technical focusgroups to discuss topics such as DNAquantitation, new approaches to controllingmatrix effects, and analytical training needs.This will be supplemented by a range ofmeetings with analytical networks andorganisations. The output of this will be thepublication in January 2000 of the initialdraft of the programme for public comment.
Any feedback, suggestions and commentswill be taken into account and a final draftwill be considered by DTI and their advisors(the VAM Working Group) in April. Herethe constituent projects will be prioritisedwith the aid of a model designed to evaluatetheir benefits from both an economic and‘quality of life’ aspect.
We will endeavour to keep readers of theBulletin informed of developments andfurther details regarding the structure and
content of the new programme will bepublished in the next issue. In the meantime,if you would like to receive a copy of thePublic Consultation Document, or wouldlike to put forward any views onrequirements, please contact:
John MarriottLGC VAM Programme Manager Tel: 020 8943 7509Fax: 020 8943 2767Email: [email protected]
One of the projects within the currentVAM programme has been concerned
with improving the quality of out-of-laboratory (OOL) measurements. A numberof initiatives have been undertaken withinthis project, of which one has been afeasibility study into the establishment of aProficiency Testing scheme for OOLmeasurements.
The feasibility study indicated that thearea where a PT scheme may be mosteffective and appropriate is on-sitecontaminated land measurements. There has been support from consultants and testkit manufacturers/retailers for this initiative.The outline of a potential scheme is as follows:• samples would be clean dried soil
(effectively a ‘blank’ soil) to whichanalytes of interest in solution orsuspension would be added beforemixing, to give a wet sample. Initially the analytes to be measuredwould be strictly controlled to removethe effect of potential interferences
• participants would analyse the samples
using the test kit they normally use; thiswill enable alternative kits to beobjectively compared where they exist
• results would be submitted for processing as in LGC’s CONTEST PT scheme,although the statistical and reportingprotocols will be different and have yet to be agreed.Such a scheme would enable those
engaged in making OOL measurements toascertain the quality of their measurements,and the performance of test kits. They canalso monitor the ability of differentpersonnel engaged in these measurements.Test kit manufacturers and retailers wouldbe able to gain valuable information aboutthe ruggedness and general performance oftheir products, which could aid designimprovements. Consultants would be able to gain an understanding of the strengthsand weaknesses of OOL measurementscompared with laboratory analysis.
What will happen next?
We are currently in a furtherconsultation phase with a wide range of
interested parties to scope this potentialscheme in more detail. Our objective is tooperate at least 1 round of a scheme with aminimum of 15 participants within the nextyear. This would be funded entirely byVAM. The potential for a commercial PTscheme would be gauged, and if there was sufficient demand then a scheme would be established by LGC as a ‘sister’scheme to CONTEST, thereby allowingdirect comparison over time between OOL and laboratory measurements of thesame analytes.
If you would like a copy of theFeasibility Study Report, please contact theVAM Helpdesk at LGC.
If you are interested in participating inthe trial round(s) of the scheme, or wish tohave any input into the scoping anddevelopment of the scheme, please contact:
Derek Woods LGC Tel: 020 8943 7494Fax: 020 8943 2767Email: [email protected]
PT for out-of-laboratorymeasurements of contaminated land

3 6 V A M B U L L E T I N
V A M P R O D U C T S A N D S E R V I C E S
Rapidly developing DNA technology ishaving a revolutionary effect on a host
of industrial and regulatory sectors includinghealthcare, agriculture and forensic analysis.DNA is becoming the bioanalyte of choice,due to the vast amount of informationembedded in its sequence, its robustchemical nature and the range of highlysensitive analytical techniques that have been developed. The results of such analysescan have an important impact on oursociety, both commercially and in terms of the quality of life. Absolute confidence in the data generated is therefore of utmost importance.
Previous work has shown that there are anumber of problems that need to be tackled,before the potential power of nucleic acid-based methods can be reliably applied to theroutine analysis of biological samples. It isimportant that analysts using DNAtechnology are aware of, and appreciate the effect of, critical points in the wholeprocess. Of particular importance are topicssuch as method validation, referencematerials and proficiency testing. Workcarried out under the VAM programme has resulted in the publication of a newbook, ‘Analytical Molecular Biology: Qualityand Validation’, which places its emphasis
on the VAM principles and their applicationto DNA-based analyses. It also focuses on additional challenges that are associatedwith the analysis of samples with complexmatrices or have been highly processed (i.e. non-ideal samples). With reference to published literature and past experience,this book also looks at ways of enhancing the quality of data obtained from keytechniques such as DNA extraction, various PCR applications, sequencing and hybridisation.
‘Analytical Molecular Biology: Qualityand Validation’ is available from LGC orThe Royal Society of Chemistry.
Analytical Molecular Biology:Quality and Validation
This resource material was officiallylaunched at Osterley Park in July 1999
by Hounslow Education BusinessPartnership. The resource material wasdeveloped at LGC with support from theVAM programme, the School CurriculumIndustry Partnership (SCIP) and localschools from the London Borough ofHounslow. This collection of materials gives an overview of analytical science and related issues. The pack should beespecially useful for those teaching A-level
Chemistry and Biology courses and GNVQAdvanced Science.
The video accompanying the pack, looksat the important role analytical science playsin our daily lives. The video and staff profilesprovide information on career opportunitiesin analytical science.
The resource pack was developed toachieve five major aims:• to provide materials associated with
analytical science to help teachers deliveraspects of the National Curriculum and
post-16 science courses• to provide ideas for science assignments
and practical activities• to help deliver Key Skills• to actively involve students in real issues
related to analytical science• to offer career information for those
interested in analytical science.The ‘Chemistry Provides the Solution’
curriculum resource pack costs £30 and can be purchased from the VAM Helpdeskat LGC.
‘Chemistry provides the solution’curriculum resource pack
Proficiency Testing (PT) schemes helplaboratories monitor and improve the
quality of their measurements, by comparingresults with those achieved by other laboratories.
A new PT scheme (toytest) dedicated totoy testing has been launched by LGC,starting in September 1999. Initially, the
emphasis will be on chemical testing, withother aspects, such as mechanical andelectrical testing added as the schemeevolves. Chemical testing will concentrate ontoxic metals at first, followed by otherelements, plasticisers etc. as agreed by theindependent steering committee. It is
expected that samples would be distributedevery three months, and a report would becirculated to participants within 3 weeks ofreceipt of results.
Anyone interested in more informationon this scheme, please contact LGC’s PTadvisory service (details on back cover).
Toy Proficiency Testing scheme

3 7 V A M B U L L E T I N
V A M P R O D U C T S A N D S E R V I C E S
The basic laboratory skills pack, recentlypublished by LGC, aims to improve
the quality of analytical measurements madein the laboratory by introducing theprinciples of good practice. The pack,comprising a booklet – ‘Guide to ImprovingAnalytical Quality in Chemistry’ and a CD-ROM – ‘Basic laboratory skills’, was
developed by the education and trainingteam at LGC in conjunction with teachersand practitioners of analytical chemistry andwith support from the VAM programme.
The guide is aimed at students (e.g. 16 –18) who have little practical experience and havenot had the opportunity to perform practicalprocedures on a regular basis. Feedback has
indicated that is also of use to new employeesstarting work in a traditional analytical laboratoryat a junior grade, work experience students inanalytical laboratories and first year universitystudents in science departments where basiclaboratories skills are a requirement.
The pack costs £15 and can bepurchased from the VAM Helpdesk at LGC.
Basic Laboratory Skills – a trainingpack for laboratory techniques
There are many laboratories involved inanalysis related to the alcohol industry,
carrying out a large number of deter-minations. But how do the analysts know theyhave the right answers? Highly trainedpersonnel will often use established methodsand sophisticated equipment, but this may notnecessarily lead to a valid measurement.Production of poor data can have majorrepercussions, including cost of repeat analysis,damage to business and even legal action.VAM principle four states ‘there should be aregular and independent assessment of thetechnical performance of a laboratory’. A good
way to achieve this is to participate in anappropriate Proficiency Testing (PT) scheme.
LGC manages a range of such schemes,including three aimed at the alcoholindustry. These are ‘Brewers AnalytesProficiency Testing Scheme’ (BAPS),‘Distillers Analytes Proficiency TestingScheme’ (DAPS), and ‘Malt AnalytesProficiency Testing Scheme’ (MAPS).
Homogeneous samples are sent fromLGC to a number of laboratories at regularintervals for analysis using the laboratories’normal methods. LGC produces a statisticalanalysis of the results, which allows
participants to monitor the quality of theirresults, in comparison with other laboratories.This offers a measure of confidence in theresults, and illustrates any quality issues thatneed to be addressed.
Each of the individual schemes helps theindustry produce independently verifiableresults, but there is also a chain effect, wherecustomers may require their beer supplier tobelong to BAPS, so that this supplier in turninsists that their malt supplier belongs to MAPS.
Further information is available from theProficiency Testing advisory service (seeback cover for details).
PT schemes used in the alcohol industry

3 8 V A M B U L L E T I N
C H E M I C A L N O M E N C L A T U R E
KevinThurlow, LGC
There are many rules relating tonomenclature of chemicals but the
most important one is not published:-Whatever name you use, be sure ALL
your audience knows what you mean.Naturally, not everybody goes along with
that. In 1976, the Italian town of Seveso wasevacuated following a leak of the extremelytoxic chemical 2,3,7,8-tetrachloro= dibenzo[b,e][1,4]dioxin (Figure 1). Thelowest published toxic dose for a humansubject is 107 µg/kg.
Some people understandably decidedthat this name was a bit too long for generaluse, so they shortened it to dioxin. This hasthe advantage of being short and snappy,and it sounds rather threatening. It has thedisadvantage of being a systematic name forthe relatively harmless structure shown inFigure 2. Figure 1 has also been shortenedto 2,3,7,8-TCDD, which is a better choice,as it is less likely to be confused withsomething else.
This is p-dioxin (or 1,4-dioxin). Anychemical containing such a structure could becalled ‘a dioxin’, but just saying ‘dioxin’
is very misleading. It should just mean 1,2-dioxin, 1,3-dioxin or 1,4-dioxin. Imaginetrying to transport ‘dioxin’ and finding thatyou have caused some excitement when youhave merely attempted to transport thechemical depicted in Figure 2. This couldlead to a considerable waste of time andmoney. Obviously it is not very satisfactory ifyou see a chemical name and it could meanany one of a variety of structures. The head ofLGC’s Chemical Nomenclature team wroteto various newspapers in 1976 explaining theconfusion surrounding ‘dioxin’. One leadingnewspaper wrote thanking him and encloseda copy of a memo to all staff instructing themto use better names. Sadly, the recent scaresurrounding ‘dioxin’ in Belgium has shownthat the media are still using this misleadingterm. To make matters worse, ‘dioxin’ hadalready been used as a trivial name for acompletely different chemical. It is notsurprising that media staff with little or noscientific training can make such mistakeswhen a leading popular science writer makesstatements like ‘dioxins are organo-chlorinecompounds’. A dioxin can be anorganochlorine compound but this is certainlynot always the case. It is clear that confusionover what someone means by ‘dioxin’ couldhave devastating consequences.
Dreadful names abound in officialdocuments. One international organisationpersists in using the name ‘amyl mercaptan’ forC5H11SH. ‘Mercaptan’ was superseded by‘thiol’ over fifty years ago, before theorganisation in question came into existence.However, there is little confusion because‘mercaptan’ is sufficiently well known to beidentified. ‘Amyl’ is another matter! Manypeople assume it is another word for ‘pentyl’,but it is not quite so easy as that. There is avery helpful article1 which goes into some detailon the matter. The name ‘amyl’ derives fromthe Latin word for starch, because ‘amylicalcohol’ was obtained from the fermentation ofstarch in potatoes. After the crude alcohol wasrefined, there were two major componentsremaining, 3-methylbutan-1-ol (85%) and 2-methylbutan-1-ol (15%) (Figure 3).
‘3-methylbutyl’ is also ‘isopentyl’, so‘amyl alcohol’ is primarily ‘isopentyl alcohol’.This has caused a great deal of confusionover the years, as some authors have assumedthat ‘amyl’ means ‘pentyl’ in the IUPAC
sense, i.e. straight chain. So ‘amyl acetate’ ismodernised by a well-meaning writer into‘pentyl acetate’, when ‘isopentyl acetate’would be more accurate, and ‘pentyl acetate,mixed isomers’ or ‘pentyl acetates’ would beeven better. The problems do not end there.What is ‘isoamyl acetate’? If it means‘isopentyl’, then ‘amyl’ can mean ‘isoamyl’! Itdoes seem that ‘isoamyl’ is generally used tomean ‘isopentyl’, by people who assumedthat ‘amyl’ meant ‘pentyl’. This does makelife difficult. Readers are advised to treat anynames containing ‘amyl’ with great caution.
Another good example of an ambiguousname in an official document is‘chloroacetophenone’. Acetophenone isdepicted in Figure 4. There are severaldifferent possibilities here, as the chlorine cango on the methyl group or on the ring. It maybe the publishers of the document wish toinclude all the possibilities, in which casethey should really say ‘chloroacetophenones’.
It is rather alarming just how manyambiguous or incorrect names may be foundin official or legal documents. If you are havingproblems with chemical nomenclature, we areable to offer advice (see back cover for details).
REFERENCES
1. Richard A Kjonaas, Journal of Chemical
Education, Vol.73, No.12, December
1996, pp1127–1129.
How to confuse people
Figure 1
Figure 3
Figure 4
Figure 2

3 9 V A M B U L L E T I N
F O R T H C O M I N G E V E N T S
PCR-based analysis: MethodDevelopment, Validation and
Data Interpretation
19 October 1999LGC, Teddington
The Polymerase Chain Reaction (PCR)is now considered a powerful tool thatunderpins many DNA-based analysesundertaken in a wide variety of sectors. Asthe routine application of PCR-basedtechnologies increases, it is becoming criticalthat only fully validated methodologies withwell-defined limitations and appropriatecontrols are applied to bioanalyses. Underthe VAM programme, LGC are holding aworkshop on PCR-based analysis. The aimof this workshop is to highlight and discussissues that can enhance confidence in PCR-generated measurements. The one dayworkshop will include:• PCR optimisation, primer design etc.• fitness for purpose, working with
degraded DNA, contamination etc.• the benefits of method validation, what
it involves and how it can be carried out• ongoing quality control issues relating to
PCR – minimising variability of resultsand adding confidence to data
• case studies• interpretation of PCR results.
Also included is a tour of LGC’s highthroughput DNA forensic laboratory.
The workshop is ideally designed forexperienced PCR users, including laboratorymanagers, QA/QC managers and analystsinvolved in the development or deploymentof PCR methods for routine use.
For further information, please contact:Anne RobertsLGCQueens RoadTeddingtonMiddlesex TW11 0LYTel: 020 8943 7444Fax: 020 8943 2767Email: [email protected]
Good scientific practice for chemical analysis
25–26 October 1999Hewlett-Packard, Bracknell
6–7 December 1999LGC, Runcorn
It is essential that analytical results are fitfor purpose and meet the needs of thoserequesting the analysis. Implementing the sixVAM principles is increasingly becomingacceptable as one approach to achieving thisaim. This course, run jointly by LGC andHewlett-Packard will describe and explaincost effective ways of implementing theseprinciples. The course is a mix of lecturesand break out sessions with ampleopportunity to practice newly acquired skills.
For further information and to register,please telephone the Chemical AnalysisLinkline on 0345 125292.
Annual Conference‘Measurement for
Industry ’99’
1–4 November 1999Brighton
This major conference aims to provide aforum for the discussion and disseminationof technical developments and innovation inmeasurement science. Alongside thetechnical programme there will be anexhibition of measurement providers,instrument suppliers and accreditedcalibration laboratories. The technicalprogramme will include oral and posterpapers, workshops and seminars on currentmeasurement issues.
For further information, please contact:Debbie HallNMP Conference SecretariatNPL, Queens RoadTeddingtonMiddlesex TW11 OLWTel: 020 8943 6602Fax: 020 8943 6821Email: [email protected]
Gas analysis symposium and exhibition
7–9 November 1999Amsterdam, The Netherlands
This 2 day symposium and exhibition,organised by ISO/TC 158 ‘Analysis ofgases’, will have five (parallel) sessions on:• state of the art in equipment and
current instrumentation• traceability, validation, accreditation
and measurement uncertainty• analysis of process gases• calibration gases• validation of analytical methods in
natural gas.For further information and registration,
please contact: Ms C DobbelaarNNI, PO Box 5059NL-2600 GB DelftThe NetherlandsTel: (31) 15 2 690330Fax: (31) 15 2 690190Email: [email protected]
Measurement Uncertaintytraining course
9-10 November 1999Lensbury Conference CentreTeddington, Middlesex
The ability to estimate measurementuncertainty will give both you and yourcustomers confidence in your results. Lecturesand workshops on this course will show youhow to calculate and apply measurementuncertainty by using step-by-step instructionsand clear worked examples. The course willexplain the concepts of measurementuncertainty as stated in the new EURACHEM/CITAC Guide ‘Quantifying Uncertainty inAnalytical Measurement’. The course is ideallysuited to analytical chemists who are involvedin method development and method validation.
For further information and registration,please contact:
Lorraine DidinalLGC, Queens RoadTeddingtonMiddlesexTW11 0LYTel: 020 8943 7631Fax: 020 8943 2767Email: [email protected]
Forthcoming events

4 0 V A M B U L L E T I N
F O R T H C O M I N G E V E N T S
Taking the mystery out of statistics
22 November 1999HP Training Centre, LGCTeddington, Middlesex
This course, run jointly by LGC andHewlett-Packard, starts from looking at thedata and explaining the statistical parametersthat describe the data mean as well as how toevaluate the parameters. Theory is kept to aminimum but there is ample opportunity topractice. The course is aimed at analyticalchemists and will include the mostimportant statistics concepts used byanalytical chemists; the calculation of themost common statistical parameters; anintroduction to significance testing;interpretation and pitfalls of linearregression; tools to aid efficiency andanalysis of variance (ANOVA).
For further information and to register,please telephone the Chemical AnalysisLinkline on 0345 125292.
Equipment Qualification
17 December 1999Scientific Societies Lecture TheatreLondon
Without the 4 Qs of equipment qualifi-cation, an organisation cannot provideevidence that its results are fit for thepurpose for which they were intended. Thisseminar brings together world experts,including those who develop instru-mentation, the analysts and the regulators.The seminar will describe what is meant byEQ and indicate how it helps deliver goodscience and provide evidence of compliance,show how instrument manufacturers designEQ into their instruments, illustrate to theusers of analytical instruments how toimplement EQ and point out the pitfalls forthe unwary software user.
For further information and to register,please telephone the Chemical AnalysisLinkline on 0345 125292.
International conference onmetrology – Trends and
applications in calibration andtesting laboratories
16-18 May 2000Jerusalem, Israel
The meeting is organised by theNational Conference of Standard Labora-tories (NCSL), Co-operation for Inter-national Traceability in Analytical Chemistry(CITAC) and Israeli Metrological Society.The conference will discuss metrology, newmeasurement methods and instruments, inter-laboratory comparisons, proficiency testing,traceability, ethical problems in metrologyand education in the third millennium.
For further information, please contact:Dr Henry HorowitzConference SecretariatISAS International SeminarsPO Box 34001Jerusalem 91340IsraelTel: (972) 2 6520574Fax: (972) 2 6520558Email: [email protected]
General VAM contact points
VAM Helpdesk020 8943 7393
Advisory services
Reference materials advisory service(REMAS)Alison Jones, LGC020 8943 7621
Analytical QA advisory serviceDavid Holcombe, LGC020 8943 7613
Proficiency testing advisory serviceNick Boley, LGC020 8943 7311
Gas analysis advisory serviceDr Paul Quincey, NPL020 8943 6788
Chemical nomenclature advisory service(CNAS)Kevin Thurlow, LGC020 8943 7424
LGCQueens RoadTeddingtonMiddlesex TW11 0LYTel: 020 8943 7000 (switchboard) Fax: 020 8943 2767Web: http://www.lgc.co.uk
National Physical Laboratory (NPL)Queens RoadTeddingtonMiddlesex TW11 0LYTel: 020 8977 3222 (switchboard)Fax: 020 8943 2155Web: http://www.npl.co.uk
Aerosol Science CentreAEA Technology plcE6 Culham, AbingdonOxfordshire OX14 3DBTel: 01235 463677Fax: 01235 463205Email: [email protected]
Produced by Horrex Davis Design Associates 9/99
C O N T A C T S
Contact points