valuing early stage companies (venture fast track)
TRANSCRIPT

Jeremy Halpern @startupboston Partner, Nutter McClennen & Fish
Joshua Herzig-‐Marx CoFounder, Incentive Targeting (acquired by Google 2012)
Enrico Picozza HLM Venture Partners
Bill McCullen Launch Capital
TCN FastTrack -‐ October 2013 Valuing an Early Stage Company
#TCNLive #StartUpValuation
› Nutter, McClennen & Fish, LLP -‐ Partner; Director of Biz Dev, Emerging Companies Team
• Top 10 Boston law firm • Represent clients in technology, hardware, software, mobile, medical devices, health
IT, biotechnology, cleantech CPG, consumer electronics, sports & entertainment • Provide support and outreach to the entrepreneurial community
› Boards and Organizations
› MassVentures – Director & Investment Committee Member
• The Venture Arm of the Commonwealth-‐-‐ catalyzing innovation in Massachusetts by providing seed and early stage venture funding to high growth technology startups.
› The Capital Network – Director; Past Chairman
• Providing education, resources and community to high growth entrepreneurs and angel investors as they navigate the early stage capital process
› Entrepreneurial Experience – Cofounder -‐ MobileTek
› UC Berkeley, B.A. (Go Bears!); UCLA School of Law, J.D.
› 2012 recipient of The Boston Business Journal’s “40 under 40 Award”
2
Jeremy Halpern Biography

› Current
› Venture Partner – HLM Venture Partners
› Previous
› HTS Biosystems, Inc.,
› PerkinElmer, Inc.
› Applied Biosystems, Inc.
› Holds nine patents and has been
› Recognized by the Smithsonian Institute for his achievements in PCR
› Board observer for Interlace Medical
› Master’s degree in molecular and cell biology from the University of Connecticut.
3
Enrico Picozza Biography

› Current
› Director, LaunchCapital
› Over 7 years backing companies in the networking, semiconductor, clean energy and online markets.
› Previous
› Sycamore Networks
› Windspeed Access Systems
› Continuum Photonics
› Mintera
› Susquehanna Financial
› BS and MS degrees in Electrical Engineering at Worcester Polytechnic Institute
› MBA from the MIT Sloan School of Management
4
Bill McCullen Biography
› Currently with Google
› Co-‐founder of Incentive Targeting which sold to Google in 2012
› Previously: Client Manager at SunGard iWorks and Navimedix
› MBA from Babson College
5
Josh Herzig-‐Marx Biography
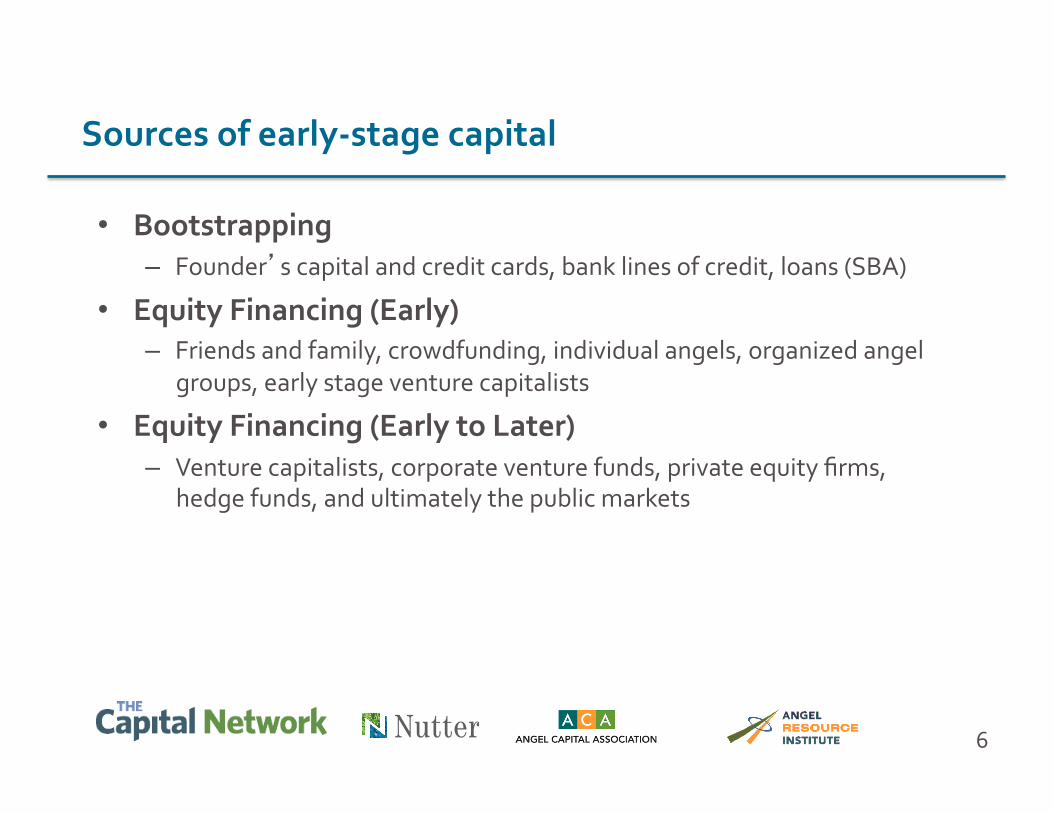
Sources of early-‐stage capital
• Bootstrapping – Founder’s capital and credit cards, bank lines of credit, loans (SBA)
• Equity Financing (Early) – Friends and family, crowdfunding, individual angels, organized angel
groups, early stage venture capitalists
• Equity Financing (Early to Later) – Venture capitalists, corporate venture funds, private equity firms,
hedge funds, and ultimately the public markets
6

Investment Size
Investment “Cost”
Traditional VC
Micro VC
Equipment Financing
Angel Groups Angels
AngelList
Corporate / Strategic Venture
Customers
Portal Funding
Vendors
Founder
Friends & Family
Crowdfunding
Grants
Venture Debt Bank
Loans
Personal Loans
Private Equity
Sources of early-‐stage capital – Cost:Size

Avoid the “Capital Gap”
Stage Pre-‐Seed
Seed Start-‐Up
$500,000 to $2,500,000
Early Later
Source Founders, Friends
and Family
Individual Angels,
MicroCaps Accelerators
Venture Funds
Investment $25,000 to $100,000
$100,000 to $500,000
$5,000,000 and up (initial capital may be smaller,
but exit targets higher)
Market Entry
Micro Cap VCs, Angel Groups and
Angel Group Syndication
8
Mind the Gap !

• Common Equity – Typical for Founders – Not typical for new, sophisticated investors – Restricted stock and Options
• Debt and Convertible Notes – Often used by early stage companies to avoid valuation – Not the best mechanism for aligning Founders and investors
• Preferred Equity – Primary mechanism for sophisticated angels, angel groups and VCs
9
Equity Investment Vehicles

Pre-‐money $ 1,500,000 $ 2,000,000 $ 2,250,000 $ 2,500,000 $ 2,750,000 $ 3,000,000 $ 3,250,000 $ 3,500,000
Note $ 610,717 $ 610,717 $ 610,717 $ 610,717 $ 610,717 $ 610,717 $ 610,717 $ 610,717
Series A $ 1,500,000 $ 1,500,000 $ 1,500,000 $ 1,500,000 $ 1,500,000 $ 1,500,000 $ 1,500,000 $ 1,500,000
Option Pool (8.25%) $ 297,884 $ 339,134 $359,759 $ 380,384 $ 401,009 $ 421,634 $ 442,259 $ 462,884
Post-‐money $ 3,908,601 $ 4,449,851 $ 4,720,476 $ 4,991,101 $ 5,261,726 $ 5,532,351 $ 5,802,976 $ 6,073,601 Investor Ownership 54% 47% 45% 42% 40% 38% 36% 35%
Management Ownership 46% 53% 55% 58% 60% 62% 64% 65%
10
Dilution -‐ Valuation’s relationship to Ownership

Capital Needs
Time
High Risk
Low Risk
Crystallize Ideas
Demonstrate Product
Early Scaling Growth
Sustained Growth
Market Entry
• Raising money takes place over and over again because different lenders and investors match the current capital
amounts and risk profile
11
Risk vs. Return

• Understand the capital needed today, and the total capital needed to get to milestones (e.g. exit!) – Type of business (e.g. SaaS, Medical Equipment)? – Cost of getting to market? – Cost of ramping and running the business?
• Compensate the management for getting to this point – What do they need for future motivation? – How many more senior people will be hired w/ options?
• Look at comparable exits to understand likely exit multiple – Don’t forget to account for invested capital!
• Is this a business investors can afford to invest in?
12
The Long View – Total Capital Requirements
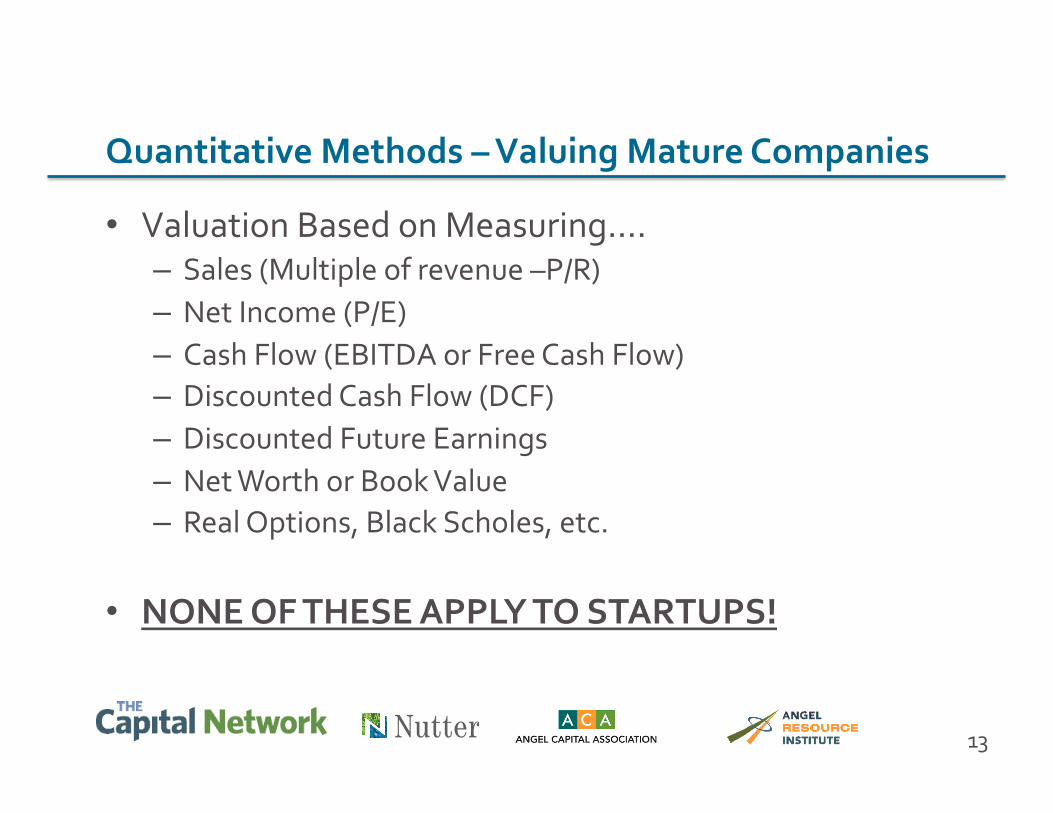
• Valuation Based on Measuring…. – Sales (Multiple of revenue –P/R) – Net Income (P/E) – Cash Flow (EBITDA or Free Cash Flow) – Discounted Cash Flow (DCF) – Discounted Future Earnings – Net Worth or Book Value – Real Options, Black Scholes, etc.
• NONE OF THESE APPLY TO STARTUPS!
13
Quantitative Methods – Valuing Mature Companies
Valuation Issues
• Market Test & the Power of Auction: Leverage • Round size • Source (Angel, VC, Strategic etc.) • Total Capital Requirements • Terms vs. Pre-‐Money Price • Impact of Option Plans • Price less important than relationship • Positioning for future • Impact of Convertible Debt from F&F • On the “Promise” or the “Numbers” but not both!

Qualitative & Quantitative Factors
• COMPARABLES – Valuation of deals recently
completed in a similar space
• KEY ASSETS OF THE COMPANY – Management: Commitment
Knowledge & Experience – Intellectual Property &
Defensibility – Financials & Time to Profit – Milestones Achieved – Revenue – Customers and Feedback – Barriers to Entry
• FINANCING HISTORY / NEEDS – Funding to Date – Future Funding Needs – Last Round Post-‐Money Valuation – When was last round completed – Is the stock option pool sufficient
• SIZE AND GROWTH OF MARKET – Current Size & Targeted Market
• NOT the Total Available Market – Growth -‐ CAGR
15

Early Stage Company Valuation Methodologies
• Venture Capital Method (used also by many angels) – Future revenue x industry multiple x pro rata percentage x IRR = current value
• Discounted Hypothetical Cash Flow / Net Present Value – Based on fiction
• Chicago (DCF x probability tiers) – Same issue as above
• Berkus (finger in the air) – Maximums per attribute (max $2.5m)
• OTA/Payne – Comparison to average x weight – Helpful for biotech/cleantech
• Risk Factor Method – Highly subjective – a more detailed version of Berkus Method
• Opportunity Cost / Contribution Model – Based on sweat and lost alternative revenue
• 1/3 Max rule – Treats angels like co-‐founders and weight cash versus sweat
• Transaction Comparables – Hard to find like deals; general market trends may apply

Investor-‐Driven Method (aka Venture Math)
• VALUATION -‐ Investor Requirements – Return rate required by investor (VC driver) – 10X to 20X – what is it? – Time Frame – 3-‐5-‐7 years – Any initial ownership goals – Valuation can be determined by working in reverse from exit
valuation assuming hypothetical intervening dilution
• VALUATION -‐ Investor Internal Dynamics – What you can sell to your syndicate partners – Size of fund and time since fund inception – Minimum Investment = meaningful percentage?
17

Dave Berkus Method
If it exists, then Add to Company value Sound idea $500k Prototype $500k Quality Team $500k Quality Board $500k Initial Sale $500k Valuation Range = $0 -‐ $2.5 million
18

Bill Payne Method
Factor Weight Rating (100% basis) Comment Management 30 125 On board, ex sales Size of Oppty 25 115 Could be huge Product/Service 10 110 Disruptive platform Sales Channels 10 70 All foreign Stage of Business 10 125 Prototype works Other 15 80 All revs outside US
100%
Weighted Average Rating = 1.0875 Pre-‐revenue Multiplier = $1.75 million
Valuation = 1.0875 x $1.75 million = $1,903,125
19

Risk Factor Summation Method (same company) Baseline $1.75 million Risk Factor Adjustment (-‐$500k to +$500k) Comment Management +$500k Done it before Stage +$250k Prototype works Funding Risk -‐$250k Int’l mkts tough Regulatory 0 Unregulated mkt Manufacturing +250k Nothing new Sales & Mktg -‐$500k Int’l mkts Competition +$250k Few in target mkt
Technology +$250k Off shelf parts Litigation 0 None expected International -‐$500k All revs Int’l Reputational -‐$250k Int’l issues Exit +$250k Likely early
$250k Valuation = $2.0 million
20

Structure to allow value growth over time
• Underlying Assumption – All business is a risk adjusted cash flow – Structuring a deal is “guessing” what the exit valuation will be
• Valuation is a “Black Art” – Goal is to quantify a qualitative assessment, and then…. – Negotiate the deal so that everyone feels just a bit unhappy
• Setting Deal Structure – MUST understand total capital requirements and likely capital sources – Need to understand option pool needs – Other economic terms include: liquidation preference, dividends, anti-‐
dilution adjustment and vesting of founder’s stock and option pool
GOAL: Founders, Management, Early Investors and Later Investors all have great risk adjusted returns
21

22
The average pre-‐money valuation for a pre-‐revenue company across the US is $2.1 million
Average Valuations -‐ Wisdom of the Angel Crowd
23
Contact Info
TCN FastTrack October 2013
Valuing an Early Stage Company
Jeremy Halpern Partner Nutter McClennen & Fish [email protected] @startupboston 617.439.2943