value versus growth stocks : portfolio analysis …eprints.undip.ac.id/68355/1/10_widodo.pdf · too...
TRANSCRIPT

VALUE VERSUS GROWTH STOCKS :
PORTFOLIO ANALYSIS APPROACH ON
INDONESIA STOCK EXCHANGE
(Empirical Study to Companies Listed on Kompas100 Index
2003-2018 Period)
UNDERGRADUATE THESIS
Submitted as a requirement to complete Bachelor Degree Program
Of Faculty of Economics and Business
Diponegoro University
Written by:
CYRILUS WILLY WIDODO
NIM. 12010112130212
FACULTY OF ECONOMICS AND BUSINESS
DIPONEGORO UNIVERSITY
SEMARANG
2018
i
APPROVAL
Author : Cyrilus Willy Widodo
Student ID : 12010112130212
Faculty/Major : Economics and Business/Management
Title : VALUE VERSUS GROWTH STOCKS : PORTFOLIO
ANALYSIS APPROACH ON INDONESIA STOCK
EXCHANGE (EMPIRICAL STUDY TO COMPANIES
LISTED ON KOMPAS100 INDEX 2003-2018 PERIOD)
Paper Advisor : Erman Deny Arfianto, S.E., M.M.
Semarang, 26 November 2018
Paper Advisor
Erman Deny Arfianto, S.E., M.M
NIP.197612052003121001

ii
APPROVAL
Author : Cyrilus Willy Widodo
Student ID : 12010112130212
Faculty/Major : Economics and Business/Management
Title : VALUE VERSUS GROWTH STOCKS : PORTFOLIO
ANALYSIS APPROACH ON INDONESIA STOCK
EXCHANGE (EMPIRICAL STUDY TO COMPANIES
LISTED ON KOMPAS100 INDEX 2003-2018 PERIOD)
Has passed thesis examination on December 7th
, 2018
Examiners:
1. Erman Denny Arfianto, S.E., M.M. (.............................................)
2. Drs. H. Prasetiono, M.Si. (.............................................)
3. Drs. Mulyo Haryanto, M.Si. (.............................................)

iii
BACHELOR THESIS ORIGINALITY STATEMENT
I am who signed here, Cyrilus Willy Widodo hereby declare that this
bachelor thesis is my own writing. The work contained in this paper has not been
previously submitted for a degree or diploma at any other higher education
institution. To the best of my knowledge and belief, the thesis contains no
material previously published or written by other person except where due
reference are made.
If I took action contrary to the statement above, deliberately or not, I will
take back my bachelor thsis which I admitted as my own. Later on, if it’s proven
that I copied or imitated other writing as if it was mine, my academic title and
certificate shall be invalidated.
Semarang, 26 November 2018
Signed
Cyrilus Willy Widodo
NIM. 12010112130212

iv
MOTTO
“He who has a why to live can bear almost any how” Nietzsche
“The greater the obstacle, the more glory in overcoming it” Molière
Since the author is a dumb student and doesn’t know what else to be
written in this page, here are some recommendations for those who like to read
philosophical stuff (it took him almost 7 years to graduate from college, society
often branded this kind of student as a stupid disappointment a.k.a.
laughingstock). The author would like to suggest most of Nietzsche’s work (Thus
Spoke Zarathustra, Beyond Good and Evil etc.). It is really amusing how
Nietzsche captures and explains the philosophic view of the world, reality, and
our human nature as social animal. George Orwell 1984 is also a good starting
point. The classical art from renaissance era (Oliver Twist, Great Expectation etc.)
can offer a great amount of revolutionary view/idea from the past. While the
author is fully aware that this kind of topic is often ignored by most people, it is
actually amazing in truth. Lastly, even though the author looks like a creepy,
lonely, miserable, and single all the time, He actually did fell in love. With books
and ideas.
“This thesis is dedicated for my mom and dad”

v
ACKNOWLEDGEMENT
All praise and gratefulness towards God for whom I was able to complete
this thesis with the title of VALUE VERSUS GROWTH STOCKS : PORTFOLIO
ANALYSIS APPROACH ON INDONESIA STOCK EXCHANGE
(Empirical Study to Companies Listed on Kompas100 Index 2003-2018 Period).
This thesis is written as a requirement for my undergraduate degree from
majoring in Management in Faculty of Economics and Business of Diponegoro
University. During the writing, I received countless support from many side which
I honestly grateful towards. As a sign of thankfulness, I would like to address
special thanks to:
1. My mom and dad for all of their support and hard work in order for me to be
able to finish my college study (they are great parents y’all, I don’t deserve
them). I know this might not be so much compared to the trouble and
disappointment I’ve caused for you. But I will make it up somehow. I am Sorry
and Thank You.
2. My brother Howi, thanks for being a good example of how a good son should
be. Thanks for being able to make our parents proud despite of me being a
disappointment. I hope one day I will be able to repay my gratitude.
3. Dr. Suharnomo M.Si. as the Dean of Faculty of Economics and Business
Diponegoro University which has allowed me to write this thesis.
4. Dr. Harjum Muharam S.E., M.E. as the Head of Management Department
which gave me direction and guidance throughout the writing process.

vi
5. Mr. Erman Denny Arfianto S.E., M.M as my thesis mentor. I don’t know why
did you agree to be a mentor of such a dumb student but, I am really grateful
for that. Also for all academics lesson you have gave me throughout my study
(I still don’t understand about risk volatility, CAPM, Sharpe ratio, Monte
Carlo, Bonferoni, Fettucini, beta, alpha, sigma, pevita, raisa etc. sorry sir I’m
too dumb) and life lessons that you shared during my consultation period (this
one I can understand better, probably, I’m not sure though haha).
6. Mr. Kus Cahyo as my Academic English mentor. Thank you so much sir for
your guidance and lecture (usually take at least 1 hour-long class and then
followed by 2 hours-long extra explanatory time haha). I really am glad to be
able to meet you sir. Thank you very much.
7. Drs. Bambang Munas Dwiyanto S.E., M.M as my councelor, thank you so
much for your insight during my study here.
8. All the lecturer and employees of Faculty of Economics and Business
Diponegoro University which I can not mention one by one since that would
take almost 20 pages more.
9. My close friends (I do have friends you know) Lely, Petra, Aat, Hendra. Thank
you so much for being a good friends and supporting me even though you
might not realized it. It means so much to me.
10. My “enemy” Ryan Putra D, thank you for annoying me with everything you
do, your dumb way to do things, and your unrestrained excitement over
something stupid. I’m still awaiting for the day that you can finally find what
you are looking for.

vii
11. My Brutal Gaming Community (Dino, Mongi, Alvine, Bajong, Adhit, Adit,
Eko, Jum, Adrian, Sawi, Aji, screw this the list is too long) thank you for
providing me with every, single, unnecessary, time wasting, mind numbing
distraction. May the day when we play games together again shall come.
12. My KKN Team Jinggotan (Mifta, Takim, Uncle Iken, Bintang, Tedjooo, Nava,
Habib, Lia, Salman, Parama and Vina) thanks for all the memories we shared.
You all have been great partner during our KKN ordeal.
13. My ex girlfriends, thanks for always dumping me, I guess it was good while it
lasted (my love story sucks but still way better than Twili*ht).
14. All of Management Batch 2012, especially Arnoldus Indrabayu (he is really
amazing person) thank you for the memories we shared together.
15. All contributor that I cannot mention one by one since this page has already
been bloated so much. Thank you very much.
I do realize that this thesis is nowhere near perfect. Therefore I will gladly
accept all criticsm and advice in order to improve this thesis. Finally, I Hope that
this thesis will contribute knowledges to public, academics and myself.
Semarang, 26 November 2018
Cyrilus Willy Widodo
viii
ABSTRACT
This research aims to clear the ambiguity in superiority between value and
growth stocks strategy, particularly in Indonesia. Furthermore, we attempt to
develop investment strategy on Indonesia Stock Market based on picking method
using Price to Earnings (P/E), Price to Book Value (P/B), Price to Cash Flow
(P/C) in relation with time period. This research conducted on non-financial
companies listed in Kompas100 Index from 2003 to 2018 period. We are in
compliance with previous research such as Fama and French (1992; 1998),
Capaul et al. (1993), and Lakonishok et al. (1994).
We conduct the research by using portfolio analysis method. By using this
method, we formed portfolios and determined its average equally weighted return.
After portfolios return are calculated, we proceed to conduct T-test to determine
the difference in return between stock types (value and growth) during our
research period. Last but not least, we conduct 3-way ANOVA test to find out any
interaction regarding the performance of our variables.
The results showed that value stocks outperform growth stocks based only
on P/E and P/B ratio. The ANOVA test showed that after at least 1 year period,
our investment starting to yield at least 76% of our initial investment. Also, the
ANOVA test reaffirm the long-established result that value outperform growth
stocks in general. Lastly, there are no differences between P/E, P/B and P/C ratio
performance as sorting tool to classify value and growth stocks.
Keywords: value stocks, growth stocks, portfolio analysis, P/E ratio, P/B ratio,
P/C ratio

ix
ABSTRAK
Penelitian ini bertujuan untuk menjelaskan adanya ambiguitas
keunggulan antara saham value dan saham growth terutama di Indonesia.
Peneliti mencoba untuk menemukan strategi investasi dalam Bursa Efek
Indonesia berdasarkan metode penentuan menggunakan Price to Earning (P/E),
Price to Book Value (P/B), Price to Cash Flow (P/C), dan hubungannya dengan
jangka waktu investasi. Penelitian ini dilakukan pada perusahaan yang terdaftar
dalam Indeks Kompas100 dari tahun 2003 hingga 2018. Peneliti mengikuti
penelitian terdahulu yang dilakukan oleh Fama dan French (1992; 1998), Capaul
et al. (1993) dan Lakonishok et al. (1994).
Peneliti melakukan penelitian ini menggunakan metode portofolio
analisis. Dengan menggunakan metode tersebut peneliti membentuk formasi
portofolio dan menentukan nilai rata-rata return setimbang dari portofolio
tersebut. Setelah perhitungan return dilakukan, peneliti melakukan Uji T untuk
menentukan perbedaan return antar tipe saham (value dan growth). Pada
akhirnya peneliti melakukan uji ANOVA untuk mencari tahu adanya interaksi
perilaku antar variable yang digunakan.
Hasil penelitian menunjukkan bahwa saham value mengalahkan saham
growth berdasarkan rasio P/E dan P/B.Uji ANOVA menunjukkan bahwa setelah
jangka waktu investasi 1 tahun, investasi mulai menunjukkan signifikan return
sekitar 76% dari investasi awal. Selain itu, uji ANOVA membuktikan bahwa
saham value mengalahkan saham growth secara umum. Poin terakhir, tidak ada
perbedaan performa dari penggunaan rasio P/B, P/E dan P/C untuk memisahkan
tipe saham ke dalam saham value dan growth.
Kata kunci: saham value, saham growth, portofolio analisis, P/E rasio, P/B rasio,
P/C rasio

x
TABLE OF CONTENT
APPROVAL…………………………………………………………………......…i
APPROVAL…………...…………………………………………………….........ii
ORIGINALITY STATEMENT……...……………………………………...…....iii
MOTTO……………………..…………………………………………………....iv
ACKNOWLEDGEMENT…………………………………..………………........v
ABSTRACT…………………………………………………...………………...viii
ABSTRAK………………………………………………...……………………...ix
LIST OF TABLE.................................................................................................xiii
APPENDIX..........................................................................................................xiv
CHAPTER 1 INTRODUCTION.............................................................................1
1.1 Research Background..................................................................................1
1.2 Problem Formulation.................................................................................10
1.3 Research Objectives...................................................................................11
1.4 Research Utility..........................................................................................11
1.5 Thesis Structure..........................................................................................12
CHAPTER 2 LITERATURE REVIEW................................................................14
2.1 Theoretical Review....................................................................................14
2.1.1 Investment.........................................................................................14
2.1.2 Classification of Stocks.....................................................................14
2.1.2.1 Value Stocks.............................................................................16
2.1.2.2 Growth Stocks..........................................................................17
2.1.3 Classifying Stocks as Value or Growth............................................18
2.1.3.1 Price to Earnings......................................................................20
2.1.3.2 Price to Book Value.................................................................21
2.1.3.3 Price to Cash Flow...................................................................22

xi
2.1.4 Modern Portfolio Theory..................................................................23
2.2 Previous Research......................................................................................25
2.3 Hypotheses.................................................................................................29
CHAPTER 3 RESEARCH METHODOLOGY.....................................................30
3.1 Research Variables.....................................................................................30
3.2 Research Population and Sample...............................................................32
3.2.1 Research Population..........................................................................32
3.2.2 Research Sample...............................................................................33
3.3 Research Data.............................................................................................34
3.3.1 Data Types........................................................................................34
3.3.2 Data Sources......................................................................................35
3.4 Research Framework..................................................................................35
3.4.1 Portfolio Formation and Evaluation..................................................35
3.4.2 P/E Based Value and Growth Portfolio............................................38
3.4.3 P/B Based Value and Growth Portfolio............................................38
3.4.5 P/C Based Value and Growth Portfolio............................................39
3.4.6 Hypothesis Testing............................................................................40
3.4.7 Post Hoc Test....................................................................................40
CHAPTER 4 RESULT AND ANALYSIS............................................................42
4.1 Research Object Definition........................................................................42
4.2 Research Result..........................................................................................43
4.2.1 Value and Growth Portfolio Based on P/B Ratio..............................43
4.2.2 Value and Growth Portfolio Based on P/E Ratio..............................44
4.2.3 Value and Growth Portfolio Based on P/C Ratio..............................46
4.3 Hypothesis Testing.....................................................................................47
4.3.1 First Hypothesis................................................................................47
4.3.2 Second Hypothesis............................................................................50

xii
4.3.3 Third Hypothesis...............................................................................52
4.4 Post Hoc Test.............................................................................................55
4.4.1 By Term............................................................................................55
4.4.2 By Style.............................................................................................60
4.4.3 By Picking Method...........................................................................61
CHAPTER 5 RESEARCH CONCLUSION..........................................................65
5.1 Summary....................................................................................................65
5.2 Research Limitation...................................................................................68
5.3 Research Suggestion..................................................................................69
5.3.1 For Practitioner..................................................................................69
5.3.2 For Academics..................................................................................69
BIBLIOGRAPHY..................................................................................................71
APPENDIX............................................................................................................75

xiii
LIST OF TABLE
Table 1.1 Indonesia Value and Growth Index Annual Performance...........……....8
Table 2.1 Previous Research……………………………………………..............28
Table 3.1 Operational Definition of Variables....……...…......…….....................31
Table 3.2 Observation, Formation and Evaluation Period....................................36
Table 4.1 Descriptive Statistics Result of Value and Growth Portfolio Return
Based on P/B Ratio...............................................................................44
Table 4.2 Descriptive Statistics Result of Value and Growth Portfolio Return
Based on P/E Ratio...............................................................................45
Table 4.3 Descriptive Statistics Result of Value and Growth Portfolio Return
Based on P/C Ratio...............................................................................46
Table 4.4 Paired Sample t-test Result of Value and Growth Portfolio Based on
P/B........................................................................................................48
Table 4.5 Paired Sample t-test Result of Value and Growth Portfolio Based on
P/E........................................................................................................50
Table 4.6 Paired Sample t-test Result of Value and Growth Portfolio Based on
P/C........................................................................................................53
Table 4.7 Descriptives ANOVA Test By Term Result........................................56
Table 4.8 ANOVA Test By Term Result.............................................................57
Table 4.9 Multiple Comparisons By Term Result...............................................57
Table 4.10 Descriptives ANOVA Test By Style Result......................................60
Table 4.11 ANOVA Test By Style Result...........................................................61
Table 4.12 Descriptives ANOVA Test By Picking Method................................62
Table 4.13 ANOVA Test By Picking Method Result..........................................62
Table 4.14 Multiple Comparisons By Picking Method Result............................63

xiv
APPENDIX
Appendix 1.1 Sample List......................................................................................76
Appendix 1.2 Portfolio Return Based on P/B Ratio..............................................79
Appendix 1.3 Portfolio Return Based on P/E Ratio...............................................83
Appendix 1.4 Portfolio Return Based on P/C Ratio..............................................87
Appendix 1.5 Paired Sample t-test Result of Value and Growth Portfolio Based on
P/B..........................................................................................................................91
Appendix 1.6 Paired Sample t-test Result of Value and Growth Portfolio Based on
P/E..........................................................................................................................92
Appendix 1.7 Paired Sample t-test Result of Value and Growth Portfolio Based on
P/C..........................................................................................................................93
Appendix 1.8 Descriptives ANOVA test Result Based on TERM........................94
Appendix 1.9 Test of Homogeneity of Variances Based on TERM......................94
Appendix 1.10 ANOVA test Result Based on TERM...........................................95
Appendix 1.11 Tukey and Bonferroni Test Result Based on TERM....................95
Appendix 1.12 Homogeneous Subset Result Based on TERM...........................100
Appendix 1.13 Descriptives ANOVA test Result Based on STYLE...................100
Appendix 1.14 Homogeneity of Variances Based on STYLE.............................101
Appendix 1.15 ANOVA test Result Based on STYLE........................................101
Appendix 1.16 Descriptive ANOVA test Result Based on PICKING
METHOD.............................................................................................................102
Appendix 1.17 Homogeneity of Variances Based on PICKING METHOD.......102
Appendix 1.18 ANOVA test Result Based on PICKING METHOD..................103
Appendix 1.19 Tukey and Bonferroni Test Result Based on PICKING
METHOD.............................................................................................................103
Appendix 1.20 Homogeneous Subset Result Based on PICKING
METHOD.............................................................................................................104

1
CHAPTER 1
INTRODUCTION
1.1 Research Background
Ever since the very beginning of stock exchange existence, it is a common
sense for investor to find a strategy to beat the market and achieve superior return.
Sarna and Malik, (2010) consider this types of investor as value driven in regard
that risk and rewards were calculated both implicit and unconsciously. The work
and result from academic research are advocated toward the creation of the
foundation and building blocks in order to comprehend and to provide various
investment strategies assessed in financial markets globally (Chan and
Lakonishok, 2004). According to Barberis and Shleifer (2003) as well as Chan
and Lakonishok (2004) one of the most popular theories on classification in
financial market is the usage of different investment styles. The securities
allocation can be classified in various manners. But one of the most popular
classification according to Bourguignon and De Jong, (2003) to which caused
disagreement in both analyst and investor side regarding the superiority, lies
within the classification of value and growth stocks.
The dichotomy of value and growth investment strategy began long time
ago. One of the earliest scholar to make the contrast between value and growth
stock were Graham and Dodd in Security Analysis (1934). Graham and Dodd
essential approach for investment is by purchasing equities at price less than their

2
intrinsic value, therefore made them regarded as father of fundamental security
analysis. The principle of Graham and Dodd investment has been carried and put
into practice by his famous disciple, Warren Buffet. Buffet started a partnership
with seven limited partners in 1959, when he was 25 with $ 105.000 in funds. He
generated a 29 percent return over the next 13 years, developing his own brand of
value investing during the period. One of his most successful investments during
the period was an investment in American Express after the company’s stock
price tumbled in the early 1960. By 1965, the partnership was at $ 26 million and
was widely viewed as successful.
For decades, a lot of studies stated that value stock investment strategy
have higher return than growth stock strategy. Scholars such as Basu (1983),
Fama and French (1992), Lakonishok et al. (1994), Capaul et al. (1993) shared the
same idea. Value investment refer to investing in stocks of firm that have low
price to book ratio (P/B), furthermore this stock also have low earning ratio (P/E)
and low price to cashflow ratio (P/C) which is considered as undervalued stock
(Bauman, Conover, and Miller, 1998). On the other hand, growth strategy mean
choosing to invest on firm stocks that have high P/E, P/B and P/C ratio which is
considered as overvalued stock (Graham and Dodd, 1934).
The phenomenon of value invesment produce higher return over growth is
defined as value premium. Capaul et al. (1993) described value premium as the
(positive) difference between returns obtained from portfolio composed of value
stocks and portfolio composed of growth stocks. This premium outcome will
influence investor whether to invest in value or growth stock thus determine their

3
strategy. The higher value premium, the more likely it is that investor give
preference to value stock due to the providence of higher returns compared to
growth stock (Bird and Casavvechia, 2007).
Numerous researchers such as Davis and Lee (2008), Fama and French
(2000) concluded that the existence of positive value premium is not unusual. It
has been been proposed that value stock produce comparatively higher return than
growth stock because value stocks are relatively more risky. Consequently the
existence of value premium has been viewed as consistent with efficient market
hypothesis.
Another explanation for value premium is raised by Lakonishok et al.
(1994) and Daniel and Titman (1997) by using overreaction hypothesis. They
conclude that investors overreact to performance and assign irrationally low
values to weak firm that have low P/B and irrationally high value to strong firm
with high P/B. When the overreaction is corrected, weak firms have high stock
returns and strong firm have low returns.
The investment community however, has continuously debate the benefit
of this particular investment strategy. Around 1990, when growth stock
outperformed value stock, advocates for growth stock strategies and thus
generated enthusiasm for growth stocks as superior investment approach (Patel
and Swensen, 2007). The value stocks proponent however, have concluded that
the data for this period represent an aberration, and that value investment strategy
will eventually outperform growth investment strategy in the long run. Other

4
study by Ibbotson and Reipe (1997) suggest that investor should consider
balancing their asset allocation approach that includes mixed investments in both
value and growth stocks.
On the opposing side of the value premium discussion, Black (1993)
explain the result in Fama and French (1992) as a misinterpretation and simply as
product of data mining in which will not provide guarantee on the result in the
presence of estimation error and changing risk premiums. Supporting Black’s
conclusion, MacKinlay (1995) argues that on the ex post basis, by grouping assets
with common disturbance terms will possibly resulting a statistically significant
deviations.
In response to Black (1993) and MacKinlay (1995) assessment that value
premium is sample specific, Fama and French (1998) look at the stock return from
countries across the world such as Japan, US, United Kingdom, Germany, Italy,
France, Belgium, Switzerland, Sweden, Australia, Hongkong and Singapore from
1975 till 1995. They form portfolio at the end of each calendar year and show that
value premium exists in 12 of 13 major markets. In addition, Liew and Vassalou
(2000) take a look at security returns from international markets (Australia,
Canada, France, Germany, Italy, Japan, Netherland, Switzerland, UK, and US).
They confirm Fama and French previous finding as the return on zero investment
portfolios are both statistically and economically significant in most markets.
The matter of value and growth stocks has been a huge topic to study
during 1990’s period and 2000’s period. Scholar such as Lakonishok et al. (1994),

5
Fama and French (1998; 2007), Bauman and Miller (1998) and Black and
McMillian (2004) further research the topic in association with return, risk and
overall performance. The studies found similar conclusion that value stocks type
have the tendency to produce higher total return and higher outcomes on risk
adjusted measures than growth stocks type both in national and international level.
The conclusion has become an advantage for value stock investor as they have
research backing in favor of value stocks. Since most scholar suggest that
portfolios consisting value stocks tend to outperform growth stocks portfolios.
The extended period of time is usually within a minimum of 10-year time period
(Bauman et al. 1998; Fama and French, 1998 ; Bird and Casavecchia, 2007;
Cahine, 2008). Capaul et al. (1993) and Bauman et al. (1998) argue that value
stocks did not outperform growth stocks in monthly and quarterly period.
On the other hand, there are reasons why some investor picking growth
stocks over value stocks even though a lot of studies show that value will
outperform growth. This is because value stocks can produce higher return as
compensation of higher risk (Fama and French, 1992). This is in line with the
concept of the value premium being derived from higher risk. Another approach
by Swensen (2000) argue that an investor enganging in pure investment in growth
stocks do not usually take fundamental analysis into account. The investor’s
strategy is instead composed of analysing the markets interpretation of the
particular stock’s future development. Furthermore an investor in growth stocks
does not care what the fundamental value is as long as the market believes that the
price today is lower than the price in the future.
6
Growth stocks type are identified as the stocks whose earnings expectation
and growth rates are substantially higher than the market averages and continue to
raise further (Babson, 1951; La Porta et al. 1997; Leladakis and Davidson, 2001;
Bourguignon and De Jong, 2003). These type of stocks are prone to be extremely
popular in the market due to the potential creation of innovation of products and
securing market opportunities. Growth stock return as expected by investors can
be obtained when the market value of those companies rise further (Babson, 1951;
Bourguignon and De Jong, 2003).
Many researchers conducted study to observe the paradigm of value and
growth stock strategy in Southeast Asia. J.Y. Yen et al. (2004) using sample from
1975 to 1997 concluded that value premium exist in Singapore no matter whether
value and growth portfolios are formed based on P/B, P/E or P/C, value stock
always provide higher return than growth stock in subsequent years, especially in
the first 2 years after portfolio formation in which prove the existence of value
premium although it may not last up to 5 years. Another study by D.K. Ding et al.
(2005) from 1976 to 1997 before the financial crisis in 1998, suggests that the
value premium is positive in Hong Kong, Japan, Malaysia and Singapore, whereas
it is significantly negative in Thailand and insignificant in Indonesia and Taiwan.
Recent study by Brown et al. (2008) also found value premium in Singapore.
Although number of researches has been performed in Southeast Asia
market, there is still controversy about value and growth stock strategy in
Indonesian stock market. One study by Roll, (1995) shown that value stocks
performed better than growth stocks in Indonesia during research period from

7
1985 – 1992 by using P/B to classify the portfolios while also facing data
unavailability as one of the research limitation during the period. This could be
improved by adding variable such as P/E, P/C or Dividend Yield to help
classifying value and growth stocks, also data availability can be more accessible
with our current technology nowadays. Another study by Hasnawati (2010) which
examine 125 stock in Indonesia from 2003 – 2007 found that growth stocks
produce higher average return than value stocks. To deepen the insight further on
value and growth strategy in Indonesia capital market, Yesica (2014) try to find
difference in returns between value and growth stock conducted on 30 stocks
listed from 2003 – 2013 and found that there is no difference in returns among
categories.
While it is a fact that many researches has been done to study value versus
growth strategy and performance in Indonesia, very little known about using
portfolio analysis as research method. This particular method will be our approach
to study the topic above. The reason being is because portfolio analysis is the only
known method so far to enable us to examine stocks selection and evaluate the
portfolio in both short and long term. Furthermore, by using portfolio analysis we
will be able to define the strategy and form portfolio to choose based from our
analysis and observation, which is our main purpose. Therefore this research
might help us to understand value and growth stocks in Indonesia Stock Market
from fundamental level.
In term of classifying whether a stocks are value or growth, Fama and
French (1993) acknowledge that value and growth stocks drive on different scales
8
of financial ratio (multiples) to make the classification. Since the typical
characteristic of value (growth) stocks is the relative comparison of fundamental
value of company with market prices, it is very common to use ratio such as P/E,
P/B, P/C as tool to classify stocks. While it is viable to use only a single multiple/
ratio to classify stocks (e.g. Capaul et al. 1993), Chahine (2008) argue that by
using only single multiple to classify stocks would not produce appropriate
results. Furthermore, to generates applicable results, various multiples should be
used since multiples are analyzed from different perspectives (Chahine, 2008).
Therefore, this study will use P/E, P/B, and P/C ratio as classification tools.
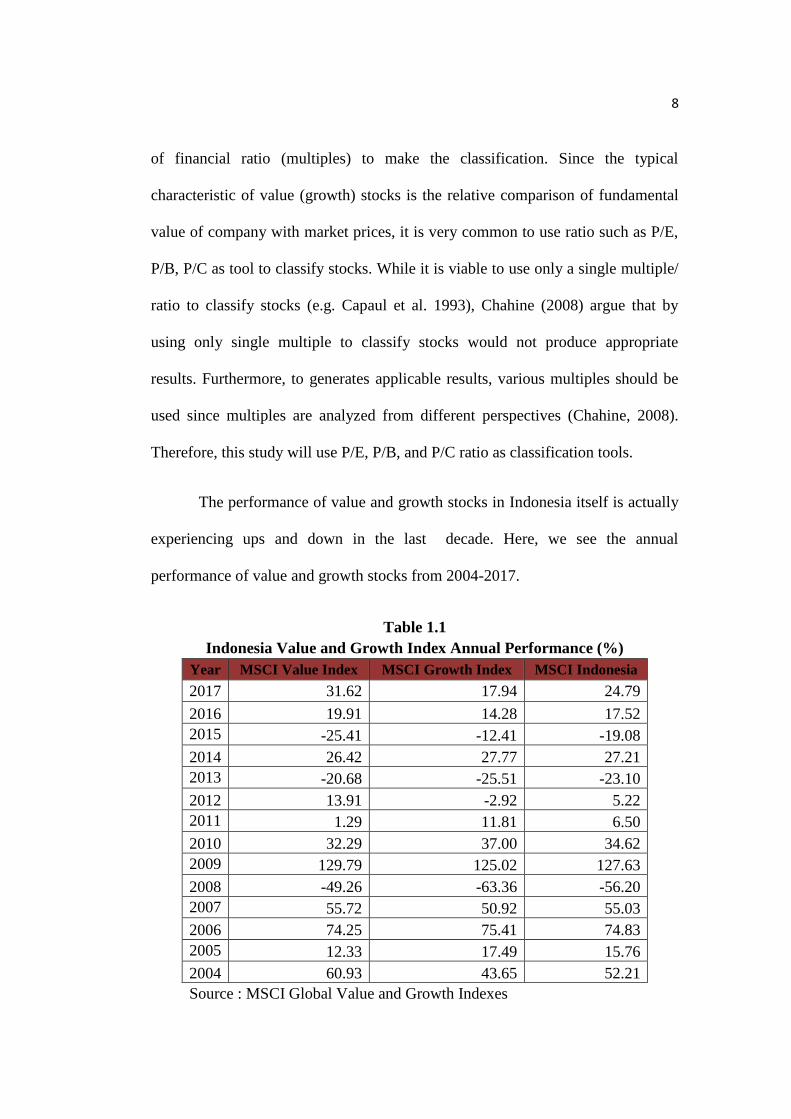
The performance of value and growth stocks in Indonesia itself is actually
experiencing ups and down in the last decade. Here, we see the annual
performance of value and growth stocks from 2004-2017.
Table 1.1
Indonesia Value and Growth Index Annual Performance (%)
Year MSCI Value Index MSCI Growth Index MSCI Indonesia
2017 31.62 17.94 24.79
2016 19.91 14.28 17.52
2015 -25.41 -12.41 -19.08
2014 26.42 27.77 27.21
2013 -20.68 -25.51 -23.10
2012 13.91 -2.92 5.22
2011 1.29 11.81 6.50
2010 32.29 37.00 34.62
2009 129.79 125.02 127.63
2008 -49.26 -63.36 -56.20
2007 55.72 50.92 55.03
2006 74.25 75.41 74.83
2005 12.33 17.49 15.76
2004 60.93 43.65 52.21
Source : MSCI Global Value and Growth Indexes

9
As shown in the Table 1.1 above, value stocks able to beat growth stocks
and Indonesia index in 2004, 2007, 2009, 2012, 2016 and 2017. Even during
global crisis in 2008, value stocks still suffer the least setback at -49.26 % while
growth suffer the worse at -63.36 %. But this glory of value stocks is not always
the case, back in 2015 value stocks suffered major setback (-25.41%) even worse
than general index (-19.08 %) and growth stocks index (-12.41%). On the other
hand, there are only few occasions in which growth stocks outperform the other
indexes such as in 2005, 2006, 2010, 2014, and especially in 2011. Back in 2011
growth stocks index achieving a short lived superiority against all other indexes at
level 11.81 % with at least 10% difference against value stocks (1.29 %).
As the data presented above, value stocks seemed to be superior strategy
than growth stocks. But it does not guarantee clear strategy as the data above only
show annual performance of the indexes while short term investment and stocks
selection strategy still left untouched. Thus leaving vague answer and opportunity
for us to re-examine this topic using portfolio analysis as our method. Therefore
research on value and growth investments strategy should be fairly interesting and
relevant to do in Indonesia Capital Market. According to phenomenon, research
gap and data presented above, the title of this research is :
“Value versus Growth Stocks : Portfolio Analysis Approach on
Indonesia Stock Exchange ”

10
1.2 Problem Formulation
The primary aim of every investor is to gain profit and value increase on
their assets in the future. Hence, many technique analysis and strategy were
devised in order to win the market. One of those strategy is by classifying stock as
value and growth then forming portfolios accordingly to help managing the stocks
better. Many researchers suggest that value stocks will outperform growth stocks
during an extended period of time, but the fact that growth stocks strategy still
somewhat popular and also proven to outperform value stocks during 90’s period
should be interesting topic to delve into. Also the unstability of value and growth
stocks performance in Indonesia Stock Market might need to be re-examined to
help finding strategy for any value or growth investment. Our study here should
be able to help clearing this ambiguous state of investment style superiority
between value and growth stocks at least on Indonesia Stock Market.
Furthermore, this study will also evaluate and analyze the performance of
portfolios to help devising strategy in term of stock selection method. In addition,
since Indonesia is one of the major economic power in Southeast Asia, the gradual
growing financial power of Indonesia Stock Market over time should also make
this study worthwhile, These will be our main concern in this research, thus
raising questions :
1. Does value stocks strategy outperform growth stocks based from P/B ratio
on Indonesia Stock Market ?

11
2. Does value stocks strategy outperform growth stocks based from P/E ratio
on Indonesia Stock Market ?
3. Does value stocks strategy outperform growth stocks based from P/C ratio
on Indonesia Stock Market ?
1.3 Research Objectives
Fundamental goal of this research according to research problem and
questions are :
1. To analyze value and growth stocks portfolio performance based P/B ratio in
Indonesia Stock Market.
2. To analyze value and growth stocks portfolio performance based P/E ratio in
Indonesia Stock Market.
3. To analyze value and growth stocks portfolio performance based P/C ratio in
Indonesia Stock Market.
1.4 Research Utility
Utility of this research as following:
1. Theoretical
This research use portfolio analysis as method in order to approach
problem fundamentally thus give insight to academicians and also provide
support for further research regarding this topic.
2. Practical
By develop and analyse performance of each portfolio within certain time

12
frame, this study could provide strategy and formation to investment
community as to help them make decision, picking investment, and
arranging portfolios.
1.5 Thesis Structure
This research structure as following :
Chapter 1 : Introduction
This chapter contain background research and evidence of value and
growth stocks strategy in the past as well as research gap done by previous
research in order to construct foundation of research, which will also build
problem formulation, research objectives, utility and thesis structure at last
Chapter 2 : Literature Review
Literature Review give insight on fundamental theory of value and growth
stocks investing style and definitive meaning of variables this research concerning
about. Begin with definition of investment, then discussing of the stock
classification and definition of value and growth stocks, also previous research
finding to help provide perspective regarding the main problem.
Chapter 3 : Research Method
This section will provide research variables, data and source, sample and
population, data collection method and analysis method
13
Chapter 4 : Result and Analysis
Here, the results of processed data will be discussed and analysed and also
interpretation of the result.
Chapter 5 : Conclusion
This chapter will provide conclusion of this research and limitations, also
suggestion for further research.