value retail news + august partners€¦ · main st./free-standing stores outlet/factory outlet...
TRANSCRIPT

1

2
Value Retail News + August Partners:
2014 National Online Consumer Study
Top 50 U.S. Markets
Conducted 9/6-9/12, 2014
1,790Responses, Ages 13-65+
Closed-end Responses
Open-end Dialog Boxes
HH Income
Segments
$80K Avg.

FINDINGS
OVERVIEW
3

57.1%
68.2%
68.4%
70.8%
72.4%
75.5%
84.1%
0% 10% 20% 30% 40% 50% 60% 70% 80% 90%
Lifestyle Centers
Outlet Center
Main St./Free-Standing Stores
Online Fashion Sites
Enclosed Malls
Retail Store Websites
Big Box Centers
Tested Venue Visit Incidence Past 12 Months
Tested Venue Visits: 1X or More
4

20.4%
17.9%
16.5%
13.8%
13.3%
9.4% 8.6%
Tested Shopping Venue Visit Share
Big Box Open-Air Ctrs. (Target,Marshalls, etc.)
Online Fashion Retail Sites (Amazon,Rue La La, Gilt, Wanelo, etc.)
Any Retail Store Website (Gap,Aeropostale, Chico's, Macy's, etc.)
Enclosed Mall
Main St./Free-Standing Stores
Outlet/Factory Outlet Centers
Open-Air Lifestyle Fashion Ctr.
Shopping Venue Visit Share
5
Re-based to 100%; 5.1% of respondents had not visited any of these tested venues in the past 12 months

1.0% 1.7%
11.2%
17.9%
9.4% 8.6%
20.4%
13.8%
0%
5%
10%
15%
20%
25%
Outlets Lifestyle Ctrs. Power Ctrs. Malls
GLA % Visit Share %
Outlets – A Disproportionate Visit Share vs. GLA Percentage
6

Venues Shopped Avg. HH
Income
Avg. Annual
Apparel
Spend
App
Spend/HH
Income Index
Enclosed Malls $82,518 $1,008 122
Lifestyle Centers $88,515 $1,149 130
Outlet Centers $84,500 $1,045 124
Big Box Centers $82,472 $987 120
Main Street/Free-Standing Stores $84,506 $1,029 122
Retail Store Websites $83,905 $1,036 123
Fashion Retail Sites $84,592 $1,052 124
Venues Shopped Comparisons
7

8
Apparel Spend Comps by Census Divisions & Regions
August Partners/ICSC VRN 2014 National Survey Avg. Ann. Apparel
Spend
Respondent Geographic Segmentation
New England Division $799
Middle Atlantic Division $1,024
Subtotal: Northeast Census Region $968
East North Central Division $889
West North Central Division $673
Subtotal: Midwest Census Region $837
South Atlantic Division $940
East South Central Division $1,012
West South Central Division $1,005
Subtotal: South Census Region $964
Mountain Division $844
Pacific Division $987
Subtotal: West Census Region $944
U.S. Top 50 Markets Total: $934
- 6.3%
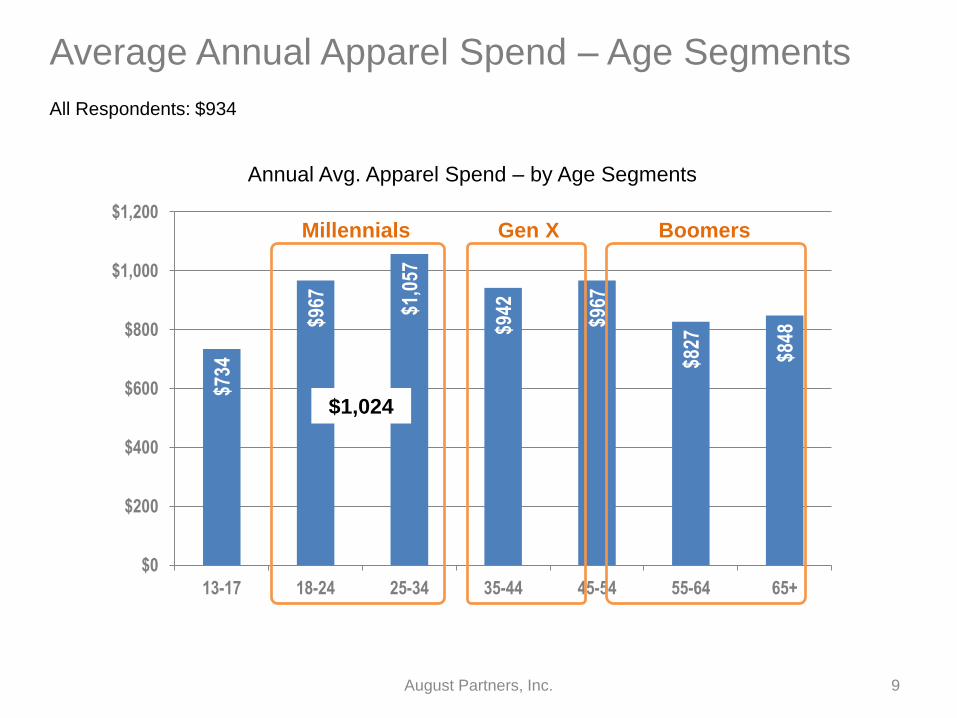
$734
$967
$1,0
57
$942
$967
$827
$848
$0
$200
$400
$600
$800
$1,000
$1,200
13-17 18-24 25-34 35-44 45-54 55-64 65+
Annual Avg. Apparel Spend – by Age Segments
Millennials Gen X Boomers
Average Annual Apparel Spend – Age Segments
9
All Respondents: $934
August Partners, Inc.
$1,024

Shopper
Characteristics
Low
(38%)
Moderate
(30%)
High
(32%)
(< $500) ($500-$999) (> $1,000)
Avg. HH Income $59,310 $81,240 $107,080
Brand-Influenced 16.2% 31.2% 52.6%
Fashion Forwards™ 16.2% 24.4% 49.3%
Jeanetics™ $44 $51 $74
Correlating Apparel Spend to Shopper Characteristics
10

Apparel Spend by Venue – Past 12 Months
25.9%
28.4%
45.7%
Where Did You Spend Your Apparel, Shoes & Accessories Dollars the Past 12 Months?
Outlet Centers
Online Stores & Sites
All Other Bricks &Mortar
Physical = 71.6%
11

27.5%
44.3%
44.4%
49.2%
53.6%
59.6%
65.6%
0% 10% 20% 30% 40% 50% 60% 70%
Lifestyle Centers
Main Street/Free-Standing Stores
Outlet Centers
Retail Store Websites
Online Fashion Sites
Enclosed Malls
Big Box Centers
Holiday 2014 Projected Shopping Venue Incidence Levels
Christmas 2014 Shopping Venues Projection
12

VALUE
STANCE
13

26.5%
22.9% 18.7%
23.3%
8.6%
Almost Never Buy Full Price
Seldom Buy at Full Price
Occasionally Buy Full Price
Balance Full Price w/ Off-Price
Buy What I Want; Price Not aConcern
Value Stance Segmentation
14
91% of Shoppers are Looking for a Deal Full Price Shoppers

3.3%
7.9%
10.1% 11.3%
15.6%
24.0%
27.8%
0%
5%
10%
15%
20%
25%
30%
Lifestyle Centers Main St./Free-Standing Stores
Retail StoreWebsites
Enclosed Malls Online FashionRetail Sites
Outlet Centers Big Box Centers
Tested Venues - Best Value Delivery Perception
Up from 19.4% in 2013
15
Value Delivery Perceptions
Down from
32.8% in 2013
Down from
19.9% in 2013 Down from
15.8% in 2013 Up from 6.1%
in 2013

18.2%
55.1%
10.7%
16.1%
0% 10% 20% 30% 40% 50% 60%
Delivering Better Value than Past Years
Delivering the Same Value
Delivering Lower Value
Not Sure/Uncertain
How is Your Favorite Outlet Center Doing in Terms of Delivering Value on Apparel Goods?
Outlet Center Value Delivery Perception (cont.)
16
MINDSET
METRICS
17

Respondent Profile Data
Fashion Stance™ Category
Avg. Ann.
Apparel
Spend
Avg. HH
Income
Jeanetics™
(Avg. Jeans
Spend)
Fashion Moderates $789 $79,424 $40
Fashion Forwards™ $1,345 $86,954 $59
All Respondents $934 $80,235 $45
Fashion Forwards apparel spend is 70% higher than Fashion
Moderates, although the segment’s HH income is just 9.5% higher
The Fashion Forwards™ Mindset Metric
18

Venues Shopped
Fashion
Forwards
Percentage
Enclosed Malls 30.7%
Lifestyle Centers 35.6%
Outlet Centers 33.0%
Main Street/Free-Standing Stores 31.0%
Retail Store Websites 31.1%
Fashion Retail Sites 32.4%
Big Box Centers 30.2%
Where Are the Fashion Forwards™ Shopping?
19

No Influence
(32%)
Sometimes
Influenced (41%)
Usually-to-Always
Influenced (24%)
Avg. HH Income $74,471 $79,573 $91,475
Avg. Apparel Spend $699 $864 $1,405
Fashion Forwards™ % 16.1% 23.5% 49.2%
The Brand-Influenced Shopper
20

TOP 10
STORE BRANDS
21

Top 10 by Preference
Percentage
Percent
Nike 51.8%
Victoria's Secret 50.8%
GAP 42.9%
H & M 37.9%
Forever 21 36.8%
The North Face 36.1%
Polo Ralph Lauren 34.6%
Adidas 34.3%
American Eagle Outfitters 34.2%
Coach 33.9%
Top 10 by Apparel
Spend
Avg. Ann.
Apparel
Spend
Theory $1,641
Vince $1,611
Tory Burch $1,487
Vineyard Vines $1,436
Cole-Haan $1,427
Burberry $1,410
Aldo $1,348
Prada $1,346
Kate Spade $1,332
Lululemon Athletica $1,316
Preferred Store Brands
22
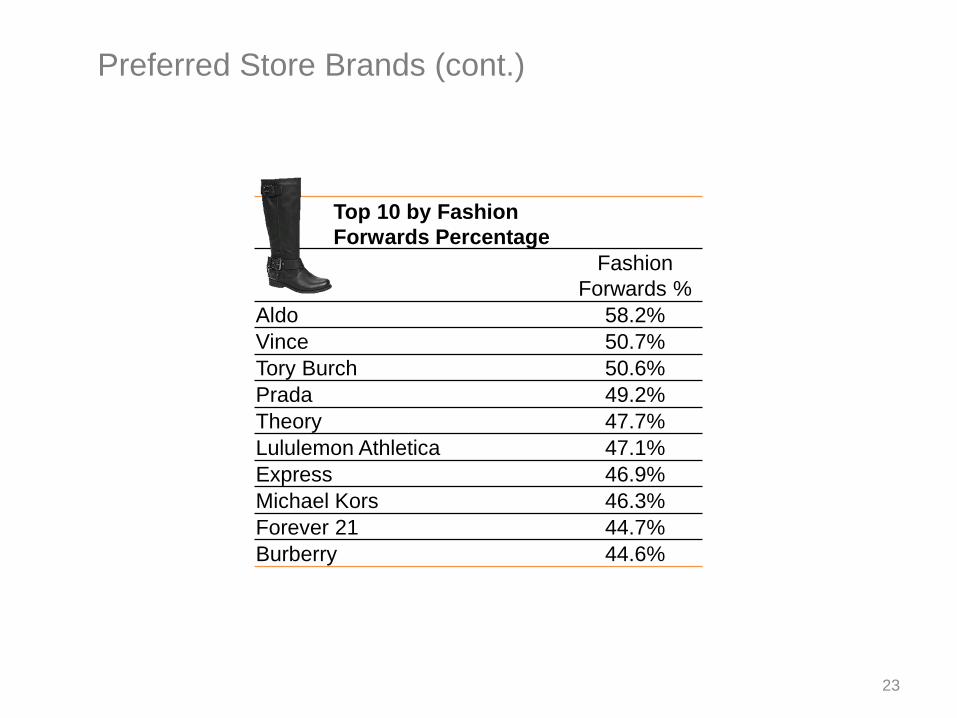
Top 10 by Fashion
Forwards Percentage
Fashion
Forwards %
Aldo 58.2%
Vince 50.7%
Tory Burch 50.6%
Prada 49.2%
Theory 47.7%
Lululemon Athletica 47.1%
Express 46.9%
Michael Kors 46.3%
Forever 21 44.7%
Burberry 44.6%
Preferred Store Brands (cont.)
23

ONLINE
SHOPPING
24

15.4%
16.3%
16.6%
18.0%
20.3%
30.5%
80.9%
0% 10% 20% 30% 40% 50% 60% 70% 80% 90%
Wanelo
Rue La La
Nasty Gal
Gilt
HauteLook
Zulily
Amazon
Fashion Site Visit Incidence Level
Apparel Site Visits – Past 90 Days
25

$114
$125
$151
$159
$163
$174
$189
$0 $20 $40 $60 $80 $100 $120 $140 $160 $180 $200
Amazon
HauteLook
Rue La La
Wanelo
Gilt
Nasty Gal
Zulily
Respondent Spend – Most Recent Visit
Fashion Site Spend from Z to A
26 August Partners, Inc.

If your favorite outlet
center were to develop a
mobile app which could
sense when you were in
the center and notify you
of special retailer sales
and promotions, how likely
would you be to download
and use that app on your
smartphone?
Q: 39.4%
27.7%
32.9%
0%
5%
10%
15%
20%
25%
30%
35%
40%
45%
Would DefinitelyDowload & Use
Would NotDownload &
Use
Undecided
Mobile App Download/Usage Likelihood
The Mobile App Question
27

OUTLET
SHOPPING
INFLUENCERS
28

30.5%
38.7%
42.2%
48.6%
50.3%
0% 10% 20% 30% 40% 50% 60%
The Shopping Experience
Location - Close to Home
Brand Name Stores in Outlets
The Value Outlets Deliver
The Number + Variety of Stores
What Influences Your Choice to Shop at an Outlet Center?
Outlet Shopping Drivers
29

12.0%
12.4%
13.0%
21.0%
30.3%
39.9%
0% 5% 10% 15% 20% 25% 30% 35% 40% 45%
Already Shop at Outlets on a Regular Basis
Do Not Have the Store Brands I Like
Quality of Mdse. - Not Good Value
Don't Like Experience (Parking, Crowds, etc.)
Sometimes Prefer to Shop at Regular Retail Stores
Closest Outlet too Far from Home
What Keeps You from Shopping at Outlets More Frequently?
Outlet Shopping Detractors
30

13.9%
16.5%
17.0%
27.4%
37.3%
55.0%
0% 10% 20% 30% 40% 50% 60%
Improved Center Aesthetics
More Sit-Down Restaurants
More Food Court Eating Places
Easier Shopping Layout
More of Specific Stores I Like
Location Closer to Home
What Would Drive Higher Outlet Center Shopping Frequency?
Outlet Shopping Enhancers
31

13.9%
16.5%
17.0%
27.4%
37.3%
0% 5% 10% 15% 20% 25% 30% 35% 40%
More Restrooms
More Benches & Seating Areas
Children's Play Area
Concierge/Personal Shopper Services
Smartphone Apps - In-Center Deal Alerts
Which of these Features & Amenities would You Like to See in an Outlet Center?
Outlet Features & Amenities Ranking
32

DEVICE &
MEDIA USAGE
33

20.3%
23.2%
33.1%
15.5%
16.6%
19.7%
8.7%
14.5%
15.7%
11.0%
10.3%
22.3%
20.4%
22.4%
7.4%
24.1%
13.0%
1.9
%
0% 10% 20% 30% 40% 50% 60% 70% 80% 90% 100%
Mobile-Tablet
Mobile-Smartphone
At-Home Internet
Device Usage Spectrum
34

35
18.2%
19.4%
20.1%
36.0%
36.8%
37.4%
38.6%
39.0%
42.1%
51.2%
58.2%
75.1%
24.7%
20.0%
14.9%
25.3%
15.4%
25.7%
23.2%
23.6%
18.7%
19.3%
20.3%
10.4%
57.1%
60.6%
65.0%
38.7%
47.8%
37.0%
38.2%
37.4%
39.3%
29.5%
21.5%
14.5%
0% 10% 20% 30% 40% 50% 60% 70% 80% 90% 100%
Hotel staff/In-room guide/Tourist publication
Websites like Rue La La/Gilt Groupe
Shopping center websites
Emails from shopping centers I have chosen
Mobile/smart phone applications
Displays & signage throughout a shopping center
Newspaper
Direct Mail
Customer loyalty clubs/programs
Emails from stores I have chosen
Already Using Don't Use Now, but Likely to Use in Near Future Do Not Use/ Unlikely to Use
Media Usage – Sales Information & Coupons
Yes, Email…

36
6.7%
0.7%
8.9%
14.6%
15.5%
16.3%
22.0%
23.3%
31.1%
64.9%
0% 10% 20% 30% 40% 50% 60% 70%
None of the above/not sure
Other
Shopping center websites
Social sites like Facebook/Pinterest
Newspaper(s)
Emails from centers/malls I have chosen
Mobile/Smart Phone Apps
Direct mail to my home
Emails from stores I have chosen
Most Preferred Media Options
Preferred Method of Communication for Receiving
Sales Coupons/Information for Apparel
