value of static venous pressure for predicting arteriovenous graft thrombosis
TRANSCRIPT
Kidney International, Vol. 61 (2002), pp. 1899–1904
Value of static venous pressure for predicting arteriovenousgraft thrombosis
LAURA M. DEMBER, ERIKA F. HOLMBERG, and JAMES S. KAUFMAN
Renal Sections, Boston University School of Medicine and VA Boston Healthcare System, Boston, Massachusetts, USA
Value of static venous pressure for predicting arteriovenous States currently approaches one billion dollars [1, 2].graft thrombosis. The most common cause of access failure is thrombosis,
Background. Static venous pressure elevation has been which occurs in arteriovenous (AV) grafts at a rate ofshown to have both high sensitivity and high specificity for0.6 to 1.2 per patient-year [3–5].hemodialysis arteriovenous (AV) graft venous anastomosis ste-
Stenosis at or near the venous anastomosis has beennosis. However, it is not known how well static venous pressureelevation predicts subsequent AV graft thrombosis. found in 80 to 95% of patients undergoing radiologic
Methods. Monthly static venous pressure measurements or surgical repair of thrombosed AV grafts [6–8]. Mostwere made during two consecutive dialysis sessions in all pa- stenotic lesions can be corrected, at least temporarily,tients with a functioning upper extremity AV graft in two
by percutaneous transluminal angioplasty or bypassedhemodialysis units during a 16-month period. Static venoussurgically. Several studies have suggested that early de-pressure was normalized to systolic blood pressure and cor-
rected for the height difference between the AV graft and the tection and repair of stenosis can prevent access throm-dialysis machine pressure transducer to yield the static venous bosis and prolong access life [3, 4, 9, 10]. Reductions inpressure ratio (SVPR).
access thrombosis rates to approximately 0.2 per patient-Results. Fifty-four patients (38%) had a thrombotic eventyear have been reported following implementation ofduring the study period and thus were labeled as clotters.
Among the clotters, SVPR just prior to thrombosis was 0.51 � access monitoring and repair programs [3, 4]. These find-0.16 (mean � SD), and mean time to thrombosis following an ings have led to recommendations by the National Kid-elevated SVPR (�0.4) was 118 � 106 days. Receiver operating ney Foundation – Kidney Disease Outcomes Qualitycharacteristic (ROC) curves were generated using the sensitivi-
Initiative (NKF-K/DOQI) that accesses be monitoredties and specificities of a range of SVPR values for accessregularly for the development of stenosis and repairedthrombosis within one, two, three and four months. The areas
under the curve (AUCs) for the ROC curves ranged from with angioplasty or surgery prior to thrombosis [11].0.557 to 0.638, reflecting the absence of SVPR values with both Measurement of AV graft venous pressure has beenhigh sensitivity and high specificity for access thrombosis. An utilized as a non-invasive screening test for venous steno-increase in SVPR over time was not a better predictor of access
sis [3, 4, 11, 12]. Venous pressure monitoring is an attrac-thrombosis than absolute SVPR.tive methodology because it can be performed duringConclusion. Static venous pressure measurement is not an
optimal screening test for identifying AV grafts at risk for the dialysis session and does not require equipment otherthrombosis. than a dialysis machine with a digital pressure display.
Elevated static venous pressure has been shown by Be-sarab and colleagues to be highly sensitive and specific
Maintenance of vascular access for hemodialysis is one for detecting venous stenosis [4, 12]. However, the extentof the major challenges in caring for patients undergoing to which elevated venous pressure, or demonstration ofchronic hemodialysis. Access-related problems are among actual stenosis, predicts subsequent access thrombosis isthe most frequent reasons for hospitalization in the end- unknown. The objective of this study was to determinestage renal disease (ESRD) population, and the annual the value of venous pressure monitoring for predictingcost of vascular access placement and repair in the United subsequent AV graft thrombosis.
Key words: AV graft, thrombosis, stenosis, vascular access, hemodialy- METHODSsis, end-stage renal disease.
PatientsReceived for publication June 21, 2001
Monthly static venous pressure measurements wereand in revised form December 10, 2001Accepted for publication December 24, 2001 obtained between May 1, 1998 and August 31, 1999 in all
patients undergoing chronic hemodialysis via an upper 2002 by the International Society of Nephrology
1899
Dember et al: Predictive value of static venous pressure1900
Table 1. Patient and arteriovenous graft characteristics (N � 112)extremity AV graft at two dialysis facilities affiliatedwith Boston University School of Medicine (N � 164). Male/Female % 54/46
Age, years median (range) 62 (23–88)Patients were excluded from the analysis for the follow-Diabetes mellitus % 57ing reasons: (1) AV graft surgery or angioplasty for infec- Forearm/upper arm graft % 44/56
tion, pseudoaneurysm, upper extremity swelling, or inad-equate dialysis during the observation period; or (2)participation in a concurrent study requiring access inter-vention for venous pressure elevation. For the sensitivity Besarab et al to have the best predictive value for access
stenosis when venous pressure measurement is normal-and specificity analysis, patients with fewer than twomonthly static venous pressure ratio (SVPR) determina- ized to systolic blood pressure [12].tions of observation prior to thrombosis or end of follow-
Statistical analysisup were also excluded. The study was approved by theInstitutional Review Board of Boston University Medi- Comparisons between continuous variables were made
using the Student t test. Correlation coefficients were de-cal Center.termined using least squares regression analysis. P values
Static venous pressure measurements �0.05 were considered statistically significant. Receiveroperating characteristic (ROC) curves were generatedStatic venous pressure measurements were performed
during two consecutive dialysis sessions each month us- using SPSS for Windows 10.0 software (SPSS, Inc., Chi-cago, IL, USA).ing a method modified from that of Besarab et al [12].
Venous drip chamber pressure and systemic blood pres-sure were obtained 20 to 30 seconds after turning off
RESULTSthe dialysis blood pump using the dialysis machine digital
Patientspressure display. The intra-access venous pressure wascalculated as follows: PIA � PDC � dH, where PIA (mm Hg) Monthly venous pressure measurements were ob-
tained from 164 patients with upper extremity AV graftsis intra-access pressure, PDC (mm Hg) is venous dripchamber pressure, and dH (cm) is the difference in height during the study period. Twenty-three of these patients
were excluded from the analysis because of an accessbetween the venous drip chamber pressure transducerand the venous needle in the access. The SVPR refers intervention for infection, pseudoaneurysm, upper ex-
tremity swelling, or inadequate dialysis (N � 11), orto the intra-graft pressure normalized to systolic bloodpressure: SVPR � PIA/SBP. participation in a concurrent intervention trial (N � 12).
Twenty-nine additional patients were excluded from theIn a subset of patients SVPR was calculated usingthe formula described above as well as by the method sensitivity and specificity analysis because they had fewer
than two monthly SVPR determinations prior to throm-described by Besarab and colleagues [12]. For the lattermethod, the static venous pressure measurement was bosis or the end of follow-up. Demographic and clinical
characteristics of the 112 patients included in the sensitiv-normalized to mean arterial blood pressure (MAP)rather than systolic blood pressure (SBP), and the follow- ity and specificity analysis are shown in Table 1.ing formula was used to correct the PDC for the height
Thrombotic eventsdifference between the access and the venous drip cham-ber transducer: PIA � PDC � 1.6 � 0.74(dH). To deter- Fifty-four patients (38%) had a thrombotic event dur-
ing the study period and thus were labeled as clotters.mine whether ultrafiltration pressure altered the SVPR,measurements with and without clamping of the tubing Data collection for a clotter ended at the time of the
thrombotic event. The SVPR just prior to thrombosisbetween the dialyzer and the venous drip chamber alsowere obtained. The two measurements were made within was 0.51 � 0.16 (mean � SD), and the mean time to
thrombosis following an elevated SVPR (�0.4) was 118 �a five minute period with the unclamped measurementperformed prior to the clamped measurement. 106 days.
For patients without a thrombotic event during theAll SVPR measurements were performed by a singlemember of the study team. The monthly SVPR was the study period (non-clotters), data collection continued
until the end of the study period or until the patient leftmean of the values obtained during the two consecutivedialysis sessions. The nephrologists caring for the pa- the dialysis facility or died. The mean time of observation
following an elevated SVPR in non-clotters was 211 �tients were not aware of the measurement results. Aroutine access monitoring and prophylactic repair pro- 175 days. In the non-clotters, the slope of SVPR versus
time (0.00015 � 0.00059; mean � SD) was not signifi-gram was not in place in the dialysis facilities duringthe study period. All patients were dialyzed with Cobe cantly different from zero (P � 0.80), indicating that
there was not a time-dependent change in SVPR in theseCentrysystem 3 or Centrysystem 3 Plus machines. Wedefined an elevated SVPR as �0.4, the value found by patients.

Dember et al: Predictive value of static venous pressure 1901
Fig. 1. Receiver operating characteristic(ROC) curves relating the static venous pres-sure ratios (SVPRs) to arteriovenous (AV)graft thrombosis within one, two, three andfour months.
Table 3. Predictive value of SVPRa for thrombosis within one monthTable 2. AUCs of ROC curves relating SVPRa to thrombosis
ROC curve N AUCb 95% CI Sensitivity Specificity Accuracyb PPV NPVaSVPRthreshold %One month 112 0.638 0.529–0.747
Two months 95 0.633 0.513–0.753�0.2 98 3 40 39 67Three months 78 0.557 0.412–0.701�0.3 84 22 46 41 69Four months 70 0.587 0.428–0.747�0.4 73 47 57 47 73
Abbreviations are: AUC, area under the curve; ROC, receiver operating �0.5 48 75 64 55 69characteristic; SVPR, static venous pressure ratio; CI, confidence intervals. �0.6 25 93 66 69 66
a SVPR is the ratio of static venous pressure/systolic blood pressure measured �0.7 9 99 63 80 63at dialysis machine blood flow rate of 0 mL/min
�0.8 3 99 61 50 61b A test with no predictive value will yield an ROC curve with AUC of 0.5while a test with perfect discriminating ability will yield an ROC curve with Abbreviations are: SVPR, static venous pressure ratio; PPV, positive pre-AUC of 1.0 dictive value; NPV, negative predictive value.
a SVPR is the ratio of static venous pressure/systolic blood pressure measuredat dialysis machine blood flow rate of 0 mL/min
b Accuracy is defined as (true positives � true negatives)/total measurements
Venous pressure test characteristics
Absolute SVPR. The sensitivity and specificity of ve-of various SVPR thresholds are shown in Table 3. Thenous pressure ratios for subsequent access thrombosissensitivity and specificity of SVPR �0.4 were 73% andwas determined using the SVPR obtained one month,47%, respectively. For SVPR �0.5, the sensitivity andtwo months, three months and four months prior tospecificity were 48% and 75%, respectively. None of theeither thrombosis (in clotters) or last venous pressureother SVPR thresholds had better test characteristicsmeasurement (in non-clotters). ROC curves generated(that is, both high sensitivity and high specificity forfrom these sensitivities and specificities are shown inthrombosis within one month) than either SVPR �0.4Figure 1, and the AUCs are listed in Table 2.or �0.5. The utility of SVPR was no better for predictingThe sensitivities, specificities, and positive and nega-
tive predictive values for thrombosis within one month thrombosis within two, three or four months than for
Dember et al: Predictive value of static venous pressure1902
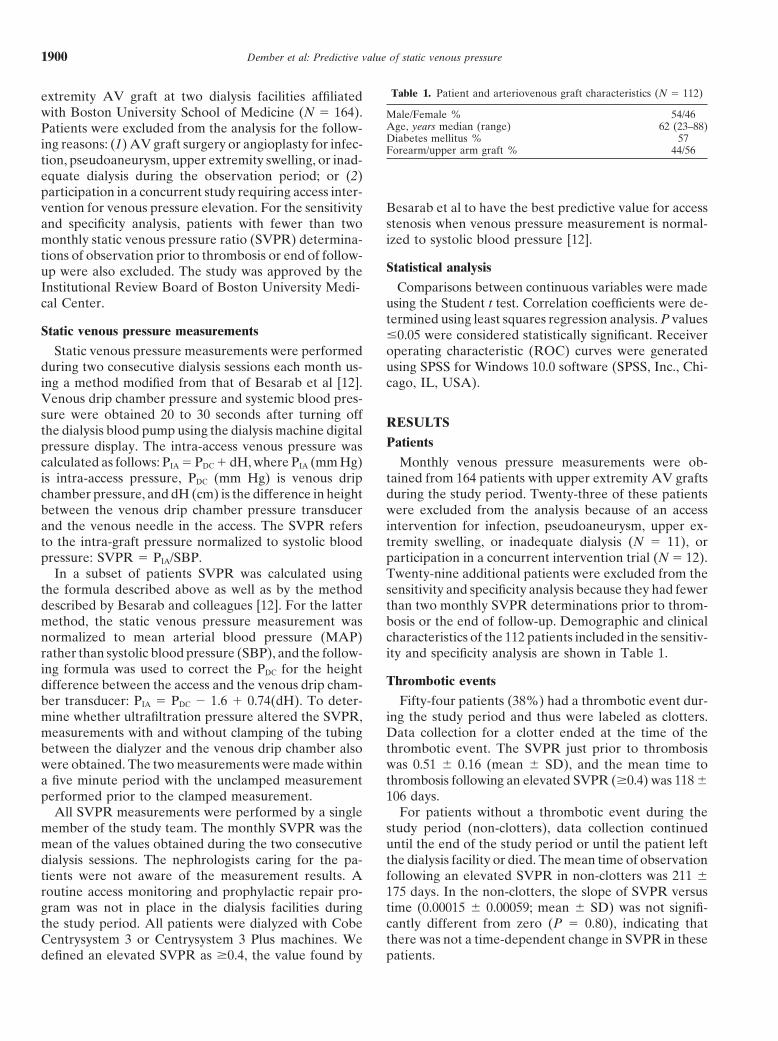
Fig. 2. ROC curves relating increases in SVPR over (A) one month, (B) three months, or (C) six months to AV graft thrombosis within onemonth. (A) AUC � 0.547; 95% CI � 0.434 to 0.660. (B) AUC � 0.631, 95% CI � 0.495 to 0.767. (C) AUC � 0.624; 95% CI � 0.461 to 0.786.
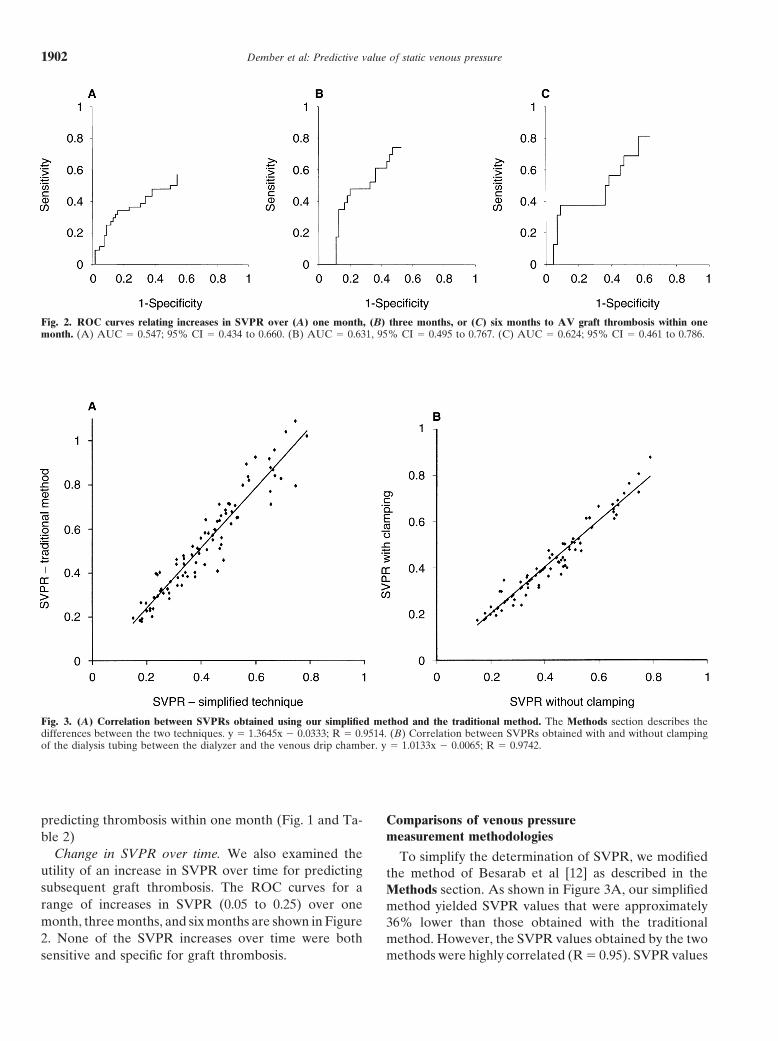
Fig. 3. (A) Correlation between SVPRs obtained using our simplified method and the traditional method. The Methods section describes thedifferences between the two techniques. y � 1.3645x � 0.0333; R � 0.9514. (B) Correlation between SVPRs obtained with and without clampingof the dialysis tubing between the dialyzer and the venous drip chamber. y � 1.0133x � 0.0065; R � 0.9742.
predicting thrombosis within one month (Fig. 1 and Ta- Comparisons of venous pressuremeasurement methodologiesble 2)
Change in SVPR over time. We also examined the To simplify the determination of SVPR, we modifiedutility of an increase in SVPR over time for predicting the method of Besarab et al [12] as described in thesubsequent graft thrombosis. The ROC curves for a Methods section. As shown in Figure 3A, our simplifiedrange of increases in SVPR (0.05 to 0.25) over one method yielded SVPR values that were approximatelymonth, three months, and six months are shown in Figure 36% lower than those obtained with the traditional2. None of the SVPR increases over time were both method. However, the SVPR values obtained by the two
methods were highly correlated (R � 0.95). SVPR valuessensitive and specific for graft thrombosis.

Dember et al: Predictive value of static venous pressure 1903
were not altered by elimination of the clamping of the pseudoaneurysm, upper extremity swelling, or inade-quate dialysis included among the clotters. The modifica-blood tubing between the dialyzer and the venous drip
chamber (Figure 3B). tion in the analysis did not improve the SVPR test charac-teristics (data not shown).
Variability of venous pressure measurements Another possible reason for the poor predictive valueof elevated SVPR for graft thrombosis is that SVPRThe variability between SVPRs obtained during con-
secutive dialysis sessions was assessed by calculating the does not adequately identify those grafts that have anangiographically significant stenosis. This possibility alsocoefficient of variation for the two SVPRs obtained for
each patient during a single month. The coefficient of seems unlikely. Besarab and colleagues found an SVP/SBP ratio �0.4 to have a sensitivity of 91% and a speci-variation was 0.17 � 0.18 (mean � SD).ficity of 86% for predicting the presence of a stenosis�50% [4]. In a separate study, using MAP rather than
DISCUSSIONSBP to normalize SVP, the same investigators found a
Our results suggest that static venous pressure mea- SVPR �0.5 to have a sensitivity of 86% and a specificitysurement, although simple to perform, is not an optimal of 92% for predicting the presence of a stenosis �50%screening test for identifying AV grafts at risk for throm- [12]. Figure 3 shows that our simplified method of staticbosis. No SVPR threshold has both high sensitivity and venous pressure measurement yielded SVPRs that corre-high specificity for subsequent AV graft thrombosis. late strongly with those obtained using the method ofThus, utilization of static venous pressure monitoring Besarab et al [12], making it unlikely that methodologicalto screen for AV graft stenosis could be problematic. differences are responsible for the poor predictive valueDepending on the SVPR threshold used to trigger inter- found in our study. Furthermore, a stenosis �50% wasvention, a substantial proportion of patients will either found in 11 of 12 patients (92%) who underwent angiog-be subjected to unnecessary invasive procedures or have raphy for asymptomatic SVPR �0.4 as part of a concur-appropriate procedures to prevent impending thrombo- rent, ongoing intervention trial, suggesting that oursis deferred. For example, if a SVPR �0.4 were used as SVPR measurements are highly specific for venous anas-the trigger for intervention, 53% of patients who would tomosis stenosis (unpublished data).not have thrombosed within one month would undergo Several investigators have suggested that measure-angiography and possibly angioplasty or surgical revi- ment of access blood flow is superior to venous pressuresion, and 27% of patients who might benefit from steno- measurement for identifying accesses at risk for throm-sis repair would not receive the necessary intervention. bosis [11, 13–15]. May et al directly compared severalUsing SVPR �0.5 as the threshold for angiography, access monitoring methods and concluded that a reduc-fewer patients (25%) would undergo unnecessary proce- tion in access blood flow by ultrasound dilution or Dopp-dures, but 52% of patients at risk for thrombosis would ler ultrasound is more predictive of AV graft thrombosisnot have angiography and prophylactic intervention. We than an elevated dynamic venous pressure [14]. How-found similarly poor test characteristics for increases in ever, Smits and colleagues found similar thrombosis ratesvenous pressure over time. using either access blood flow monitoring or venous pres-
There are several possible reasons for the poor test sure monitoring to trigger polyphylactic stenosis repaircharacteristics we observed. The length of observation [16]. Using ROC analyses, both Paulson et al [17] andmay have been inadequate in the non-clotters. For exam- McDougal and Agarwal [18] found reduction in accessple, if patients with elevated venous pressures were not blood flow to be an inadequate predictor of thrombosis.followed long enough to develop thrombosis following The most likely reason for the poor specificity of SVPRthe venous pressure elevation, the specificity of venous elevation found in our study is that not all venous anasto-pressure elevation would be reduced. However, it is un- mosis stenoses lead to graft thrombosis. While a stenosislikely that inadequate follow-up had a substantial impact is present in the majority of thrombosed grafts, it is noton specificity of the venous pressure threshold, because known how often stenotic grafts thrombose. There isthe mean follow-up in non-clotters after SVPR �0.4 was currently no method to discriminate between non-prob-nearly twice as long (211 days) as the mean time to lematic stenoses and those that will result in thrombosis.thrombosis after SVPR �0.4 in clotters (118 days). Our findings can be reconciled with studies demonstra-
We excluded from the analysis patients who under- ting a reduction in thrombosis rates when interventionwent access procedures for reasons other than thrombo- is instituted based upon venous pressure measurementssis because of an inability to classify them as either clot- [3, 4, 16]. As long as a proportion of stenotic graftsters or non-clotters. Because of the possibility that access progress to thrombosis, repair of stenoses will reducethrombosis would have occurred had an access proce- the thrombosis rate in a population of patients. However,dure not been performed, we repeated the analyses with our results suggest that such reductions in the overall
thrombosis rate are achieved at the expense of per-the 11 patients who had access procedures for infection,
Dember et al: Predictive value of static venous pressure1904
6. Valji K, Bookstein JJ, Roberts AC, et al: Pharmacomechanicalforming invasive and costly procedures in a substantialthrombolysis and angioplasty in the management of clotted hemo-
number of patients who may derive no benefit. Develop- dialysis grafts: Early and late clinical results. Radiology 178:243–247, 1991ment of improved techniques of graft monitoring may
7. Beathard GA: Mechanical versus pharmacomechanical thrombol-allow better selection of patients for prophylactic repair.ysis for the treatment of thrombosed dialysis access grafts. KidneyInt 45:1401–1406, 1994
8. Fan P, Schwab SJ: Vascular access: Concepts for the 1990’s. J AmACKNOWLEDGMENTSSoc Nephrol 3:1–11, 1992
The study was funded by a Gambro Healthcare Research Program 9. Sands JJ, Miranda CL: Prolongation of hemodialysis access sur-grant. A portion of this work was presented at the 1999 annual meeting vival with elective revision. Clin Nephrol 44:329–333, 1995of the American Society of Nephrology. 10. Safa AA, Valji K, Roberts AC, et al: Detection and treatment
of dysfunctional hemodialysis access grafts: Effects of a surveillanceprogram on graft patency and the incidence of thrombosis. Radiol-Reprint requests to Laura M. Dember, M.D., Renal Section, Bostonogy 199:653–657, 1996University Medical Center, EBRC 504, 650 Albany Street, Boston, Mas-
11. National Kidney Foundation: NKF-K/DOQI Clinical Practicesachusetts 02118-2308, USA.Guidelines for Vascular Access: Update 2000. Am J Kidney DisE-mail: [email protected](Suppl):S137–S181, 2001
12. Besarab A, Frinak S, Sherman RA, et al: Simplified measurementREFERENCES of intra-access pressure. J Am Soc Nephrol 9:284–289, 1998
13. Krivitsky NM: Theory and validation of access flow measurement1. Feldman HI, Kobrin S, Wasserstein A: Hemodialysis vascular by dilution technique during hemodialysis. Kidney Int 48:244–250,
access morbidity. (editorial) J Am Soc Nephrol 7:523–535, 1996 19952. U.S. Renal Data System: 1997 Annual Data Report. Bethesda, 14. May RE, Himmelfarb J, Yenicesu M, et al: Predictive measures
National Institutes of Health, National Institute of Diabetes and of vascular access thrombosis: A prospective study. Kidney IntDigestive and Kidney Disease, 1997 52:1656–1662, 1997
3. Schwab SJ, Raymond JR, Saeed M, et al: Prevention of hemodialy- 15. Schwab SJ: Vascular access for hemodialysis. Kidney Int 55:2078–sis fistula thrombosis. Early detection of venous stenoses. Kidney 2090, 1999Int 36:707–711, 1989 16. Smits JHM, van der Linden J, Hagen EC, et al: Graft surveillance:
4. Besarab A, Sullivan KL, Ross RP, et al: Utility of intra-access Venous pressure, access flow, or the combination? Kidney Intpressure monitoring in detecting and correcting venous outlet ste- 59:1551–1558, 2001noses prior to thrombosis. Kidney Int 47:1364–1373, 1995 17. Paulson WD, Ram SJ, Birk CJ, et al: Does blood flow accurately
5. Bosman PJ, Blankestijn PJ, van der Graaf Y, et al: A comparison predict thrombosis or failure of hemodialysis synthetic grafts? Abetween PTFE and denatured homologous vein grafts for haemodi- meta-analysis. Am J Kidney Dis 34:479–485, 1999alysis access: A prospective randomised multicentre trial: The 18. McDougal, Agarwal R: Clinical performance characteristics ofSMASH Study Group. Eur J Vasc Endovasc Surg 16:126–132, 1998 hemodialysis graft monitoring. Kidney Int 60:762–766, 2001