value engineering lecture 5 ahmed...
TRANSCRIPT
VALUE ENGINEERINGLECTURE 5
Ahmed Elyamany
1

VALUE METHODOLOGY JOB PLAN
The Job Plan consists of the following sequential phases.
1) Information Phase
2) Function Analysis Phase
3) Creative Phase
4) Evaluation Phase
5) Development Phase
6) Presentation Phase


WORKSHOP (JOB PLAN) ACTIVITIESEVALUATION PHASE
4

WORKSHOP (JOB PLAN) ACTIVITIES EVALUATION PHASE
Purpose:
�Reduce the quantity of ideas that have been identified to a short list of ideas with the greatest potential to improve the project
Fundamental Question:
�Of all these ideas, which are worth spending quality time to further develop?

WORKSHOP (JOB PLAN) ACTIVITIES EVALUATION PHASECommon Activities:
�Clarify and categorize each idea to develop a shared understanding
�Discuss how ideas affect project cost, and performance parameters.�Tools: T- Charts
�Select and prioritize ideas for further development�Tools: Life Cycle Costing, Choosing by Advantages (CBA)

WORKSHOP (JOB PLAN) ACTIVITIES EVALUATION PHASE
Typical Outcome:
�The team produces a focused list of concepts that warrant quality time to develop into value-based solutions that can be implemented into a project or a project feature.

EVALUATION
�Creative ideas in themselves are useless.
�Before progressing, think it through.
�Screen creative ideas
٨

EVALUATING IDEASIDEA SCREENING
GO, NO-GO
CHAMPION
Go For It
TRADE-OFF STUDY
CUSTOMER ACCEPTANCE
1 st
2 nd
3 rd
4 th
5 th
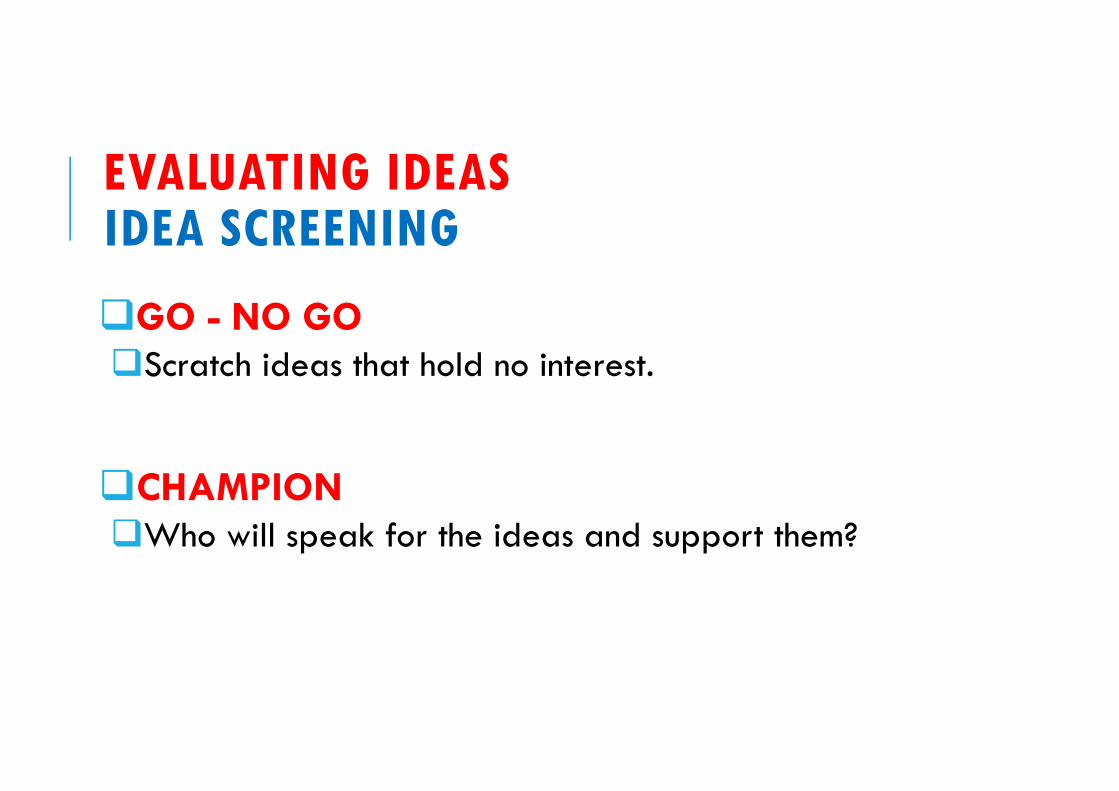
EVALUATING IDEASIDEA SCREENING
�GO - NO GO�Scratch ideas that hold no interest.
�CHAMPION�Who will speak for the ideas and support them?

EVALUATING IDEASIDEA SCREENING
�GFI (Go For It)�Discuss pros/cons and vote.
�GFI is team average.
�Combine ideas; add new ideas.
�Record all assumptions when voting.

EVALUATING IDEASIDEA SCREENING
�Trade-Off Study�Quantify performance characteristics.
�Select top candidates using Pair-wise Comparison, etc.
�Could use software such as Expert Choice®
�Record all assumptions when voting.

EVALUATING IDEASIDEA SCREENING
�Customer Acceptance� Determine & quantify customer acceptance criteria.
� Rate surviving ideas against norm & risk.
� Develop proposal scenarios.

DECISION MAKING TOOLST-CHARTS
T-Charts are a type of chart, a graphic organizer in which a student lists and examines two facets of a topic, like the pros and cons associated with it, its advantages and disadvantages, facts vs. opinions, etc.
14
Advantages Disadvantages

DECISION MAKING TOOLST-CHARTS
For example, a student can use a T-chart to help graphically organize thoughts about:�Making a decision by comparing resulting advantages and disadvantages,
�Evaluating the pros and cons of a topic,
�Enumerating the problems and solutions associated with an action,
�Listing facts vs. opinions of a theme,
�Explaining the strengths and weaknesses of a piece of writing,
�Listing any two characteristics of a topic.15

DECISION MAKING TOOLSCHOOSING BY ADVANTAGES
�An attribute -- is something we need to know about just ONE alternative. We use nondifference adjectives, e.g. “long”
�An advantage -- is a difference between the attributes of TWO alternatives. We use difference adjectives, e.g. “longer”
�A disadvantage of one alternative -- is an advantage of another alternative, i.e. two names for the same thing.
16

DECISION MAKING TOOLSCHOOSING BY ADVANTAGES 1) Two-List Method
�List advantages of each attribute (Two List Format).�Decide importance of each advantage.�Choose alternative with greatest total importance of advantages.
2) Simplified Two-List Method�List advantages of each attribute (Two List Format). �Choose alternative with most important set advantages.
3) Instant CBA Method�Perceive advantages of each attribute in your mind.�Choose alternative with most important set advantages.
17
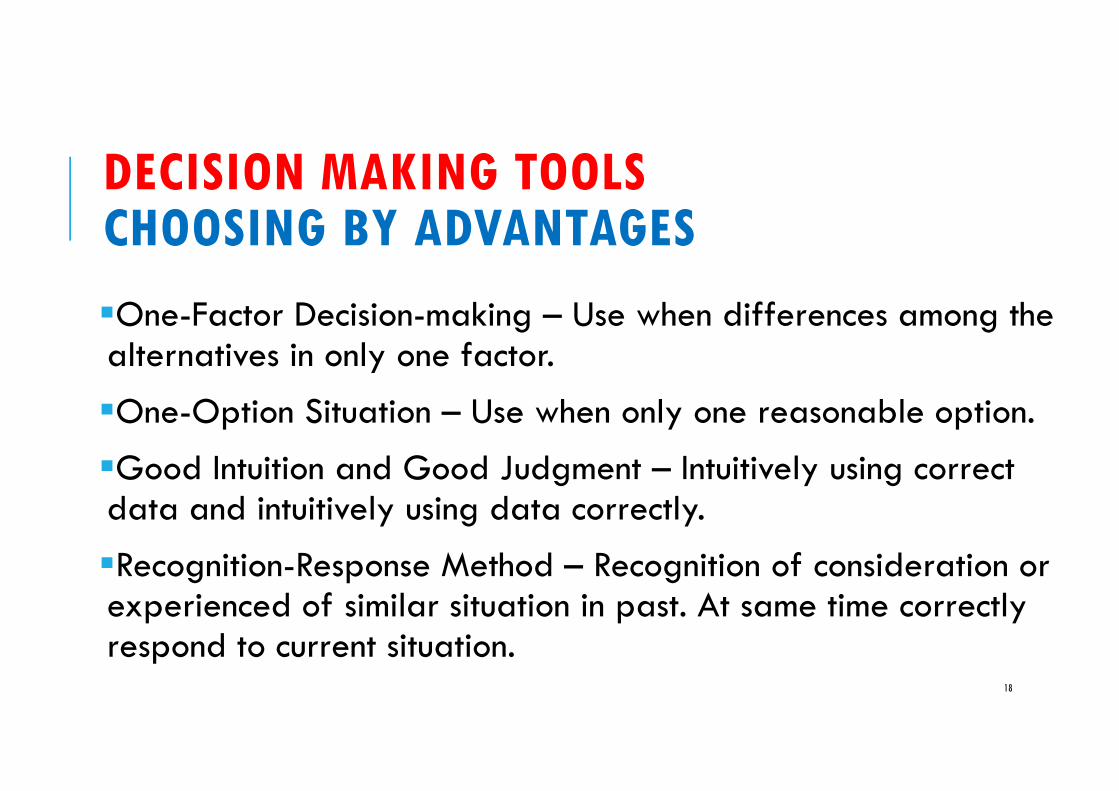
DECISION MAKING TOOLSCHOOSING BY ADVANTAGES
�One-Factor Decision-making – Use when differences among the alternatives in only one factor.
�One-Option Situation – Use when only one reasonable option.
�Good Intuition and Good Judgment – Intuitively using correct data and intuitively using data correctly.
�Recognition-Response Method – Recognition of consideration or experienced of similar situation in past. At same time correctly respond to current situation.
18

DECISION MAKING TOOLSLIFE CYCLE COST
19

LIFE CYCLE COST
The Life cycle cost, is the total cost from acquisition of an item to the final disposal of the same after the life of the item.
The elements of Life cycle cost can be narrated as:1) Acquisition cost
2) Operational cost
3) Maintenance cost
4) Repair and replacement cost
5) Salvage cost
20

LIFE CYCLE COSTACQUISITION COST
�It is not only the raw material cost for manufacturing of the item.
�It also includes the drawing and design cost as well as development cost.
21

LIFE CYCLE COSTOPERATIONAL COST
�Customer, after purchasing the item, may have to spend a certain amount of money to use the item.
�It is like petrol/diesel cost for running a car.
�Such type of costs will fall in this category.
22

LIFE CYCLE COSTMAINTENANCE COST
�There is always a cost of involvement for the maintenance of the item.
�This is because there may be some need to keep the item in good condition.
�It is like the change of engine oil for the engine of a car.
23

LIFE CYCLE COSTREPAIR AND REPLACEMENT COST
�The item may have wear and tear, and may need repair after certain period of time.
�There may be some components in the item which have a limited life and need to be replaced.
�These costs will come under this category.
�Re-treading a car tire is a repair cost and providing a new tire is a replacement cost.
24
LIFE CYCLE COSTSALVAGE COST
�The customer may sell the product and receive some amount in return.
�This amount is called the salvage cost.
25

VALUE OF MONEY
�Before learning about the Life cycle cost, one is required to understand the appreciation of money.
�If $100 is invested in the bank at the interest rate of 10% on the first day of the year, then at the end of the year, it will become $110.
�In other words, the present value of $110, at the end of the year, is $100.
26

LIFE CYCLE COSTMETHODS
There are two methods of calculating the Life cycle cost:
1. Present worth Method
2. Annualized Method
27

LIFE CYCLE COST ASSUMPTIONS
The calculation of Life cycle cost needs the following assumptions:1) The alternatives which will be compared through Life cycle cost should
be equivalent to each other.
2) The acquisition cost is in the first day of the calendar year.
3) All other costs are presumed to happen in the last day of the calendar year.
4) Discounted rate is valid through out the Life cycle.
5) The cardinal rule is to use the same life span for all the alternatives.
28

LIFE CYCLE COSTLIMITATIONS
1. Life of the item: Determining the life of an item is difficult.
2. Interest rate: The interest rate may not be same every year.
3. Annual expenses: Annually operation and maintenance costs are assumed to occurring at the end of year. Intermediate expenses are not taken into consideration.
4. Quality/reliability: Not considering the quality and reliability of the item, since the focus is only on costs. The lowest LCC item may not be a good quality item.
29
LIFE CYCLE COSTLIMITATIONS
5. Aesthetic: Not focusing on the esteem value of the item. Hence, the lowest LCC item may fail to add to the esteem of the owner even though it provides the use value.
6. Safety: Safety of the customer are not considered. The lowest LCC item may not provide safety resulting in poor value to the customer.
30

COMPOUND INTERESTIf you have $100 and will be invested using compound interest with 10%�After 1 year, the $100 will be $110
�After 2 years, the $100 will be $120
�After 5 years, the $100 will be $161
FN = P (1+i)N

DISCOUNT INTEREST•The inverse of compounding is determining a present amount which will yield a specified future sum.
•The equation for discounting is found by:
PN = F (1+i)-N

SERIES COMPOUND FACTOR•Given a series of regular payment, what will they be worth at some future time
•A = the amount of a regular end-of-period payment
•Each payment A, is compounded for a different period of time
� = �[� + � � − �
�]

SINKING FUND FACTORThe process corresponding to the inverse of series compounding is referred to as a sinking fund;
That is, what size regular series payment are necessary to acquire a given future amount?
� = �[�
��� � �]

SERIES PRESENT WORTH
� = � [ ��� � �]
[� ��� �]
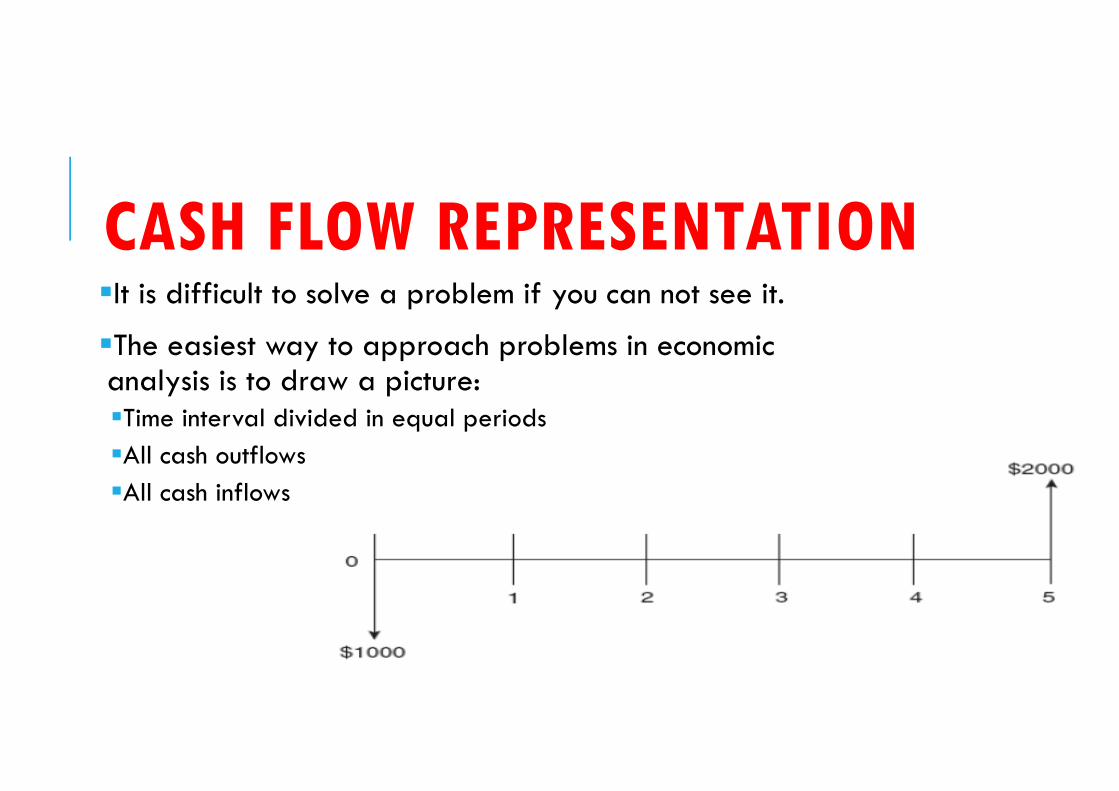
CASH FLOW REPRESENTATION�It is difficult to solve a problem if you can not see it.
�The easiest way to approach problems in economic analysis is to draw a picture:�Time interval divided in equal periods
�All cash outflows
�All cash inflows

EXAMPLE 1what present sum will yield $ 1000 in 5 years with interest 10%
Solution:
P = 1000 (1.1)-5 = $620.92
Depositing $620.92 at 10% compounded annually will yield 1,000 in 5 years

EXAMPLE 2what interest rate is required to triple $1,000 in 10 years.
Solution:
3000= 1000 (1+i)10
i = 11.6%
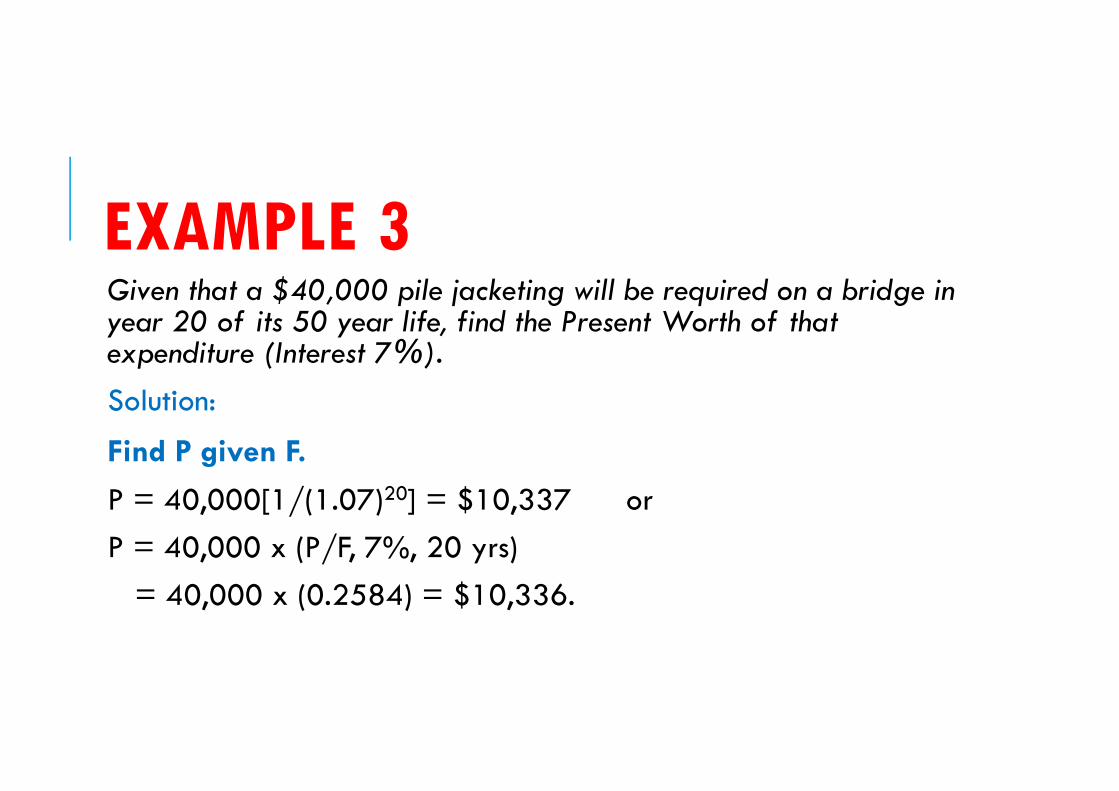
EXAMPLE 3Given that a $40,000 pile jacketing will be required on a bridge in year 20 of its 50 year life, find the Present Worth of that expenditure (Interest 7%).
Solution:
Find P given F.
P = 40,000[1/(1.07)20] = $10,337 or
P = 40,000 x (P/F, 7%, 20 yrs)
= 40,000 x (0.2584) = $10,336.

EXAMPLE 4As a check on Example 1, fine the Future Worth in year 20 of an initial outlay of $10,337 (Interest 7%).
Solution:
Find F given P.
F = 10,337 x (1 + 0.07)20 = $40,001 or
F = 10,337 x (F/P, 7%, 20)
= 10,337 x (3.8697) = $40,001

EXAMPLE 5A new roadway project costs $2,100,000. What is the Annual Worth of this initial cost? Assume a 40 year life. (Interest 7%).
Solution:
Find A given P:
A = 2,100,000{[0.07(1.07)40]/[1.0740 - 1]}= $157,519 or
A = 2,100,000 x (A/P, 7%, 40)
= 2,100,000 x (0.0750) = $157,500

EXAMPLE 6As a check of Example 3, find the Present Worth of an annual outlay of $157,519. (Interest 7%).
Solution:
Find P given A.
P = 157,519{[(1.07)40 - 1]/[0.07(1.07)40]} = $2,099,997 or
P = 157,519 x (P/A, 7%, 40)
= 157,519 x (13.3317) = $2,099,997

EXAMPLE 7Find the Annual Worth of a $750,000 bridge widening project in year 50 of a bridge's life. (Interest 7%).
Solution:
Find A given F.
A = 750,000{(0.07)/[(1.07)50 - 1]}= $1,845 or
A = 750,000 x (A/F, 7%, 50)
= 750,000 x (0.0025) = $1,875

EXAMPLE 8As a check on Example 5, find the Future Worth of an annual outlay of $1,845. (Interest 7%).
Solution:
Find F given A.
F = 1,845[(1.0750 - 1)/(0.07)] or
F = 1,845 x (F/A, 7%, 50
= 1,845 x ( 406.5289) = $750,046

EXAMPLE 9A construction company is comparing between 2 machines:�The price of the first machine is 100,000 and will be sold after 5 years by 20,000
�The price of the other machine is 150,000 and will be sold after 5 years by 40,000
Which machine is more feasible to purchase? (i=10%)
45

EXAMPLE 9Solution�PW [Machine (1)] = ‐100,000 + 20,000/(1+0.1)5 = ‐‐‐‐87,581.5
�PW [Machine (2)] = ‐150,000 + 40,000/(1+0.1)5 = ‐‐‐‐125,163.1
Machine 1 is better since its cost is less
46

EXAMPLE 10Two alternative plans are available for increasing the capacity of existing water transmission line. discount ratio =12%
Plan A
Pipeline
Plan B
Pumping station
Construction cost $1,000,000 $200,000
Life 40 years 40 years (structure)20 years (equipment)
Operating cost $1,000/year $50,000/year
Cost of replacing equipment at the end of year 20
0 $75,000
47
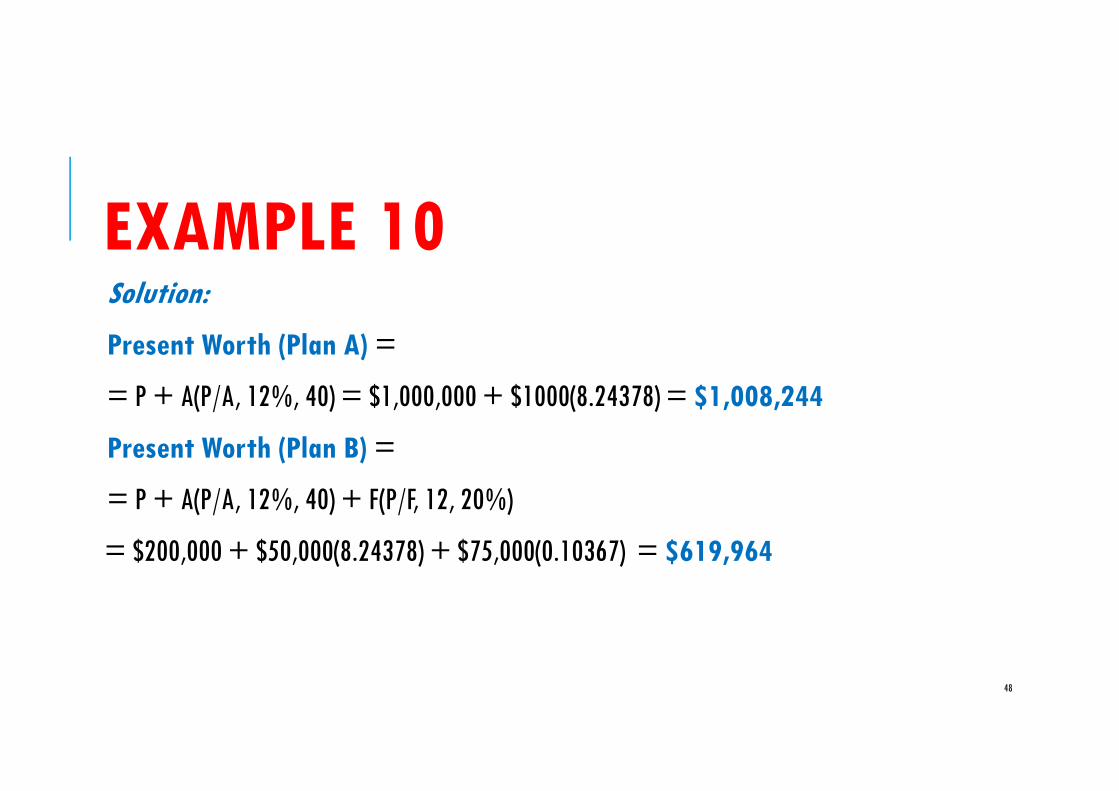
EXAMPLE 10Solution:
Present Worth (Plan A) =
= P + A(P/A, 12%, 40) = $1,000,000 + $1000(8.24378) = $1,008,244
Present Worth (Plan B) =
= P + A(P/A, 12%, 40) + F(P/F, 12, 20%)
= $200,000 + $50,000(8.24378) + $75,000(0.10367) = $619,964
48
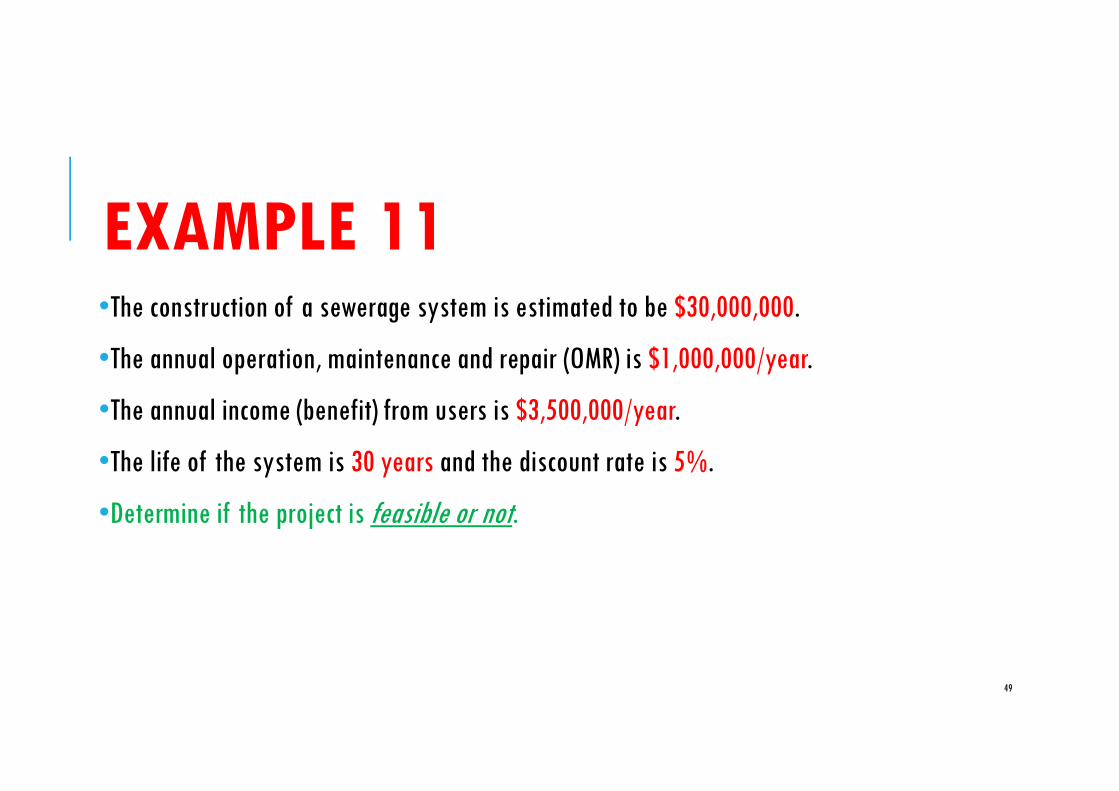
EXAMPLE 11•The construction of a sewerage system is estimated to be $30,000,000.
•The annual operation, maintenance and repair (OMR) is $1,000,000/year.
•The annual income (benefit) from users is $3,500,000/year.
•The life of the system is 30 years and the discount rate is 5%.
•Determine if the project is feasible or not.
49

EXAMPLE 11Solution
•Annual Benefits = 3,500,000
•Annual OMR = ‐1,000,000
•Annual cost of construction = ‐30,000,000 (0.06505) = ‐1,951,500
•Net annual benefits (AW)= 3,500,000 ‐ 1,000,000 ‐ 1,951,500 = (+548,500)
•The positive means that the project is profitable
50

EXAMPLE 12Repeat Example 11 using the present Worth Method
Solution�PW(Annual Benefits) = 3,500,000 x 15.3724 = 53,803,400
�PW(Annual OMR) = ‐1,000,000 x 15.3724 = ‐15,372,400
�PW(Annual cost of construction) = ‐30,000,000
�Net PW= 8,431,000
The positive means that the project is profitable
51

ALTERNATIVES WITH DIFFERENT LIFE TIME•Alternatives with unequal life times may be compared by assuming replacement at the end of the shorter life, thus maintaining the same level of uniform payment
•OR, all cash flows are changed to series of uniform payments
52

EXAMPLE 13•A company is investigating the installation of two alternative systems.
•Given the purchase price and the annual insurance and life, which system should be chosen, considering discount ratio =10%?
System
Cost
Insurance
PremiumLife
Partial System $8,000 $1,000 15 yr
Full system $15,000 $250 20 yr
53

EXAMPLE 13Solution:
Annual cost (partial system) = A + P(A/P, 10%, 15)
= -$1000 - $8000(0.13147) = -$2051.75
Annual cost (Full system) = A + P(A/P, 10%, 20)
= -$250 - $15000(0.11746) = -$2011.90
The Full system is more economical
54

EXAMPLE 14A new piece of equipment costs L.E.100,000. The life of the equipment is estimated to be 15 years. During the first five years, there will be no maintenance cost. After that, L.E.20,000 is the annual maintenance cost. The equipment is assumed useless at the end of its life. Compute the equivalent annual cost of owing the machine by taking i=10%
55

EXAMPLE 14Solution:
�PW of the annual maintenance at year (5)=20,000 (P/A,10%,10)= 20,000 x 6.1455 = L.E.122,890
�PW of the annual maintenance at year (0)= 122,890 /(1+0.1)5= 122,890 x 0.62092 = L.E.76,305
�Total PW = 100,000 + 76,305 = L.E.176,305
�Equivalent annual worth = 176,305 (A/P,10%, 15) = 176,305 x 0.1314 = L.E.23,166.47
56

EXAMPLE 15
57
The estimated life of each alternative is 30 years.
Use a 4% discount rate to find the best alternative.
Alternative 1
PCC Pavement
Alternative 2
HMA Pavement
Initial Construction Cost (year 0) $1,200,000 $900,000
Stage II Construction (year 10) $350,000
Stage III Construction (year 20) $290,000
Joint Sealing (year 10 & 20) $84,000
Routine Annual Maintenance $1,800 $1,000
Salvage (year 30) ($140,000) ($280,000)

58

59
Present Worth Method� P = $1,200,000 + $84,000 (P/F, 4%, 10) + $84,000 (P/F, 4%, 20) + $1,800 (P/A, 4%, 30) - $140,000 (P/F, 4%, 30)
� P = 1,200,000 + 84,000 (0.6756) + 84,000 (0.4564) + 1,800 (17.2920) - 140,000 (0.3083)= $1,283,045 ANSWER
Annual Worth Method� A = $1,200,000 (A/P, 4%, 30) + $84,000 (P/F, 4%, 10) (A/P, 4%,30)+ $84,000 (P/F, 4%, 20) (A/P, 4%, 30) + $1,800 - $140, 000 (A/F, 4%, 30)
�A = 1,200,000 (0.0578) + 84,000 (0.6756) (0.0578) + 84,000 (0.4564) (0.0578)+ 1,800 - 140,000 (0.0178)= $74,199 ANSWER

60
Present Worth Method� P = $900,000 + $350,000 (P/F, 4%, 10) + $290,000 (P/F, 4%, 20) + $1,000 (P/A, 4%, 30) - $280,000 (P/F, 4%, 30)
� P= 900,000 + 350,000 (0.6756) + 290,000 (0.4564) + 1,000 (17.2920) - 280,000 (0.3083) = $1,199,762 ANSWER
Annual Worth Method
� A= $900,000 (A/P, 4%, 30) + $350,000 (P/F, 4%, 10) (A/P, 4%,30) + $290,000 (P/F, 4%, 20) (A/P, 4%, 30) + $1,000 - $280, 000 (A/F, 4%, 30)
� A= 900,000 (0.0578) + 350,000 (0.6756) (0.0578) + 290,000 (0.4564) (0.0578) + 1,000 - 280,000 (0.0178) = $69,382 ANSWER

EXAMPLE 15Comparison of Alternatives:
Alternative 1 Alternative 2
Present Worth $1,283,045 $1,199,762
Annual Worth $74,199 $69,382
Alternative 2 is the least expensive alternative.
This example also illustrates that the use of either the annual worth or present worth method leads to the same conclusion.
61

CRITERIA WEIGHTINGPAIRED COMPARISON
62

CRITERIA WEIGHT A B C D E
A. Safety 20.3101.6 81.3 40.7 61.0 101.6
B. Reliability 22.087.8 109.8 43.9 87.8 109.8
C. Portability 6.513.0 26.0 6.5 13.0 19.5
D. Machineabilty 13.039.0 26.0 26.0 39.0 52.0
E. Constructabilty 7.329.3 7.3 29.3 29.3 36.6
F. Frangability 12.261.0 24.4 61.0 36.6 36.6
G. Maintainability 8.140.7 40.7 24.4 32.5 16.3
H. Serviceability 0.83.3 2.4 1.6 2.4 4.1
I. Ergonomic
Compatibility9.8
29.3 9.8 19.5 29.3 39.0
TOTAL 100 404.9 327.6 252.8 330.9 415.4
COST 1,450.00$ 1,711.00$ 1,000.00$ 1,250.00$ 2,100.00$
Value Index 0.28 0.19 0.25 0.26 0.20
best value
ALTERNATIVES
Each alternative is scored against how well it satisfies the various criteria. Once the scores are
assigned, they are multiplied by the weight of the criteria and summed for a total score. Then, a
value Index is calculated by dividing the total score by
RATE AND RANK OF ALTERNATIVES
1
1
12
2
2
2
2
2
2
2
2
3
3
3
3
33
3
3
4
4
4
4
4
4
4
5
5
5
5
5
5
5
5
5
5
4
4
4
42
3
3
3
the implementation cost.

THANKS FOR LISTENING64