value = cost + · pdf filequality value = cost + purchaser expectations for health care value...
TRANSCRIPT

Quality
Value = Cost +
Purchaser Expectations for Health Care Value Advancing Health Plan and Provider Accountability July 2006

About the Pacific Business Group on Health Pacific Business Group on Health (PBGH) is one of the nation's top business coalitions focused on health care. Our 50 large purchaser members spend billions of dollars annually to provide health care coverage to more than 3 million employees, retirees and dependents. In addition, PBGH operates PacAdvantage, a small group purchasing pool providing health coverage to the employees of over 10,000 of California’s small businesses. The PBGH Negotiating Alliance provides large group purchasing options for California HMOs, pharmacy benefit management services and disease management.
PBGH is a respected voice in the state and national dialogue on how to improve the quality and effectiveness of health care while moderating costs. Partnering with the state's leading health plans, provider organizations, consumer groups and other stakeholders, PBGH works on many fronts to promote value-based purchasing in health care. PBGH plays a leadership role in an array of health care quality initiatives that includes providing consumers with standardized comparative quality information and developing methods to assess and communicate the quality and efficiency of care delivered by health plans, medical groups, physicians, and hospitals. PBGH administers the California Cooperative Healthcare Reporting Initiative and under its contract with the California Office of Patient Advocate, produces the statewide health plan and medical group report cards. More information about the Pacific Business Group on Health can be found at www.pbgh.org.

Purchaser Expectations for Health Care Value Advancing Health Plan and Provider Accountability
July 2006
The continuing growth in health care costs and serious deficits in the quality of care are major threats to affordability and access. A key strategy of the Pacific Business Group on Health is to advance performance measurement and public reporting at all levels of the health care system: health plan, hospital, medical group and physicians.
This report summarizes the core performance expectations that major purchasers have of their contracted health plans. These expectations were presented to California and national health plans at a Plan-Purchaser Summit held in January 2006 and refined based on input from health plan senior management and purchasers at the Summit. Purchasers expressed expectations of their health plans in five areas:
• Trend Control
• Quality Improvement
• Provider Management & Network Design
• Health Management & Care Coordination
• Consumer Support, Engagement and Incentives These expectations are intended to foster innovation and improved financial and quality accountability. In seeking to build consensus for these expectations, plan representatives expressed the need for parallel employer commitments to support consumer engagement and provider value differentiation.
One of the strengths of presenting these expectations at a Summit was the dialogue that underscored the importance of purchaser collaboration with health plans to achieve common goals. Collaboration opportunities that were discussed at the Summit are detailed in the report. We hope that the dialogue spurred by these expectations stimulates action to improve the quality, accessibility and affordability of health care.
Peter V. Lee, J.D. Chief Executive Officer Pacific Business Group on Health San Francisco, CA

Table of Contents
Premium Pressures – No End in Sight .....................................................................................................1 Trend Drivers .......................................................................................................................................1
A Politically Unstable Direction.................................................................................................................2 Purchaser Expectations for Trend Control ...............................................................................................3
Plan-Purchaser Collaboration Opportunities to Impact Key Cost Drivers.............................................3 PBGH Purchasing Elements for Value Breakthrough ..............................................................................4 Quality of Care: Get it Right More Often ..................................................................................................5
Plan-Purchaser Collaboration Opportunities to Improve Quality ..........................................................5 Provider Management and Network Design.............................................................................................6
Performance Transparency and Accountability....................................................................................7 Plan-Purchaser Collaboration Opportunities to Reward High Performance .........................................7
Health Management and Care Coordination ............................................................................................8 Plan-Purchaser Collaboration Opportunities to Foster Health Status Improvement and Risk Reduction.............................................................................................................................................8
Consumer Support, Incentives and Engagement.....................................................................................9 Plan-Purchaser Collaboration Opportunities to Support Consumers as “Drivers” of Change ..............9
Conclusion ............................................................................................................................................. 10

Purchaser Expectations for Health Care Value Page 1
Premium Pressures – No End in Sight
The “Shark” pictured in this slide highlights the spread between insurance premiums and, in particular, workers’ earnings. Without dramatically changing the current market dynamic, premium increases will not only “eat” all potential wage increases for workers and their retirement savings, but also will continue to pull health insurance out of reach of more lower wage earners. Why? Because even though the shark’s jaws widen and narrow with the underwriting cycle, the average long-term annual “gap” between premium trend and wage increase averages about 4 percent.
Purchasers have been navigating shark-infested waters in a decade that has witnessed a major upswing in the insurance underwriting cycle. With the exception of the mid-1990s, when plans suffered financial losses by underpricing competitors to gain market share, health insurance premium increases have consistently exceeded the rate of increase in the Consumer Price Index, as well as worker earnings.
Trend Drivers
Multiple factors have driven cost increases beyond the “environmental” effect of new technologies, health labor shortages and the aging population. • Absence of market forces that reward better quality and more efficient care • Impact of new technologies, health labor shortages, aging population and poor population health • Decreased plan competition • Provider monopolistic practices • Cost-shifting from under-funding of Medicare, Medicaid and the uninsured
Solutions to close the gap between premiums and wages are limited. In the face of unrelenting cost drivers, sophisticated purchasers seek systemic approaches to transforming care delivery, but have limited options. The Pacific Business Group on Health and its members consider options 1 and 2 untenable, but endorse option 3, which is to re-engineer the delivery of health care.
1. Ration care and access to needed preventive services or new biomedical miracles (limit demand); 2. Reduce payment and access to providers (limit supply); or 3. Re-invent private and public value purchasing until providers are motivated to improve the
efficiency of health “production,” while improving the quality of the care delivered.
Page 2 Advancing Health Plan and Provider Accountability
A Politically Unstable Direction
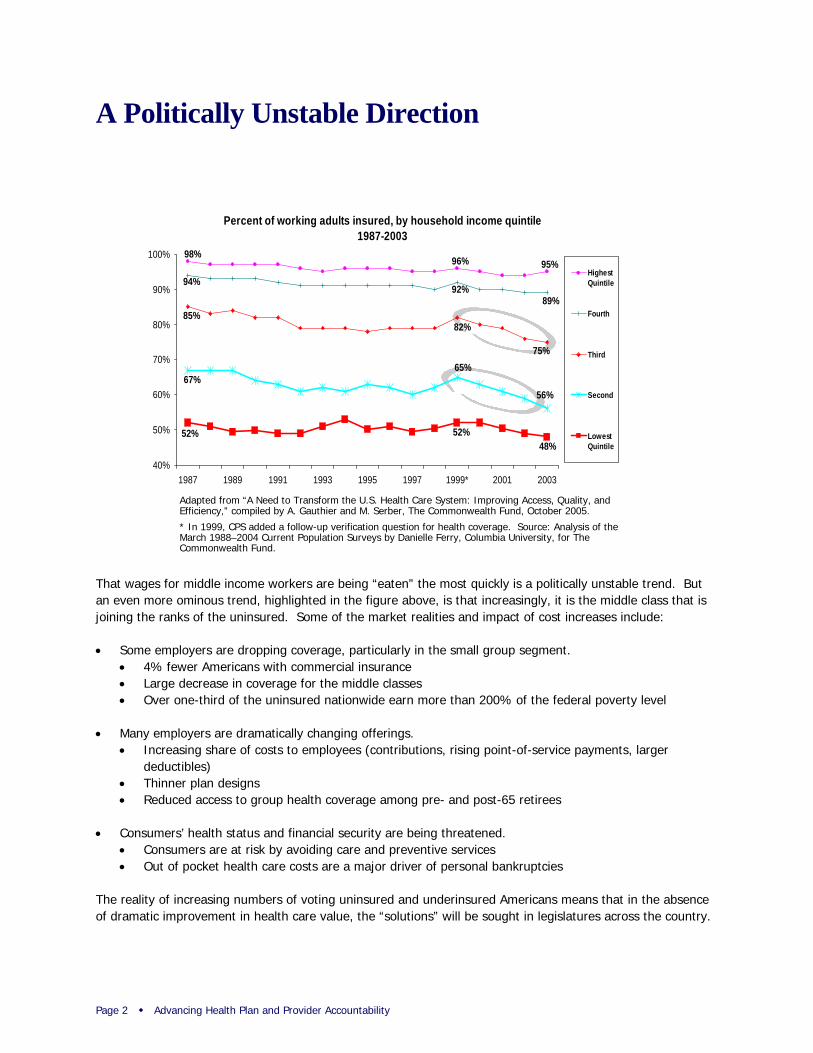
That wages for middle income workers are being “eaten” the most quickly is a politically unstable trend. But an even more ominous trend, highlighted in the figure above, is that increasingly, it is the middle class that is joining the ranks of the uninsured. Some of the market realities and impact of cost increases include:
• Some employers are dropping coverage, particularly in the small group segment. • 4% fewer Americans with commercial insurance • Large decrease in coverage for the middle classes • Over one-third of the uninsured nationwide earn more than 200% of the federal poverty level
• Many employers are dramatically changing offerings. • Increasing share of costs to employees (contributions, rising point-of-service payments, larger
deductibles) • Thinner plan designs • Reduced access to group health coverage among pre- and post-65 retirees
• Consumers’ health status and financial security are being threatened. • Consumers are at risk by avoiding care and preventive services • Out of pocket health care costs are a major driver of personal bankruptcies
The reality of increasing numbers of voting uninsured and underinsured Americans means that in the absence of dramatic improvement in health care value, the “solutions” will be sought in legislatures across the country.
Percent of working adults insured, by household income quintile1987-2003
98%95%96%
94%
89%92%
85%
75%
82%
67%56%
65%
52% 52%48%
40%
50%
60%
70%
80%
90%
100%
1987 1989 1991 1993 1995 1997 1999* 2001 2003
HighestQuintile
Fourth
Third
Second
LowestQuintile
Adapted from “A Need to Transform the U.S. Health Care System: Improving Access, Quality, and Efficiency,” compiled by A. Gauthier and M. Serber, The Commonwealth Fund, October 2005.
* In 1999, CPS added a follow-up verification question for health coverage. Source: Analysis of the March 1988–2004 Current Population Surveys by Danielle Ferry, Columbia University, for The Commonwealth Fund.

Purchaser Expectations for Health Care Value Page 3
Source: Blue Cross Blue Shield Association Medical Cost Reference Guide
Purchaser Expectations for Trend Control
Purchasers’ reaction to rising costs and the specter of political uncertainty is to seek premium trends consistent with national medical care price increases and long-term strategies from their health plans that will bring ongoing premium increases to a sustainable level: CPI + 1 to 2 percent.
Purchasers expect plans to fully document the basis for utilization and price changes. At the same time, plans must hold hospitals, medical groups and physicians accountable for delivering value. Vendors and subcontractors (e.g., pharmacy benefit managers and behavioral health providers) must also meet trend and quality expectations.
Plan-Purchaser Collaboration Opportunities to Impact Key Cost Drivers
Reform of key delivery system elements is essential for assuring long-term trend moderation and maintaining affordable coverage options. Reform requires common action by both plans and purchasers to:
• Expand coverage, without which public-private cost-shift will continue to be significant; • Access technology by implementing processes that review the cost-effectiveness of new technologies and
treatments; • Reform payment to go beyond current pay-for-performance to restructure incentives to reward
coordination, quality, prevention and efficiency; and • Support positive environment to limit mandates or other regulatory burdens that can be key cost drivers.

Page 4 Advancing Health Plan and Provider Accountability
© Pacific Business Group on Health, 2006
Count Value:Higher value options areidentified and made available
1. Health Plans are routinely assessed on 6 Institute of Medicine (IOM) performance dimensions: Safety, Timeliness, Effectiveness, Efficiency, Equity, Patient-centeredness, and standard measures of clinical quality and patient satisfaction. Costs are risk- and benefit-adjusted.
2. Individual Providers and Provider Organizationsare routinely assessed on 6 IOM performance dimensions (see above)
3. Health & Disease Management Programs and Treatment Optionsare routinely assessed on 6 IOM dimensions of performance
Make Value Count:Higher value options arereinforced by the market
4.Consumer Supportenables consumers to recognize higher value plans, providers, health management programs, and treatment options in a timely and individualized manner
5.Benefit Architectureencourages all consumers to select high value options
6.Provider Paymentincents high performance today and re-engineering to enable higher performance tomorrow
Capture Value Gains:Breakthroughs in health benefits value occur
Today’s Gain: MigrationConsumers migrate to more efficient, higher quality plans, providers, health management programs, and treatment options (= an initial 5-15 net percentage point offset of future cost increases; and > 2 Σquality reliability)Tomorrow’s Gain: Re-engineeringSensing a much more performance-sensitive market, health plans, providers, health management programs, and biomedical researchers create stunning breakthroughs in efficiency and quality of health benefits (= further net percentage point offsets of future cost increases; and > 4 Σquality reliability)
PBGH Purchasing Elements for Value Breakthrough
PBGH and many of its Members take a multi-step approach to strategic purchasing. These steps can lead to financial savings and lay the groundwork for supporting desperately needed re-engineering of how health care is delivered in America. Key elements of this “breakthrough” strategy outlined above are as follows:
• Count Value (first column) at every level of delivery. Assess how effectively our health plans not only deliver care based on the Institute of Medicine’s six performance dimensions, but also on how health plans in turn count value at the level of hospitals, providers and care management.
• Make Value Count (second column) reflects the three key ways purchasers can leverage the information on quality and cost-effectiveness to generate savings and promote improvements: • Provide consumers with tools to make better choices, by providing health plan chooser tools,
hospital choice tools, cost calculators, and treatment decision-support. • Build better value choice into benefit design by linking information with financial incentives for
the consumer, such as through tiered products and differential contributions. • Change payments to differentially reward providers for high performance rather than paying
more for bad care and unnecessary procedures.
Capture Value Gains by implementing value purchasing is the end goal. Because of the huge variation in cost and quality of health care, changing where consumers get care can show near-term 5% to 15% reductions of future cost increases. At the same time value purchasing should also pay off in a quality reliability increase from the current rate of about 50% likelihood of getting the right care, to greater than “2 Sigma” (70% likelihood).
Tomorrow’s gains from this purchasing and payment strategy are huge – they hold the promise of supporting true breakthroughs in quality and efficiency because those elements are rewarded and they focus providers on continually re-engineering and moving to “4 Sigma” (getting the right care about 99% of the time).

Purchaser Expectations for Health Care Value Page 5
Adherence to Quality Indicators
10.5%
22.8%
32.7%
40.7%
45.2%
45.4%
48.6%
53.0%
53.5%
53.9%
57.2%
57.7%
63.9%
64.7%
68.0%
68.5%
73.0%
75.7%
0% 20% 40% 60% 80% 100%
Alcohol Dependence
Hip Fracture
Ulcers
Urinary Tract Infection
Headache
Diabetes Mellitus
Hyperlipidemia
Benign Prostatic Hyperplasia
Asthma
Colorectal Cancer
Orthopedic Conditions
Depression
Congestive Heart Failure
Hypertension
Coronary Artery Disease
Low Back Pain
Prenatal Care
Breast Cancer
Percentage of Recommended Care Received
Adults receive about half of recommended care
54.9% = Overall care 54.9% = Preventive care 53.5% = Acute care56.1% = Chronic care
Not Getting the Right
Care at the Right Time
Not Getting the Right
Care at the Right Time
Source: McGlynn EA, et al., “The Quality of Health Care Delivered to Adults in the United States,” New England Journal of Medicine, Vol. 348, No. 26, June 26, 2003, pp. 2635-2645
Quality of Care: Get it Right More Often
Health care cost is one benchmark against which both employers and employees measure health care. By that measure, with costs nearly doubling over the last five years, we should be getting more and better health care. While it’s true that there have been important advances in technology and new services, it is also sadly true that there is a huge value disconnect in our health care system. Research done by RAND found that American’s likelihood of getting the right care at the right time was about 50 percent (see data to right).
This landmark RAND study revealed substantial gaps between what clinicians know works and the care actually provided. These deficits persist despite initiatives by both the federal government and private health care delivery systems to improve care. The result is thousands of preventable complications and deaths per year and billions of dollars wasted. Key findings: • Overall, adults received about 55 percent of recommended care – whether chronic, acute, or preventive; • Quality of care varied substantially across conditions. For example, people with cataracts received about 79
percent of recommended care; those with hip fractures received about 23 percent; • Patients with hypertension received less than 65 percent of recommended care. Poor blood pressure
control is associated with increased risk for heart disease, stroke, and death. In fact, poor blood pressure control contributes to more than 68,000 preventable deaths annually.
Purchasers expect plans to promote quality improvement through adoption of standardized performance metrics to produce comparable quality information. Benchmarking and performance feedback can augment provider efforts to improve quality and reduce variation in care. Purchasers also expect plans to engage members through actionable information such as care reminders for needed services.
Plan-Purchaser Collaboration Opportunities to Improve Quality
Plans and purchasers need to work together to advance a business case for quality. Advancing quality requires common action by both plans and purchasers to: • Collaborate with other plans and private/public purchasers in joint initiatives to engage providers (such as
the PBGH/CCHRI Breakthroughs in Chronic Care Program); • Assure that quality information is used to develop high performance networks or Centers of Excellence; • Align incentives across multiple payment streams to reward quality and efficiency; and • Educate consumers to use performance information to support health care decisions.
Page 6 Advancing Health Plan and Provider Accountability
Provider Management and Network Design
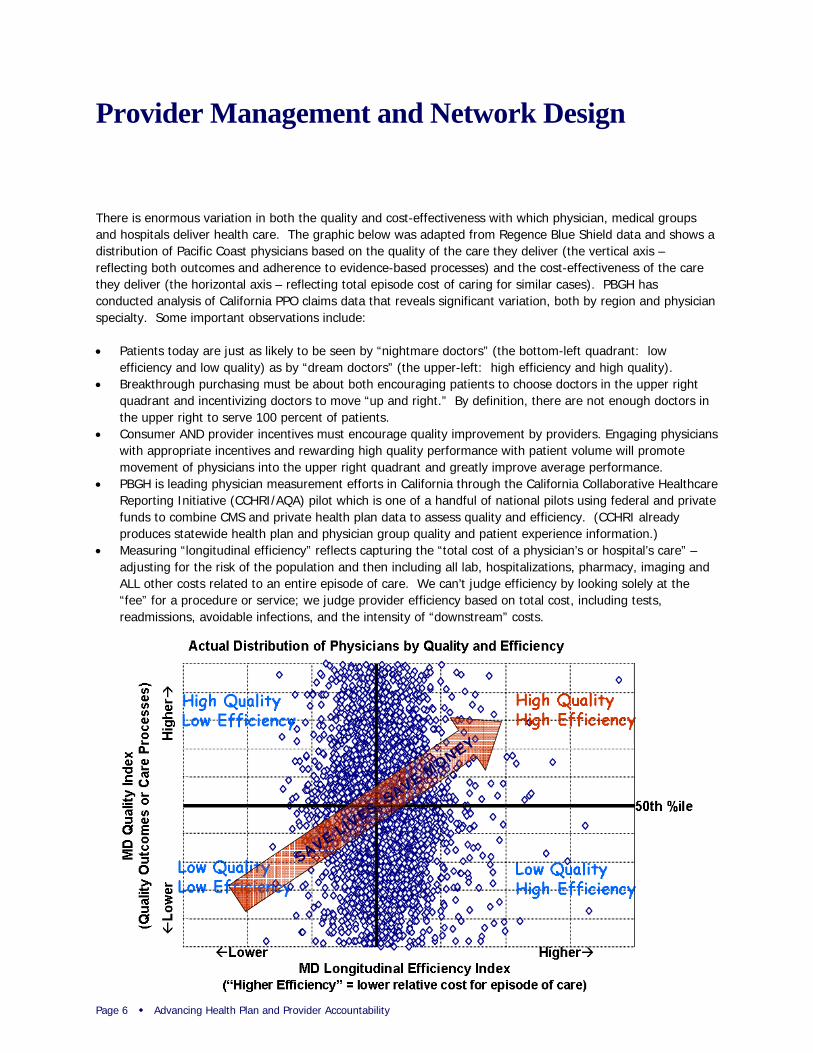
There is enormous variation in both the quality and cost-effectiveness with which physician, medical groups and hospitals deliver health care. The graphic below was adapted from Regence Blue Shield data and shows a distribution of Pacific Coast physicians based on the quality of the care they deliver (the vertical axis – reflecting both outcomes and adherence to evidence-based processes) and the cost-effectiveness of the care they deliver (the horizontal axis – reflecting total episode cost of caring for similar cases). PBGH has conducted analysis of California PPO claims data that reveals significant variation, both by region and physician specialty. Some important observations include:
• Patients today are just as likely to be seen by “nightmare doctors” (the bottom-left quadrant: low efficiency and low quality) as by “dream doctors” (the upper-left: high efficiency and high quality).
• Breakthrough purchasing must be about both encouraging patients to choose doctors in the upper right quadrant and incentivizing doctors to move “up and right.” By definition, there are not enough doctors in the upper right to serve 100 percent of patients.
• Consumer AND provider incentives must encourage quality improvement by providers. Engaging physicians with appropriate incentives and rewarding high quality performance with patient volume will promote movement of physicians into the upper right quadrant and greatly improve average performance.
• PBGH is leading physician measurement efforts in California through the California Collaborative Healthcare Reporting Initiative (CCHRI/AQA) pilot which is one of a handful of national pilots using federal and private funds to combine CMS and private health plan data to assess quality and efficiency. (CCHRI already produces statewide health plan and physician group quality and patient experience information.)
• Measuring “longitudinal efficiency” reflects capturing the “total cost of a physician’s or hospital’s care” – adjusting for the risk of the population and then including all lab, hospitalizations, pharmacy, imaging and ALL other costs related to an entire episode of care. We can’t judge efficiency by looking solely at the “fee” for a procedure or service; we judge provider efficiency based on total cost, including tests, readmissions, avoidable infections, and the intensity of “downstream” costs.
SAVE LIVES, SAVE M
ONEY
Purchaser Expectations for Health Care Value Page 7
Performance Transparency and Accountability
Purchasers expect health plans to: • Increase provider performance transparency and foster accountability; • Use nationally standardized provider metrics – hospital, medical group and physician; • Publicly report provider performance to consumers for informed choice and to providers for quality
improvement; • Document savings and quality impacts from using performance-based networks and incentives; and • Demonstrate how savings reward higher performing providers and are passed through to purchasers and
consumers. Health plan and purchaser incentives must be aligned to achieve common goals: • Steer consumers to higher performing providers, including through network design; and • Reward higher performing providers
Plan-Purchaser Collaboration Opportunities to Reward High Performance
Purchasers need to work with health plans to promote effective markets. Implementing effective provider networks requires common action by both plans and purchasers to: • Implement benefit designs that counter provider “cartels,” recognize provider performance differences and
offer differential payment to higher performing providers; employers need to be ready and willing to de-select poor performers;
• Seek regulatory relief on network composition and geographic access requirements; • Prevent “balance-billing” by groups with too much market power; • Foster URGENCY regarding adoption of “good enough” criteria for distinguishing providers; and • Affirm that the movement of dollars to pay-for-performance be budget-neutral and not additive to current
costs.

Page 8 Advancing Health Plan and Provider Accountability
Health Management and Care Coordination
When Willie Sutton was asked why he robbed banks, his answer was, “That’s where the money is.” The intense focus of PBGH and its Members on the needs of the small portion of the population that drives the majority of the costs and the need for better quality care is based on the same assessment – that’s where the money is.
The “80-20 rule” is true in health care – with 15% of consumers accounting for 78% of resources used in commercial health plans. PBGH and its Members recognize this distribution and are acting to make sure that those with the greatest health care needs get the care they require. Purchasers expect health plans to:
• Identify and target those at-risk or in need of care coordination: demonstrate how use of claims, health risk appraisals or other self-reported data results in complete active enrollment in appropriate programs (from wellness to chronic care to high-cost care management)
• Engage enrollees in appropriate programs: demonstrate active enrollment and use of triage, behavior change and risk reduction (whether through coaching or online tools); assure members are targeted based on psychological profiling, cultural, ethnic and other appropriate characteristics
• Provide incentives for consumer engagement: support benefit designs and programs that promote member engagement in health management and preventive care
• Measure and report to purchasers: quantify and report the purchaser-specific net ROI, premium and quality impacts
Plan-Purchaser Collaboration Opportunities to Foster Health Status Improvement and Risk Reduction
Promoting health and wellness requires the joint efforts of both plans and purchasers to: • Support worksite health promotion and education programs; • Invest in appropriate data exchange to promote early identification and risk reduction; and • Assure that benefit design supports access to preventive care and compliance with evidence-based
medicine.
Equally important are purchaser efforts to help low-risk individuals maintain their health and moderate-risk individuals to lower their risk status. Many PBGH Members have invested in Health Risk Appraisals and health information tools to engage consumers in risk reduction and self-care.

Purchaser Expectations for Health Care Value Page 9
Consumer Support, Incentives and Engagement
Much talk about “consumer driven care” focuses only on narrow tools such as health reimbursement or savings accounts. The real need is to put the consumer in the driver’s seat. The image at the right represents both where we are and how far we have to go to get to a truly consumer-driven health care system.
• Increasingly consumers are able to use health plan chooser tools to consider cost, quality and provider in their selection;
• Most employees of PBGH Member companies have access to tools with some information to choose a hospital with a superior track record. Some Members are specifically tiering hospitals or creating narrow networks to encourage better choices;
• Medical group choice is an important factor in California, where integrated delivery systems have supported the delivery of high-value care and many tools support choice of medical group;
• Choosing a doctor whose clinical expertise and interpersonal skills match one’s preferences, along with making treatment choices, are “high speed” points on the dial – the promise is there, but today many consumers are driving at their own risk with poor information.
The fuel for better consumer choice (the upper right gauge) begins with performance information for every point on the speedometer – plan, hospital, doctor, etc. Benefit design (consumer incentives) can build upon performance data and promote use of quality and value information. Fuel efficiency can be further enhanced through differential provider payment. To help put consumers in the driver’s seat, purchasers expect plans to:
• Increase use of customized consumer tools and decision support: offer and promote use of provider choice, treatment option support and shared decision making, personal care and disease management, and cost calculators;
• Promote consumers’ use of tools through incentives: customized health content and preventive care reminders are “pushed” to members based on risk and psychographic profile;
• Support consumer self-care and information: promote use of portable personal health records with self-reported information that integrate medical and Rx claims data and self-care; and
• Document health plans’ impact: measure and report level of consumer engagement, use of tools, or “activation” opportunities and financial/health quality impacts
Plan-Purchaser Collaboration Opportunities to Support Consumers as “Drivers” of Change
The movement to engaging consumers requires that both plans and purchasers work together to: • Reinvent care management programs to actively engage consumers with trusted advice on how to use
performance information in making treatment choices; • Provide financial incentives to foster better choices, through contribution strategies and benefit design; and • Develop the “science” on what sorts of communication and incentives will better foster behavior change.

Page 10 Advancing Health Plan and Provider Accountability
Conclusion
Purchasers of health care are grappling with significant health benefit decisions in the face of unabated premium increases and persistent gaps in quality of care. Purchasers and consumers alike must become more discriminating buyers of health care and apply more targeted approaches to drive improvement. Incorporating standard metrics such as NCQA Quality Plus accreditation or using the eValue8 common health plan RFI are examples of ways purchasers can reinforce their expectations for health care value.
Collaboration among purchasers, consumers, health plans and providers is essential to improving health care value and advancing the expectations summarized in this report. Incentives must be aligned, whether in the form of appropriately targeted consumer out-of-pocket spending or performance rewards for providers. At the same time, all stakeholders must work together to improve information and tools to support better informed health care decisions.
PBGH members have adopted innovative approaches to benefit design with goals of moderating health care costs, improving quality and creating incentives for health improvement and consumer engagement. Some employers have introduced new plan products including account-based health plans and high performance provider network options, while others have implemented more incremental design changes. Regardless of the specific strategy undertaken, members of the Pacific Business Group on Health are learning from one another and joining with other leading purchasers to serve as a catalyst for advancing health care quality and accountability in California and across the country.

Pacific Business Group on Health Members APL Limited
Automobile Club of Southern California
Bechtel Corporation
California Public Employees’ Retirement System
Chevron Corporation
Cisco Systems
The Clorox Company
Del Monte
FedEx Express
GenCorp (Aerojet)
Intel Corporation
Longs Drug Stores
McKesson Corporation
Mervyn’s
Pacific Gas and Electric Company
Safeway Inc.
Silicon Valley Employer Forum
Southern California Edison
Stanford University
Stanislaus County
Target Corporation
Union Bank of California
University of California
Varian, Inc.
Varian Medical Systems
Verizon Communications
Wells Fargo & Company
Silicon Valley Employers Forum Adobe Systems
Agilent Technologies
Apple
Applied Materials
Autodesk
BEA Systems
Brocade
Cadence Design Systems
Cisco Systems
eBay
Electronic Arts
Hewlett- Packard
Intel Corporation
Intuit
Juniper Networks
KLA – Tencor
LSI Logic
Microsoft
National Semiconductor
NEC Electronics America, Inc.
Oracle Corporation
Seagate
Sun Microsystems
Sybase
Symantec
Tektronix
Yahoo!
Additional Information Reports and background information on other issues critical to purchasers and PBGH’s efforts to promote value in health care can be found at www.PBGH.org. Examples of recent publications include:
• Assessing Quality-Based Benefit Design
• PBGH Member Benefit Strategies: Promoting Quality, Value and Access
• Advancing Physician Performance Measurement: Using Administrative Data to Assess Physician Quality and Efficiency
• Aligning Physician Incentives: Lessons and Perspectives from California

221 Main Street, Suite 1500
San Francisco, California 94105
415.281.8660 ph
415.281.0960 fax
www.pbgh.org