value chain analysis firewood in burkina faso fao vca : a tool
TRANSCRIPT

1 of 34
© FAO September 2009
Resources for policy making
Value Chain Analysis Firewood in Burkina Faso
FAO VCA : A Tool for Quantitative Analysis of Socio-Economic Policy Impacts
About the FAO Policy Learning Programme
This programme aims at equipping high level officials from developing countries with cutting-edge knowledge and strengthening their capacity to base their decisions on sound consideration and analysis of policies and strategies both at home and in the context of strategic international developments.
Related resources
• See all material prepared for the FAO Policy Learning Programme
• See the FAO Policy Learning Website: http://www.fao.org/tc/policy-learning/en/
• See more resources on VCA

2 of 34
By
of the
FOOD AND AGRICULTURE ORGANIZATION OF THE UNITED NATIONS
© FAO September 2009
Resources for policy making
Value Chain Analysis: Firewood in Burkina Faso FAO VCA : A Tool for Quantitative Analysis of Socio-Economic Policy Impacts
Lorenzo Giovanni Bellù, Policy Officer and Nathalie Guilbert, Consultant
Policy Assistance Support Service, Policy and Programme Development Support Division
About EASYPol
The EASYPol home page is available at: www.fao.org/easypol This presentation belongs to a set of modules which are part of the EASYPol Resource package: FAO Policy Learning Programme : The Policy Framework: Policy Impact Analysis Using Value Chain Analysis EASYPol is a multilingual repository of freely downloadable resources for policy making in agriculture, rural development and food security. The resources are the results of research and field work by policy experts at FAO. The site is maintained by FAO’s Policy Assistance Support Service, Policy and Programme Development Support Division, FAO.

3 of 34
© FAO September 2009
Resources for policy making
Objectives
At the end of this session the participants will be able to:
Name the constituting elements of a value chain
Explain why it is important to analyse whole value chains (VCA) for policy formulation purposes
Mention some examples of VCA for policy formulation
Recognize situations in which policy objectives may not be achieved due to “leakages” in the value chain.
Session based on the case of
the formal firewood chain
in Burkina Faso, Ouagadougou area
(Data 2006)

4 of 34
© FAO September 2009
Resources for policy making
The concept of a value chain
Value Chain Analysis is a technique applied to assess how public policies, investments and institutions affect existing or planned chains for agricultural commodities. VCA consists of quantitative analysis of inputs and outputs, prices, value added and margins of the different agents under different policy scenarios.
The term “Value chain” denotes a set of agents, with related activities and markets, who contribute directly to the production, transformation and distribution to final markets of a single product.

5 of 34
© FAO September 2009
Resources for policy making
The global situation of the firewood chain in Burkina Faso
National firewood annual production: 4,151,642 tons (around 400kg per capita)
Around 60 000 people are involved in the chain
Estimated firewood consumption in Ouagadougou: 1,100,000 tons/year
Source of energy consumed at national level
89%
11%
firewoodother energies

6 of 34
© FAO September 2009
Resources for policy making
A pilot study at smaller scale for policy making
A Pilot study at a reduced scale; regions analyzed are Center-West & Center-South.
Poverty incidence is higher in these regions (around 50%) than the average of the country (around 46%).
Around 800 woodcutters involved; most of them are also farmers.
17 296 ha of managed forests production of 1.37 tons of firewood/ha total production around 24,000 tons.

7 of 34
© FAO September 2009
Resources for policy making
A pilot study at smaller scale for policy making

8 of 34
© FAO September 2009
Resources for policy making
The production situation
Formal chain: regulated wood production in publicly managed sites.
Woodcutters are organized in socio-professional structures called (Forest Administration Groups (“Groupements de Gestion Forestière”)
Groups are concessionaires of the forests.
Producers carry out activities to preserve forest resources like: reforestation, fights against bush fires, land protection against cattle...
Informal chain: uncontrolled wood extraction.
More numerous.
Economic agents are not grouped.
No care/worry about forest preservation.
Tax evasion.
Unfair and illegal competition vs. activities under public regulation.

9 of 34
© FAO September 2009
Resources for policy making
The firewood chain chart
Woodcutters organized in Forest Administration Groups (GGF) &
Unions of GGF
Collectors –Wholesalers –processors of firewood
organized in Associations
Self -consumption
Main flows of firewood
Other flows of firewood
Self consumption flows
Final Consumers of firewood
Retailers of firewood organized in Associations
Woodcutters Informal
Collectors –Wholesalers –processors of
firewood Informal
Retailers of firewood Informal

10 of 34
© FAO September 2009
Resources for policy making
Actors of the chain
Three main types of actors:
Woodcutters (sale price of one ton : US$ 17.6)
Wholesalers (sale price of one ton : US$58.4)
Retailers (sale price of one ton : US$ 68)
Value added:
Firewood producers: US$ 12.8 VA per ton
Wholesaler : US$ 24 VA per ton
Retailer : US$ 1.9 VA per ton
Value Added Distribution per group of economic agents
36%
59%
5%
producers
wholesalers
retailers
Net benefits for each group of economic agents
39%
53%
8%
producerswholesalersretailers

11 of 34
© FAO September 2009
Resources for policy making
Socio-economic profile, income and margins of woodcutters
Socio-economic profile of woodcutters: Small-marginal farmers and landless-wage workers, who carry out firewood activities in the dry season.
The average net benefit per woodcutter earned during the campaign (3 months) is around US$ 260, which represents an important part (more than one fourth) of the total annual income of its household (US$907).
The national average household poverty line of around US$ 1060.
Sell price of one ton of firewood (in US$) for organized chain
Allocation of the revenue per ton (US$)
Fund for Village
investment
Fund for Land
Development
Forest Tax (concession
fee)
Margin to woodcutter
17.6 1.6 4.8 2.4 8.8
Thanks to firewood production activities, farmers are
able to keep out of extreme poverty and vulnerability.

12 of 34
© FAO September 2009
Resources for policy making
Policy issues Facts Opportunities/solutions
Market increase for woodcutters
High current and future demand of firewood
Gas used by only 2% of the population
Gas subsidy very expensive for the budget
Gas used by urban and richer part of population
Deforestation & environmental issues
Gas is a substitute for firewood, leading to less deforestation
Gas subsidy implemented

13 of 34
© FAO September 2009
Resources for policy making
Lack of forestry management
No forestry control (agro-pastoral appropriation of the land)
Unfair competition of informal vs. formal woodcutters in managed areas
Loss of income for the State
Non respect of rotation delays and environment Rationalize downstream activities
Facilitate grouping of fallers
Enforce forestry regulations
Vulnerable Rural population
Severe Poverty and food insecurity of small-holders and landless people
Create employment within the chain
Unfair distribution of income among fallers and traders
Rationalize downstream activities
Reallocate subsidy resources to invest in forests management
Policy issues Facts Opportunities/solutions

14 of 34
© FAO September 2009
Resources for policy making
The objectives of the policy makers are:
To increase income generated and distributed in rural areas To fight against deforestation and other environmental issues
Policy objectives

15 of 34
© FAO September 2009
Resources for policy making
Proposal: a «package» of two policy measures: 1. Demand side policy: Stop the butane gas subsidy to sustain demand.
Remark: The objective of the gas subsidy was to preserve forests. The assumption is that this objective can be achieved by investing resources of the gas subsidy in forest management.
2. Supply side policy : investing in forest management to increase the productivity of forests (1.364.25 tons/ha) through improved reforestation, technical and organizational capacities.
National annual gas consumption* 34,359,432 kg A
Subsidy price US$/kg 0.68 B
Subsidy cost to the budget US$ 23,364,414 A * B
Policy measures identified
* Customs import data 2005

16 of 34
© FAO September 2009
Resources for policy making
Expected socio-economic impacts of the demand-side policy measure
Stop subsidy Price of gas
Price firewood Ouaga Po
Revenue traders
Demand firewood Ouaga
WHY? Because firewood is a substitute for gas
Quantities actually sold ?
Depends on supply: 1) Supply rigid Po, Q 2) Supply elastic: Po, Q (likely)
WHY? Because Po x Q as P and Q
Margins traders Mt ?
Revenue woodcutters Rf

17 of 34
© FAO September 2009
Resources for policy making
Quantity (Q) Price (P) PxQ000 Tons $/Ton 000$
trader revenue 23.6 68 1604.8Costs 23.6 17.6 415.36
Without Policy margin 1189.44
faller revenue 23.6 17.6 415.36Cost 23.6 4.4 103.84Margin 311.52
Quantity (Q) Price (P) PxQ
trader revenue 73.4 68 4991.2Cost 73.4 17.6 1291.84
With policy margin 3699.36(stop subsidy)
faller revenue 73.4 17.6 1291.84Cost 73.4 4.4 322.96Margin 968.88
Quantity (Q) Price (P) PxQ Var %
trader ∆ revenue 49.8 0 3386.4 211.0%With policy - ∆ Cost 49.8 0 876.48 211.0%Without policy ∆margin 2509.92 211.0%
faller ∆ revenue 49.8 0 876.48 211.0%∆ Cost 49.8 0 219.12 211.0%∆ Margin 657.36 211.0%
Expected socio-economic impacts of the demand-side policy

18 of 34
© FAO September 2009
Resources for policy making
Margin fallers Mf ? Depend on production costs Cf. Without supply policy: Cf , Mf
Envir. Externalities Ee ? Without supply policy: Ee
Negotiating power of faller: Zero Low High
Inelastic Supply MT RF
MT RF
MT RF
Elastic Supply MT RF
MT RF
MT RF
Mt =Margins traders Rf = Revenue fallers
Expected socio-economic impacts of the demand-side policy
19 of 34
© FAO September 2009
Resources for policy making
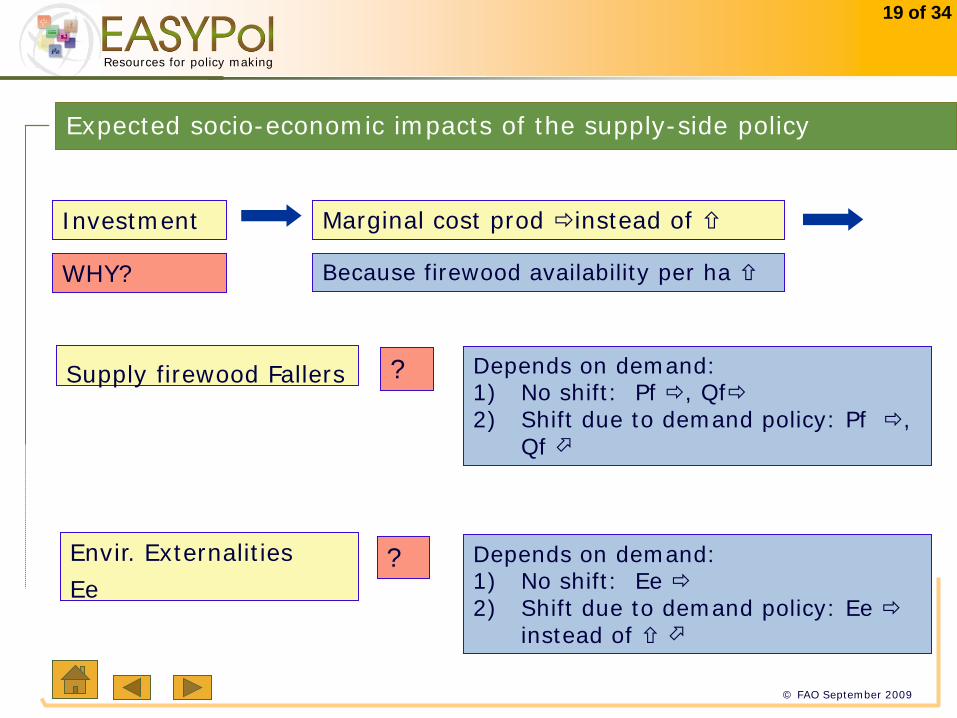
Depends on demand: 1) No shift: Pf , Qf 2) Shift due to demand policy: Pf ,
Qf
Investment Marginal cost prod instead of
Supply firewood Fallers
WHY? Because firewood availability per ha
?
Envir. Externalities
Ee ? Depends on demand:
1) No shift: Ee 2) Shift due to demand policy: Ee
instead of
Expected socio-economic impacts of the supply-side policy

20 of 34
© FAO September 2009
Resources for policy making
Summary of combined expected policy impacts
5. Likely changes in the negotiating power of woodcutters versus traders
1. More forests managed less deforestation and more wood available
2. Higher level of firewood demand larger market employment created more revenues available for woodcutters better conditions for farmers
3. More people benefit from public financial resources
4. Technical and organizational capacities of the chain’s actors improved

21 of 34
© FAO September 2009
Resources for policy making
9. Sustainable firewood supply to meet demand of present and future generations.
Summary of combined expected policies impacts [cont’d]
6. Increased Income to State through the forest tax, and to villages through the investment village tax;
7. Employment created to manage forests
8. Less informal circuits and better sensitization on environmental issues;

22 of 34
© FAO September 2009
Resources for policy making
Combined economic impact of policies: Value added generation
Value Added per group of economic agents without and with policy (000US$)
0
500
1000
1500
2000
producers wholesalers retailers
without policy
with policy

23 of 34
© FAO September 2009
Resources for policy making
Scenarios Total production of
firewood (tons)
Production per woodcutter per year/campaign
(tons)
Number of woodcutters
involved
Revenue per faller (US$)
per campaign
Without policy (1.36 tons/ha)
23 652 29.25 809 257
With policy (4.25 tons/ha)
73 510 29.25 2 513 257
Difference 49 857 - 1 706 -
Larger firewood supply →Employment creation
US$ 439 124 of net revenues created at the firewood producers’ level 1706 households will benefit from the policy In addition, more jobs will be created to manage and control the forests VA of the whole regional chain increased by +/- US$ 2 million
Combined economic impact of policies: Socio economic impacts

24 of 34
© FAO September 2009
Resources for policy making
FAO VCA Software Tool: A facility for computations
Tables extracted from the FAO VCA software
25 of 34
© FAO September 2009
Resources for policy making
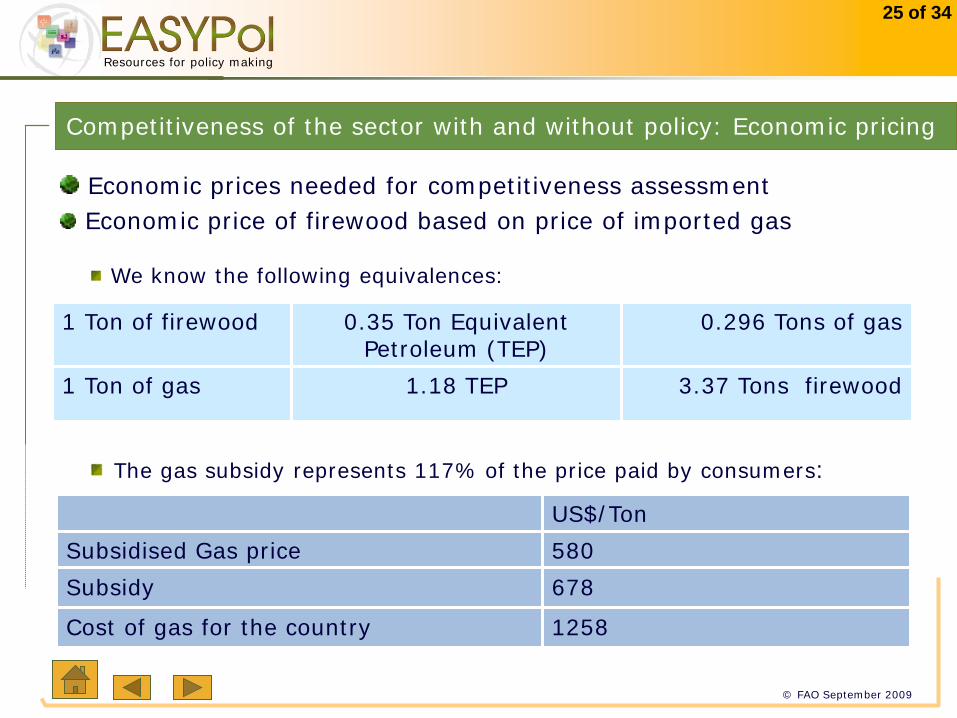
Competitiveness of the sector with and without policy: Economic pricing
Economic prices needed for competitiveness assessment Economic price of firewood based on price of imported gas
We know the following equivalences:
The gas subsidy represents 117% of the price paid by consumers:
1 Ton of firewood 0.35 Ton Equivalent Petroleum (TEP)
0.296 Tons of gas
1 Ton of gas 1.18 TEP 3.37 Tons firewood
US$/Ton
Subsidised Gas price 580
Subsidy 678
Cost of gas for the country 1258

26 of 34
© FAO September 2009
Resources for policy making
International competitiveness of the sector: Economic pricing
The gas generates greenhouse effects (environmental externalities):
US$/Ton
Cost of gas for the country 1258
Environmental externalities (estimated) 8
Total cost of gas 1266
Total cost of gas 1266 US$/Ton
Firewood equivalent of one ton of gas 3.37 tons firewood
price of one ton of firewood as Gas Equivalent (Us$1266/3.77)
375.7 US$/ton
Gas equivalent Economic price of 1 Ton of firewood

27 of 34
© FAO September 2009
Resources for policy making
Firewood energy is more difficult to use:
Price of one ton of firewood as Gas Equivalent 375.7 US$/ton
Adjustment factor (estimated) 0.4
Adjusted firewood price (375.7 US$ ton x0.9) 150.3 US$/Ton
Without policy With policy
Adjusted firewood price 150.3 US$/Ton 150.3 US$/Ton
Environmental externality per ton of firewood (estimated)
15 US$/Ton 0 US$/Ton
Firewood price applied 135.3 US$/ton 150.3 US$/Ton
Firewood use may generate deforestation:
International competitiveness of the sector: Economic pricing

28 of 34
© FAO September 2009
Resources for policy making
Source: Tables extracted from the FAO VCA software tool
Scale factor 1000
International competitiveness of the sector: Policy Analysis Matrix

29 of 34
© FAO September 2009
Resources for policy making
Combined impacts of policy measures on poverty: Selected indicators
Additional revenue to the poorest
Additional revenue to the closest to the poverty line
Additional revenue (random selection)
Without policy: incidence 49.52%
With policy: incidence 49.52% 49.15% 49.52%
Without policy P. Gap 34.5% of the poverty Line
With policy P. Gap 34.2% 35.0% 34.4%
For this pilot exercise, poverty impacts are calculated at regional level*.
With policy additional revenue of US$ 260/year for 1706 households.
* based on total expenditures (% of population)

30 of 34
© FAO September 2009
Resources for policy making
Time matters: policy implementation requires time to invest in reforestation, educate and train people in forest management.
Combined impacts of policy measures on poverty
Remarks:
The importance of poverty reduction impacts of policies depends on how policy measures are targeted on different social groups.
Different poverty indicators could lead to rank policy options differently, e.g. poverty incidence versus poverty gap.
1
2
3

31 of 34
© FAO September 2009
Resources for policy making
Value Chain Analysis (VCA) accounting framework: an assessment
Value Chain analysis allow us to analyse the policy impacts that spread into the economic system by means of the path followed by a commodity.
With VCA we can measure, among other things, the changes in the income of specific agents, due to sub-sectoral policies.
Only policies with impacts that do not deviate too far from the base situation can easily be simulated. Otherwise, behavioural assumptions are needed.
Accounting frameworks with no explicit modelling of behaviour. Prices and quantities are explicitly modelled.
Some knowledge of accounting rules at farm/firm and meso-level is required. Much micro data needed.
Relevance for poverty/FS
Coverage of policy measures
Resource needs
Technical structure
General characteristics

32 of 34
© FAO September 2009
Resources for policy making
Micro-accounting approach: an assessment
Use of detailed household data to generate policy scenarios, by directly introducing changes in the data base, after selection of households affected.
Linked the quantity/quality of available data. Good for poverty (expenditures, consumption….)
Take only the direct effects. Not suitable for structural policies with strong indirect effects.
Accounting framework without explicit modelling of behavioural feedback. Used in general in association with other approaches.
Limited, in terms of time, when good household surveys have been already carried out by statistical offices. Knowledge of data management needed.
Relevance for poverty/FS
Coverage of policy measures
Resource needs
Technical structure
General characteristics
33 of 34
© FAO September 2009
Resources for policy making
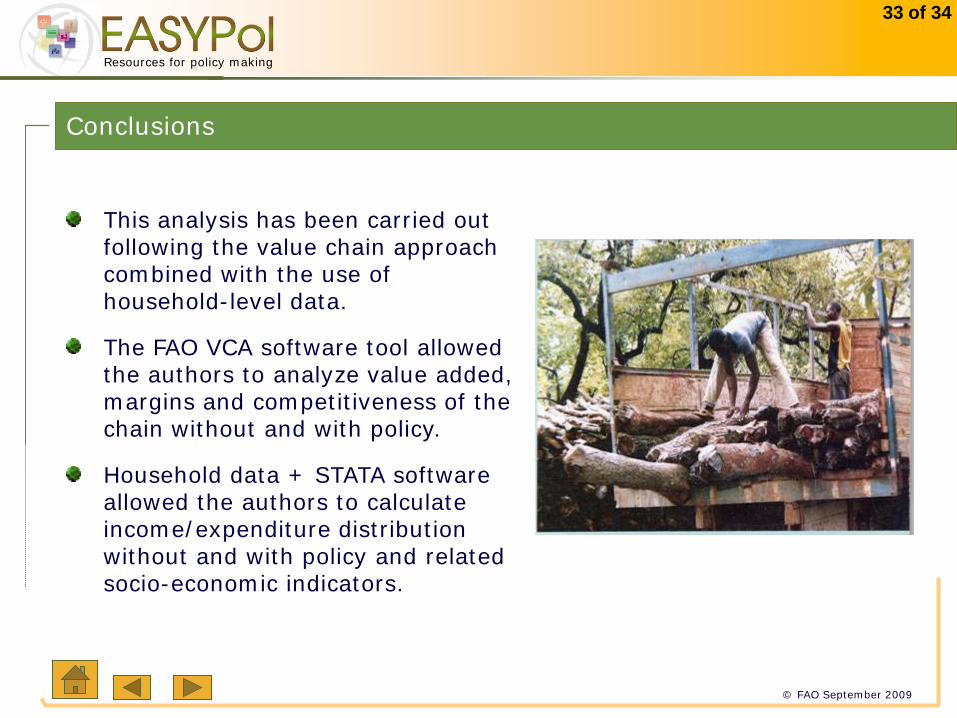
Conclusions
This analysis has been carried out following the value chain approach combined with the use of household-level data.
The FAO VCA software tool allowed the authors to analyze value added, margins and competitiveness of the chain without and with policy.
Household data + STATA software allowed the authors to calculate income/expenditure distribution without and with policy and related socio-economic indicators.

34 of 34
© FAO September 2009
Resources for policy making
More FAO VCA Software Tool resources
A Software for Value Chain Analysis. FAO VCA Software Tool 3:1 [2013] EASYPol module 073
A Software for Value Chain Analysis. Manual for FAO VCA Software Tool 3:1 EASYPol Module 074
Value Chain Analysis for Policy Making: Methodological Guidelines for a Quantitative Approach EASYPol module 129