value assessment report
TRANSCRIPT

Value Assessment Report
Investment managers
Assessing the value of our UK fund range as at 31 March 2021

Introduction
Dear Shareholders,
Welcome to Baillie Gifford’s 2021 value assessment for our UK funds.
As Chairman of Baillie Gifford & Co Limited, the authorised corporate director (ACD) for the funds, it is my responsibility to ensure the board of directors performs a detailed assessment as to whether our funds are providing value to our investors. Baillie Gifford & Co Limited, as ACD, manages and administers our UK authorised funds. We are owned by Baillie Gifford & Co (Baillie Gifford, or the firm) and share the same beliefs, values and strategies as our parent. Baillie Gifford offers a range of equity, income, balanced and multi asset strategies.
The board of Baillie Gifford & Co Limited acts in the best interests of our investors and we monitor the funds to ensure they are being managed in line with their investment objectives. The board comprises appropriately qualified senior management, as well as independent non-executive directors who provide independent scrutiny of the board and its governance and are fully involved in our value assessment process, providing input and challenge.
To assist with the process, we engaged with third parties who provided impartial reporting and feedback. Fitz Partners, a fund data specialist, has helped with our analysis of performance and the costs incurred by the funds. We also reviewed survey details from independent researchers.
How did those funds on last year’s watchlist perform this year?
In the 2020 report, we highlighted two funds which we rated as red using our RAG rating (red, amber, green), concluding they did not provide value, and, following a strategic review, both were closed. Of the other funds, five were rated amber, providing value with action taken and/or further monitoring required. One fund (noted below) was subsequently closed following a redemption by the largest holder, three have been rated green this year as they outperformed their target benchmarks, and one remains amber, as although recent performance has been encouraging it is still noticeably behind its target over the three year period.
What is new this year?
We launched two new funds during the period, Baillie Gifford Health Innovation Fund and Baillie Gifford Multi Asset Growth Feeder Fund, and closed one, Baillie Gifford Sterling Aggregate Plus Bond Fund.
Michael WylieChairman, Baillie Gifford & Co Limited, July 2021
In terms of reporting, we have added a section explaining our distinctive approach to adding value for investors in our funds, how we interact with the management of the companies in which we invest and how our activities aim to contribute positively to society. For funds which have a stated objective of making a positive impact on the social and environmental challenges facing the world, we have added links to articles published on our website on how we are meeting those additional objectives. Lastly, we have added more information to the Summary by Fund section to provide more insight into the performance of the funds and the costs they incur.
I hope you find this value assessment interesting, informative and constructive.
CM15002 Value Assessment Report 2021.inddRef: 52783 IND AR 0858

Contents

Executive SummaryThis report covers our range of UK funds. Our conclusion is that value has been delivered for all 35 funds.
Most of the funds have continued to perform well when measured over the longer term, and some have delivered exceptional annualised returns relative to their index and performance target.
Many of the portfolios had been positioned for growth over periods of five years or more and were on track to achieve their individual objectives when the pandemic struck. That created a new dynamic and appears to have accelerated the trends that were already in place. This has been positive for performance in many cases.
Several funds had invested in companies that were well-placed to benefit from prevailing behavioural changes, such as a move to higher levels of online activity. Some had invested in online retailers around the world, as well as in companies such as Zoom, which has seen a surge in demand as a result of travel restrictions. While the timing of those investments proved to be fortuitous, the fact that these stocks were already held is evidence of the forward-looking research process and benefits of a long-term growth stock-picking style that attempts to identify future winners.
We remain convinced that share prices follow fundamental company strengths over periods measured in years rather than quarters, although we acknowledge that the short-term returns of some of the funds have occurred in exceptional circumstances and are unlikely to be repeated.
Similarly, while many of our income and multi asset funds have performed strongly, we remain focused on the long-term robustness of income streams and capital growth, not just on maximising short-term returns.
As overall costs are important to our funds’ returns and to the value we provide for investors, we aim to keep them competitive and transparent. They remain at low levels relative to those of peers and in line with charges applied to other funds managed by Baillie Gifford and offering comparable services, including those for entry-level institutional clients in similar mandates. The fees for two global equity income funds were reduced during the year.
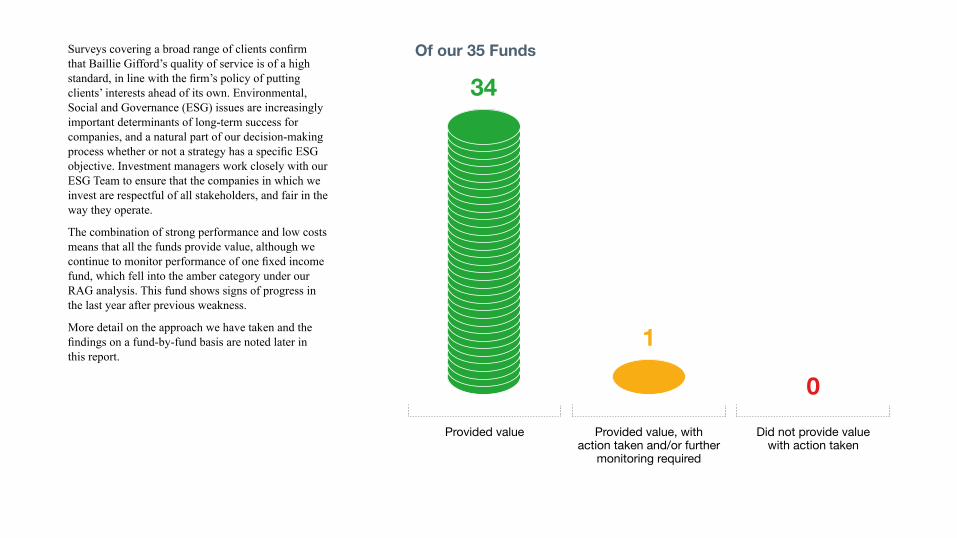
Surveys covering a broad range of clients confirm that Baillie Gifford’s quality of service is of a high standard, in line with the firm’s policy of putting clients’ interests ahead of its own. Environmental, Social and Governance (ESG) issues are increasingly important determinants of long-term success for companies, and a natural part of our decision-making process whether or not a strategy has a specific ESG objective. Investment managers work closely with our ESG Team to ensure that the companies in which we invest are respectful of all stakeholders, and fair in the way they operate.
The combination of strong performance and low costs means that all the funds provide value, although we continue to monitor performance of one fixed income fund, which fell into the amber category under our RAG analysis. This fund shows signs of progress in the last year after previous weakness.
More detail on the approach we have taken and the findings on a fund-by-fund basis are noted later in this report.
Of our 35 Funds
Provided value
34
1
0
Provided value, with action taken and/or further
monitoring required
Did not provide value with action taken
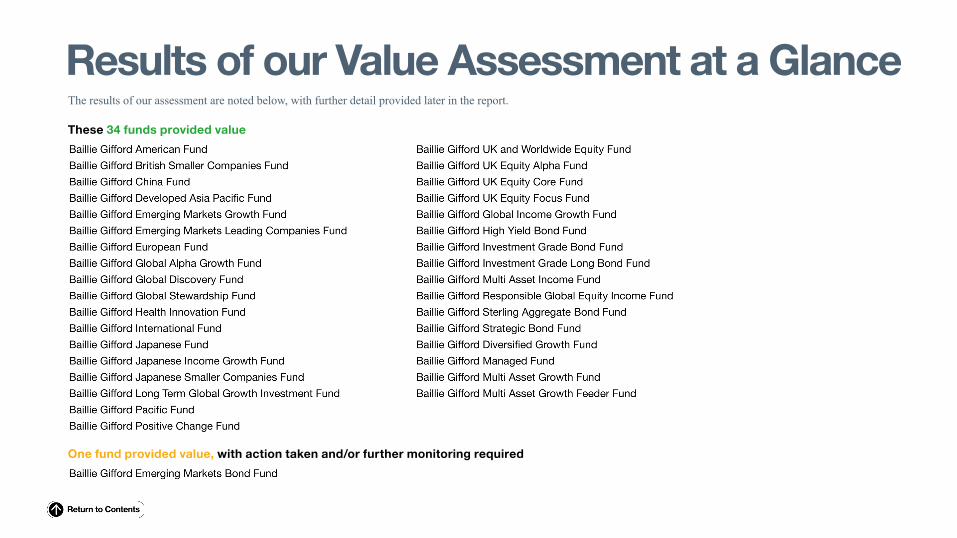
The results of our assessment are noted below, with further detail provided later in the report.
These 34 funds provided value
One fund provided value, with action taken and/or further monitoring required
Results of our Value Assessment at a Glance
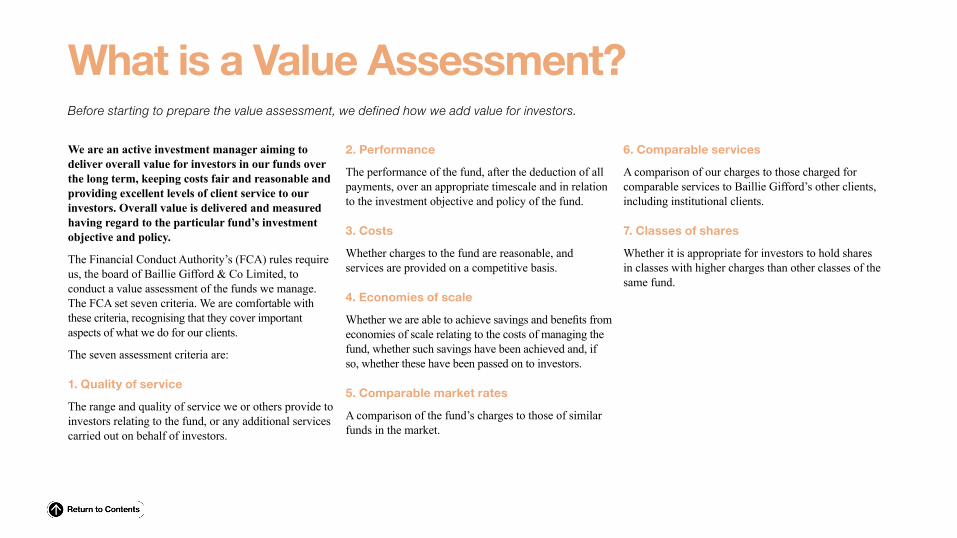
What is a Value Assessment?Before starting to prepare the value assessment, we defined how we add value for investors.
We are an active investment manager aiming to deliver overall value for investors in our funds over the long term, keeping costs fair and reasonable and providing excellent levels of client service to our investors. Overall value is delivered and measured having regard to the particular fund’s investment objective and policy.
The Financial Conduct Authority’s (FCA) rules require us, the board of Baillie Gifford & Co Limited, to conduct a value assessment of the funds we manage. The FCA set seven criteria. We are comfortable with these criteria, recognising that they cover important aspects of what we do for our clients.
The seven assessment criteria are:
1. Quality of service
The range and quality of service we or others provide to investors relating to the fund, or any additional services carried out on behalf of investors.
2. Performance
The performance of the fund, after the deduction of all payments, over an appropriate timescale and in relation to the investment objective and policy of the fund.
3. Costs
Whether charges to the fund are reasonable, and services are provided on a competitive basis.
4. Economies of scale
Whether we are able to achieve savings and benefits from economies of scale relating to the costs of managing the fund, whether such savings have been achieved and, if so, whether these have been passed on to investors.
5. Comparable market rates
A comparison of the fund’s charges to those of similar funds in the market.
6. Comparable services
A comparison of our charges to those charged for comparable services to Baillie Gifford’s other clients, including institutional clients.
7. Classes of shares
Whether it is appropriate for investors to hold shares in classes with higher charges than other classes of the same fund.

By any measure, this has been an excellent year for Baillie Gifford.
Performance across its range of equity funds has been incredibly strong and we have noted an improvement in performance for those funds which were marked as amber in last year’s Value Assessment. Our role as non-executive directors is to represent the interests of investors who save their money using Baillie Gifford funds. To do this, we scrutinise not only performance but also cost and service levels. We do this regularly throughout the year and annually we formalise our views and those of the rest of the board in this report.
As at 31 March 2021, we have given green ratings to all but one of the funds. This deserves some explanation as you might expect that the rigor of our process would identify more funds which needed some sort of improvement.
The data provided by external agencies indicates that the ongoing charges (fees and other costs) remain very competitive and the levels of customer service are at the top end of those of our peers. Performance over the 12 months to 31 March 2021 has been good across the board and it has been outstanding in many of the equity funds. Those funds where we felt performance needed to improve have shown a marked upturn relative to their benchmark indices and outperformance targets over the past 12 months.
We challenged ourselves to find a reason to award more amber or red ratings but failed. However, the strength in the share prices of the growth companies in which Baillie Gifford invests is unlikely to be repeated in the coming year. Accordingly, both the board and we would suggest that this has been an unusual year in very many ways and, in performance terms, is unlikely to be matched.
Dean Buckley, Kate Bolsover
Dean BuckleyNon-Executive Director
Kate BolsoverNon-Executive Director
A Word from our Independent Non-Executive Directors

Baillie Gifford’s Approach to Adding ValueBaillie Gifford believes that the asset management industry has not focused sufficiently on providing long-term value for money to clients. At Baillie Gifford, we continually evaluate this topic and we support the requirement to produce an annual Value Assessment report.
For an active manager, net-of-all-costs long-term investment performance, compared against relevant passive funds and an active peer group, is the critical measure. Put simply, is the investor better off than if they had invested in a passive equivalent? And is that investor better off than if they had invested in the average performing active fund?
We believe our role is to allocate capital to productive investment opportunities and to act as engaged owners on behalf of our clients. We seek to interact constructively with the management of companies in which we invest, and to participate in real-world wealth creation as they go about the innovative activities which deliver the ever-evolving needs and satisfy desires of consumers. We adopt this approach because we believe this is the best way for us to add value for our clients. An additional consequence of this focus on real-world activities, rather than stock market speculation, is that our activities should in general also contribute positively to society.
Net outperformance is composed of two factors: relative investment returns, and costs. In the case of the former, for long-term fundamental investors such as Baillie Gifford, measurement must be made over long periods in order to separate value-added skill from temporary luck. For equities, evidence shows that over periods of five years and longer the share price of companies correlates strongly to their relative operating performance. This relationship is weak over periods of three to five years, and non-existent over shorter periods. For Baillie Gifford funds, the observation of value for money in investment performance terms must therefore be over at least three years, and preferably five, to have validity. For this reason, we encourage readers to focus mostly on five-year rolling annualised returns in this report.
The second element of net outperformance is costs. All fees, fund charges and direct and indirect trading costs are ultimately paid by the investors. High costs dramatically reduce the likelihood of outperformance and, even where a manager performs well in investment terms, this is not a justification for high fees at the expense of client returns. At Baillie Gifford we have long been advocates of transparency on all fees and charges. We were among the first managers to sign up to the LGPS Code of Transparency and we participated on the FCA’s Institutional Disclosure Working Group. For our UK domiciled funds, unlike almost all other fund providers, we do not charge any
additional fees for fund administration. These costs are met out of each fund’s single annual management charge. We also believe that, as funds grow, resulting economies of scale should be shared at least in part by investing in the improvement of our research capabilities for the benefit of investment returns, or directly with investors through a reduction in fees.
There are tangible examples of both in recent years: Baillie Gifford has reduced fees on several occasions, and added significantly to our investment resources, including establishing a new research presence in Shanghai and a 24-strong team of ESG analysts. The firm is able to do this as a result of being a privately owned partnership, with no outside shareholders focused on short-term profitability. We believe we are well-placed in this regard in aligning our own long-term interests with those of our clients.
There are other elements to ‘value’ beyond net-of-all-costs relative investment performance. Our clients care about efficiency of service, administration, tax reporting, access to information, quality of website and many other things. We recognise the importance of these factors in our service offering and resource them appropriately. Client satisfaction surveys suggest that we are meeting expectations strongly. However, we would never consider such factors more important than the fundamental imperative of adding value through investment performance.
Value for money can take various forms. Successful investment firms cannot go on growing assets under management indefinitely without diluting their ability to add value for clients. There are only so many good investments available. Even when economies of scale are shared, there comes a point where further growth is likely to harm the interests of clients. Value for money in an investment management firm can therefore take the form of protecting the existing client base by not marketing funds to new investors. Baillie Gifford does this regularly.

Some of the funds managed by Baillie Gifford have dual objectives. This applies to funds which aim to deliver dependable income, or lower levels of volatility. Meeting these objectives is as important to clients as generating investment returns, and therefore a component of offering value for money. We have provided information in this report on how we are meeting those additional objectives.
Increasingly, investors also understand that fund management is not just the act of assembling a promising portfolio of stocks and bonds, as if disconnected from the companies they represent. The companies we invest in collectively play a huge role in determining the social and physical environment we live in.
As aggregators of client assets, investment managers have a duty to consider the real-world impact of those companies’ activities, acting as responsible owners on behalf of clients. Doing this effectively is a resource-intensive company-by-company activity, but we believe it is one that our clients naturally expect of us. In 2020, Baillie Gifford conducted 560 meetings directly with the management of the companies in which we invest, often specifically discussing the long-term impact on business strategy of social and environmental factors.
Not all clients have the same expectations in respect of applying a responsible ownership overlay: a few want us only to make investments that meet positive impact criteria; others require us to exclude certain categories of company; and many simply emphasise the need for a process of dialogue and improvement with companies where necessary.
In this Value Assessment report, we have included extra information for those funds where ESG considerations are a stated part of the investment objective. Unlike some others, because this analysis is built into all our investment research and decision making, Baillie Gifford does not charge a premium for funds that have an additional social impact goal.
Value Assessment and ConclusionOur value assessment processWhen we developed the framework to measure whether our funds provide value, we considered how best to evaluate the key areas laid out in the FCA criteria. No single measure provides a conclusive picture but, when combined, they give a good indication of whether value has been delivered. As such, we decided not to weight individual criteria but to consider them collectively. The FCA set a minimum of seven areas we must consider and we chose not to add any others. As part of the review process we analysed information already used by Baillie Gifford for management information and governance of the funds. However, we also engaged with external parties to provide independent, supplementary data on performance, fund fees and expenses. We have used our B class shares for comparative purposes as these are best suited to individual investors. We have also looked at the different share classes available to investors. We used a RAG rating (red, amber, green) to evaluate each of the seven criteria and then concluded overall whether value had been delivered to investors in a fund: green (fund provided value), amber (fund provided value, with action taken and/or further monitoring required) and red (fund did not provide value with action taken).
1. Quality of service
How we carried out the assessment
We considered the quality of investment management and client servicing provided by Baillie Gifford as well as the level of service provided by others. We reviewed measures covering a broad range of clients including consumer scores from a third-party researcher, who conducted client and consultant satisfaction interviews, and the results of a service study which allowed wealth managers to share their experiences of Baillie Gifford and other asset managers. This year we subscribed to two additional surveys, one collating responses from discretionary fund managers and investment advisors on a number of topics, the other gathering information from retail fund investors on what they think about value, ownership and investment intentions. However, we wish to build up a longer track record to better understand and interpret the results of these surveys and look forward to providing more information on the findings in the future. We considered qualitative and quantitative fund ratings from agencies and platforms, and consultant ratings. We also looked at internal reviews of the service we provide to clients as well as that provided by other service providers.
How did we do?
The data indicated overall satisfaction levels were very high, with Baillie Gifford’s strengths noted as being its investment approach and performance, client service, partnership structure and stability. This is in line with Baillie Gifford’s beliefs regarding the merits of active investment management, putting clients’ interests first and the key strength of the ownership structure.
Anova Consulting Group, a third-party researcher, reported that Baillie Gifford continued to deliver an excellent client experience as evidenced by a strong net
promoter score (the willingness of clients to recommend Baillie Gifford to others), far exceeding their institutional financial services benchmark, which is based on the results of surveys they conduct for other firms in the industry. Overall, the feedback was very positive and continues to reflect well on the firm. Baillie Gifford achieved the highest percentage (75%) of respondents rating their overall satisfaction as ‘very satisfied’ (the top rating) when compared to previous years. Anova went on to note the firm proved consistent in its ability to deliver world-class service through its seamless transition to working from home during the pandemic. However, there are increasing mentions around bespoke reporting requirements and suggestions to continue virtual meetings in some format as we return to normality. ESG, diversity and inclusion are notable themes that our clients have commented upon. We value our clients’ constructive feedback and will focus on areas for improvement.
The service study carried out by Citywire reported that, in a difficult year, Baillie Gifford had succeeded in providing a consistent standard of service to the respondents from the discretionary and advisory wealth management community. Salesperson product knowledge, which was deemed the most important aspect of service by advisers, was the area where Baillie Gifford again received its highest score, with the sales team praised for its excellent understanding and communication. The firm was also praised for calmly articulating its longer-term investment focus during the recent crisis and turbulence in markets. There were areas highlighted by the study where Baillie Gifford could do better, for example responding to requests for information from potential new clients. This was also highlighted in the previous year’s study and we continue to increase resource, have restructured the team responsible for client questionnaires and invested in systems to improve the service provided to clients.
We also looked at internal reviews of the service levels of other providers used. No issues were highlighted, and the fees paid were commensurate with the service levels provided.
We carry out the administration of our funds in-house. As an example of good service, on behalf of the funds, we have been involved in a long-running group litigation order against HMRC regarding the legality of the taxation of overseas dividend income received by relevant funds in years running up to 2010. While some of the litigation is ongoing, the court found in favour of the funds and more than £18 million in tax and interest was repaid to the funds during the year.
Conclusion
We concluded that a good quality of service is offered to investors and rated this green for all funds.
2. Performance
How we carried out the assessment
We considered whether the funds met their investment objectives. The majority of funds have a target benchmark, usually an index plus an outperformance target, so we looked at the performance of the funds (after all the fees have been deducted) relative to the applicable index and target benchmark.
We evaluated performance over the time period (three or five years) specified in the investment objective of the fund. We recommend that investors view this as the minimum holding period. For new funds which have been in existence for a shorter time, we looked at the performance since the launch of the fund although we are mindful that the intention is to invest for the longer term and that returns over a very short period are of limited value in assessing how well the fund has performed.
As an active fund manager, Baillie Gifford recognises that the portfolio holdings of an actively managed fund will differ from the target benchmark and there will be periods when funds produce better or worse relative returns. We have taken this into account and have also looked at how the funds performed in relation to a peer group that was selected by Fitz Partners, a fund data specialist which helped with our analysis of performance and the costs incurred by the funds. In addition, we have compared performance against the relevant Investment Association (IA) sector.
Where funds have additional or alternative investment objectives, such as the delivery of income or reduced volatility, we considered whether these objectives had been met. For those funds which have a stated objective of making a positive impact on the social and environmental challenges facing the world, we reviewed reports produced by the investment manager for the investment strategies to determine whether the funds had met these objectives. Links to these reports, which are published on our website, are in the Summary by Fund section.
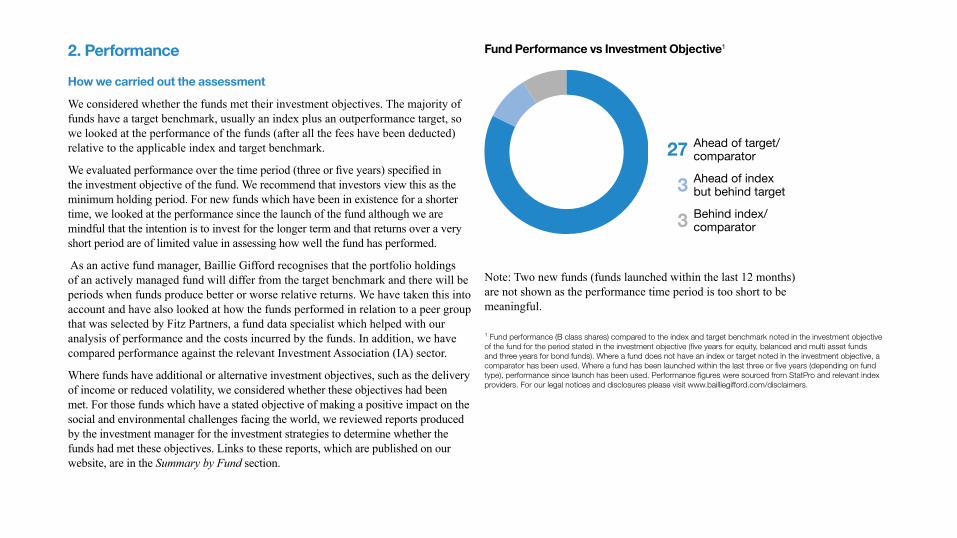
Fund Performance vs Investment Objective1
3 Ahead of index but behind target
Behind index/comparator3
Ahead of target/comparator27
Note: Two new funds (funds launched within the last 12 months) are not shown as the performance time period is too short to be meaningful.
1 Fund performance (B class shares) compared to the index and target benchmark noted in the investment objective of the fund for the period stated in the investment objective (five years for equity, balanced and multi asset funds and three years for bond funds). Where a fund does not have an index or target noted in the investment objective, a comparator has been used. Where a fund has been launched within the last three or five years (depending on fund type), performance since launch has been used. Performance figures were sourced from StatPro and relevant index providers. For our legal notices and disclosures please visit www.bailliegifford.com/disclaimers.

How did we do?
First, we should reflect on how funds rated amber or red for this criterion in last year’s report have performed. There were seven funds rated amber for performance last year as performance was behind the outperformance target and, in some cases, behind the index. One of these funds, Baillie Gifford Sterling Aggregate Plus Bond Fund, has subsequently been closed after the largest shareholder redeemed its holding. We are pleased to report that performance for the remaining funds was ahead of both their respective benchmark indices and targets over the year to 31 March 2021. Two funds, Baillie Gifford British Smaller Companies Fund and Baillie Gifford Emerging Markets Bond Fund, which were rated red last year, have been rated amber this year and more detail on progress made is provided later in this section.
In terms of this year’s assessment, performance of the funds relative to their investment objectives has generally been very good with the majority of funds rated green for performance. Indeed, performance for many of our equity funds has been exceptional when compared to their ambitious outperformance targets. Returns for most funds over their recommended holding periods have been ahead of both the index and target benchmark (index plus an outperformance expectation), in some cases by substantial amounts. The funds have also performed well in relation to the peer group selected by Fitz Partners and to the relevant IA sector.
Before the global pandemic struck, our investment teams had started to build funds that should benefit over the longer term from behavioural changes and evolving business practices. In many cases, the timing of this proved to be favourable for performance, as several of these companies have benefited from what appears to be an acceleration of the trends that had started to materialise.
Where funds have additional objectives, such as generating income or limiting volatility, these have been met in the majority of cases. More detail is provided in the Summary by Fund section.
While performance of the funds has generally been very good, there were some exceptions. We rated six funds as amber for this criterion.
Of these, two funds were also rated amber in 2020 for this criterion. Long-term performance of Baillie Gifford Investment Grade Bond Fund was affected by the market turbulence in the first three months of 2020. Until that point, performance had been acceptable and changes to the investment process were not planned. Performance this year has been ahead of the outperformance target and over three years the fund is in line with the index but behind target. Changes were made during 2019 to the investment process for the government bond portion of Baillie Gifford Sterling Aggregate Bond Fund and the fund has performed better in the recent, more normal market conditions, beating the outperformance target over the year and now only slightly behind target over three years. We decided an amber rather than a red rating was appropriate this year for these funds due to the improvement in performance, although longer-term performance remains behind target.
Baillie Gifford Investment Grade Long Bond Fund has also been rated amber this year and is in a broadly similar position to Baillie Gifford Investment Grade Bond Fund. Performance has been indifferent over three years, with the fund’s return matching the benchmark index but behind the outperformance target. The fund modestly underperformed in the first quarter of 2020 when markets were deeply affected by the pandemic and its defensive position meant it lagged the market in the subsequent recovery. No action has been taken due to the relatively short-term nature of the underperformance.
Baillie Gifford High Yield Bond Fund marginally underperformed against its comparator, the Investment Association peer group, over three years largely due to underperformance in the final quarter of 2020 when the longer-term focus on resilience of the fund lagged the strong returns of the market. Again, no action has been taken due to the very short-term nature of the underperformance.
Baillie Gifford British Smaller Companies Fund was rated red last year but has seen a significant improvement in performance this year, with five-year returns now ahead of the benchmark index and only just lagging the outperformance target. The fund manager was replaced in May 2019 and the changes made to the investment strategy and portfolio by the new investment team appear to be yielding results. Baillie Gifford Emerging Markets Bond Fund was also rated red last year but has outperformed the benchmark index and target over the year. Again, the changes made to the investment process and the strengthening of the team in 2019 have had a positive impact but longer-term performance is still disappointing. As performance has improved, both funds have been rated amber this year.
We will continue to monitor progress made for these funds and determine if further action is required in the future.
Two funds, Baillie Gifford Health Innovation Fund and Baillie Gifford Multi Asset Growth Feeder Fund, were not rated for this criterion as they were launched less than six months before the reporting period’s end. As Baillie Gifford Health Innovation Fund’s objective is to perform well over longer periods, we believe that shorter-term performance measurements are of limited relevance in assessing investment ability, especially in the case of a new fund such as this. As Baillie Gifford Multi Asset Growth Feeder Fund invests solely in Baillie Gifford Multi Asset Growth Fund, we expect the performance to follow that of the master fund. We look forward to reporting to you on more meaningful performance time periods during the years to come.
Conclusion
We are satisfied that the majority of funds have achieved their performance objectives, with 27 rated green. We will continue to closely monitor the performance of six funds rated amber and progress of the two newer funds.

3. Costs
How we carried out the assessment
We reviewed every cost component of the ongoing charges figures (OCF) of the funds. The largest is the management fee, covering the investment management services provided by Baillie Gifford. The management fee includes not only the cost of investment management but also a number of other costs including administration and registration (or transfer agency) services which are also provided by the firm. We do not charge performance fees or entry and exit charges. There are other costs, such as custodian, depositary and audit fees. We looked at all of them to determine whether they are reasonable for the services provided.
How did we do?
We believe that the fees paid to Baillie Gifford for investment management services are reasonable and provide good value. During the year the management fees for Baillie Gifford Global Income Growth Fund and Baillie Gifford Responsible Global Equity Income Fund were reduced from 0.57% to 0.50% (with effect from 1 October 2020). We consider the fees paid to other service providers to the funds were appropriate in relation to the level of service provided. As noted in section five, Comparable market rates, the fees charged to the funds are very competitive when compared to their respective peer groups.
Conclusion
We have rated this green for all funds as fee levels overall are fair. They remain low for the funds and appropriate for the level of service provided.
Breakdown of Ongoing Charges Figures (OCF)
OCF Management Fee
Custody Fee
Depositary Fee
Other Fees
4. Economies of scale
How we carried out the assessment
Economies of scale happen when funds grow and, as a result, we may be able to renegotiate fees with service providers including the investment manager. First, we considered whether savings could have been achieved as a result of economies of scale. If there were savings, we considered whether they had been passed on to the funds in the form of fee reductions.
How did we do?
As noted in section three, Costs, Baillie Gifford charges a management fee to the funds. When these fee rates are being set initially or re-evaluated, the sizes of the funds are considered and costs savings passed on via a reduction in the management fee, where appropriate. The management fees for the full range of funds were reviewed in October 2017, with reductions made to most funds. We continue to monitor fees on an ongoing basis to ensure they are fair and reasonable. In addition, we subsidise fees that are charged to new funds, capping the ‘other’ expenses at appropriate levels until the funds have reached sufficient scale, ensuring initial investors do not suffer by paying proportionately higher expenses. During the period other fees charged to the newly launched Baillie Gifford Heath Innovation Fund were capped at 0.10% until it reached sufficient scale.
We also looked at the other charges and the service provided and, where we believe it is appropriate, renegotiate fee rates with providers. Both the depositary and custodian fees were reduced in 2018 and we will continue to monitor costs and renegotiate with providers on a periodic basis.
Conclusion
We have rated this green for all funds as management fee levels remain fair, reasonable and competitive, with all charges being monitored on an ongoing basis and fees renegotiated with service providers where appropriate. We believe that, where possible, economies of scale are passed on to investors.

5. Comparable market rates
How we carried out the assessment
One of Baillie Gifford’s core beliefs is that costs should be kept low and transparent, including maintaining fees at fair and reasonable levels. When looking at the costs of funds we were mindful that costs should not be looked at in isolation and that levels we deem to be fair and reasonable may not be the lowest when considering whether value has been delivered. We looked at the cost of our funds compared to others offering a ‘comparable service’ using data provided by Fitz Partners, who calculated ongoing charges figures (OCFs) from the latest available audited accounts for the same peer groups used in the assessment of performance.
How did we do?
The costs of our funds are low. Of the 35 funds, 33 were ranked in the first quartile (lowest costs) when compared to the peer group in the analysis carried out by Fitz Partners. The two other funds were in the second quartile when compared to the peer group.
Conclusion
All funds are rated green, and we are satisfied that our funds compare very favourably to others in terms of cost.
Costs of funds vs Fitz Partners Peer Group1
Third quartile: 0 funds
Fourth quartile (highest costs) 0 funds
Second quartile: 2 funds
First quartile (lowest costs): 33 funds
1Source: Fitz Partners. We have shown how expensive B class shares of our funds are in relation to comparable share classes of funds in peer groups independently selected by Fitz Partners. Fitz Partners has calculated the OCFs from the latest available audited financial statements of the funds as at 31 March 2021.
6. Comparable services
How we carried out the assessment
Baillie Gifford provides investment management services to a wide range of clients. We considered which received comparable services and decided that the firm’s range of Irish UCITS, Canadian Master Trusts, US Mutual funds and Group Trust have similar investment objectives and policies to the equivalent UK funds. In addition, we included institutional clients for whom the firm also manages money. These are larger clients, for example pension funds, who ask Baillie Gifford to manage money on their behalf. We compared the B class management fee rates and investment terms of our funds to those offered to the other fund ranges and clients to make sure they were fair, with any differences being justifiable.
How did we do?
Fee rates for clients of Baillie Gifford, whether these are institutional clients or pooled funds, are set and reviewed by a fees group to ensure consistency across a range of clients. The management fee rates charged to the funds are in line with those for similar funds managed by Baillie Gifford. In addition, the fee rates are mostly in line with entry-level rates charged to institutional clients for similar investment management services but also include additional services such as daily pricing of the funds, administration, accounting and registration services not used by institutional clients. Entry levels for institutional clients are different and depend on the investment strategy but are generally £50m or £60m. Clients who invest more than these levels with us are able to benefit from tiered fee rates via a client-specific fee letter.
Conclusion
We have rated this green for all funds as B class management fee rates are in line with the fee rates offered to investors in comparable pooled funds and entry-level rates charged to institutional clients managed by Baillie Gifford. Where there are differences in fee rates, these are justifiable and appropriate.
7. Classes of shares
How we carried out the assessment
Our value assessment is based on our B class shares which are best suited to individual investors, purchased directly from Baillie Gifford & Co Limited or, for example, through an independent financial advisor or platform. We offer other share classes which have different management fee rates, different minimum levels of investment and are designed primarily for distributors of our funds and institutional investors. The different share classes and their management fees are noted in the prospectuses for the funds. We considered whether the differences in fee rates are justified.
How did we do?
We charge different management fees because we are an asset manager and use other companies to help us with the distribution and marketing of our funds. When we are setting an appropriate fee rate for a share class, we consider the nature of the relationships we have with these companies. A number of factors are taken into account, including the size or potential size of investment in our funds, the access afforded to markets, marketing services provided, and strategic partnerships. We aim to keep costs fair, reasonable and transparent for our clients. With the exception of our A class shares, the management fees for these other share classes are lower than those charged for B class shares. The lower fees are a recognition of the tasks carried out by the other company which would ordinarily be carried out by ourselves. Our C class shares do not charge a management fee but are only available to institutional clients who wish to have an investment management agreement with the firm and are charged separately for our investment services. Our Q class shares also do not charge a management fee but are only available in Baillie Gifford Multi Asset Growth Fund for Baillie Gifford Multi Asset Growth Feeder Fund.
We pay a rebate to investors in our A class shares. In most cases, the rebate is equivalent to the difference between the management fee rates for A class and B class shares, meaning in those cases we receive no more than the B class rate for managing the funds.
We continue to encourage all clients who still invest indirectly in the A class shares to contact their financial adviser or provider and consider whether this is the most appropriate share class to be invested in, or whether a switch to the cheaper B class share would be a better option.
Conclusion
We have rated all the funds green as we are satisfied that the reasons for the differences in management fee rates between the different share classes are justifiable and appropriate. We believe investors hold shares in the lowest cost share class available to them via their chosen investment route, but we encourage any who are still investing indirectly in our A class shares to contact their financial adviser.

Overall Conclusion of Value Assessment
Baillie Gifford aims to deliver overall value for investors in our funds over the long term, keeping costs fair and reasonable and providing excellent levels of client service to our investors. The conclusion of the value assessment is that all funds have delivered value, with some delivering excellent value. We will continue to monitor funds where performance has improved but longer-term returns still disappoint. We have concluded charges for the funds are justified in the context of the overall value delivered to investors and, where possible, economies of scale have been passed on to investors. In addition, we believe investors hold shares in the lowest cost share class available to them.

Summary by FundThis section summarises the outcome of our review of each fund, our rating of each of the seven criteria and our overall conclusion. We note how the funds performed relative to their objectives and show data we used to help evaluate fund performance and costs. For certain funds we note where improvements could be made and what action has been taken. We also note which funds require further monitoring. An illustrative example is shown below to help explain.
Illustrative Example
5
RAG Rating
1 Quality of service
2 Performance
4
Comparable market rates
6 Comparable services
3 Costs
5
Economies of scale
7 Classes of shares
Seven Criteria
6
(As of 31 March 2021)
£750mSize of Fund7
7
The fund provided value.
Conclusion
Overall Rating
1 2
(5 year annualised % p.a.)
Performance
(OCF % compared to other funds)
Costs
Average OCF of Fitz Peer Group3
Baillie Gifford Fund6
0.62
0.88
Target2Index2Fund1
13.2
6.3
8.4
3 Five-Year Cumulative Performance of £1,000 Invested
Fund4 Index5 Target5
£1,859 £1,357 £1,498
4 Breakdown of Ongoing Charges Figures (OCF)6
Management Fee
0.60%Custody
Fee
0.01%Depositary
Fee
0.01%Other Fees
0.00%0.62%OCF
1Source: StatPro. Performance (annualised) as at 31 March 2021, B class shares, closing prices, total return.2Source: StatPro and relevant index providers. Performance (annualised) as at 31 March 2021, total return in sterling.3Source: Fitz Partners. Weighted average OCF figures calculated using latest available audited accounts of the funds.4Source: StatPro. Performance (cumulative) as at 31 March 2021, B class shares, closing prices, total return.5Source: StatPro and relevant index providers. Performance (cumulative) as at 31 March 2021, total return in sterling. 6Source: Baillie Gifford & Co. OCF figures as at 31 March 2021.7Source: Baillie Gifford & Co. Fund size based on closing prices as at 31 March 2021.8Source: StatPro and relevant index providers. MSCI Golden Dragon Index to 2 May 2019, MSCI All China Index to 27 November 2019, MSCI China All Shares Index (target +2% per annum) thereafter. Performance (annualised) as at 31 March 2021, total return in sterling.9Source: StatPro and relevant index providers. MSCI Golden Dragon Index to 2 May 2019, MSCI All China Index to 27 November 2019, MSCI China All Shares Index (target +2% per annum) thereafter. Performance (cumulative) as at 31 March 2021, total return in sterling.10This is a newly launched fund and, to ensure initial investors do not pay disproportionately high costs, we have capped ‘other expenses’ i.e. expenses excluding the management fee at 0.10% until the fund reaches a suitable size.11Source: Style Analytics, Tokyo Stock Exchange. As at 31 March 2021. 12 month forecast dividend yield. Reweighted to 100% to exclude stocks without yield data.12Source: Style Analytics. B income shares, net annualised historic yield over a rolling five-year period to the fund’s financial period end of 31 January 2021.13Source: Style Analytics and relevant underlying index provider. Net annualised historic yield over a rolling five-year period to 31 January 2021.14Source: Baillie Gifford & Co. B income shares, net dividend income for the fund’s financial year to 31 January 2021.15Source: Baillie Gifford & Co. B income shares, distribution yield as at 31 March 2021.16Source: Baillie Gifford & Co. B income shares, historic yield as at the fund’s financial period end of 31 January 2021.17Source: UBS and relevant underlying index provider, net yield as at 31 December 2020.18Source: Baillie Gifford & Co. Annualised volatility, calculated over 5 years to the end of 31 March 2021.19This is a newly launched fund and, to ensure initial investors do not pay disproportionately high costs, we have capped expenses at those of the master fund plus 0.30% until the fund reaches a suitable size.20Source: Baillie Gifford & Co. Performance (annualised) as at 31 March 2021, B income shares, closing prices, capital return.21Source: Baillie Gifford & Co. Performance (cumulative) as at 31 March 2021, B income shares, closing prices, capital return.
For our legal notices and disclosures please visit www.bailliegifford.com/disclaimers. You should be aware that past performance is not a guide to future performance.
We compared the performance of the fund (after deduction of costs) to the index and target benchmark noted in the investment objective of the fund. Where a fund does not have an index or target noted in the investment objective, and where appropriate, we have shown the performance of the fund against its comparator. The performance figures shown are annualised returns for the period stated in the investment objective, five years for our equity, balanced and multi asset funds and three years for our bond funds. Where a fund has been launched within the last three or five years (depending on fund type), the performance since the launch of the fund is shown. Performance figures shown are for B class shares. The target return outperformance is compounded daily therefore the index return plus the outperformance will not equal the target return. Performance figures for other share classes in issue can be obtained by contacting our Client Relations Team (contact details provided on page 59).
1
We have shown the costs, ongoing charges figures (OCF %), of the B class shares as at 31 March 2021 against the weighted average costs of comparable share classes of funds in a peer group independently selected by Fitz Partners. Fitz Partners calculate the OCFs from the latest available audited accounts of the funds.
2
We have shown how much an investment of £1,000 in the fund would be worth now (31 March 2021) if invested for the period stated in the investment objective, five years for our equity, balanced and multi asset funds and three years for our bond funds. Where a fund has been launched within the last three or five years (depending on fund type), the performance return since the launch of the fund is shown. The performance returns for the index and target benchmark are also shown for the appropriate period. Performance figures are for B class shares and are after deduction of costs. Performance figures for other share classes in issue can be obtained by contacting our Client Relations Team (contact details provided on page 59).
3
This shows the breakdown of the ongoing charges figure (OCF) of the fund as at 31 March 2021. The OCF is made up of a number of different component costs. The figures shown have been rounded to two decimal places and some of these costs, when rounded to two decimal places, appear as 0.00%.
4
We used a RAG rating (red, amber, green) to evaluate each of the seven criteria.5
The board’s overall conclusion based on its evaluation of the seven criteria of whether value has been delivered to investors in the fund: green (fund provided value), amber (fund provided value, with action taken and/or further monitoring required), and red (fund did not provide value with action taken).
7
The size of the fund as at 31 March 2021 in billions (bn), millions (m) or thousands (k) of pounds.6
Our Equity FundsBaillie Gifford American Fund
Investment objective
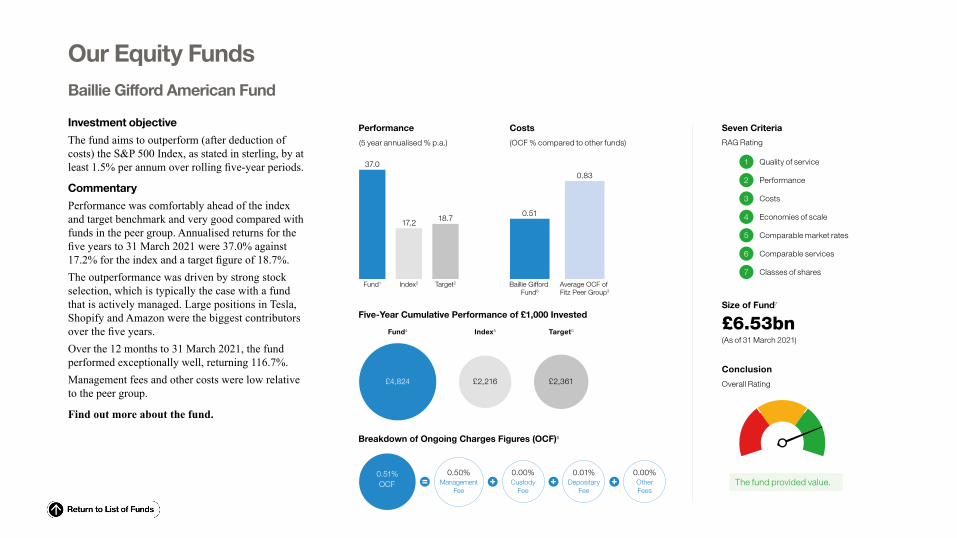
The fund aims to outperform (after deduction of costs) the S&P 500 Index, as stated in sterling, by at least 1.5% per annum over rolling five-year periods.
Commentary
Performance was comfortably ahead of the index and target benchmark and very good compared with funds in the peer group. Annualised returns for the five years to 31 March 2021 were 37.0% against 17.2% for the index and a target figure of 18.7%. The outperformance was driven by strong stock selection, which is typically the case with a fund that is actively managed. Large positions in Tesla, Shopify and Amazon were the biggest contributors over the five years.Over the 12 months to 31 March 2021, the fund performed exceptionally well, returning 116.7%.Management fees and other costs were low relative to the peer group.
Find out more about the fund.
(5 year annualised % p.a.)
Performance
(OCF % compared to other funds)
Costs
0.51
0.83
Average OCF of Fitz Peer Group3
Baillie Gifford Fund6
37.0
17.2 18.7
Target2Index2Fund1
Breakdown of Ongoing Charges Figures (OCF)6
Management Fee
0.50%Custody
Fee
0.00%Depositary
Fee
0.01%Other Fees
0.00%0.51%OCF
Five-Year Cumulative Performance of £1,000 Invested
Fund4 Index5 Target5
£4,824 £2,216 £2,361
RAG Rating
1 Quality of service
2 Performance
4
Comparable market rates
6 Comparable services
3 Costs
5
Economies of scale
7 Classes of shares
Seven Criteria
(As of 31 March 2021)
£6.53bnSize of Fund7
The fund provided value.
Conclusion
Overall Rating

Baillie Gifford British Smaller Companies Fund
Investment objective
The fund aims to outperform (after deduction of costs) the Numis Smaller Companies Index (excluding investment companies) by at least 2% per annum over rolling five-year periods.
Commentary
Over the five years to 31 March 2021, the fund returned 10.7% on an annualised basis, ahead of the index figure of 8.7% and 0.1% behind the target benchmark.The fund benefited from good stock selection and effective asset allocation. The biggest positive contributors were the holdings in Boohoo, YouGov and Ceres Power. Performance was strong over the 12 months to 31 March 2021, with the fund returning 78.8% compared to the index return of 65.6% and the target benchmark return of 68.9%.The fund’s management fees and other costs were low compared with others in the peer group.
Find out more about the fund.
(5 year annualised % p.a.)
Performance
(OCF % compared to other funds)
Costs
Average OCF of Fitz Peer Group3
Baillie Gifford Fund6
0.66
0.98
Target2Index2Fund1
10.7
8.7
10.8
Five-Year Cumulative Performance of £1,000 Invested
Fund4 Index5 Target5
£1,663 £1,514 £1,672
Breakdown of Ongoing Charges Figures (OCF)6
Management Fee
0.65%Custody
Fee
0.00%Depositary
Fee
0.01%Other Fees
0.00%0.66%OCF
RAG Rating
1 Quality of service
2 Performance
4
Comparable market rates
6 Comparable services
3 Costs
5
Economies of scale
7 Classes of shares
Seven Criteria
(As of 31 March 2021)
£312mSize of Fund7
We concluded the fund provided value as six of the seven criteria were rated green, with strong performance in the last 12 months meaning the fund only marginally underperformed the target benchmark over five years.
Conclusion
Overall Rating
Baillie Gifford China Fund
Investment objective
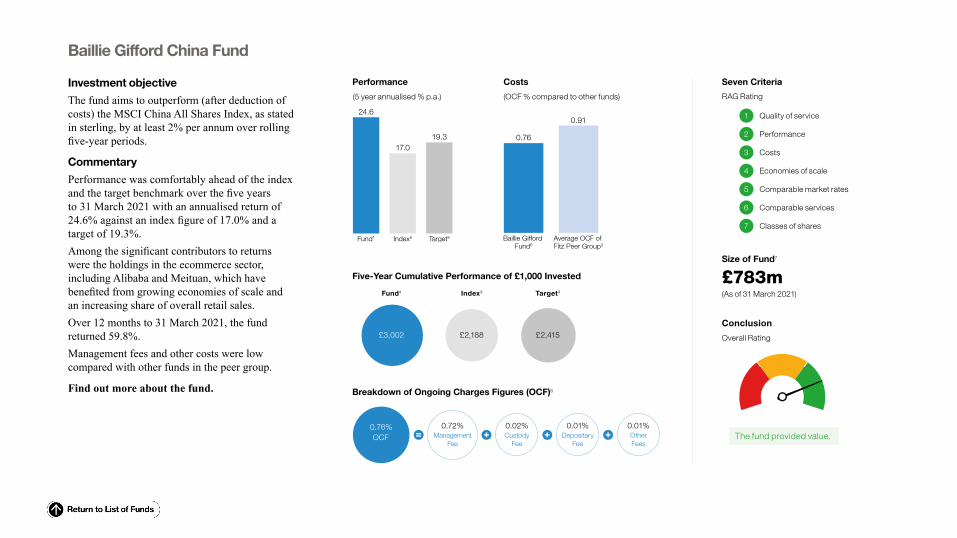
The fund aims to outperform (after deduction of costs) the MSCI China All Shares Index, as stated in sterling, by at least 2% per annum over rolling five-year periods.
Commentary
Performance was comfortably ahead of the index and the target benchmark over the five years to 31 March 2021 with an annualised return of 24.6% against an index figure of 17.0% and a target of 19.3%. Among the significant contributors to returns were the holdings in the ecommerce sector, including Alibaba and Meituan, which have benefited from growing economies of scale and an increasing share of overall retail sales. Over 12 months to 31 March 2021, the fund returned 59.8%.Management fees and other costs were low compared with other funds in the peer group.
Find out more about the fund.
(5 year annualised % p.a.)
Performance
(OCF % compared to other funds)
Costs
Average OCF of Fitz Peer Group3
Baillie Gifford Fund6
0.76
0.91
Target8Index8Fund1
24.6
17.019.3
Five-Year Cumulative Performance of £1,000 Invested
Fund4 Index9 Target9
£3,002 £2,188 £2,415
Breakdown of Ongoing Charges Figures (OCF)6
Management Fee
0.72%Custody
Fee
0.02%Depositary
Fee
0.01%Other Fees
0.01%0.76%OCF
RAG Rating
1 Quality of service
2 Performance
4
Comparable market rates
6 Comparable services
3 Costs
5
Economies of scale
7 Classes of shares
Seven Criteria
(As of 31 March 2021)
£783mSize of Fund7
The fund provided value.
Conclusion
Overall Rating

Baillie Gifford Developed Asia Pacific Fund
Investment objective
The fund aims to outperform (after deduction of costs) the MSCI Pacific Index, as stated in sterling, by at least 1.5% per annum over rolling five-year periods.
Commentary
The fund produced an annualised return of 15.0% over the five years to 31 March 2021, outperforming the index figure of 11.4% and the target of 13.1%, and achieving its performance objective. Among the strongest performers were Shiseido, Softbank Group and Recruit Holdings. Returns were also good relative to funds in the peer group. Over 12 months to 31 March 2021, the fund returned 50.5%.Management fees and other costs were low relative to the peer group.
Find out more about the fund.
(5 year annualised % p.a.)
Performance
(OCF % compared to other funds)
Costs
Average OCF of Fitz Peer Group3
Baillie Gifford Fund6
Target2Index2Fund1
0.59
1.0415.0
11.4
13.1
Five-Year Cumulative Performance of £1,000 Invested
Fund4 Index5 Target5
£2,012 £1,716 £1,848
Breakdown of Ongoing Charges Figures (OCF)6
Management Fee
0.55%Custody
Fee
0.01%Depositary
Fee
0.01%Other Fees
0.02%0.59%OCF
RAG Rating
1 Quality of service
2 Performance
4
Comparable market rates
6 Comparable services
3 Costs
5
Economies of scale
7 Classes of shares
Seven Criteria
(As of 31 March 2021)
£244mSize of Fund7
The fund provided value.
Conclusion
Overall Rating

Baillie Gifford Emerging Markets Growth Fund
Investment objective
The fund aims to outperform (after deduction of costs) the MSCI Emerging Markets Index, as stated in sterling, by at least 2% per annum over rolling five-year periods.
Commentary
The fund delivered annualised returns of 19.1%, significantly ahead of the index performance of 13.4% and the target benchmark figure of 15.7% over a five-year period to 31 March 2021. The returns benefited from strong performance by several of the portfolio holdings, including those in companies such as TSMC, the Taiwanese semiconductor foundry company, and MercadoLibre, the Latin American ecommerce company.Over 12 months to 31 March 2021, the fund returned 59.2%. The management fees and other costs applied to the fund were low in relation to others in the peer group.
Find out more about the fund.
(5 year annualised % p.a.)
Performance
(OCF % compared to other funds)
Costs
Average OCF of Fitz Peer Group3
Baillie Gifford Fund6
Target2Index2Fund1
0.76
1.0119.1
13.4
15.7
Five-Year Cumulative Performance of £1,000 Invested
Fund4 Index5 Target5
£2,397 £1,876 £2,070
Breakdown of Ongoing Charges Figures (OCF)6
Management Fee
0.72%Custody
Fee
0.03%Depositary
Fee
0.01%Other Fees
0.00%0.76%OCF
RAG Rating
1 Quality of service
2 Performance
4
Comparable market rates
6 Comparable services
3 Costs
5
Economies of scale
7 Classes of shares
Seven Criteria
(As of 31 March 2021)
£1.66bnSize of Fund7
The fund provided value.
Conclusion
Overall Rating

Baillie Gifford Emerging Markets Leading Companies Fund
Investment objective
The fund aims to outperform (after deduction of costs) the MSCI Emerging Markets Index, as stated in sterling, by at least 2% per annum over rolling five-year periods.
Commentary
The fund delivered an annualised return of 20.3%, significantly ahead of the index which delivered 13.4% and the target benchmark return of 15.7% over a five-year period to 31 March 2021. Performance was helped by strong performance from holdings such as TSMC, the Taiwanese semi-conductor foundry company, and MercadoLibre, the Latin American ecommerce company. Over 12 months to 31 March 2021, the fund’s return was 60.4%. The management fees and other costs applied to the fund were low in relation to others in the peer group.
Find out more about the fund.
(5 year annualised % p.a.)
Performance
(OCF % compared to other funds)
Costs
Average OCF of Fitz Peer Group3
Baillie Gifford Fund6
Target2Index2Fund1
0.76
1.0120.3
13.4
15.7
Five-Year Cumulative Performance of £1,000 Invested
Fund4 Index5 Target5
£2,518 £1,876 £2,070
Breakdown of Ongoing Charges Figures (OCF)6
Management Fee
0.72%Custody
Fee
0.03%Depositary
Fee
0.01%Other Fees
0.00%0.76%OCF
RAG Rating
1 Quality of service
2 Performance
4
Comparable market rates
6 Comparable services
3 Costs
5
Economies of scale
7 Classes of shares
Seven Criteria
(As of 31 March 2021)
£1.03bnSize of Fund7
The fund provided value.
Conclusion
Overall Rating
Baillie Gifford European Fund
Investment objective
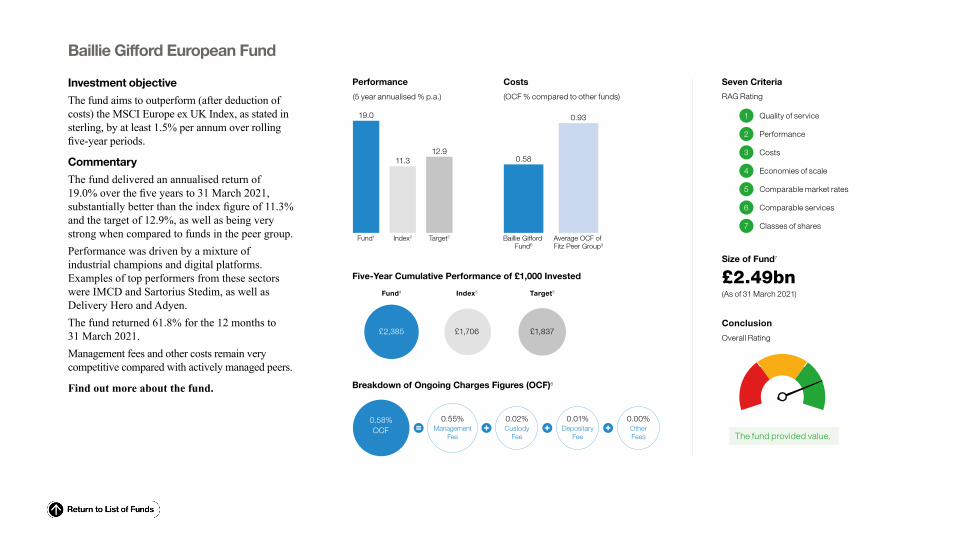
The fund aims to outperform (after deduction of costs) the MSCI Europe ex UK Index, as stated in sterling, by at least 1.5% per annum over rolling five-year periods.
Commentary
The fund delivered an annualised return of 19.0% over the five years to 31 March 2021, substantially better than the index figure of 11.3% and the target of 12.9%, as well as being very strong when compared to funds in the peer group.Performance was driven by a mixture of industrial champions and digital platforms. Examples of top performers from these sectors were IMCD and Sartorius Stedim, as well as Delivery Hero and Adyen. The fund returned 61.8% for the 12 months to 31 March 2021. Management fees and other costs remain very competitive compared with actively managed peers.
Find out more about the fund.
(5 year annualised % p.a.)
Performance
(OCF % compared to other funds)
Costs
Average OCF of Fitz Peer Group3
Baillie Gifford Fund6
Target2Index2Fund1
0.58
0.9319.0
11.312.9
Five-Year Cumulative Performance of £1,000 Invested
Fund4 Index5 Target5
£2,385 £1,706 £1,837
Breakdown of Ongoing Charges Figures (OCF)6
Management Fee
0.55%Custody
Fee
0.02%Depositary
Fee
0.01%Other Fees
0.00%0.58%OCF
RAG Rating
1 Quality of service
2 Performance
4
Comparable market rates
6 Comparable services
3 Costs
5
Economies of scale
7 Classes of shares
Seven Criteria
(As of 31 March 2021)
£2.49bnSize of Fund7
The fund provided value.
Conclusion
Overall Rating

Baillie Gifford Global Alpha Growth Fund
Investment objective
The fund aims to outperform (after deduction of costs) the MSCI ACWI Index, as stated in sterling, by at least 2% per annum over rolling five-year periods.
Commentary
The portfolio delivered an annualised return of 20.4% over the five-year period to 31 March 2021. This was comfortably ahead of the index figure of 14.7% and the target of 17.0%. Returns were also strong relative to the peer group. Key contributors to performance were companies in the ‘Rapid Growth’ category within the portfolio, characterised by large addressable markets, increasing returns to scale, network effects and ambitious management teams. Among the leading performers were Amazon, Tesla, Shopify, and SEA Ltd.The fund returned 55.6% over the 12 months to 31 March 2021.Management fees and other costs were low relative to the peer group.
Find out more about the fund.
(5 year annualised % p.a.)
Performance
(OCF % compared to other funds)
Costs
Average OCF of Fitz Peer Group3
Baillie Gifford Fund6
Target2Index2Fund1
0.59
0.9020.4
14.7
17.0
Five-Year Cumulative Performance of £1,000 Invested
Fund4 Index5 Target5
£2,526 £1,989 £2,195
Breakdown of Ongoing Charges Figures (OCF)6
Management Fee
0.57%Custody
Fee
0.01%Depositary
Fee
0.01%Other Fees
0.00%0.59%OCF
RAG Rating
1 Quality of service
2 Performance
4
Comparable market rates
6 Comparable services
3 Costs
5
Economies of scale
7 Classes of shares
Seven Criteria
(As of 31 March 2021)
£4.73bnSize of Fund7
The fund provided value.
Conclusion
Overall Rating

Baillie Gifford Global Discovery Fund
Investment objective
The fund aims to outperform (after deduction of costs) the S&P Global Small Cap Index, as stated in sterling, by at least 2% per annum over rolling five-year periods.
Commentary
The fund delivered an annualised return of 26.8% over the five years to 31 March 2021, ending the period comfortably ahead of the index, which achieved a return of 14.1%, and the target figure of 16.2%. The strong performance was a result of good stock selection, with the biggest positive contributions coming from the holdings in Tesla, Ocado and Teladoc. The fund returned 82.1% over the 12 months to 31 March 2021. The fund’s management fees and other costs were low compared with others in the peer group.
Find out more about the fund.
Average OCF of Fitz Peer Group3
Baillie Gifford Fund6
Target2Index2Fund1
(5 year annualised % p.a.)
Performance
(OCF % compared to other funds)
Costs
0.76
1.0026.8
14.116.2
Five-Year Cumulative Performance of £1,000 Invested
Fund4 Index5 Target5
£3,283 £1,937 £2,118
Breakdown of Ongoing Charges Figures (OCF)6
Management Fee
0.75%Custody
Fee
0.01%Depositary
Fee
0.00%Other Fees
0.00%0.76%OCF
RAG Rating
1 Quality of service
2 Performance
4
Comparable market rates
6 Comparable services
3 Costs
5
Economies of scale
7 Classes of shares
Seven Criteria
(As of 31 March 2021)
£2.17bnSize of Fund7
The fund provided value.
Conclusion
Overall Rating

Baillie Gifford Global Stewardship Fund
Investment objective
The fund aims to outperform (after deduction of costs) the MSCI ACWI Index, as stated in sterling, by at least 2% per annum over rolling five-year periods.
Commentary
December 2020 marked the fifth anniversary of the fund. Performance to that point was strong and has remained positive since then. Annualised returns over the five-year period to 31 March 2021 were 27.2%, well ahead of the target benchmark, which returned 17.0%. It has long been our belief that responsible investing is good for returns and we are clearly seeing evidence of that. For the 12 months to 31 March 2021, the fund returned 86.7%.The management fees and other costs applied to the fund were low in relation to others in the peer group.
Find out more about the fund.
See the latest Global Stewardship Environmental, Social and Governance Report.
Average OCF of Fitz Peer Group3
Baillie Gifford Fund6
Target2Index2Fund1
(5 year annualised % p.a.)
Performance
(OCF % compared to other funds)
Costs
0.53
0.9027.2
14.717.0
Five-Year Cumulative Performance of £1,000 Invested
Fund4 Index5 Target5
£3,334 £1,989 £2,195
Breakdown of Ongoing Charges Figures (OCF)6
Management Fee
0.50%Custody
Fee
0.01%Depositary
Fee
0.01%Other Fees
0.01%0.53%OCF
RAG Rating
1 Quality of service
2 Performance
4
Comparable market rates
6 Comparable services
3 Costs
5
Economies of scale
7 Classes of shares
Seven Criteria
(As of 31 March 2021)
£670mSize of Fund7
The fund provided value.
Conclusion
Overall Rating

Baillie Gifford Health Innovation Fund
Investment objective
The fund aims to outperform (after deduction of costs) the MSCI ACWI Index, as stated in sterling, by at least 2.5% per annum over rolling five-year periods.
Commentary
The Health Innovation investment team is focused on generating returns for clients by providing long-term patient capital to companies transforming human health. As with all Baillie Gifford equity funds, we believe that an informative timeframe over which to measure investment performance is five years or longer, so this new fund’s four-month track record carries no statistical significance.
Find out more about the fund.
Average OCF of Fitz Peer Group3
Baillie Gifford Fund6
(Since Inception % p.a.)
Performance
(OCF % compared to other funds)
Costs
0.60
0.82
Target2Index2Fund1
Target2Index2Fund1
-3.8
3.74.5
Since Inception Cumulative Performance of £1,000 Invested
Target5Fund4 Index5
£1,045£962 £1,037
Breakdown of Ongoing Charges Figures (OCF)6
Management Fee
0.50%Custody
Fee
0.01%Depositary
Fee
0.01%Other Fees10
0.08%0.60%OCF
RAG Rating
1 Quality of service
2 Performance (n/a – new fund)
4
Comparable market rates
6 Comparable services
3 Costs
5
Economies of scale
7 Classes of shares
Seven Criteria
(As of 31 March 2021)
£80mSize of Fund7
The fund provided value.
Conclusion
Overall Rating
Baillie Gifford International Fund
Investment objective
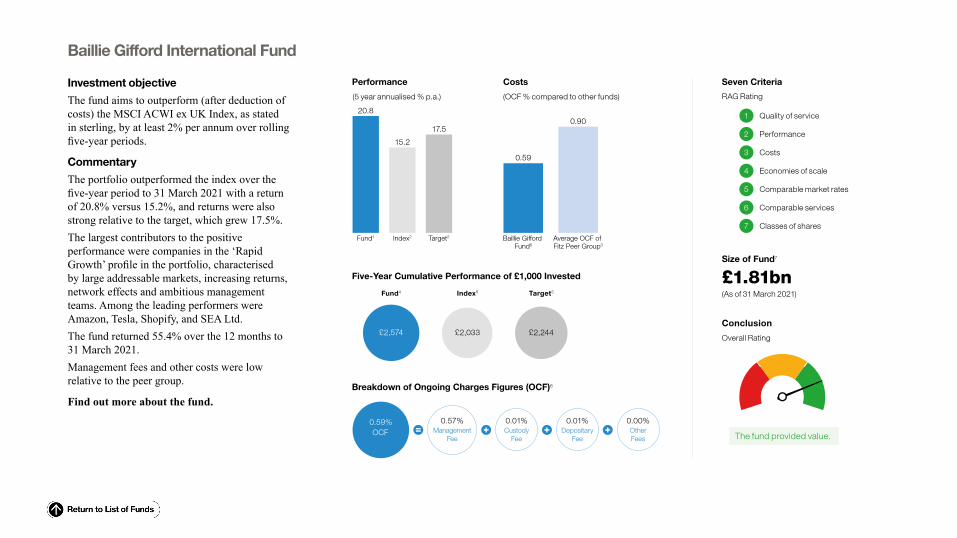
The fund aims to outperform (after deduction of costs) the MSCI ACWI ex UK Index, as stated in sterling, by at least 2% per annum over rolling five-year periods.
Commentary
The portfolio outperformed the index over the five-year period to 31 March 2021 with a return of 20.8% versus 15.2%, and returns were also strong relative to the target, which grew 17.5%. The largest contributors to the positive performance were companies in the ‘Rapid Growth’ profile in the portfolio, characterised by large addressable markets, increasing returns, network effects and ambitious management teams. Among the leading performers were Amazon, Tesla, Shopify, and SEA Ltd.The fund returned 55.4% over the 12 months to 31 March 2021.Management fees and other costs were low relative to the peer group.
Find out more about the fund.
Average OCF of Fitz Peer Group3
Baillie Gifford Fund6
Target2Index2Fund1
(5 year annualised % p.a.)
Performance
(OCF % compared to other funds)
Costs
0.59
0.9020.8
15.2
17.5
Five-Year Cumulative Performance of £1,000 Invested
Fund4 Index5 Target5
£2,574 £2,033 £2,244
Breakdown of Ongoing Charges Figures (OCF)6
Management Fee
0.57%Custody
Fee
0.01%Depositary
Fee
0.01%Other Fees
0.00%0.59%OCF
RAG Rating
1 Quality of service
2 Performance
4
Comparable market rates
6 Comparable services
3 Costs
5
Economies of scale
7 Classes of shares
Seven Criteria
(As of 31 March 2021)
£1.81bnSize of Fund7
The fund provided value.
Conclusion
Overall Rating
Baillie Gifford Japanese Fund
Investment objective
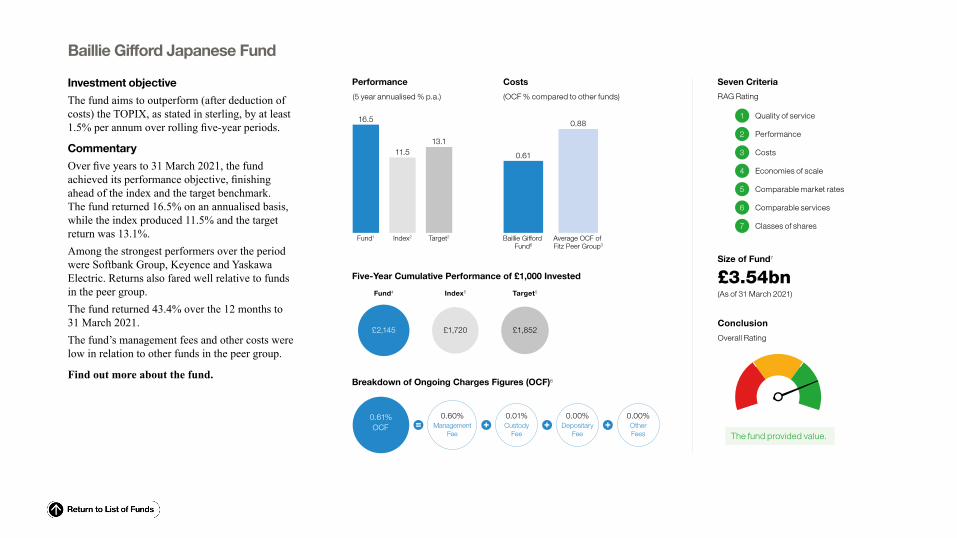
The fund aims to outperform (after deduction of costs) the TOPIX, as stated in sterling, by at least 1.5% per annum over rolling five-year periods.
Commentary
Over five years to 31 March 2021, the fund achieved its performance objective, finishing ahead of the index and the target benchmark. The fund returned 16.5% on an annualised basis, while the index produced 11.5% and the target return was 13.1%. Among the strongest performers over the period were Softbank Group, Keyence and Yaskawa Electric. Returns also fared well relative to funds in the peer group. The fund returned 43.4% over the 12 months to 31 March 2021.The fund’s management fees and other costs were low in relation to other funds in the peer group.
Find out more about the fund.
Average OCF of Fitz Peer Group3
Baillie Gifford Fund6
Target2Index2Fund1
(5 year annualised % p.a.)
Performance
(OCF % compared to other funds)
Costs
0.61
0.8816.5
11.513.1
Five-Year Cumulative Performance of £1,000 Invested
Target5Fund4 Index5
£1,852£2,145 £1,720
Breakdown of Ongoing Charges Figures (OCF)6
Management Fee
0.60%Custody
Fee
0.01%Depositary
Fee
0.00%Other Fees
0.00%0.61%OCF
RAG Rating
1 Quality of service
2 Performance
4
Comparable market rates
6 Comparable services
3 Costs
5
Economies of scale
7 Classes of shares
Seven Criteria
(As of 31 March 2021)
£3.54bnSize of Fund7
The fund provided value.
Conclusion
Overall Rating
Baillie Gifford Japanese Income Growth Fund
Investment objective
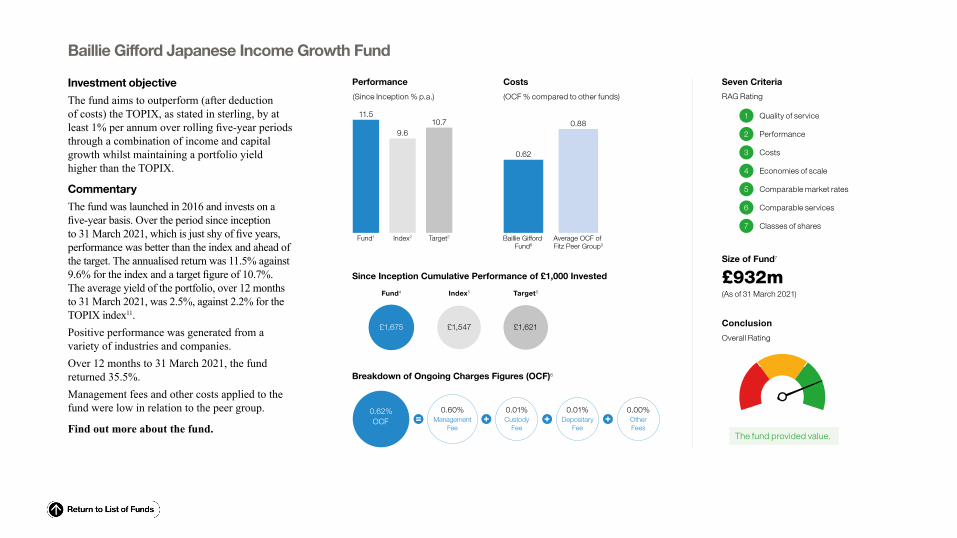
The fund aims to outperform (after deduction of costs) the TOPIX, as stated in sterling, by at least 1% per annum over rolling five-year periods through a combination of income and capital growth whilst maintaining a portfolio yield higher than the TOPIX.
Commentary
The fund was launched in 2016 and invests on a five-year basis. Over the period since inception to 31 March 2021, which is just shy of five years, performance was better than the index and ahead of the target. The annualised return was 11.5% against 9.6% for the index and a target figure of 10.7%. The average yield of the portfolio, over 12 months to 31 March 2021, was 2.5%, against 2.2% for the TOPIX index11. Positive performance was generated from a variety of industries and companies. Over 12 months to 31 March 2021, the fund returned 35.5%. Management fees and other costs applied to the fund were low in relation to the peer group.
Find out more about the fund.
Average OCF of Fitz Peer Group3
Baillie Gifford Fund6
Target2Index2Fund1
(Since Inception % p.a.)
Performance
(OCF % compared to other funds)
Costs
0.62
0.8811.5
9.610.7
Since Inception Cumulative Performance of £1,000 Invested
Fund4 Index5 Target5
£1,675 £1,547 £1,621
Breakdown of Ongoing Charges Figures (OCF)6
Management Fee
0.60%Custody
Fee
0.01%Depositary
Fee
0.01%Other Fees
0.00%0.62%OCF
RAG Rating
1 Quality of service
2 Performance
4
Comparable market rates
6 Comparable services
3 Costs
5
Economies of scale
7 Classes of shares
Seven Criteria
(As of 31 March 2021)
£932mSize of Fund7
The fund provided value.
Conclusion
Overall Rating

Baillie Gifford Japanese Smaller Companies Fund
Investment objective
The fund aims to outperform (after deduction of costs) the MSCI Japan Small Cap Index, as stated in sterling, by at least 1.5% per annum over rolling five-year periods.
Commentary
Fund performance was well ahead of the index and the target benchmark over the five-year period to 31 March 2021, and very good when compared to funds in the peer group. The fund’s annualised return was 15.9%, while the figure for the index was 10.9% and the target was 12.5%. A number of internet-based business models featured among the largest positive contributors, including Demae-can, Bengo4.com and MonotaRo. Over the 12-month period to 31 March 2021, the fund returned 47.6%.Management fees and other costs were low in relation to other funds in the peer group.
Find out more about the fund.
Average OCF of Fitz Peer Group3
Baillie Gifford Fund6
Target2Index2Fund1
(5 year annualised % p.a.)
Performance
(OCF % compared to other funds)
Costs
0.610.71
15.9
10.912.5
Five-Year Cumulative Performance of £1,000 Invested
Target5Fund4 Index5
£1,805£2,096 £1,676
Breakdown of Ongoing Charges Figures (OCF)6
Management Fee
0.60%Custody
Fee
0.01%Depositary
Fee
0.00%Other Fees
0.00%0.61%OCF
RAG Rating
1 Quality of service
2 Performance
4
Comparable market rates
6 Comparable services
3 Costs
5
Economies of scale
7 Classes of shares
Seven Criteria
(As of 31 March 2021)
£1.03bnSize of Fund7
The fund provided value.
Conclusion
Overall Rating
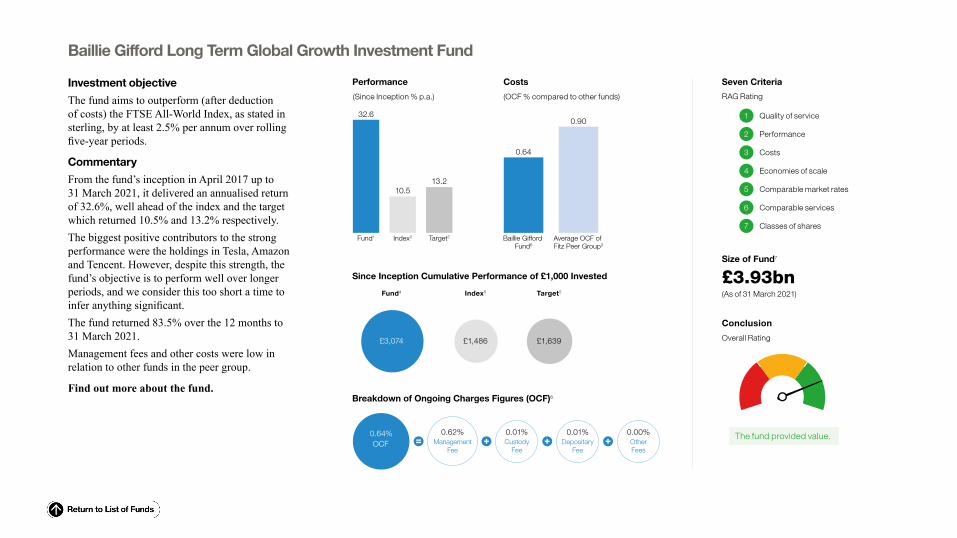
Baillie Gifford Long Term Global Growth Investment Fund
Investment objective
The fund aims to outperform (after deduction of costs) the FTSE All-World Index, as stated in sterling, by at least 2.5% per annum over rolling five-year periods.
Commentary
From the fund’s inception in April 2017 up to 31 March 2021, it delivered an annualised return of 32.6%, well ahead of the index and the target which returned 10.5% and 13.2% respectively. The biggest positive contributors to the strong performance were the holdings in Tesla, Amazon and Tencent. However, despite this strength, the fund’s objective is to perform well over longer periods, and we consider this too short a time to infer anything significant.The fund returned 83.5% over the 12 months to 31 March 2021.Management fees and other costs were low in relation to other funds in the peer group.
Find out more about the fund.
Average OCF of Fitz Peer Group3
Baillie Gifford Fund6
Target2Index2Fund1
(Since Inception % p.a.)
Performance
(OCF % compared to other funds)
Costs
0.64
0.9032.6
10.513.2
Since Inception Cumulative Performance of £1,000 Invested
Fund4 Index5 Target5
£3,074 £1,486 £1,639
Breakdown of Ongoing Charges Figures (OCF)6
Management Fee
0.62%Custody
Fee
0.01%Depositary
Fee
0.01%Other Fees
0.00%0.64%OCF
RAG Rating
1 Quality of service
2 Performance
4
Comparable market rates
6 Comparable services
3 Costs
5
Economies of scale
7 Classes of shares
Seven Criteria
(As of 31 March 2021)
£3.93bnSize of Fund7
The fund provided value.
Conclusion
Overall Rating

Baillie Gifford Pacific Fund
Investment objective
The fund aims to outperform (after deduction of costs) the MSCI AC Asia ex Japan Index, as stated in sterling, by at least 2% per annum over rolling five-year periods.
Commentary
Over the five-year period to 31 March 2021, the fund outperformed the index and target benchmark. The annualised return was 25.0% versus the index figure of 15.1% and the target of 17.3%. The main contributors over the five-year period included SEA, the South Asian gaming and ecommerce platform that continued to enjoy strong growth. Over 12 months to 31 March 2021, the fund returned 88.2%.Management fees and other costs charged to the fund were low in relation to other funds in the peer group.
Find out more about the fund.
Average OCF of Fitz Peer Group3
Baillie Gifford Fund6
Target2Index2Fund1
(5 year annualised % p.a.)
Performance
(OCF % compared to other funds)
Costs
0.71
0.9625.0
15.117.3
Five-Year Cumulative Performance of £1,000 Invested
Target5Fund4 Index5
£2,225£3,051 £2,016
Breakdown of Ongoing Charges Figures (OCF)6
Management Fee
0.65%Custody
Fee
0.05%Depositary
Fee
0.01%Other Fees
0.00%0.71%OCF
RAG Rating
1 Quality of service
2 Performance
4
Comparable market rates
6 Comparable services
3 Costs
5
Economies of scale
7 Classes of shares
Seven Criteria
(As of 31 March 2021)
£2.73bnSize of Fund7
The fund provided value.
Conclusion
Overall Rating
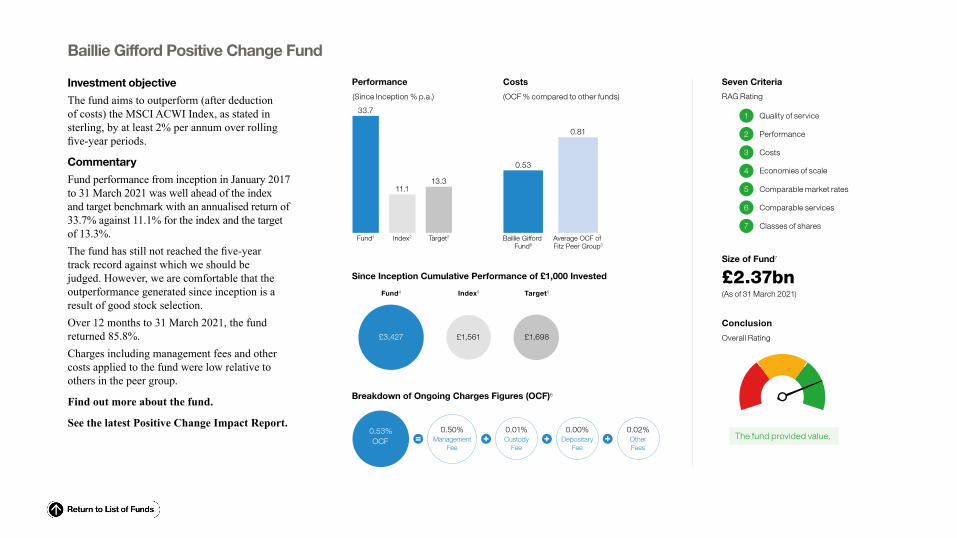
Baillie Gifford Positive Change Fund
Investment objective
The fund aims to outperform (after deduction of costs) the MSCI ACWI Index, as stated in sterling, by at least 2% per annum over rolling five-year periods.
Commentary
Fund performance from inception in January 2017 to 31 March 2021 was well ahead of the index and target benchmark with an annualised return of 33.7% against 11.1% for the index and the target of 13.3%. The fund has still not reached the five-year track record against which we should be judged. However, we are comfortable that the outperformance generated since inception is a result of good stock selection. Over 12 months to 31 March 2021, the fund returned 85.8%.Charges including management fees and other costs applied to the fund were low relative to others in the peer group.
Find out more about the fund.
See the latest Positive Change Impact Report.
Average OCF of Fitz Peer Group3
Baillie Gifford Fund6
Target2Index2Fund1
(Since Inception % p.a.)
Performance
(OCF % compared to other funds)
Costs
0.53
0.81
33.7
11.113.3
Since Inception Cumulative Performance of £1,000 Invested
Fund4 Index5 Target5
£3,427 £1,561 £1,698
Breakdown of Ongoing Charges Figures (OCF)6
Management Fee
0.50%Custody
Fee
0.01%Depositary
Fee
0.00%Other Fees
0.02%0.53%OCF
RAG Rating
1 Quality of service
2 Performance
4
Comparable market rates
6 Comparable services
3 Costs
5
Economies of scale
7 Classes of shares
Seven Criteria
(As of 31 March 2021)
£2.37bnSize of Fund7
The fund provided value.
Conclusion
Overall Rating

Baillie Gifford UK and Worldwide Equity Fund
Investment objective
The fund aims to outperform (after deduction of costs) a composite index comprising 60% UK and 40% overseas equities, as stated in sterling, by at least 1% per annum over rolling five-year periods.
Commentary
From inception in September 2017 to 31 March 2021, the fund’s annualised performance was 12.4%, comfortably ahead of the target return of 5.9%. However, although we are happy with this result, the objective is to perform well over longer periods, and the fund has still to reach its five year recommended holding period, the minimum length of time over which to infer anything significant. The fund returned 54.7% over the 12-month period to 31 March 2021.Management fees and other costs applied to the fund were low relative to the peer group.
Average OCF of Fitz Peer Group3
Baillie Gifford Fund6
Target2Index2Fund1
(Since Inception % p.a.)
Performance
(OCF % compared to other funds)
Costs
0.47
0.9012.4
4.85.9
Since Inception Cumulative Performance of £1,000 Invested
Fund4 Index5 Target5
£1,514 £1,183 £1,226
Breakdown of Ongoing Charges Figures (OCF)6
Management Fee
0.45%Custody
Fee
0.01%Depositary
Fee
0.01%Other Fees
0.00%0.47%OCF
RAG Rating
1 Quality of service
2 Performance
4
Comparable market rates
6 Comparable services
3 Costs
5
Economies of scale
7 Classes of shares
Seven Criteria
(As of 31 March 2021)
£544mSize of Fund7
The fund provided value.
Conclusion
Overall Rating

Baillie Gifford UK Equity Alpha Fund
Investment objective
The fund aims to outperform (after deduction of costs) the FTSE All-Share Index by at least 2% per annum over rolling five-year periods.
Commentary
Over five years to 31 March 2021, the fund outperformed its index and its target and had good performance relative to the peer group. The fund returned 13.2% against index performance of 6.3% and a target of 8.4% on an annualised basis.Among the holdings that contributed positively were Ocado, Aveva and Renishaw.The fund returned 43.0% over the 12-month period to 31 March 2021.The management fees and other costs which applied to the fund were low relative to the peer group.
Find out more about the fund.
Average OCF of Fitz Peer Group3
Baillie Gifford Fund6
Target2Index2Fund1
(5 year annualised % p.a.)
Performance
(OCF % compared to other funds)
Costs
0.56
0.8713.2
6.3
8.4
Five-Year Cumulative Performance of £1,000 Invested
Target5Fund4 Index5
£1,498£1,859 £1,357
Breakdown of Ongoing Charges Figures (OCF)6
Management Fee
0.55%Custody
Fee
0.00%Depositary
Fee
0.01%Other Fees
0.00%0.56%OCF
RAG Rating
1 Quality of service
2 Performance
4
Comparable market rates
6 Comparable services
3 Costs
5
Economies of scale
7 Classes of shares
Seven Criteria
(As of 31 March 2021)
£911mSize of Fund7
The fund provided value.
Conclusion
Overall Rating

Baillie Gifford UK Equity Core Fund
Investment objective
The fund aims to outperform (after deduction of costs) the FTSE All-Share Index by at least 1% per annum over rolling five-year periods.
Commentary
From inception of the fund in January 2018 to 31 March 2021, the fund returned 2.8% against an index return of 0.6% and a target of 1.6% on an annualised basis.The fund returned 37.2% over the 12 months to end March 2021, outperforming the index and target. The main positive contributors were Ashtead, St. James’s Place and BHP, while not holding the big oil and pharmaceutical companies, large index constituents that fell over the period, was also helpful. The fund’s objective is to perform well over longer periods, so while performance since launch is pleasing it is too short a time to infer anything meaningful. The fund’s fees are considered to be competitive versus the peer group.
Find out more about the fund.
Average OCF of Fitz Peer Group3
Baillie Gifford Fund6
Target2Index2Fund1
(Since Inception % p.a.)
Performance
(OCF % compared to other funds)
Costs
0.44
0.872.8
0.6
1.6
Since Inception Cumulative Performance of £1,000 Invested
Fund4 Index5 Target5
£1,094 £1,018 £1,051
Breakdown of Ongoing Charges Figures (OCF)6
Management Fee
0.42%Custody
Fee
0.00%Depositary
Fee
0.01%Other Fees
0.01%0.44%OCF
RAG Rating
1 Quality of service
2 Performance
4
Comparable market rates
6 Comparable services
3 Costs
5
Economies of scale
7 Classes of shares
Seven Criteria
(As of 31 March 2021)
£313mSize of Fund7
The fund provided value.
Conclusion
Overall Rating

Baillie Gifford UK Equity Focus Fund
Investment objective
The fund aims to outperform (after deduction of costs) the FTSE All-Share Index by at least 1.5% per annum over rolling five-year periods.
Commentary
From inception of the fund in August 2017 to 31 March 2021, the fund delivered an annualised return of 9.6% versus an index return of 1.9% and a target of 3.4%.The fund performed particularly strongly over the 12-month period to end March 2021, delivering a return of 53.6%, which was well ahead of both the index and its target. Among the holdings which contributed positively were online luxury goods retail platform, Farfetch; the leading metrology company, Renishaw, and Games Workshop, the name behind the Warhammer brand which manufactures and sells miniature figurines used for table-top strategy games. The fund’s objective is to perform well over longer periods, so it is encouraging to report that the fund has outperformed its objective over all time periods in both absolute and relative terms. Management fees and other costs were low compared to others in the peer group.
Find out more about the fund.
Average OCF of Fitz Peer Group3
Baillie Gifford Fund6
Target2Index2Fund1
(Since Inception % p.a.)
Performance
(OCF % compared to other funds)
Costs
0.49
0.879.6
1.9
3.4
Since Inception Cumulative Performance of £1,000 Invested
Target5Fund4 Index5
£1,130£1,399 £1,070
Breakdown of Ongoing Charges Figures (OCF)6
Management Fee
0.47%Custody
Fee
0.00%Depositary
Fee
0.01%Other Fees
0.01%0.49%OCF
RAG Rating
1 Quality of service
2 Performance
4
Comparable market rates
6 Comparable services
3 Costs
5
Economies of scale
7 Classes of shares
Seven Criteria
(As of 31 March 2021)
£204mSize of Fund7
The fund provided value.
Conclusion
Overall Rating
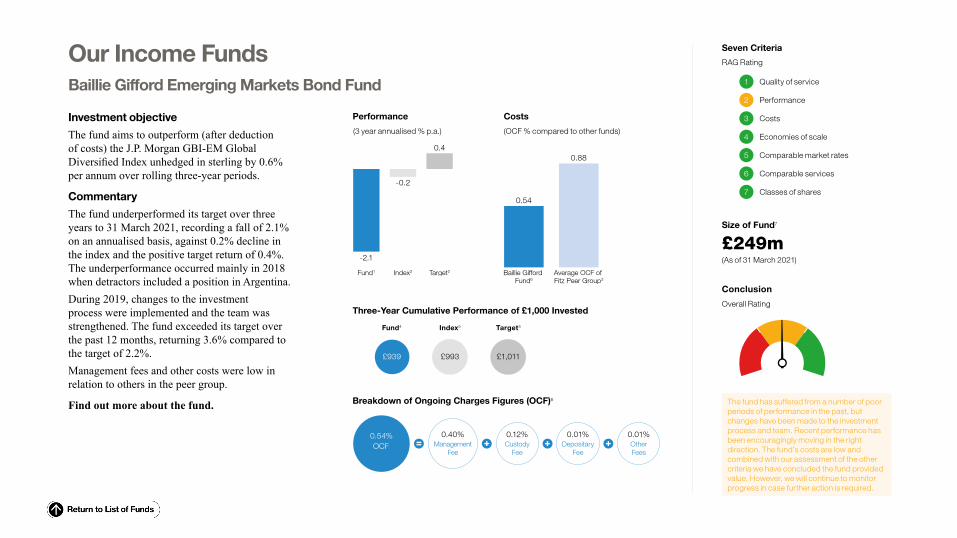
Baillie Gifford Emerging Markets Bond Fund
Our Income Funds
Investment objective
The fund aims to outperform (after deduction of costs) the J.P. Morgan GBI-EM Global Diversified Index unhedged in sterling by 0.6% per annum over rolling three-year periods.
Commentary
The fund underperformed its target over three years to 31 March 2021, recording a fall of 2.1% on an annualised basis, against 0.2% decline in the index and the positive target return of 0.4%. The underperformance occurred mainly in 2018 when detractors included a position in Argentina. During 2019, changes to the investment process were implemented and the team was strengthened. The fund exceeded its target over the past 12 months, returning 3.6% compared to the target of 2.2%.Management fees and other costs were low in relation to others in the peer group.
Find out more about the fund.
Average OCF of Fitz Peer Group3
Baillie Gifford Fund6
Target2Index2Fund1
(3 year annualised % p.a.)
Performance
(OCF % compared to other funds)
Costs
0.54
0.88
-2.1
-0.2
0.4
Three-Year Cumulative Performance of £1,000 Invested
Fund4 Index5 Target5
£939 £993 £1,011
Breakdown of Ongoing Charges Figures (OCF)6
Management Fee
0.40%Custody
Fee
0.12%Depositary
Fee
0.01%Other Fees
0.01%0.54%OCF
RAG Rating
1 Quality of service
2 Performance
4
Comparable market rates
6 Comparable services
3 Costs
5
Economies of scale
7 Classes of shares
Seven Criteria
(As of 31 March 2021)
£249mSize of Fund7
The fund has suffered from a number of poor periods of performance in the past, but changes have been made to the investment process and team. Recent performance has been encouragingly moving in the right direction. The fund’s costs are low and combined with our assessment of the other criteria we have concluded the fund provided value. However, we will continue to monitor progress in case further action is required.
Conclusion
Overall Rating
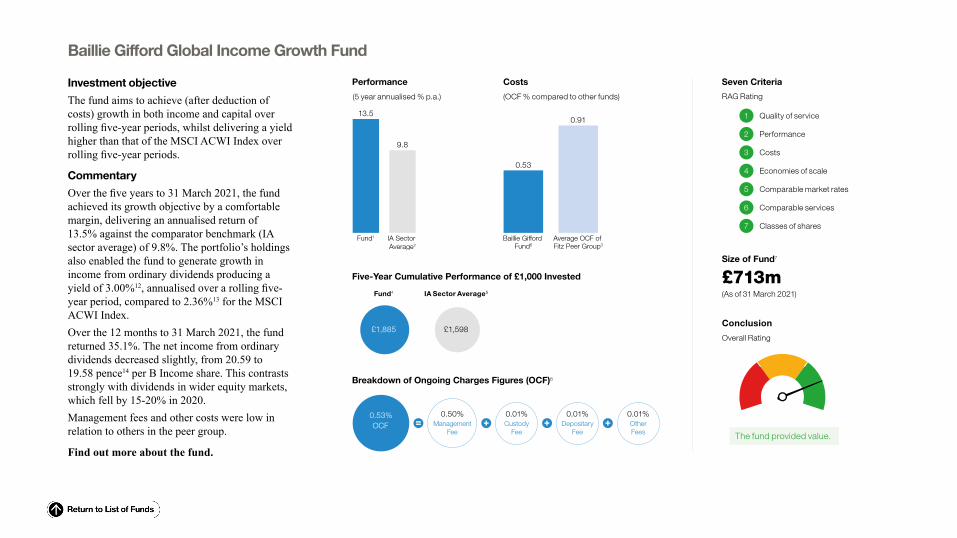
Baillie Gifford Global Income Growth Fund
Investment objective
The fund aims to achieve (after deduction of costs) growth in both income and capital over rolling five-year periods, whilst delivering a yield higher than that of the MSCI ACWI Index over rolling five-year periods.
Commentary
Over the five years to 31 March 2021, the fund achieved its growth objective by a comfortable margin, delivering an annualised return of 13.5% against the comparator benchmark (IA sector average) of 9.8%. The portfolio’s holdings also enabled the fund to generate growth in income from ordinary dividends producing a yield of 3.00%12, annualised over a rolling five-year period, compared to 2.36%13 for the MSCI ACWI Index. Over the 12 months to 31 March 2021, the fund returned 35.1%. The net income from ordinary dividends decreased slightly, from 20.59 to 19.58 pence14 per B Income share. This contrasts strongly with dividends in wider equity markets, which fell by 15-20% in 2020. Management fees and other costs were low in relation to others in the peer group.
Find out more about the fund.
Average OCF of Fitz Peer Group3
Baillie Gifford Fund6
IA Sector Average2
Fund1
(5 year annualised % p.a.)
Performance
(OCF % compared to other funds)
Costs
0.53
0.9113.5
9.8
Five-Year Cumulative Performance of £1,000 Invested
Fund4 IA Sector Average5
£1,885 £1,598
Breakdown of Ongoing Charges Figures (OCF)6
Management Fee
0.50%Custody
Fee
0.01%Depositary
Fee
0.01%Other Fees
0.01%0.53%OCF
RAG Rating
1 Quality of service
2 Performance
4
Comparable market rates
6 Comparable services
3 Costs
5
Economies of scale
7 Classes of shares
Seven Criteria
(As of 31 March 2021)
£713mSize of Fund7
The fund provided value.
Conclusion
Overall Rating

Baillie Gifford High Yield Bond Fund
Investment objective
The fund aims to produce a combination of income and capital growth.
Commentary
The fund delivered annualised returns of 4.3%, marginally underperforming its comparator benchmark (IA sector average) performance of 4.5% over the three-year period to 31 March 2021. This was largely due to performance in the final quarter of 2020 when our longer-term focus on resilience meant the fund lagged over this short timeframe. Prior to this, individual bond selection made a meaningful positive contribution to returns. No immediate actions have been taken given the very short-term nature of the underperformance.The fund returned 21.3% over the 12 months to 31 March 2021 compared to the comparator benchmark of 23.5%.The fund also paid a quarterly income distribution during the period and yielded 4.1%15 at 31 March 2021.The management fees and other costs applied to the fund were low in relation to others in the peer group.
Find out more about the fund.
Average OCF of Fitz Peer Group3
Baillie Gifford Fund6
IA Sector Average2
Fund1
(3 year annualised % p.a.)
Performance
(OCF % compared to other funds)
Costs
0.37
0.76
4.34.5
Three-Year Cumulative Performance of £1,000 Invested
Fund4 IA Sector Average5
£1,134 £1,141
Breakdown of Ongoing Charges Figures (OCF)6
Management Fee
0.35%Custody
Fee
0.01%Depositary
Fee
0.01%Other Fees
0.00%0.37%OCF
(As of 31 March 2021)
£914mSize of Fund7
RAG Rating
1 Quality of service
2 Performance
4
Comparable market rates
6 Comparable services
3 Costs
5
Economies of scale
7 Classes of shares
Seven Criteria
We concluded the fund provided value as six of the seven criteria were rated green, with a short-term dip in performance in the final quarter of 2020 leading to marginal underperformance to the fund’s comparator over three years.
Conclusion
Overall Rating
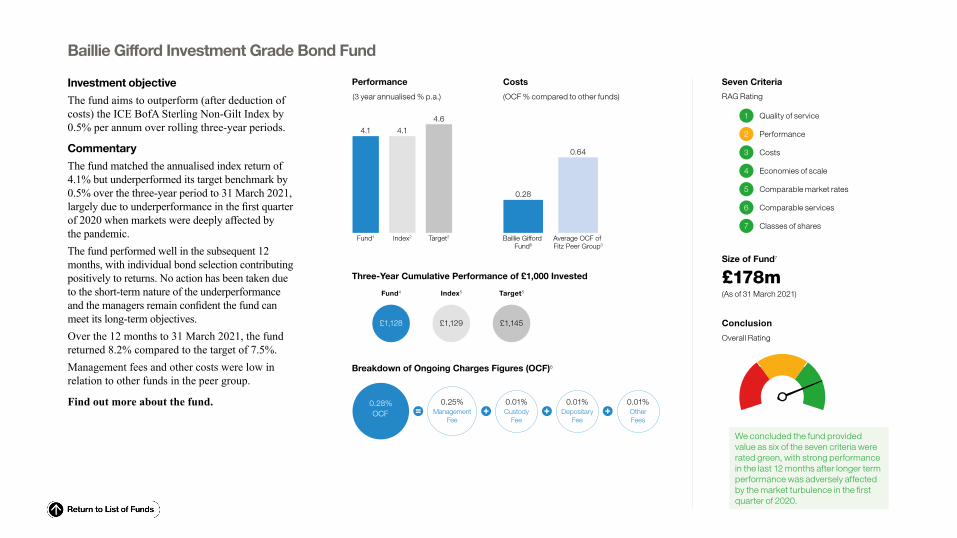
Baillie Gifford Investment Grade Bond Fund
Investment objective
The fund aims to outperform (after deduction of costs) the ICE BofA Sterling Non-Gilt Index by 0.5% per annum over rolling three-year periods.
Commentary
The fund matched the annualised index return of 4.1% but underperformed its target benchmark by 0.5% over the three-year period to 31 March 2021, largely due to underperformance in the first quarter of 2020 when markets were deeply affected by the pandemic. The fund performed well in the subsequent 12 months, with individual bond selection contributing positively to returns. No action has been taken due to the short-term nature of the underperformance and the managers remain confident the fund can meet its long-term objectives. Over the 12 months to 31 March 2021, the fund returned 8.2% compared to the target of 7.5%.Management fees and other costs were low in relation to other funds in the peer group.
Find out more about the fund.
Average OCF of Fitz Peer Group3
Baillie Gifford Fund6
Target2Index2Fund1
(3 year annualised % p.a.)
Performance
(OCF % compared to other funds)
Costs
0.28
0.64
4.1 4.14.6
Three-Year Cumulative Performance of £1,000 Invested
Fund4 Index5 Target5
£1,128 £1,129 £1,145
Breakdown of Ongoing Charges Figures (OCF)6
Management Fee
0.25%Custody
Fee
0.01%Depositary
Fee
0.01%Other Fees
0.01%0.28%OCF
RAG Rating
1 Quality of service
2 Performance
4
Comparable market rates
6 Comparable services
3 Costs
5
Economies of scale
7 Classes of shares
Seven Criteria
(As of 31 March 2021)
£178mSize of Fund7
We concluded the fund provided value as six of the seven criteria were rated green, with strong performance in the last 12 months after longer term performance was adversely affected by the market turbulence in the first quarter of 2020.
Conclusion
Overall Rating

Baillie Gifford Investment Grade Long Bond Fund
Investment objective
The fund aims to outperform (after deduction of costs) the ICE BofA Sterling Non-Gilt over 10 Years Index by 0.5% per annum over rolling three-year periods.
Commentary
Over three years to 31 March 2021, the fund matched the annualised index return of 5.7% but underperformed its target benchmark by 0.5%. The fund modestly underperformed in the first quarter of 2020 when markets were deeply affected by the coronavirus pandemic. Subsequently, corporate bonds recovered strongly, and the fund lagged the market due to being positioned in expectation of further volatility. Prior to this, the fund performed in line with expectations, with individual bond selection contributing positively to returns. No action has been taken due to the short-term nature of the underperformance and the managers remain confident the fund can meet its long-term objectives.The fund returned 8.3% over the 12 months to 31 March 2021 compared to the index return of 8.6% and the target benchmark return of 9.1%. Management fees and other costs were low in relation to the peer group.
Find out more about the fund.
Average OCF of Fitz Peer Group3
Baillie Gifford Fund6
Target2Index2Fund1
(3 year annualised % p.a.)
Performance
(OCF % compared to other funds)
Costs
0.28
0.64
5.7 5.76.2
Three-Year Cumulative Performance of £1,000 Invested
Target5Fund4 Index5
£1,197£1,180 £1,180
Breakdown of Ongoing Charges Figures (OCF)6
Management Fee
0.25%Custody
Fee
0.01%Depositary
Fee
0.01%Other Fees
0.01%0.28%OCF
RAG Rating
1 Quality of service
2 Performance
4
Comparable market rates
6 Comparable services
3 Costs
5
Economies of scale
7 Classes of shares
Seven Criteria
(As of 31 March 2021)
£199mSize of Fund7
We concluded the fund provided value as six of the seven criteria were rated green, with longer term performance adversely affected by the fund’s defensive position in late 2020 meaning it lagged the market in the subsequent recovery from the pandemic.
Conclusion
Overall Rating
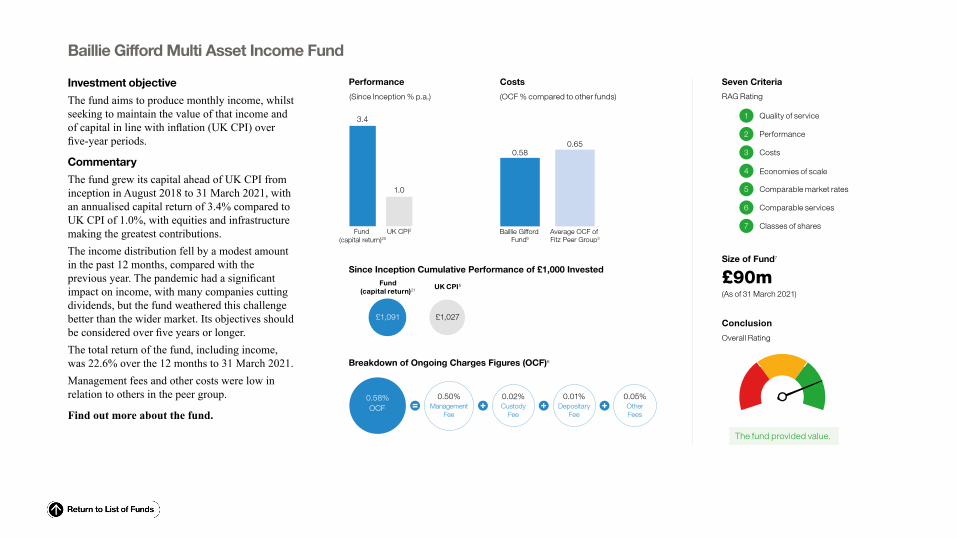
Baillie Gifford Multi Asset Income Fund
Investment objective
The fund aims to produce monthly income, whilst seeking to maintain the value of that income and of capital in line with inflation (UK CPI) over five-year periods.
Commentary
The fund grew its capital ahead of UK CPI from inception in August 2018 to 31 March 2021, with an annualised capital return of 3.4% compared to UK CPI of 1.0%, with equities and infrastructure making the greatest contributions. The income distribution fell by a modest amount in the past 12 months, compared with the previous year. The pandemic had a significant impact on income, with many companies cutting dividends, but the fund weathered this challenge better than the wider market. Its objectives should be considered over five years or longer. The total return of the fund, including income, was 22.6% over the 12 months to 31 March 2021.Management fees and other costs were low in relation to others in the peer group.
Find out more about the fund.
Average OCF of Fitz Peer Group3
Baillie Gifford Fund6
UK CPI2Fund (capital return)20
(Since Inception % p.a.)
Performance
(OCF % compared to other funds)
Costs
0.580.65
3.4
1.0
Since Inception Cumulative Performance of £1,000 InvestedFund
(capital return)21 UK CPI5
£1,091 £1,027
Breakdown of Ongoing Charges Figures (OCF)6
Management Fee
0.50%Custody
Fee
0.02%Depositary
Fee
0.01%Other Fees
0.05%0.58%OCF
RAG Rating
1 Quality of service
2 Performance
4
Comparable market rates
6 Comparable services
3 Costs
5
Economies of scale
7 Classes of shares
Seven Criteria
(As of 31 March 2021)
£90mSize of Fund7
The fund provided value.
Conclusion
Overall Rating
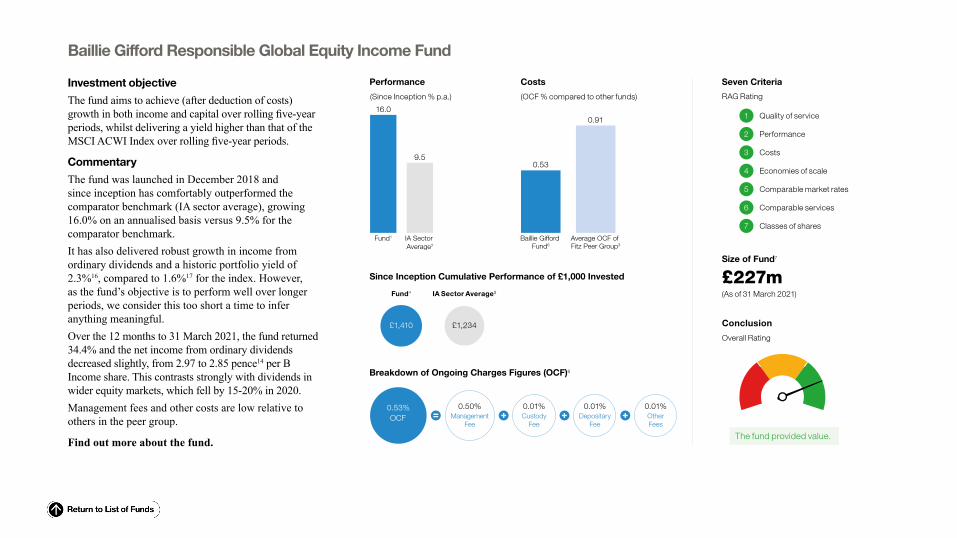
Baillie Gifford Responsible Global Equity Income Fund
Investment objective
The fund aims to achieve (after deduction of costs) growth in both income and capital over rolling five-year periods, whilst delivering a yield higher than that of the MSCI ACWI Index over rolling five-year periods.
Commentary
The fund was launched in December 2018 and since inception has comfortably outperformed the comparator benchmark (IA sector average), growing 16.0% on an annualised basis versus 9.5% for the comparator benchmark.It has also delivered robust growth in income from ordinary dividends and a historic portfolio yield of 2.3%16, compared to 1.6%17 for the index. However, as the fund’s objective is to perform well over longer periods, we consider this too short a time to infer anything meaningful. Over the 12 months to 31 March 2021, the fund returned 34.4% and the net income from ordinary dividends decreased slightly, from 2.97 to 2.85 pence14 per B Income share. This contrasts strongly with dividends in wider equity markets, which fell by 15-20% in 2020.Management fees and other costs are low relative to others in the peer group.
Find out more about the fund.
Average OCF of Fitz Peer Group3
Baillie Gifford Fund6
IA Sector Average2
Fund1
(Since Inception % p.a.)
Performance
(OCF % compared to other funds)
Costs
0.53
0.9116.0
9.5
Since Inception Cumulative Performance of £1,000 Invested
Fund4 IA Sector Average5
£1,410 £1,234
Breakdown of Ongoing Charges Figures (OCF)6
Management Fee
0.50%Custody
Fee
0.01%Depositary
Fee
0.01%Other Fees
0.01%0.53%OCF
RAG Rating
1 Quality of service
2 Performance
4
Comparable market rates
6 Comparable services
3 Costs
5
Economies of scale
7 Classes of shares
Seven Criteria
(As of 31 March 2021)
£227mSize of Fund7
The fund provided value.
Conclusion
Overall Rating
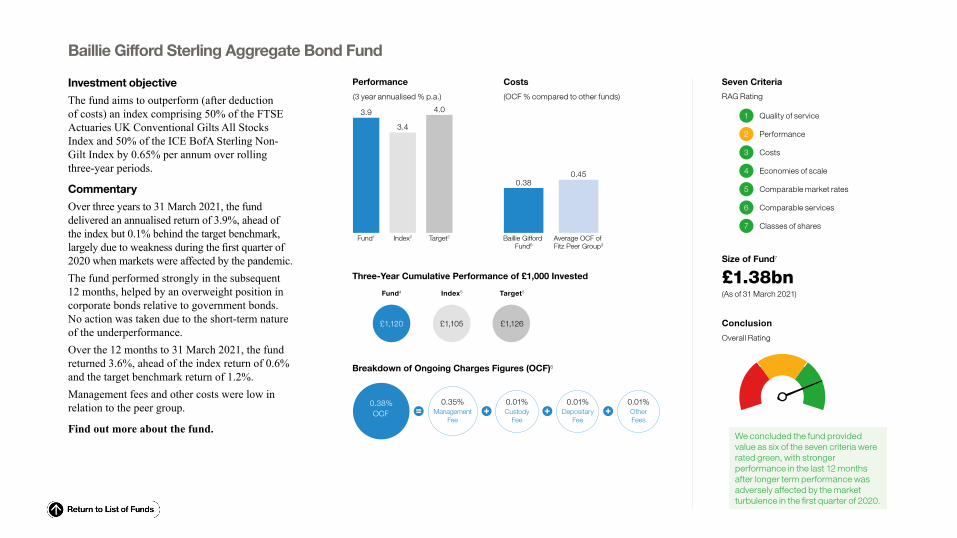
Baillie Gifford Sterling Aggregate Bond Fund
Investment objective
The fund aims to outperform (after deduction of costs) an index comprising 50% of the FTSE Actuaries UK Conventional Gilts All Stocks Index and 50% of the ICE BofA Sterling Non-Gilt Index by 0.65% per annum over rolling three-year periods.
Commentary
Over three years to 31 March 2021, the fund delivered an annualised return of 3.9%, ahead of the index but 0.1% behind the target benchmark, largely due to weakness during the first quarter of 2020 when markets were affected by the pandemic. The fund performed strongly in the subsequent 12 months, helped by an overweight position in corporate bonds relative to government bonds. No action was taken due to the short-term nature of the underperformance.Over the 12 months to 31 March 2021, the fund returned 3.6%, ahead of the index return of 0.6% and the target benchmark return of 1.2%.Management fees and other costs were low in relation to the peer group.
Find out more about the fund.
Average OCF of Fitz Peer Group3
Baillie Gifford Fund6
Target2Index2Fund1
(3 year annualised % p.a.)
Performance
(OCF % compared to other funds)
Costs
0.380.45
3.9
3.4
4.0
Three-Year Cumulative Performance of £1,000 Invested
Fund4 Index5 Target5
£1,120 £1,105 £1,126
Breakdown of Ongoing Charges Figures (OCF)6
Management Fee
0.35%Custody
Fee
0.01%Depositary
Fee
0.01%Other Fees
0.01%0.38%OCF
RAG Rating
1 Quality of service
2 Performance
4
Comparable market rates
6 Comparable services
3 Costs
5
Economies of scale
7 Classes of shares
Seven Criteria
(As of 31 March 2021)
£1.38bnSize of Fund7
We concluded the fund provided value as six of the seven criteria were rated green, with stronger performance in the last 12 months after longer term performance was adversely affected by the market turbulence in the first quarter of 2020.
Conclusion
Overall Rating
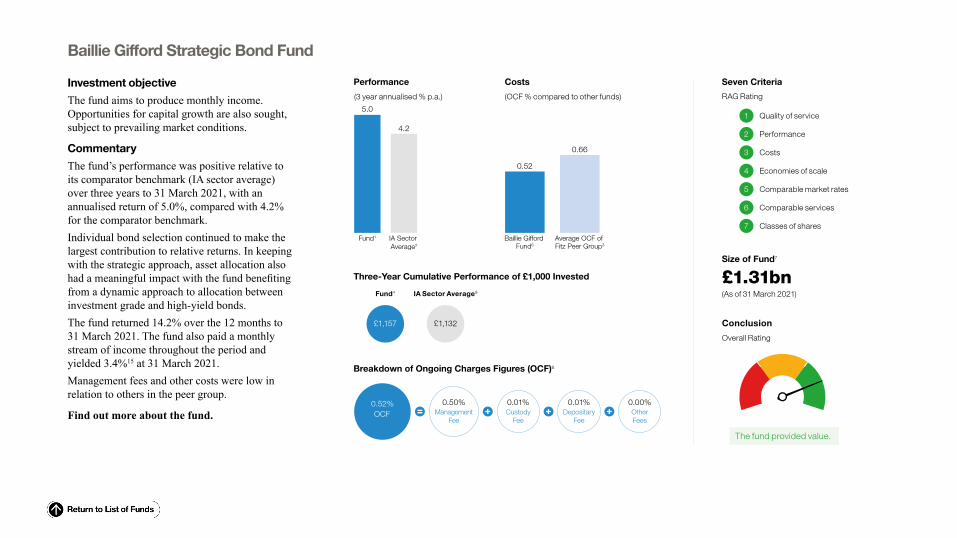
Baillie Gifford Strategic Bond Fund
Investment objective
The fund aims to produce monthly income. Opportunities for capital growth are also sought, subject to prevailing market conditions.
Commentary
The fund’s performance was positive relative to its comparator benchmark (IA sector average) over three years to 31 March 2021, with an annualised return of 5.0%, compared with 4.2% for the comparator benchmark.Individual bond selection continued to make the largest contribution to relative returns. In keeping with the strategic approach, asset allocation also had a meaningful impact with the fund benefiting from a dynamic approach to allocation between investment grade and high-yield bonds. The fund returned 14.2% over the 12 months to 31 March 2021. The fund also paid a monthly stream of income throughout the period and yielded 3.4%15 at 31 March 2021.Management fees and other costs were low in relation to others in the peer group.
Find out more about the fund.
Average OCF of Fitz Peer Group3
Baillie Gifford Fund6
IA Sector Average2
Fund1
(3 year annualised % p.a.)
Performance
(OCF % compared to other funds)
Costs
0.52
0.66
5.0
4.2
Three-Year Cumulative Performance of £1,000 Invested
Fund4 IA Sector Average5
£1,157 £1,132
Breakdown of Ongoing Charges Figures (OCF)6
Management Fee
0.50%Custody
Fee
0.01%Depositary
Fee
0.01%Other Fees
0.00%0.52%OCF
RAG Rating
1 Quality of service
2 Performance
4
Comparable market rates
6 Comparable services
3 Costs
5
Economies of scale
7 Classes of shares
Seven Criteria
(As of 31 March 2021)
£1.31bnSize of Fund7
The fund provided value.
Conclusion
Overall Rating

Baillie Gifford Diversified Growth Fund
Our Balanced and Multi Asset Funds
Investment objective
The fund aims to achieve (after deduction of costs): an annualised return over rolling five-year periods that is at least 3.5% more than UK Base Rate; a positive return over rolling three-year periods; annualised volatility of returns over rolling five-year periods that is below 10%. There is no guarantee that a positive return will be achieved over rolling three-year periods, or any time period, and capital may be at risk.
Commentary
Over five years, the fund delivered an annualised return of 4.4% (after deduction of costs), which is ahead of the return objective of 3.9%. It has done so with an annualised delivered volatility of returns of 6.7%18, within the volatility objective for the fund. A positive return has also been delivered over the past three years. While longer-term performance was adversely affected by market turbulence in the first three months of 2020, the subsequent recovery in fund performance was very good. For the 12 months to 31 March 2021, the fund returned 17.5%. Management fees and other costs were low in relation to others in the peer group.
Find out more about the fund.
Average OCF of Fitz Peer Group3
Baillie Gifford Fund6
Target2UK Base Rate2
Fund1
(5 year annualised % p.a.)
Performance
(OCF % compared to other funds)
Costs
0.75
0.99
4.4
0.4
3.9
Five-Year Cumulative Performance of £1,000 Invested
Fund4 UK Base Rate5 Target5
£1,240 £1,022 £1,213
Breakdown of Ongoing Charges Figures (OCF)6
Management Fee
0.65%Custody
Fee
0.01%Depositary
Fee
0.01%Other Fees
0.08%0.75%OCF
RAG Rating
1 Quality of service
2 Performance
4
Comparable market rates
6 Comparable services
3 Costs
5
Economies of scale
7 Classes of shares
Seven Criteria
(As of 31 March 2021)
£6.13bnSize of Fund7
The fund provided value.
Conclusion
Overall Rating

Baillie Gifford Managed Fund
Investment objective
The fund aims to achieve capital growth over rolling five-year periods.
Commentary
Over five years to end March 2021, the fund’s performance was well ahead of the comparator benchmark (IA sector median), net of fees, with an annualised return of 15.6% versus 7.7%. Holdings in Tesla, Amazon, Shopify, MarketAxess and Ashtead performed well. Fixed income holdings also had a positive impact. The fund returned 47.9% over the 12 months to 31 March 2021.The management fees and other costs applied to the fund were low in relation to others in the peer group.
Find out more about the fund.
Average OCF of Fitz Peer Group3
Baillie Gifford Fund6
IA Sector Median2
Fund1
(5 year annualised % p.a.)
Performance
(OCF % compared to other funds)
Costs
0.42
0.65
15.6
7.7
Five-Year Cumulative Performance of £1,000 Invested
Fund4 IA Sector Median5
£2,067 £1,452
Breakdown of Ongoing Charges Figures (OCF)6
Management Fee
0.40%Custody
Fee
0.01%Depositary
Fee
0.01%Other Fees
0.00%0.42%OCF
RAG Rating
1 Quality of service
2 Performance
4
Comparable market rates
6 Comparable services
3 Costs
5
Economies of scale
7 Classes of shares
Seven Criteria
(As of 31 March 2021)
£7.88bnSize of Fund7
The fund provided value.
Conclusion
Overall Rating

Baillie Gifford Multi Asset Growth Fund
Investment objective
The fund aims to achieve (after deduction of costs): an annualised return over rolling five-year periods that is 3.5% more than UK Base Rate; a positive return over rolling three-year periods; annualised volatility of returns over rolling five-year periods that is below 10%. There is no guarantee that a positive return will be achieved over rolling three-year periods, or any time period, and capital may be at risk.
Commentary
Over five years, the fund delivered an annualised return of 5.2% (after deduction of costs), which is ahead of the return objective of 3.9%. It has done so with an annualised delivered volatility of returns of 6.7%18, within the fund’s volatility objective. A positive return has also been delivered over the last three years. While longer-term performance was adversely affected by market turbulence in the first three months of 2020, the subsequent recovery in performance was very good. Over the 12 months to 31 March 2021, the fund returned 18.9%.Management fees and other costs were low in relation to others in the peer group.
Find out more about the fund.
Average OCF of Fitz Peer Group3
Baillie Gifford Fund6
Target2UK Base Rate2
Fund1
(5 year annualised % p.a.)
Performance
(OCF % compared to other funds)
Costs
0.58
0.99
5.2
0.4
3.9
Five Year Cumulative Performance of £1,000 Invested
Fund4 UK Base Rate5 Target5
£1,286 £1,022 £1,213
Breakdown of Ongoing Charges Figures (OCF)6
Management Fee
0.50%Custody
Fee
0.01%Depositary
Fee
0.01%Other Fees
0.06%0.58%OCF
RAG Rating
1 Quality of service
2 Performance
4
Comparable market rates
6 Comparable services
3 Costs
5
Economies of scale
7 Classes of shares
Seven Criteria
(As of 31 March 2021)
£2.26bnSize of Fund7
The fund provided value.
Conclusion
Overall Rating

Baillie Gifford Multi Asset Growth Feeder Fund
Investment objective
The fund, through investing as a feeder fund in Baillie Gifford Multi Asset Growth Fund (the master fund), aims to achieve (after deduction of costs): an annualised return over rolling five-year periods that is 3% more than UK Base Rate; a positive return over rolling three-year periods; annualised volatility of returns over rolling five-year periods that is below 10%. There is no guarantee that a positive return will be achieved over rolling three-year periods, or any time period, and capital may be at risk.
Commentary
The fund launched in July 2020 and has returned 5.7%, which is ahead of the return objective of 2.1%. As this is a new fund, we believe that an informative timeframe over which to measure investment performance is five years. However, this fund is a ‘feeder’ fund and invests solely in Baillie Gifford Multi Asset Growth Fund.
(As of 31 March 2021)
£4.2kSize of Fund7
Target2UK Base Rate2
Fund1
(Since Inception % p.a.)
Performance
5.7
0.1
2.1
Average OCF of Fitz Peer Group3
Baillie Gifford Fund6
(OCF % compared to other funds)
Costs
0.88
0.99
RAG Rating
1 Quality of service
4
Comparable market rates
6 Comparable services
3 Costs
5
Economies of scale
7 Classes of shares
Seven Criteria
2 Performance (n/a – new fund)
Since Inception Cumulative Performance of £1,000 Invested
Fund4 UK Base Rate5 Target5
£1,057 £1,001 £1,021
The fund provided value.
Conclusion
Overall Rating
Breakdown of Ongoing Charges Figures (OCF)6
Management Fee
0.50%Custody
Fee
0.00%Depositary
Fee
0.01%Other Fees19
0.37%0.88%OCF
This is a new fund and currently has no external investors.
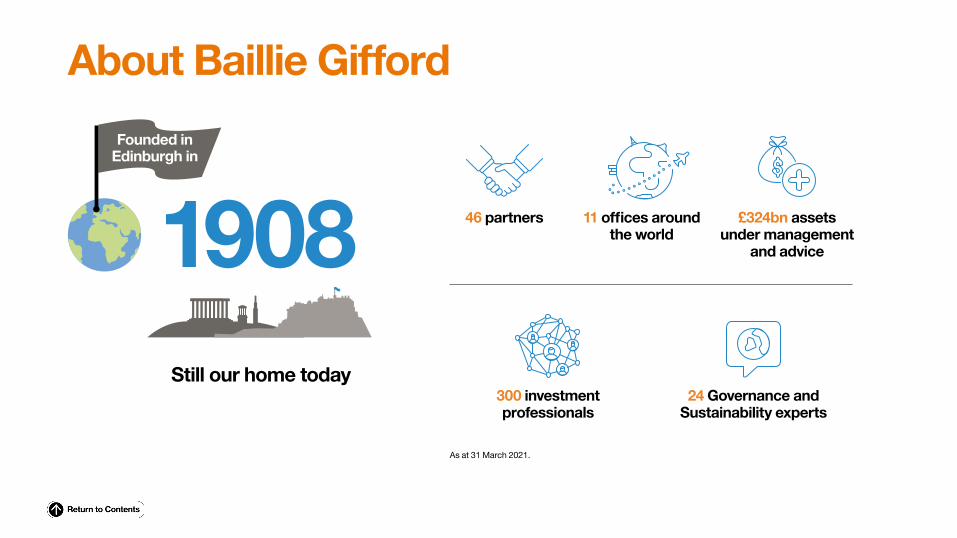
Still our home today
1908
As at 31 March 2021.
About Baillie Gifford
Founded in Edinburgh in
46 partners £324bn assets under management
and advice
11 offices around the world
300 investment professionals
24 Governance and Sustainability experts

Directors of Baillie Gifford & Co Limited
Executive
M J C Wylie (Chairman)E DelaneyC M FraserL B S HaddowD S McGowanA J Telfer
Independent Non-Executive
K B M BolsoverD R Buckley
Important informationPlease remember investment markets can go down as well as up and market conditions can change rapidly. The value of an investment in a fund, and any income from it, can fall as well as rise and you may not get back the amount invested. Further details of the risks associated with investing in a fund, performance history and the full investment objective and policy can be found in the Prospectus, Key Investor Information Document (KIID) and Report and Accounts, which are available by contacting Client Relations or visiting our website.
Contact us at: Client Relations Team, Baillie Gifford & Co Limited, Calton Square, 1 Greenside Row, Edinburgh EH1 3AN
Call our Client Relations Team on 0800 917 2113. Your call may be recorded for training or monitoring purposes.
Visit our website at bailliegifford.com, or email us on [email protected]