valuation report of unicorn, inc
TRANSCRIPT

Valuation Report of Unicorn, Inc.
As of 2019-11-01
Report generated on 2 Mar, 2020
Contacts:
Unicorn Inc [email protected]
make it worth it with equidam.com

Unicorn, Inc. Valuation Report
3
4
5
6
7
8
9
10
11
12
13
14
15
17
18
Table of Contents
Company summary
Forecasts summary
Past funding rounds & Current ownership
Valuation
Current funding round
Use of funds
Qualitative methods
Scorecard Method
Checklist Method
Qualitative traits summary
VC method
DCF Methods
DCF with LTG
DCF with Multiples
Financial Projections
Conclusion
Appendix
/// 2make it worth it with equidam.com

Unicorn, Inc. Valuation Report
Company summaryUnicorn, Inc.
Schiedamse Vest 154, 3011 BH Rotterdam, the Netherlands
The Netherlands
Industry: Computer & Electronics Retailers
Business Activity: Consumer Electronics Retailers
Unicorn Inc produces the best quality single horn for horses. Our mission is to
transform the world and make it a better place.
www.unicorninc.com
Founders: 1
Employees: 5
Started in: 2016
Incorporated: Yes
Year of incorporation:
2017
Commited capital:
$7000
OpportunityBusiness model: B2B
Scalable Product: No
Exit strategy: Multiple exit opportunities
Current OperationsStage of development: Expansion stage
Employees (excluding founders, interns and freelancers): 5
Profitability: Yes
CompetitorsPony Inc | ponyinc.com
Hippo Inc | hippoinc.com
Latest operating performance
All numbers in $
/// More information on the history, milestones, team, etc., (e.g. pitchdeck) can be requested to the company.
11/2018 - 10/2019
-
-
-
-
-
-
Revenues 540,000
EBITDA 400,000
Ebitda margin 74 %
EBIT 400,000
Ebit margin 74 %
Cash in hand 100,000
/// 3make it worth it with equidam.com

Unicorn, Inc. Valuation Report
Forecasts summaryFuture profitability
Revenues Costs EBITDA
-1.0M
0.0
1.0M
2.0M
3.0M
4.0M
5.0M
$ 1,080,000 $ 1,795,600 $ 4,317,800
$ 198,000 $ 1,901,800 $ 2,846,000
$ 882,000 -$ 106,200 $ 1,471,800
11/2019 - 10/2020 11/2020 - 10/2021 11/2021 - 10/2022
Cash forecast Cash in hand Free cash flow to equity
-500.0K
0.0
500.0K
1.0M
1.5M
2.0M
2.5M
3.0M
$ 1,636,079 $ 1,609,800 $ 2,522,394
$ 536,079 -$ 226,279 $ 912,594
11/2019 - 10/2020 11/2020 - 10/2021 11/2021 - 10/2022
/// Full profit and loss and cash flow forecast at page 14.
/// 4make it worth it with equidam.com

Unicorn, Inc. Valuation Report
Past funding roundsHere is an overview of the past funding rounds and valuations of the company.
Date Amount raised % of Equity Post-Money Valuation
02-05-2018 $ 250,000 5.00% $ 2,000,000
Current ownershipHere is an overview of the current shareholders in the company. More information on type of shares, unassigned shares, and in
general a detailed cap table can be requested to the company in question.
84% Norman
11% Elon
5% UNI Incubator
/// 5make it worth it with equidam.com

Unicorn, Inc. Valuation Report
ValuationThe pre-money valuation displayed below is the result of the weighted average of different methods. The use of several
methods is a best practice in company valuation, as looking at the business from different perspectives results in a more
comprehensive and reliable view.
These methods are compliant with IPEV (International Private Equity Valuation) Guidelines and each of them will be explained
in more detail in the following pages of the report.
More information on the weights can be found in the Appendix.
Low Bound
$ 6,318,000
Pre-money valuation
$ 6,858,732High Bound
$ 7,400,000
5 Valuation Methods
$ 4,272,096 $ 5,981,916 $ 3,618,866 $ 8,519,033 $ 7,215,613Scorecard Checklist Venture Capital DCF with LTG DCF with Multiples
Method weights
6% 6% 16% 36% 36%
/// 6make it worth it with equidam.com
Unicorn, Inc. Valuation Report
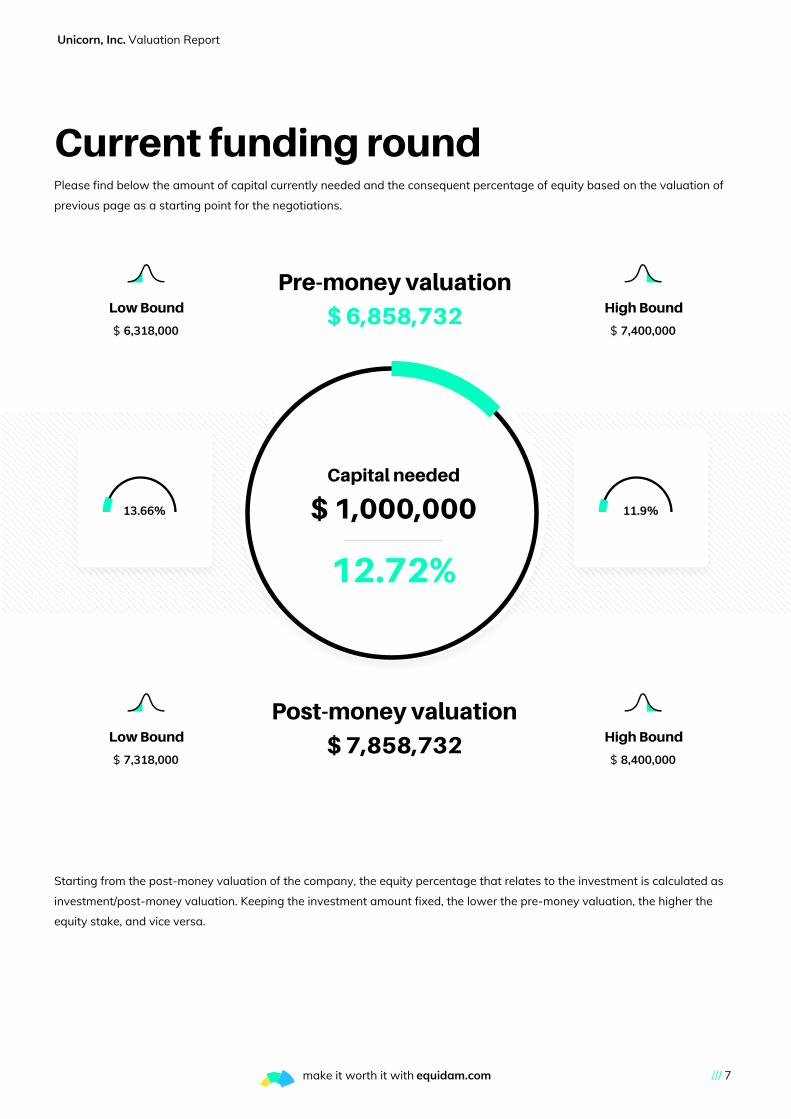
Current funding roundPlease find below the amount of capital currently needed and the consequent percentage of equity based on the valuation of
previous page as a starting point for the negotiations.
Pre-money valuation
$ 6,858,732
Post-money valuation
$ 7,858,732
Starting from the post-money valuation of the company, the equity percentage that relates to the investment is calculated as
investment/post-money valuation. Keeping the investment amount fixed, the lower the pre-money valuation, the higher the
equity stake, and vice versa.
Low Bound
$ 6,318,000
High Bound
$ 7,400,000
Low Bound
$ 7,318,000
High Bound
$ 8,400,000
/// 7make it worth it with equidam.com
13.66%
Capital needed
$ 1,000,000
12.72%
11.9%

Unicorn, Inc. Valuation Report
Use of fundsHere is a breakdown on how the company will use the capital raised.
Product and R&D:$ 600,000 (60 %)
Sales and marketing:$ 100,000 (10 %)
Inventory:$ 150,000 (15 %)
Operations:$ 100,000 (10 %)
Capital expenditures:$ 50,000 (5 %)
/// 8make it worth it with equidam.com
Unicorn, Inc. Valuation Report
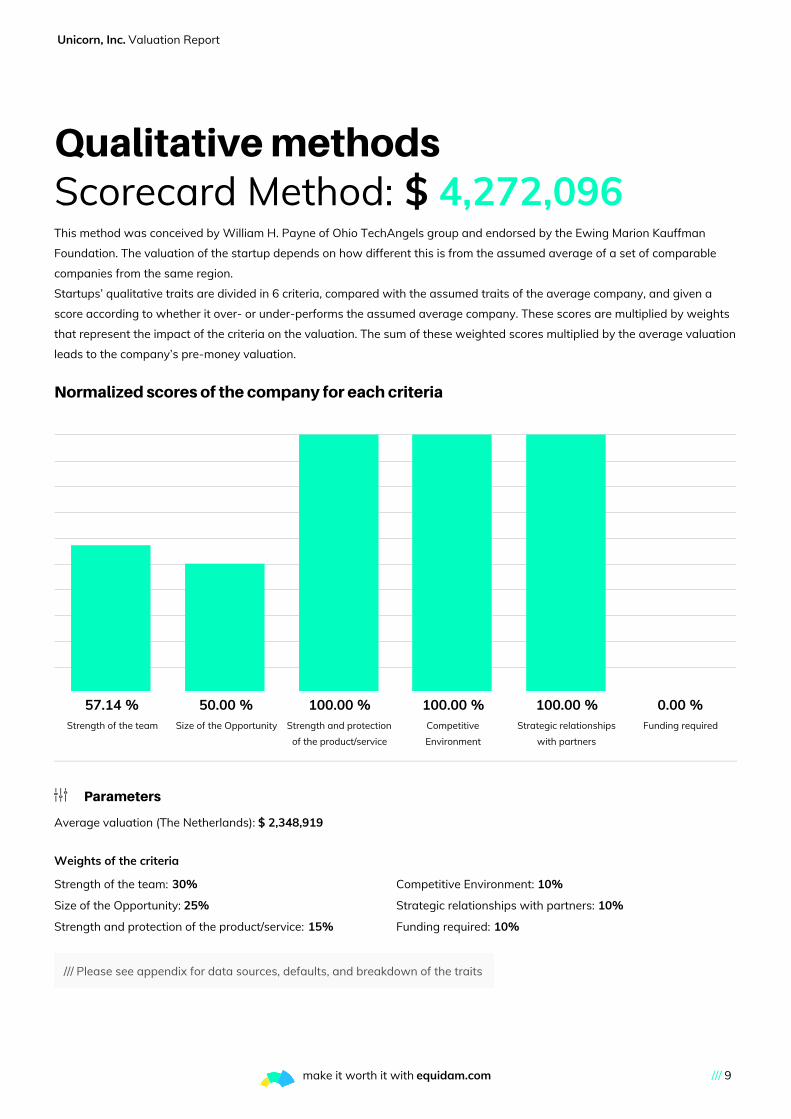
Qualitative methodsScorecard Method: $ 4,272,096This method was conceived by William H. Payne of Ohio TechAngels group and endorsed by the Ewing Marion Kauffman
Foundation. The valuation of the startup depends on how different this is from the assumed average of a set of comparable
companies from the same region.
Startups’ qualitative traits are divided in 6 criteria, compared with the assumed traits of the average company, and given a
score according to whether it over- or under-performs the assumed average company. These scores are multiplied by weights
that represent the impact of the criteria on the valuation. The sum of these weighted scores multiplied by the average valuation
leads to the company’s pre-money valuation.
Normalized scores of the company for each criteria
57.14 % 50.00 % 100.00 % 100.00 % 100.00 % 0.00 %Strength of the team Size of the Opportunity Strength and protection
of the product/service
Competitive
Environment
Strategic relationships
with partners
Funding required
Parameters
Average valuation (The Netherlands): $ 2,348,919
Weights of the criteria
Strength of the team: 30%
Size of the Opportunity: 25%
Strength and protection of the product/service: 15%
Competitive Environment: 10%
Strategic relationships with partners: 10%
Funding required: 10%
/// Please see appendix for data sources, defaults, and breakdown of the traits
/// 9make it worth it with equidam.com

Unicorn, Inc. Valuation Report Qualitative methods
Checklist Method: $ 5,981,916The creator of the method is Dave Berkus, one of the most prominent Californian angel investors. The valuation of the startup
consists of intangible building blocks that sum up to the assumed maximum pre-money valuation.
The maximum pre-money valuation is split in 5 criteria according to their weight. The startup obtains portions of these
maximum criteria valuations according to how close its qualitative traits are to the most desirable ones. Their sum is the startup
pre-money valuation.
Criteria valuations Max valuations
0.0
200.0K
400.0K
600.0K
800.0K
1.0M
1.2M
1.4M
1.6M
1.8M
2.0M
$ 1,659,722 $ 1,317,240 $ 987,930 $ 699,784 $ 1,317,240Quality of the core team Quality of the Idea Product roll-out and IP
protection
Strategic Relationships Operating Stage
Parameters
Maximum valuation (The Netherlands): $ 6,586,200
Criteria maximum valuations
Quality of the core team: $ 1,975,860 (30%)
Quality of the Idea: $ 1,317,240 (20%)
Product roll-out and IP protection: $ 987,930 (15%)
Strategic Relationships: $ 987,930 (15%)
Operating Stage: $ 1,317,240 (20%)
/// Please see appendix for data sources, defaults, and breakdown of the traits
/// 10make it worth it with equidam.com

Unicorn, Inc. Valuation Report Qualitative methods
Qualitative traits summaryBelow a summary of the traits at the basis of the scores for the two qualitative methods. Please see appendix for detailed
breakdown of which trait is used in which method.
TeamFounders
Time commitment: Planning to commit full time
Average age: Between 25 and 34
Founded other companies before: Yes, with successful exit(s)
Core team skills and expertise
Working together for: More than 5 years
Years of experience in the industry: 20
Business and managerial background: Top-tier management
experience
Technical skills: All technical skills inhouse
NetworkBoard of advisors: Yes
Legal consultants: Yes
Current shareholders: Incubator / accelerator, Business angel
MarketTotal Addressable Market (TAM): $ 1,000,000,000
Annual growth rate of the market: 1.00 %
Demand validated: Yes
Internationalization: Active globally
ProductProduct roll-out: Already to Market
Feedback received: All positive
Loyalty to the product/service: High retention
Partners: Contracts with key strategic partners signed and serving
high volumes
CompetitionLevel of competition: Negligible competition
Competitive products are: On the same level
Differentiation from current solutions: Not comparable solutions
International competition: Not yet developed
ProtectionBarriers to entry of the market: Modest
Applicable IP: Patent
Current IP protection: IP protection secured at global level
/// 11make it worth it with equidam.com
Unicorn, Inc. Valuation Report
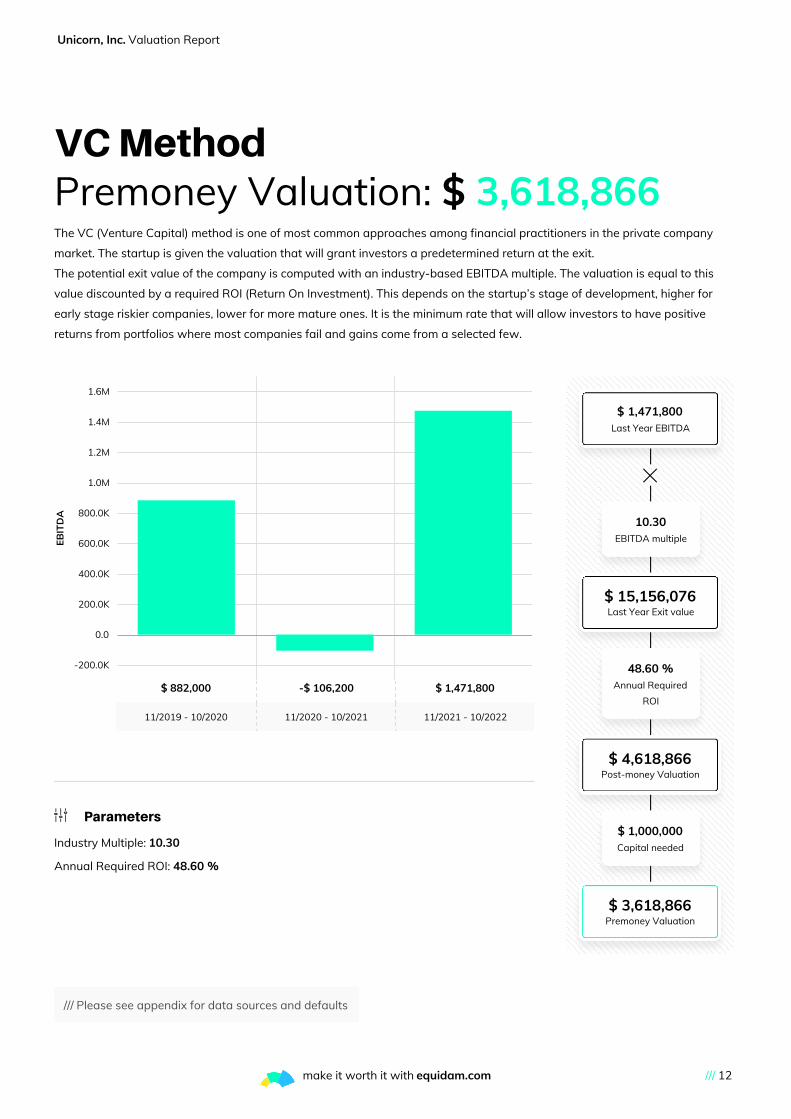
VC MethodPremoney Valuation: $ 3,618,866The VC (Venture Capital) method is one of most common approaches among financial practitioners in the private company
market. The startup is given the valuation that will grant investors a predetermined return at the exit.
The potential exit value of the company is computed with an industry-based EBITDA multiple. The valuation is equal to this
value discounted by a required ROI (Return On Investment). This depends on the startup’s stage of development, higher for
early stage riskier companies, lower for more mature ones. It is the minimum rate that will allow investors to have positive
returns from portfolios where most companies fail and gains come from a selected few.
-200.0K
0.0
200.0K
400.0K
600.0K
800.0K
1.0M
1.2M
1.4M
1.6M
EB
ITD
A
$ 882,000 -$ 106,200 $ 1,471,800
11/2019 - 10/2020 11/2020 - 10/2021 11/2021 - 10/2022
Parameters
Industry Multiple: 10.30
Annual Required ROI: 48.60 %
/// Please see appendix for data sources and defaults
$ 1,471,800Last Year EBITDA
10.30EBITDA multiple
$ 15,156,076Last Year Exit value
48.60 %Annual Required
ROI
$ 4,618,866Post-money Valuation
$ 1,000,000Capital needed
$ 3,618,866Premoney Valuation
/// 12make it worth it with equidam.com

Unicorn, Inc. Valuation Report
DCF MethodsThe DCF (Discounted Cash Flow) methods represent the most renown approach to company valuation, recommended by
academics and a daily tool for financial analysts. The valuation is the present value of all the free cash flows to equity the
startup is going to generate in the future, discounted by its risk.
These methods weight the projected free cash flow to equity by the probability the startup will survive. Then, the flows are
discounted to present by a rate that represents risks related to industry, size, development stage and profitability. Lastly, an
illiquidity discount is applied to the sum of the discounted cash flows to compute the valuation.
The value of cash flows beyond the projected ones is represented by the TV (Terminal Value) and the way it is calculated is the
difference between the following two methods.
DCF with LTG: $ 8,519,033The DCF with LTG (Long Term Growth) assumes the cash flows beyond the projected ones will grow forever at a constant rate
based on the industry and computes the TV accordingly.
-400.0K
-200.0K
0.0
200.0K
400.0K
600.0K
800.0K
1.0M
Free
ca
sh f
low
to
eq
uit
y
$ 536,079 -$ 226,279 $ 912,594
11/2019 - 10/2020 11/2020 - 10/2021 11/2021 - 10/2022
Parameters Long term growth: 2.50 %
Illiquidity discount: 27.30 %
Discount rate
Risk free rate: -0.13 %
Beta: 1.50
Market Risk Premium: 5.20 %
Survival rates
Year 1: 86.99 %
Year 2: 80.64 %
Year 3: 74.92 %
/// Please see appendix for data sources and defaults
$ 912,594Last year FCF to equity
2.50 %Long term growth
$ 13,592,520Terminal value
7.66 %Discount rate
27.30 %Illiquidity discount
$ 8,519,033Premoney Valuation
/// 13make it worth it with equidam.com

Unicorn, Inc. Valuation Report DCF Methods
DCF with Multiples: $ 7,215,613The DCF with Multiple assumes the TV (Terminal Value) is equal to the exit value of the company computed with an industry-
based EBITDA multiple.
Free cash flow to equity EBITDA
-300.0K
0.0
300.0K
600.0K
900.0K
1.2M
1.5M
$ 536,079 -$ 226,279 $ 912,594
$ 882,000 -$ 106,200 $ 1,471,800
11/2019 - 10/2020 11/2020 - 10/2021 11/2021 - 10/2022
Parameters EBITDA multiple: 10.30
Illiquidity discount: 27.30 %
Discount rate
Risk free rate: -0.13 %
Beta: 1.50
Market Risk Premium: 5.20 %
Survival rates
Year 1: 86.99 %
Year 2: 80.64 %
Year 3: 74.92 %
/// Please see appendix for data sources and defaults
$ 1,471,800Last Year EBITDA
10.30EBITDA multiple
$ 11,355,595Terminal value
7.66 %Discount rate
27.30 %Illiquidity discount
$ 7,215,613Premoney Valuation
/// 14make it worth it with equidam.com

Unicorn, Inc. Valuation Report Financial Projections
Financial ProjectionsProfit & LossThe profit & loss projections are displayed below. Data about revenues and operating costs are provided by the company.
Depreciation and amortization, interest, and taxes are either provided by the company or estimated by Equidam. Please consult
our methodology document for more details.
All numbers in $
11-2018 - 10-2019 11-2019 - 10-2020 11-2020 - 10-2021 11-2021 - 10-2022
+2X +66% +2X
+40% +3X +2X
+20% +13X +29%
+3X +7X +2X
+2X - -
- - -
- -83% +2X
-24% - -
- - -
- -98% -
- - -
- - -
- - -
- - -
- - -
-76% - -
- - -
Revenues 540,000 1,080,000 1,795,600 4,317,800
Cost of Goods Sold 20,000 28,000 76,800 189,000
Salaries 100,000 120,000 1,500,000 1,928,000
Operating Expenses 20,000 50,000 325,000 729,000
EBITDA 400,000 882,000 -106,200 1,471,800
Ebitda margin 74 % 81 % - 34 %
D&A - 579,245 96,333 232,184
EBIT 400,000 302,755 -202,533 1,239,616
Ebit margin 74 % 28 % - 28 %
Interest - 2,396 41 -
EBT - 300,359 -202,574 1,239,616
Taxes - 205,413 - 261,756
Nominal tax rate - 25 % 25 % 25 %
Effective tax payable - 75,090 -50,644 309,904
Deferred tax assets - 130,323 180,967 132,819
Net profit 400,000 94,946 -202,574 977,860
Net profit margin 74 % 8 % - 22 %
/// 15make it worth it with equidam.com

Unicorn, Inc. Valuation Report Financial Projections
Cash FlowThe cash flow projections are displayed below. Capital expenditure, debt at the end of the year, and equity fundraising are
provided by the company. Account payables, account receivables, inventory and D&A are either provided by the company or
estimated by Equidam based on the average percentage of revenues for public companies in the company's industry.
All numbers in $
11/2018 - 10/2019 11/2019 - 10/2020 11/2020 - 10/2021 11/2021 - 10/2022
-76% - -
- - -
- +66% +2X
- - -
- - -
- - -
- -83% +2X
+3X +33% +50%
- - -
-33% -50% -
- - -
- - -
- - -
- +49% -2%
- - -
Net profit 400,000 94,946 -202,574 977,860
Change in Working Capital - 90,612 60,038 212,450
Working capital - 90,612 150,650 363,100
Account Payables - 125,712 209,007 503,754
Account Receivables - 42,984 71,464 172,245
Inventory - 173,340 288,193 694,609
D&A - 579,245 96,333 232,184
Capital expenditures 12,500 37,500 50,000 75,000
Change in outstanding debt - -10,000 -10,000 -
Debt at the end of the year 30,000 20,000 10,000 -
Free cash flow to equity - 536,079 -226,279 912,594
Equity fundraising - - 200,000 -
Free cash flow - 536,079 -26,279 912,594
Beginning of the year cash - 1,100,000 1,636,079 1,609,800
End of the year cash - 1,636,079 1,609,800 2,522,394
/// 16make it worth it with equidam.com

Unicorn, Inc. Valuation Report
ConclusionLegal NotesEquidam Valuation SL does not represent or endorse the accuracy or reliability of any advice, opinion, statement or any other
information displayed or distributed through this report or its website. The estimates and the data contained herein are made
using the information provided by the user, publicly available information and data for different industries. Equidam Valuation
SL has not audited or attempted to confirm this information for accuracy or completeness.
Under no circumstances the present report is to be used or considered as an offer, solicitation, or recommendation to sell, or a
solicitation of any offer to buy any security. Equidam Valuation SL excludes any warranties and responsibilities concerning the
results to be obtained from the present report nor their use and shall not be liable for any claims, losses or damages arising
from or occasioned by any inaccuracy, error, delay, or omission, or from use of the report or actions taken in reliance on the
information contained in it. The use of this report and the information provided herein is subject to Equidam Valuation SL online
Terms of Use [https://www.equidam.com/term-of-use/ [https://www.equidam.com/term-of-use/] ] and Privacy Policy
[https://www.equidam.com/privacy-policy/ [https://www.equidam.com/privacy-policy/] ].
/// 17make it worth it with equidam.com

Unicorn, Inc. Valuation Report
AppendixWeights of the methodsThe default weight of each method is determined by Equidam based on the stage of development, and they are shown below.
They can be manually adjusted by the company.
Default weights of the 5 methods
Stage of development Checklist Method Scorecard Method VC Method DCF with LTG DCF with Multiples
Idea stage 38% 38% 16% 4% 4%
Development stage 30% 30% 16% 12% 12%
Startup stage 15% 15% 16% 27% 27%
Expansion stage 6% 6% 16% 36% 36%
Unicorn, Inc. stage of development: Expansion stage
These are determined according to the following principles:
• Qualitative information is more important in early stage companies, where performance uncertainty is extremely high, so
qualitative methods are weighted in more
• The investors' view is equally important across all stages, so the weight of the VC method does not change
• Quantitative information is more reliable in later stages, when a company already has a proven financial track record.
Therefore, it is possible to use the DCF methods more extensively as projected results get founded in past performance
/// 18make it worth it with equidam.com
Unicorn, Inc. Valuation Report Appendix
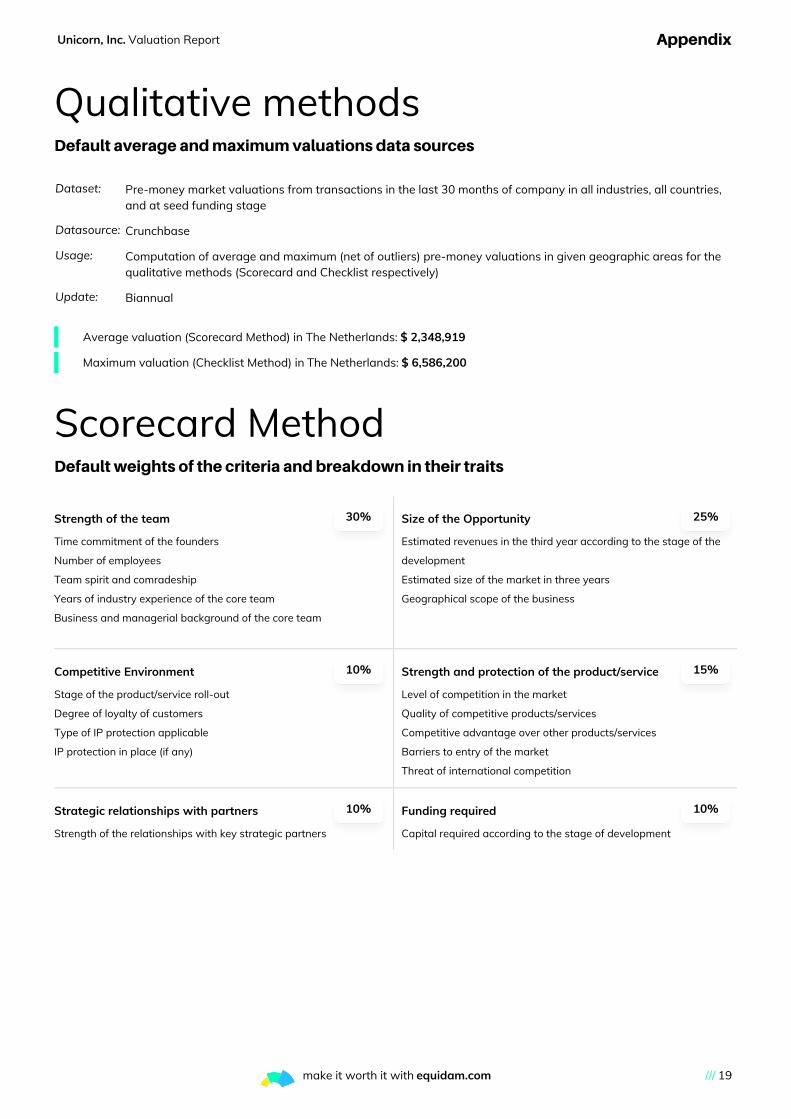
Qualitative methodsDefault average and maximum valuations data sources
Dataset: Pre-money market valuations from transactions in the last 30 months of company in all industries, all countries,and at seed funding stage
Datasource: Crunchbase
Usage: Computation of average and maximum (net of outliers) pre-money valuations in given geographic areas for thequalitative methods (Scorecard and Checklist respectively)
Update: Biannual
Average valuation (Scorecard Method) in The Netherlands: $ 2,348,919
Maximum valuation (Checklist Method) in The Netherlands: $ 6,586,200
Scorecard MethodDefault weights of the criteria and breakdown in their traits
Strength of the team 30%
Time commitment of the founders
Number of employees
Team spirit and comradeship
Years of industry experience of the core team
Business and managerial background of the core team
Size of the Opportunity 25%
Estimated revenues in the third year according to the stage of the
development
Estimated size of the market in three years
Geographical scope of the business
Competitive Environment 10%
Stage of the product/service roll-out
Degree of loyalty of customers
Type of IP protection applicable
IP protection in place (if any)
Strength and protection of the product/service 15%
Level of competition in the market
Quality of competitive products/services
Competitive advantage over other products/services
Barriers to entry of the market
Threat of international competition
Strategic relationships with partners 10%
Strength of the relationships with key strategic partners
Funding required 10%
Capital required according to the stage of development
/// 19make it worth it with equidam.com
Unicorn, Inc. Valuation Report Appendix
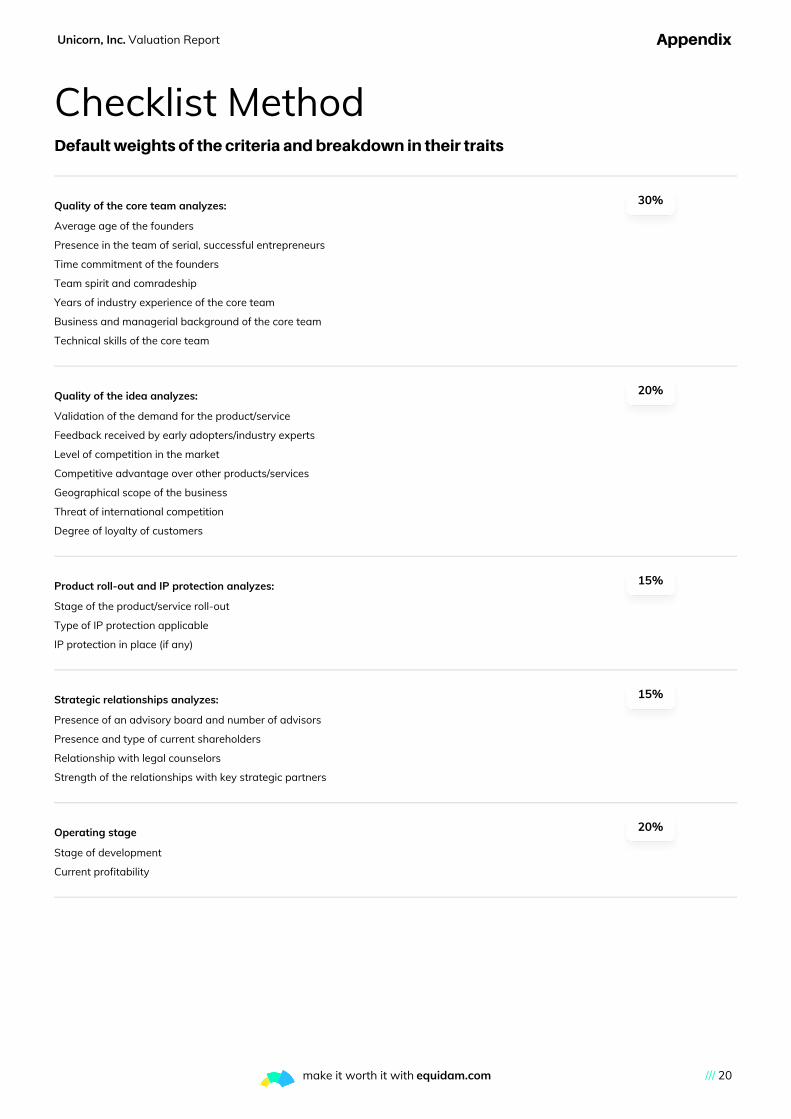
Checklist MethodDefault weights of the criteria and breakdown in their traits
Quality of the core team analyzes:
30%
Average age of the founders
Presence in the team of serial, successful entrepreneurs
Time commitment of the founders
Team spirit and comradeship
Years of industry experience of the core team
Business and managerial background of the core team
Technical skills of the core team
Quality of the idea analyzes:
20%
Validation of the demand for the product/service
Feedback received by early adopters/industry experts
Level of competition in the market
Competitive advantage over other products/services
Geographical scope of the business
Threat of international competition
Degree of loyalty of customers
Product roll-out and IP protection analyzes:
15%
Stage of the product/service roll-out
Type of IP protection applicable
IP protection in place (if any)
Strategic relationships analyzes:
15%
Presence of an advisory board and number of advisors
Presence and type of current shareholders
Relationship with legal counselors
Strength of the relationships with key strategic partners
Operating stage
20%
Stage of development
Current profitability
/// 20make it worth it with equidam.com

Unicorn, Inc. Valuation Report Appendix
VC methodBelow the sources of the valuation parameters used in the VC Method: EBITDA Multiple and Annual Required ROI, and their
default values provided by Equidam
EBITDA multiple
Description: Enterprise value on EBITDA multiples computed over a dataset of global, publicly listed firms organized byindustry
Datasource: Prof. A. Damodaran, NYU Stern School of Busines
Update: Annual
Notes: We favor the use of EBITDA multiple, as we believe revenue multiples fail to capture the ability of startups togenerate cash flow, i.e. the ultimate determinant of value.
Unicorn, Inc. industry: Consumer Electronics Retailers
Consumer Electronics Retailers EBITDA multiple: 10.30
Annual Required ROI
The default annual required ROI rates are determined by Equidam based on the returns investors require for companies at
different stage of development, and are shown below. They can be manually adjusted by the company.
Stage of development Discount/Required ROI
Idea stage 135.93%
Development stage 111.47%
Startup stage 89.12%
Expansion stage 48.60%
Unicorn, Inc. stage of development: Expansion stage
/// 21make it worth it with equidam.com

Unicorn, Inc. Valuation Report Appendix
DCF MethodsBelow the sources of the valuation parameters used in the DCF Methods: Discount Rate, Survival Rates and Illiquidity
Discounts, and their default values provided by Equidam.
Discount rate
Risk Free Rate
Description: 10Y government rates
Datasource: Trading Economics (tradingeconomics.com), various public databases
Update: Bi-annual (but more frequent if macroeconomic conditions are more volatile)
Notes: For the Eurozone we apply the German 10Y Bond rate
Unicorn, Inc. country: The Netherlands
The Netherlands risk free rate: -0.13%
Industry betas
Description: Industry beta computed over industry specific portfolios of global, public listed companies (same as in EBITDAmultiple)
Datasource: Prof. A. Damodaran, NYU Stern School of Business
Update: Annual
Unicorn, Inc. industry: Consumer Electronics Retailers
Consumer Electronics Retailers default beta: 1.50
Market Risk Premium
Description: Country based total equity risk premium as implied in the previous 12 trailing months.
Datasource: Prof. A. Damodaran, NYU Stern School of Business
Update: Biannual
Unicorn, Inc. country: The Netherlands
The Netherlands default market risk premium: 5.20%
/// 22make it worth it with equidam.com
Unicorn, Inc. Valuation Report Appendix
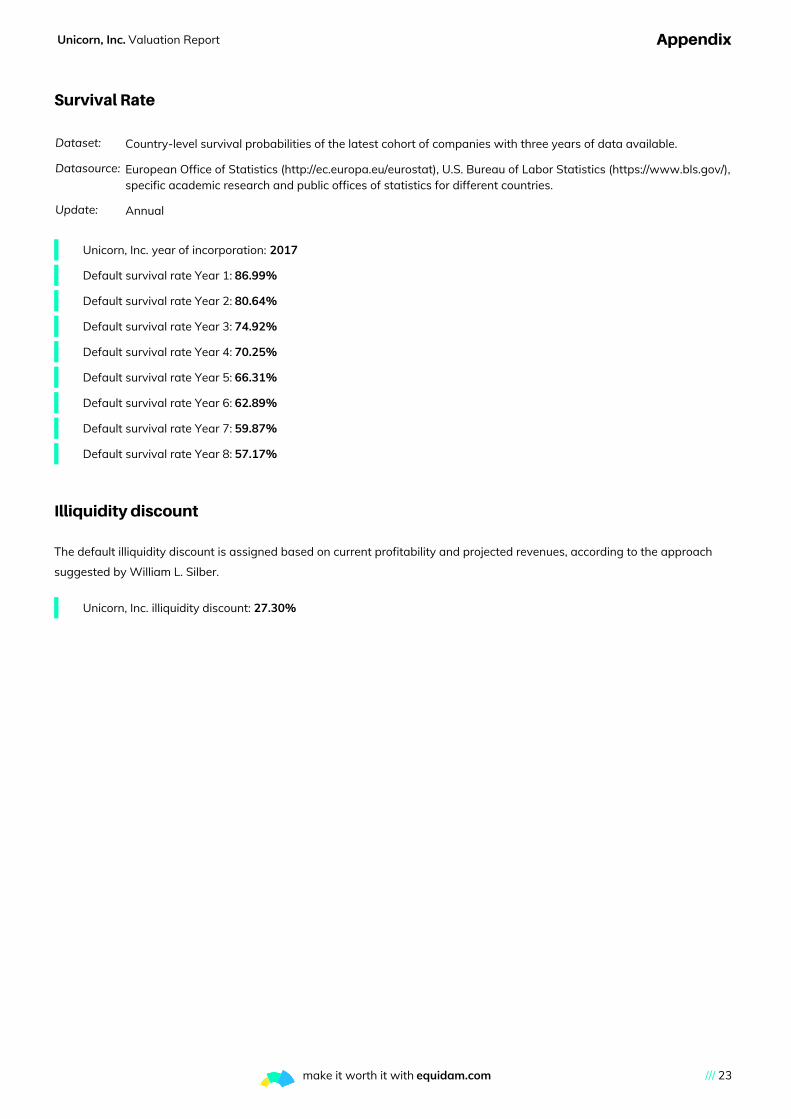
Survival Rate
Dataset: Country-level survival probabilities of the latest cohort of companies with three years of data available.
Datasource: European Office of Statistics (http://ec.europa.eu/eurostat), U.S. Bureau of Labor Statistics (https://www.bls.gov/),specific academic research and public offices of statistics for different countries.
Update: Annual
Unicorn, Inc. year of incorporation: 2017
Default survival rate Year 1: 86.99%
Default survival rate Year 2: 80.64%
Default survival rate Year 3: 74.92%
Default survival rate Year 4: 70.25%
Default survival rate Year 5: 66.31%
Default survival rate Year 6: 62.89%
Default survival rate Year 7: 59.87%
Default survival rate Year 8: 57.17%
Illiquidity discount
The default illiquidity discount is assigned based on current profitability and projected revenues, according to the approach
suggested by William L. Silber.
Unicorn, Inc. illiquidity discount: 27.30%
/// 23make it worth it with equidam.com

Unicorn, Inc. Valuation Report Appendix
DCF with LTGLong term growth
Dataset: Global, publicly listed companies organized by industry (same as in EBITDA multiple)
Datasource: Prof. A. Damodaran, NYU Stern School of Business
Update: Annual
Notes: The value is winsorized over a 0% - 2.5% range. We do not want the long term growth to be above world GDPgrowth expectations, as it would mean the company is going to overgrow world economy at some point in time
Unicorn, Inc. industry: Consumer Electronics Retailers
Consumer Electronics Retailers default long term growth: 0.03
DCF with MultiplesEBITDA multiple
Dataset: Global, publicly listed companies organized by industry
Datasource: Prof. A. Damodaran, NYU Stern School of Business
Update: Annual
Notes: We favor the use of EBITDA multiple, as we believe revenue multiples fail to capture the ability of startups togenerate cash flow, the ultimate determinant of value.
Unicorn, Inc. industry: Consumer Electronics Retailers
Consumer Electronics Retailers default EBITDA multiple: 1.50
/// 24make it worth it with equidam.com
Unicorn, Inc. Valuation Report Appendix
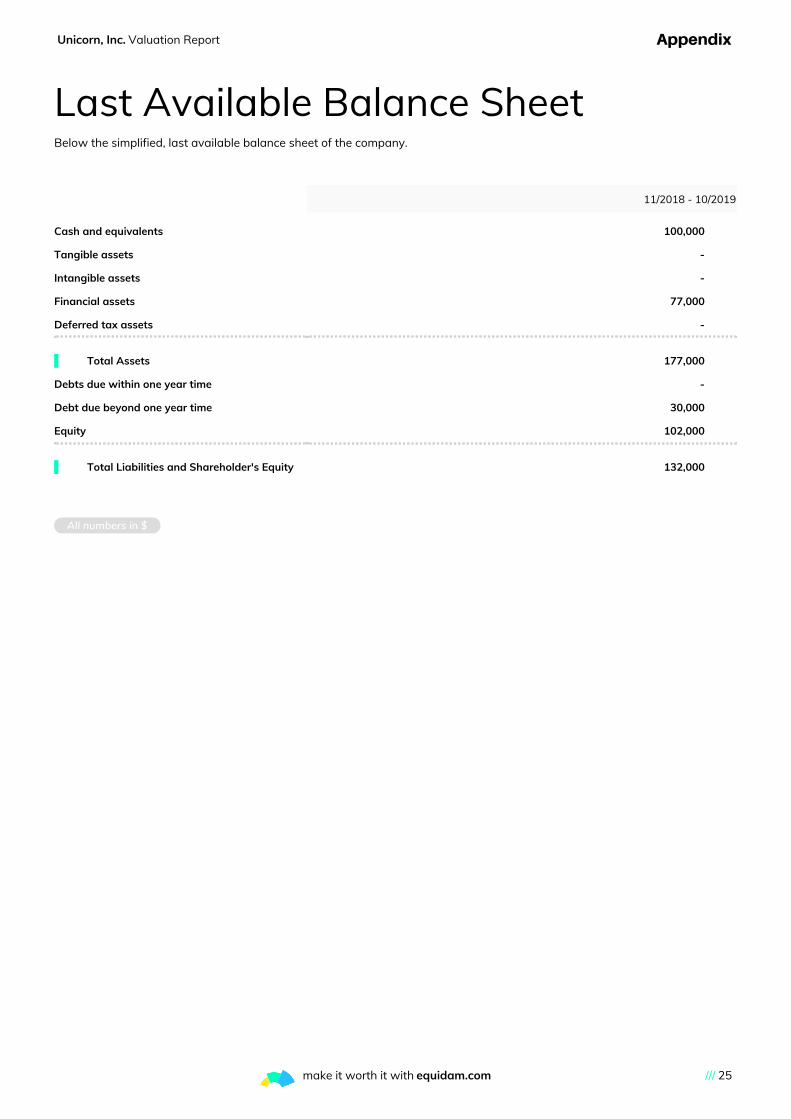
Last Available Balance SheetBelow the simplified, last available balance sheet of the company.
All numbers in $
11/2018 - 10/2019
- -
- -
- -
- -
- -
- -
- -
- -
- -
--
Cash and equivalents 100,000
Tangible assets -
Intangible assets -
Financial assets 77,000
Deferred tax assets -
Total Assets 177,000
Debts due within one year time -
Debt due beyond one year time 30,000
Equity 102,000
Total Liabilities and Shareholder's Equity 132,000
/// 25make it worth it with equidam.com