valuation of travel time savings for business travellers
TRANSCRIPT

VALUATION OF TRAVEL TIME SAVINGS FOR
BUSINESS TRAVELLERS
Annexes to Main Report
Prepared for the Department for Transport
Mark Wardman Richard Batley James Laird
Peter Mackie Tony Fowkes Glenn Lyons
John Bates and Jonas Eliasson
April 2013
Institute for Transport Studies
1
2
Contents
ANNEX 1 TECHNICAL ANNEX ON THE HENSHER EQUATION 5
A11 Introduction 5
A12 Previous Literature 7
A13 Defining the Objective Problem Behind the Hensher Equation 7
A14 Solving the Objective Problem 13
A15 Revealed Properties of the Hensher Equation 16
A16 Special Cases of the Hensher Equation 18
A17 Synthesis and Conclusions 22
ANNEX 2 CURRENT APPRAISAL PRACTICE 26
A21 Objectives 26
A22 Structure of this annex 26
A23 Business Travel in Great Britain 26
A24 Measuring the Value of Business Travel Time Savings 31
A241 GB practice and the Cost Saving Method 31
A242 Alternative Valuation Approaches31
A25 International Appraisal Practice 31
A26 Implementing the Cost Saving Method in Great Britain 34
A261 Deriving the Hourly Wage 35
A262 Non‐Wage Labour Costs 36
A263 Professional Drivers 37
A264 Long run marginal costs37
A27 Summary 37
ANNEX 3 REVIEW OF EVIDENCE ON BUSINESS TRAVEL TIME SAVINGS 42
A31 Introduction 42
A311 Aims 42
A312 Scope 42
A313 Structure 43
A32 Definitions 43
A33 Review of National Value of Time and Other Significant Studies 44
A34 Willingness to Pay Evidence 71
A341 Review of European WTP Evidence72
3
A342 Recent Japanese Evidence73
A343 High Speed Rail Evidence75
A35 Specific Issues and Insights 79
A36 Conclusions 80
ANNEX 4 TRAVEL TIME USE ndash AN EXAMINATION OF EXISTING EVIDENCE83
A41 Context 83
A42 Introduction 83
A43 Empirical Insights into Travel Time Use 84
A44 A Conceptualisation of Travel Time Productivity 91
A45 Reflections on the Literature Examined 92
ANNEX 5 LABOUR MARKET CONDITIONS AND IMPLICATIONS FOR THE VALUATION OF BUSINESS
TRAVEL TIME SAVINGS96
A51 Introduction 96
A511 Objectives 96
A512 Structure of Annex97
A52 Income Tax 97
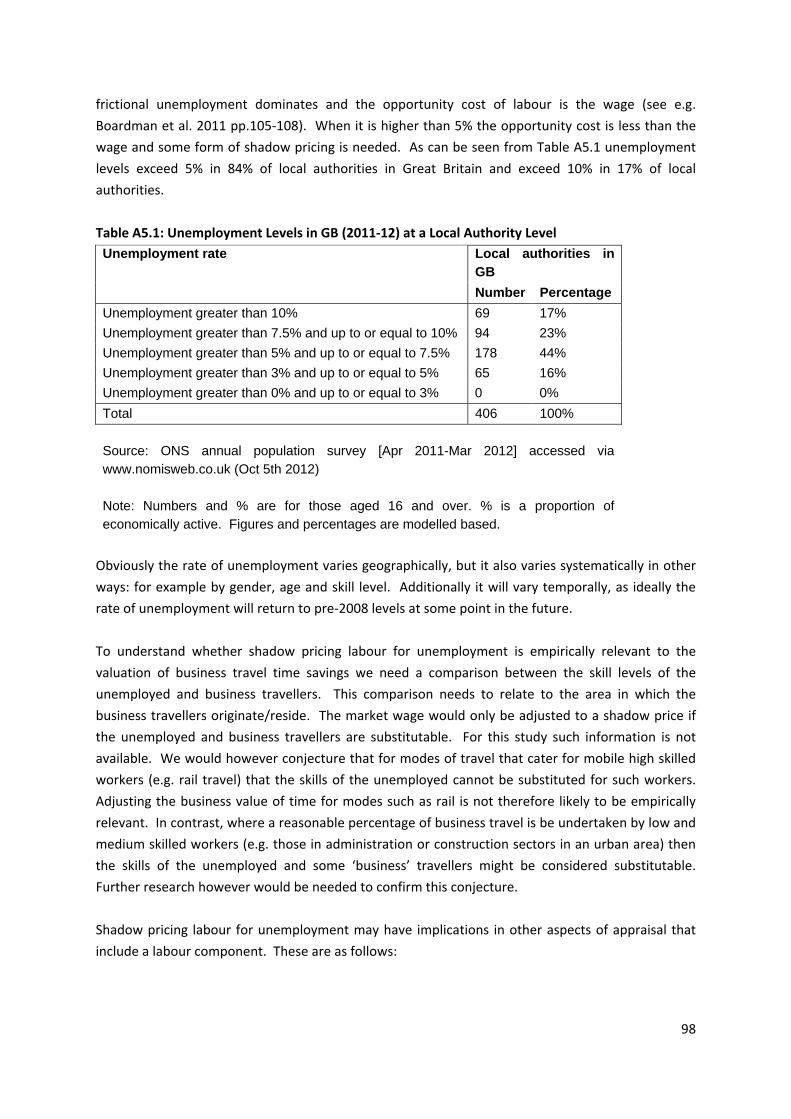
A53 Structural Unemployment Excess Labour Supply 97
A54 Imperfectly Competitive Markets 99
A541 Imperfect GoodsProduct Market 99
A542 Imperfect Labour Markets100
A543 Synthesis 101
A544 Flexible Working 101
A55 Synthesis and Further Research 104
A551 Labour Market Conditions104
A552 Valuation Methods 105
A553 Further Research 105
A554 Implications for Appraisal106
4
Acknowledgements
We would very much like to recognise the valuable assistance and advice provided to us by Jake
Cartmell and Dan Thomas of the Department for Transport in conducting this research
Disclaimer
Although this report was commissioned by the Department for Transport (DfT) the findings and
recommendations are those of the authors and do not necessarily represent the views of the DfT
DfT does not guarantee the accuracy completeness or usefulness of that information and it cannot
accept liability for any loss or damages of any kind resulting from reliance on the information or
guidance this document contains
ANNEX1 TECHNICALANNEXONTHEHENSHEREQUATION
A11Introduction
According to conventional theory savings in business travel time may derive benefits to the
employer and employee in the following ways
From the point of view of the employer
a) The time saving may be used to undertake more productive work at home or at the normal
place of work
From the point of view of the employee
b) The time saving may be devoted to additional leisure time at home
c) The time saving may be devoted to additional work time at the regular place of work
d) The time saving may permit a later departure for the business trip or an earlier arrival
home possibly leading to reduced fatigue
A number of approaches have been adopted for the estimating the potential benefits listed above
the predominant ones being the so‐called lsquocost savingrsquo and lsquoHensherrsquo approaches The cost saving
approach focuses upon the benefit source a) above and is underpinned by the following five
assumptions (Mackie et al 2003)
i Competitive conditions in the goods and labour markets
ii No indivisibilities in the use of time for production
iii All released time goes into work not leisure
iv Travel time is 0 productive in terms of work
v The employeersquos disutility of travel during work time is equal to their disutility of working
If these assumptions hold then cost savings arise from the direct compensationreward to the
employee plus any additional costs of employing staff On this basis the cost saving approach is
often referred to as lsquowage plusrsquo and the value of business travel time savings (VBTT ) is
formalised
S
VBTTS w c (1)
where
w is the gross wage
is the non‐wage cost of employing labour c
5
In contrast to the cost saving approach the Hensher approach considers benefit sources a) to d) and
thus combines the perspectives of the employer and the employee Whereas Hensher (1977) was
responsible for the intuition behind the approach Fowkes et al (1986) were responsible for its
lsquocodificationrsquo as follows
1 1VBTTS r pq MPL MPF r VW rVL (2)
where
r is the proportion of travel time saved that is used for leisure
p is the proportion of travel time saved that is at the expense of work done while travelling
q is the relative productivity of work done while travelling relative to at the workplace
MPL is the marginal product of labour1
MPF is the extra output due to reduced (travel) fatigue
is the value to the employee of work time at the workplace relative to travel time VWVL is the value to the employee of leisure time relative to travel time
is the portion of VBTT that is associated with the employer S
is the portion of VBTT that is associated with the employee S
Whilst the Hensher equation has found conceptual appeal practical implementation of the
complete framework has proved difficult Consensus seems to be that the and VW terms
are especially difficult to estimate (see the discussion in Mackie et al (2003) for example) and it is
not unusual to drop these from consideration Various authors have asserted that VL is simply the
non‐work VT and can thus be populated using standard values Of particular relevance to the
current discussion is the situation where the Hensher and traditional cost‐saving approaches arrive
at the same estimate of according to Mackie et al this is where and
In a similar vein a number of studies have implemented restricted
versions of the Hensher approach A notable example is the AHCG (1994) study which assumed
and (ie work and leisure are valued equally) thereby deriving the
identity
MPF
TS
PF M
VP
VBTTS
VL
0r p 0VW M PL
0MPF VW
1VBTTS r pq MPL VP
(3)
The identity (3) has also been implemented in several subsequent studies such as Algers et al
(1995) and the most recent Dutch study (not yet releasedpublished) In the subsequent discussion
we shall question the validity of (3)
1 To be more precise this term should be interpreted as the marginal revenue product of labour
6
A12PreviousLiterature
Despite the attention that it has received it is notable that Hensher never offered a formal
derivation of (2) from first principles Furthermore Fowkes et alrsquos (1986) codification of the Hensher
equation entailed a formal statement of (2) rather than derivation from first principles Working
Paper 3 from the 1987 UK national non‐work VTTS study (MVA ITS amp TSU 1987) contributed a
different piece of the jigsaw by defining an economic problem apparently underpinning the Hensher
equation (p72) but did not proceed to solve the problem This gap in the literature motivated the
recent contributions of Karlstroumlm et al (2007) and Kato (2012) Karlstroumlm et alrsquos derivation claims to
lsquocome closersquo to deriving the Hensher equation whilst Kato claims to derive it exactly
Karlstroumlm et al (2007) generalised Hensher by distinguishing between short distance and long
distance trips the latter were defined as trips where it would not be feasible to return to the office
at the end of the day after completion of the business trip They further distinguished between
private and social valuations of travel time savings where social valuations account for the incidence
of tax Kato (2012) adopted Karlstroumlm et alrsquos definition of short and long distance trips but
proposed a different definition of the objective function as the conflation of welfare accruing to the
employee and employer By contrast Karlstroumlm et alrsquos objective function was defined in terms of
the employeersquos welfare only with the employerrsquos interests represented only as a constraint
Despite being the more faithful to (2) Kato derivation is complicated and involves several
superfluous terms (for example the contribution to the employeersquos utility from leisure travel is
irrelevant to the derivation of VBTT ) Moreover the key transition (from his equation (26) to
(27)) and the interpretation of the resulting terms that give rise to the Hensher equation are
(arguably) not as clear as they might be The contribution of the subsequent discussion will be to
draw upon both Karlstroumlm et al and Kato but present a simpler derivation of the Hensher equation
(2) from first principles This will serve to clarify the interpretation of the terms within (2) and
expose several assumptions and properties
S
A13 DefiningtheObjectiveProblemBehindtheHensherEquation
In what follows we shall outline an optimisation problem wherein
The problem is defined in terms of the joint interests of the employer and employee
More specifically the objective statement is one of maximising welfare where welfare is
additive in profit generated by the employer (converted into utility units) and the utility of
the employee subject to a time resource constraint
7
More formally
Max
st
1
w l ww
T T X t
w w l
W PX wT U
T T r t r T
(4)
where
1 1w wX X T r p q r p q t
w w l w wU U T r t T r t t
and
W is social welfare
is the marginal utility of income
P is the sales revenue per unit of goods produced
X is the quantity of goods produced
X is the production function of the produceremployer
w is the wage rate
wT is the quantity of lsquocontractedrsquo work time
U is the utility function of the employee
T is the total time devoted to lsquocontractedrsquo work leisure and business travel (ie 24 in any one day)
wt is the quantity of business travel time which could straddle lsquocontractedrsquo work and leisure time
lT is the quantity of leisure time given the work contract
is the marginal utility of time (and the Lagrange multiplier in (4))
r is the proportion of business travel time that takes place in leisure time this should be
distinguished from the term in (2) which relates to travel time saving specifically rp
p
is the proportion of business travel time that is productive this should be distinguished from the
term in (2) which relates to travel time saving specifically
q
8
It is important to understand the salient features of the objective problem as follows
With reference to the profit function we assume that revenue is generated through the
sale of goods and that costs are incurred through the employment of labour For simplicity
we further assume that the non‐wage costs of employing labour are zero (ie with reference
to (1) we assume that c 0 ) and omit explicit consideration of tax (ie implicitly we
assume that the taxation regime is neutral between employer and employee) Both issues
can be introduced into the analysis but with a modest increase in complexity
is as defined in (2)
With reference to the X function production depends solely upon the time contributed by
the labour input adjusted for the productivity of the time Productive time could
conceivably include not only lsquocontractedrsquo work time but also a proportion of leisure time
hence the notion of lsquoeffectiversquo work (and leisure) time
With reference to the U function utility depends solely upon the quantities of lsquoeffectiversquo
work time lsquoeffectiversquo leisure time and business travel time (but not the consumption of
goods see subsequent comment on page 6)
With reference to the constraint the time resource constraint is ostensibly the sum of
lsquocontractedrsquo work and leisure time but entails three key propositions concerning business
travel time namely that
Business travel time may straddle lsquocontractedrsquo work and leisure time (hence the
term and the notion of lsquoeffectiversquo work time)
r
Business travel time may ‐ to some extent ‐ be unproductive (hence the p and q
terms)
Although business travel time may straddle lsquocontractedrsquo work and leisure time p
and q remain constant This gives rise to the implicit assumption that the
productivity of business travel is constant irrespective of whether it is undertaken
during lsquocontractedrsquo work or leisure time For a practical illustration of the objective
problem (4) see Figures 1 and 2
In contrast to conventional work‐leisure optimisation problems such as Becker (1965) and
Oort (1969) it is notable that (2) omits a budget constraint This reflects the following
considerations
It is assumed that the employer and employee face a common marginal utility of
income
It is assumed that the labour costs incurred by the employer in the course of
production straightforwardly transfer to the wage‐related income of the employee
It is assumed that non‐wage income to the employee is zero
Since labour costs already feature in the objective statement and we have assumed
zero non‐wage income there is no need to also include a budget constraint2
2 In the vein of Karlstroumlm et al (2007) an alternative (but equivalent) way of specifying the problem (4) is to
include a budget constraint but represent the objective statement entirely in terms of the employee as
9
Note furthermore that wage‐related income refers to contracted work time wT only
in effect no wages are paid or received for business travel that takes place during
leisure time wr t In section 4 we will relax this assumption
Given these features it is important to consider what forms of employment are compatible with the
objective problem (2) Our conclusion consistent with both Kato (2010) and Batesrsquo (2013)
assessment of Karlstroumlm et al (2007) is that the Hensher equation is most applicable to the case of
self‐employment That is to say self‐employment would justify
The notion of a joint welfare function combining the perspectives of the employer and
employee (who in this case would be one‐and‐the‐same)
The proposition that labour costs (income) should be represented in either the objective
statement or the cost (budget) constraint but not both
The Hensher equation might also be appropriate for representing some forms of co‐operative or
barter economy but is less appropriate for economies that embody some degree of competitive
behaviour between employer and employee
10
Max
st
1
w l wX T T t
w
w w l
W U
PX wT
T T r t r T
1w w w lL U PX wT T T r t r T
(f1)
This problem yields exactly the same Lagrangian function as (4) specifically
(f2)
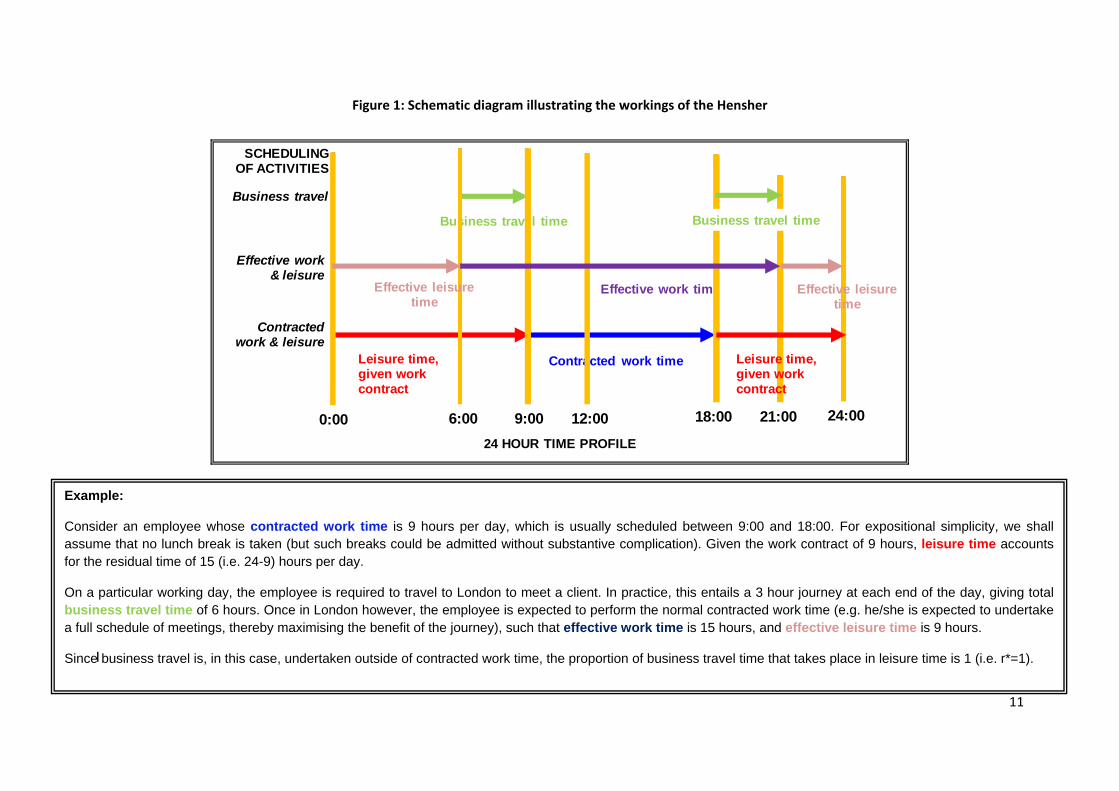
Figure 1 Schematic diagram illustrating the workings of the Hensher
Leisure time given work contract
Contracted work time
Business trav l time
600 2100 2400
Effective work tim
000
Effective work amp leisure
Contracted work amp leisure
900 1800
Business travel
SCHEDULING OF ACTIVITIES
Business travel time
Effective leisure time
Leisure time given work contract
24 HOUR TIME PROFILE
Effective leisure time
1200
Example
Consider an employee whose contracted work time is 9 hours per day which is usually scheduled between 900 and 1800 For expositional simplicity we shall assume that no lunch break is taken (but such breaks could be admitted without substantive complication) Given the work contract of 9 hours leisure time accounts
for the residual time of 15 (ie 24-9) hours per day
On a particular working day the employee is required to travel to London to meet a client In practice this entails a 3 hour journey at each end of the day giving total business travel time of 6 hours Once in London however the employee is expected to perform the normal contracted work time (eg heshe is expected to undertake
a full schedule of meetings thereby maximising the benefit of the journey) such that effective work time is 15 hours and effective leisure time is 9 hours
I Since business travel is in this case undertaken outside of contracted work time the proportion of business travel time that takes place in leisure time is 1 (ie r=1)
11
12
Example
Now suppose that travel time to London is reduced by 1 hour in each direction
In terms of the Hensher equation we are interested in the allocation of the 2 hour saving in total business travel time which could be
1) Retained for work at home or at the normal workplace such that effective work time is the same as Figure 1 (possibly to the benefit of the employee if working at home or the normal workplace is preferred to travel and possibly to the benefit of the employer if productivity is enhanced) This is the outcome shown in
Figure 2 above 2) Returned to leisure such that effective leisure time increases by 2 hours as compared with Figure 1 (again to the benefit of the employee but to the loss of
the employer as productive output is reduced) 3) Split between work and leisure such that the final outcome is intermediate between 1) and 2)
Figure 2 Schematic diagram illustrating the workings of the Hensher equation
Leisure time given work contract
Contracted work time
Business trav l time
700 2000 2400
Effective work tim
000
Effective work amp leisure
Contracted work amp leisure
900 1800
Leisure time given work con rac
Effective leisure time
24 HOUR TIME PROFILE
Effective leisure time
1200
Business travel
SCHEDULING OF ACTIVITIES
Business tra el me
600 2100
A14 SolvingtheObjectiveProblem
Having outlined the objective problem of interest we will now proceed to solve it In solving (4) it is
appropriate to first solve for lsquocontractedrsquo work time since this will determine the productive
capacity of the firm as well as the leisure time available to the employee
wT
w w w
W X UP
T T Tw (5)
In practice will be determined by the employeersquos supply of hours (and thus the interaction
between work leisure and consumption) and the employerrsquos demand for hours (and thus the firmrsquos
planning decisions regarding the volume of production) as follows
wT
1
l l
W Ur
T T (6)
WP
X
(7)
The final first order condition relates to travel time specifically
w w w w w
W X U U UP
t t t t t r (8)
In principle the value of business travel time (VB ) is given by TT
w
WVBTT
t
(9)
As we shall demonstrate the Hensher equation arises from a distinct focus on the value of
transferring business travel time (which may be less than fully productive and potentially
overlaps into leisure time ie ) into lsquocontractedrsquo (and fully productive) work time Drawing
upon (5) and (8) in particular we can derive the Hensher equation as follows
wt
wr t wT
13
1
1
1
1
w w
w w
w w w
w
W WVBTTS
T t
XP w
T t
U
T t t
U
t
r
U
(10)
This derivation of VBTTS clarifies the interpretation of some of the terms in (2) which might be
re‐labelled as follows
1
1 1
1
1
w
w w
MPL
w w
VW VL
w w
Vot
w
VoT
W WVBTTS
T t
XP w
T t
U
T t t
U
t
r
w
U
VL is the value of lsquoeffectiversquo leisure time to the employee
w is the value of business travel time to the employee (this replaces the MPF term in (2) Vot
again we shall explain this subsequently)
VoT is the value of time as a resource
(11)
where
MPL is the marginal product of labour3
VW is the value of lsquoeffectiversquo work time to the employee (we shall explain the terminology used in
subsequent discussion)
3 In common with footnote 1 this term should more precisely be interpreted as the marginal revenue
product but we have used the notation MPL in order maintain consistency with (2)
14
Continuing with our derivation
1 1 1
11
1
1
w
XVBTTS P r p q r p q w
U Ur r
U
t
r
(12)
If as is commonly assumed MP then we can achieve further simplification L w
1
11
1
1
w
XVBTTS P p q r
U Ur r
U
t
r
(13)
where we would expect a priori 0U U and 0wU t
In this way we derive the identity (13) which basically reproduces (2) but calls for us to reinterpret
some of the terms of (2) as follows
With regards to work time we should distinguish between the value of lsquocontractedrsquo work
time wU T ) to the employee and the value of lsquoeffectiversquo work time U to
the employee where the latter includes business travel undertaken during leisure time (eg
Figure 1 entails lsquocontractedrsquo work time of 9 hours per day plus 6 hours of business travel
time) Given this distinction two clarifications are appropriate First the VW term in (2)
which Fowkes et al (1986) interpreted as lsquothe value to the employee of work time at the
workplace relative to travel timersquo is better interpreted as the value of lsquoeffectiversquo work time
Second the factor 1 r represents the proportion of business travel time that falls
within lsquocontractedrsquo work time Moreover the term 1VW r as a whole represents the
value to the employee of transferring business travel time to lsquocontractedrsquo work time (eg
outcome 1 in Figure 2)
15
With regards to leisure time and in a similar vein to the discussion above the VL term in
(2) is better interpreted as the value of lsquoeffectiversquo leisure time to the employee and not lsquothe
value to the employee of leisure time relative to travel timersquo (Fowkes et al 1986) The factor r represents the proportion of business travel time that given the work contract falls
within leisure time Moreover the term VL r as a whole represents the value to the
employee of transferring business travel time to leisure time (eg outcome 2 in Figure 2)
1VW r VL r
More importantly ‐ aside from the above clarifications ‐ Fowkes et al correctly interpreted
as the value of business travel time savings to the employee
accounting for the possibility that such savings could be allocated to work or leisure
Comparing against (2) (13) includes an additional term namely VoT The role of the VoT
term is to represent the benefit of relaxing the time constraint as travel time is saved
thereby permitting reassignment between work and leisure The omission of the VoT term
from (2) might thus give the impression that no account has been taken of the time
constraint However this would be to overlook the role of the r term in (2) as distinct from r in (13) which represents the proportion of travel time saved that is used for leisure That
is to say the VoT and r terms represent similar effects We shall discuss the VoT term
more fully in section 6 of this annex
Since (2) effectively represents the employer and employee as one‐and‐the‐same the
MPF term in (2) can be attributed to either party On this basis ‐ but in contrast to Fowkes
et al ‐ we reinterpret this term as the value of business travel time to the employee wVot
(arguably this is the more natural interpretation) Since we would expect 0w it
should be the case that wMP
U t
F Vot
A15RevealedPropertiesoftheHensherEquation
The above analysis has revealed a number of properties arising from (4) which can now be
summarised
The Hensher equation is no different to the cost saving method in assuming that the
marginal product of labour is equal to the wage rate ie MPL w
In perfect equilibrium we would expect the marginal value of lsquocontractedrsquo work and leisure
time to be equal to the wage rate ie w lU T U T w but if 0r this
precludes the possibility that VW VL Thus by assuming the latter AHCG (1994)
effectively imposed a position of labour market disequilibrium
16
As noted in section 3 above the Hensher equation implicitly assumes that business travel
which takes place during leisure time is equally as productive as business travel that takes
place during work time If business travel during leisure is in practice less productive then
VBTTS will be understated (ie (13) will understate the benefits of transferring
unproductive travel time to leisure) Taking the extreme case where business travel during
leisure time is entirely unproductive (13) becomes
1
11
1
1
w
XVBTTS P p q r r p q
U Ur r
U
t
r
(14)
The reality will perhaps fall somewhere between (13) and (14)
It has already been noted that the Hensher equation implies that no wages are paid or received for
business travel that takes place during leisure time If instead all lsquoeffectiversquo work time were
fully remunerated then VBTT should be revised upwards as follows
wr t
S
1
11
1
1
w
XVBTTS P p q
U Ur r
U
t
r
(15)
Last but not least a more fundamental issue is the nature of the production function since the
Hensher equation assumes that labour is the sole input to production and that (apart from
productivity issues) this input plays the same function whether at the regular place of work or
travelling If in practice the productive contribution of business travel is not simply one of labour
input but a broader one of generating andor facilitating production (eg by visiting clients or
suppliers) then there is a case for adjusting (13) along the lines
17
1
11
1
1
w
w
X XVBTTS P p q r
f t
U Ur r
U
t
r
(16)
where wX f t is the marginal product of business trips and wf t is some function to be
estimated That is to say savings in business travel time would allow more (or longer) business trips
to be carried out or allow more meetings to be conducted on a given business trip thereby realising
a potential benefit Indeed Kato (2010) formalises this proposition by specifying two productive
functions within the objective problem one where business travel has a negative impact on
productive output (in the spirit of the Hensher equation) and a second where business travel has a
positive impact on productive output
A16 SpecialCasesoftheHensherEquation
Having derived the Hensher equation from first principles let us now consider some special cases of
the equation We shall begin by considering the same four cases derived by Bates (2007) before
considering other cases
Case 1 Productive travel time is saved and transferred to productive time in the workplace
This case simply amounts to imposing 0r and 1p on (12) as follows
2
1
1
1
w
XVBTTS P q w
U
U
t
r
(17)
If we further assume MP then (17) simplifies to L w
18
1
1
1
1
w
XVBTTS P q
U
U
t
r
(18)
The above result replicates Batesrsquo result for Case 1 with the exception that (18) includes the VoT
term ‐ namely the resource value of time ‐ whilst Batesrsquo result omits this term from consideration
The same qualification applies to Case 2‐4 which follow We shall consider the resource value of time
in more detail in Case 6
Case 2 Unproductive travel time is saved and transferred to productive time in the workplace
This case simply amounts to imposing 0r and 0p on (12) thus
2
1
1
1
w
XVBTTS P w
U
U
t
r
(19)
If we further assume MP then (19) simplifies to L w
1
1
1
w
XVBTTS P
U
U
t
r
(20)
19
Case 3 Productive travel time is saved and transferred to leisure time
This case simply amounts to imposing 1r and 1p (and again MPL w ) on (12) and yields
the following
1
1
w
XVBTTS P q
U
U
t
(21)
Case 4 Unproductive travel time is saved and transferred to leisure time
This case simply amounts to assuming 1r and 0p (and MPL w ) on (12) and yields
1
1
w
UVBTTS
U
t
(22)
Case 5 Cost saving approach
Further to the comment in section 1 if we assume r 0 p 0 U 0 and U tw 0
(ie all business travel takes place during work time and is non‐productive and the marginal
valuations of both work time and business travel time are zero) and also assume MPL w then ‐
aside from the VoT term ‐ (12) collapses to the lsquocost savingrsquo approach
X
VBTTS P
(23)
Reflecting further however the five assumptions underpinning the cost saving approach detailed in
section 1 (notably competitive conditions and no indivisibilities) effectively render the time resource
constraint (and term) redundant Thus if these assumptions hold (23) will in practice be
equivalent to (1)
VoT
20
Case 6 Accounting for the resource value of time
In contrast to Case 5 the VoT term plays a substantive role in Cases 1 and 2 We shall therefore
complete our analysis by considering the term in more detail Employing (5) and (6) we can
derive the identity
VoT
w ww
X UP w
T TW T
W X P
(24)
Simplifying and rearranging
w w
w
UTX W
P wT W
T
X P (25)
Assuming MP (25) further simplifies to L w
ww
UW T
T
(26)
Finally if we substitute for in (12) then VBTTS can be re‐stated equivalently
1
11
1
1
w
ww
XVBTTS P p q r
U Ur r
U
t
UW T
Tr
(27)
Rationalising (26) intuition suggests that the value of lsquocontractedrsquo work time to society must be at
least as great as the value of lsquocontractedrsquo work time to the employee work would not otherwise
take place This implies that U T w w W T 0 In Cases 1 and 2 therefore the
VoT term potentially offers a positive contribution to VBTTS
21
A17 SynthesisandConclusions
Following a brief review of methods for estimating we have devoted particular attention
to the Hensher equation not least because it offers a general theoretical framework from which
most of the competing methods can be derived or conceptualised In particular we derived the
Hensher equation (2) from first principles considered various special cases of the equation and
reconciled these special cases with similar work by Bates (2007) This exercise has given us
reassurance that the Hensher equation can be rationalised in terms of the microeconomic theory of
consumption and production but has exposed a series of assumptions and properties the
appropriateness of which might be debated namely
VBTTS
i Production is assumed to be a function of a single input ‐ labour ‐ which could include not
only lsquocontractedrsquo work time but also a proportion of leisure time
ii The marginal product of labour is assumed to be equal to the wage rate but the employer
does not pay for business travel time that takes place during leisure time (ie nil overtime
payments are assumed)
iii Business travel time that takes place during leisure time is assumed to be equally as
productive as business travel time during lsquocontractedrsquo work time
iv Utility to the employee is assumed to be a function of lsquoeffectiversquo work and leisure time and
business travel time The MPF term in (2) can be otherwise interpreted as the value of
business travel time to the employee wVot in (13) That is to say it makes little practical
difference whether the (negative) utility of travel per se is a burden to the employer or
employee
v The VoT term in (13) is omitted from (2) but is instead proxied by the r term (as distinct
from r )
vi The Hensher equation takes no account of the potential for business travel to have a
broader function of generating and facilitating economic activity
Moreover it is important to consider what forms of employment are compatible with the notion of a
joint welfare function for the employer and employee and the proposition that labour costs
(income) should be represented in either the objective statement or the costs (budget) constraint
but not both Our conclusion is that the Hensher equation is most applicable to self‐employment or
economies that operate on a co‐operative basis
In principle the above assumptions and properties can be relaxed but this may have implications
for estimates of Table A11 illustrates this by comparing a lsquobasersquo specification of the
Hensher equation with five variants specifically
VBTTS
Model 1 this is taken to be the lsquobasersquo and restricts (13) to the case where the employeersquos
value of business travel time is zero and the time resource constraint is not binding ie we
assume 0wVot (or 0 ) and 0VoTMPF
22
Model 2 we adjust Model 1 such that business travel during leisure time is zero‐productive
ie we assume 0q during leisure This has the effect of increasing VBTTS relative to
the base but typically not to the extent that it will exceed w
Model 3 we adjust Model 1 such that overtime is paid ie we assume that labour costs
equal VBTTS increases relative to the base but typically will be less than
w
w ww T r t
Model 4 Model 1 is adjusted such that the value of business travel time savings to the
employee is admitted ie we assume 0wVot (or 0MPF ) VBTTS increases relative
to the base and could in some circumstances exceed w
Model 5 we adjust Model 1 such that the value of time as a resource is admitted ie we
assume 0VoT VBTTS increases relative to the base but typically will be less than w
Model 6 this is as Model 1 but admits the possibility that business trips have a productive
benefit beyond the basic labour input ie we assume 0wX f t Again VBTTS
increases relative to the base and could possibly exceed w
Although Models 2‐6 outline cases where VBTT increases relative to Model 1 it is important to
note that Models 2 3 and 5 would still be expect
Sed to yield a VBTT less than the wage rate By
contrast Models 4 and 6 could in some circumstances yield a VBTT above the wage rate
SS
23
Table A11 Variants of the Hensher equation and impacts on VBTTS
Model Description Formula for VBTTS VBTTS relative to Base
1 Assume
MPF
Votw
0 ) and
0 (equivalent
VoT 0
to VBTTS1 P
X1
p q r 1
U1
r U
r
Base VBTTS 1
2 Assume
p q 0
zero productivity
) during leisure time
(ie VBTTS2 P
X1
p q r r p q 1
U1
r U
r
VBTTS VBTTS1 2
typically less than w
but
3
Assume overtime
costs equal w Tw
is paid
r tw
ie wage VBTTS3 P
X1
p q 1
U1
r U
r
VBTTS VBTTS1 3
typically less than w
but
4 Assume Vot 0 (or MPF 0 ) w
implying that travel has a fatigue effect on the employee
VBTTS4 PX
1
p q r 1
U1
r U
r
U
VBTTS VBTTS 4 1
and possibly greater than w tw
5 Assume VoT 0 implying that time
savings allow reassignment of work and leisure time
VBTTS5 PX
1
p q r 1
U1
r U
r 1
r VBTTS VBTTS1 5
typically less than w
but
6 Assume business trips
business ie X f t w generate
0 VBTTS6 P
X1
p q r X
f tw
1
U1
r U
r
VBTTS VBTTS1 6
possibly greater than w
and
24
25
Annex 1 References
Accent amp Hague Consulting Group (AHCG) (1999) The Value of Travel Time on UK Roads Prepared
for Department for Transport
Bates J (2007) Business value of time and crowding ndash some thoughts Private communication
Bates J (2013) Assessment of lsquoTechnical Annex on the Hensher Equationrsquo Private communication
Becker GS (1965) lsquoA theory of the allocation of timersquo The Economic Journal 75 pp493‐517
DeSerpa A (1971) lsquoA theory of the economics of timersquo The Economic Journal 81 pp828‐846
Forsyth PJ (1980) The value of time in an economy with taxation Journal of Transport Economics
and Policy Vol XIV pp337‐361
Fowkes T (2001) Principles of valuing business travel time savings Institute for Transport Studies
University of Leeds Working Paper 562
Fowkes AS Marks P amp Nash CA (1986) The value of business travel time savings Institute for
Transport Studies University of Leeds Working Paper 214
Hensher DA (1977) Value of Business Travel Time Pergamon Press Oxford
Karlstroumlm A Eliasson J amp Levander A (2007) On the theoretical valuation of marginal business
travel time savings European Transport Conference
Kato H (2012) On the value of business travel time savings derivation of Hensherrsquos formula
Working paper
Mackie P Wardman M Fowkes AS Whelan G Nellthorp J amp Bates JJ (2003) Values of travel
time savings in the UK Report to Department of Transport Institute for Transport Studies
University of Leeds amp John Bates Services Leeds and Abingdon
MVA ITS amp TSU (1987) Working Paper 3 Theoretical considerations Report to the APM Division
Department of Transport
Oort O (1969) The evaluation of travelling time Journal of Transport Economics and Policy 3
pp279‐286
26
ANNEX2 CURRENTAPPRAISALPRACTICE
A21 Objectives
This note forms an annex to the main report to the Department for Transport on the valuation of
travel time savings to business travellers The purpose of this annex is to
Give some context to the current practice of valuing business travel time savings in the UK
Review international practices on valuing business travel time savings
Review the sources of wage data working hours etc the Department uses for the
calculation of business travel time savings
A22 Structureofthisannex
Following this short introductory section the second section of this annex gives some context to
business travel in GB in terms of its economic importance how these trips are made (timing and
mode) and who makes them (occupations and industries) The third section summarises the
approach used in Britain to value business travel time savings and briefly introduces alternative
approaches In the fourth section practice across Europe and other countries with developed
appraisal systems is compared whilst in the fifth section the methodology and data used to
implement the cost saving method to valuing business travel time savings in GB is critically reviewed
The final section presents a brief summary of the main points contained within this annex
A23 BusinessTravelinGreatBritain
For infrastructure projects with the objective of improving accessibility business travel time savings
are important ‐ travel time savings typically comprise the majority of the direct benefits of such
projects As business trips are valued on average at more than 4 times non‐working time savings
(DfT 2012a) the value of business time savings is critical to the economic appraisal of such projects
For example time savings form half of all user benefits for the proposed London to West Midlands
high speed rail line and business time savings are almost three times those for non‐work time
savings (DfT 2012b Table 10 p42)
Despite its economic importance business travel actually comprises a minority of trips made in Great
Britain (GB) 85 of all trips made per year within GB and 88 of all miles travelled per year4 are
4NTS 2010 Tables 0409 and 0410 Note that the National Travel Survey excludes professional driver mileage
the UK NTS specifically excludes the following types of motorised trips as they are commercial rather than
personal travel trips made specifically to delivercollect goods in the course of work trips made by
professional drivers or crew in the course of their work trips made by taxi drivers if they are paid or charge a
27
made on employersrsquo business We can also see that there is a great deal of heterogeneity in who
makes business related trips and when they are made Cars and vans dominate the mode of travel
for business travellers as is apparent in Table A21
Table A21 Proportion of Business Trips by Mode (by Distance Travelled and by Trips Made)
Walk Bicycle Car van driver
Car van pass
Motor-cycle
Other private1
Local bus
Rail2 Other public3
All modes
By distance 02 02 730 82 03 06 07 115 53 1000 By trip 61 14 716 79 08 05 40 65 13 1000
1 Mostly private hire bus (including school buses) 2 Surface rail and London underground 3 Non-local bus taximinicab and other public transport (air ferries light rail) Source NTS 2011 Tables 0409 and 0410
Most business trips (60) start within the core of the working day (9am to 5pm) as can be seen in
Table A22 though 21 start before 9am and 18 after 5pm A greater proportion of business trips
start outside the core working day when looking at rail as 33 of business trips start before 9am
and 20 after 5pm
There also exist differences between the types of workers who make business trips as is apparent in
Table A23 Managerial and professional staff not only make more trips per person (averaging at
more than 1 per week) but also travel the furthest Whilst there is no NTS table to show it we
would also hypothesise that such workers dominate travel by rail (for business purposes) ndash given the
high wages of such travellers (DfT 2012a) and their propensity to travel further (see Table A23)
We can also see in Table A24 that whilst travel is more evenly split between different industrial
sectors (compared to occupations) employees in certain industries appear to travel further than
others These are employees in the high value service sector (financial and real estate) and those in
construction and agriculturefishing
fare for making a trip and trips made by professional driving instructors whilst teaching or driving their
vehicles in the course of their work
28
Table A22 Start Time of Trips (All Modes and Rail Only)
Start time All modes
Rail
0000 - 0059 0 0 0100 - 0159 0 0 0200 - 0259 0 0 0300 - 0359 0 0 0400 - 0459 0 0 0500 - 0559 1 2 0600 - 0659 3 9 0700 - 0759 7 13
Before 9am
0800 - 0859 10 10
0900 - 0959 8 6 1000 - 1059 7 4 1100 - 1159 7 4 1200 - 1259 7 4 1300 - 1359 7 5 1400 - 1459 7 5 1500 - 1559 8 7 1600 - 1659 9 11
Between 9am and 5pm
1700 - 1759 8 10 1800 - 1859 4 5 1900 - 1959 2 2 2000 - 2059 1 1 2100 - 2159 1 1 2200 - 2259 1 1
After 5pm
2300 - 2359 1 0
All day 100 100
Source NTS 2011 Table 0503
29
Table A23 Business Travel by Socio‐Economic Classification (All Modes)
NS‐SEC 2010
Average number of trips (per person per year)
Managerial and professional occupations 58
Intermediate occupations 38
Routine and manual occupations 20
Never worked and long-term unemployed occupations 2
Not classified3 26
All people (aged 16+) 35
Average distance travelled (miles per person per year)
Managerial and professional occupations 1516
Intermediate occupations 596
Routine and manual occupations 258
Never worked and long-term unemployed occupations 15
Not classified3 463
All people (aged 16+) 7291 Business purpose trip personal trips in the course of work including a trip in the course of work back to work This includes all work trips by people with no usual place of work (eg site workers) and those who work at or from home 2 = not applicable 3 Most of the people in the not classified category are full-time students
Source NTS2010 Table 0708 (edited)
30
Table A24 Business Travel by Industry (All Modes)
Industry group 200809
Average number of trips (per person per year)
Agriculture and fishing 88
Energy water mining etc 34
Manufacturing 24
Construction 69
Distribution and hotels 16
Transport and communication 25
Financial and real estate 54
Public administration education and health 50
Other service 57
All people (aged 16+) 40
Average distance travelled (miles per person per year)
Agriculture and fishing 931
Energy water mining etc 786
Manufacturing 717
Construction 1586
Distribution and hotels 356
Transport and communication 836
Financial and real estate 1349
Public administration education and health 597
Other service 761
All people (aged 16+) 780
Note Business purpose trip personal trips in the course of work including a trip in the course of work back to work This includes all work trips by people with no usual place of work (eg site workers) and those who work at or from home
31
A24 MeasuringtheValueofBusinessTravelTimeSavings
A241GBpracticeandtheCostSavingMethod
The 1960s heralded the first UK applications of social cost benefit analysis to transport projects
(Coburn et al 1960 Foster and Beesley 1963) By the 1970s transport cost benefit analysis theory
had been developed to a satisfactory state of the art and was widely accepted (Dodgson 1973
1974 Harrison 1974 Mohring 1976 Leitch 1978) In these early studies business travel was valued
using what has now been termed the cost saving method Some fifty years later the cost saving
method is still in use in the UK and in fact in much of the rest of the world where transport
appraisal is actively practised Eades (2000) sets out the approach used by the Department for
Transport in deriving business values for travel time savings
The cost saving method says that in a competitive labour and product market firms hire labour to
the point at which the value of the marginal product is equal to the wage rate Thus the value of the
time saving is equal to the marginal gross cost of labour including labour related overheads To
arrive at this conclusion a number of well documented assumptions are implied regarding the labour
market and the allocation of time between work and leisure (Harrison 1974) Specifically travel time
is assumed to be unproductive reductions in travel time are assumed to go into work not leisure
the labour and product markets are assumed to be competitive and there are no indivisibilities in the
use of time for production
A242AlternativeValuationApproaches
Alternative approaches to valuing business travel time savings are discussed in detail in Annex 1 and
also in Section 2 of the main report They are the Hensher model the Modified Cost Saving
ApproachRestricted Hensher Model and Willingness to Pay
A25 InternationalAppraisalPractice
When looking at international appraisal practice it is important to recognise that in many countries
no firm guidelines are provided The requirement on the transport analyst is to use best practice
methods In a 2005 survey of appraisal practice in the EU plus Switzerland Odgaard Kelly and Laird
(2005) found that lsquonational guideline valuesrsquo which are used in almost all appraisal circumstances
only exist in 10 of the 27 countries surveyed Seven of the 27 countries have no guideline values
whatsoever and the remaining countries have guideline values but there is no requirement to use
them In fact for four of the latter group of countries the guideline values are only rarely used
(Odgaard Kelly and Laird 2005 Table 51)
32
Looking at the ten EU countries where guideline values are provided and used in almost all
circumstances we find that three different valuation methods for business travel time savings are in
use As shown in Table 25 the cost saving method for valuing business travel time savings is the
most popular method Adjusted cost savingrestricted Hensher models have been estimated in
Sweden (Algers Hugosson and Lindqvist Dillen 1995) and the Netherlands (HCG 1998) Norway
used to use an adjusted cost savingrestructed Hensher method (Ramjerdi et al 1997) but in 2010
reverted back to using a cost saving approach Switzerland is unique in that it marks up the non‐
working time savings value (Bickel et al 2005 p118) The European Investment Bank (EIB 2005) and
the EC (Bickel et al 2006) also advocate the cost saving method
Table A25 Approaches to Estimating Business Values of Travel Time Savings (for
CountriesOrganisations with Guidelines for Appraisal)
Method Countries
Cost saving method Europe Denmark Finland France Germany Ireland Norway UK European Investment Bank EC
Non-Europe Australia New Zealand USA World Bank
Adjusted cost savingRestricted Hensher Europe Sweden Netherlands
Non-Europe ---
Hensher model Europe ---
Non-Europe ---
Willingness to pay Europe ---
Non-Europe ---
Other Europe Switzerland
Non-Europe
Source Odgaard Kelly and Laird (2005) updated to 2012 and to include Australia New Zealand Norway USA World Bank and EIB with authorsrsquo own work
Outside of Europe we find that the cost saving method also dominates In the United States
business values of time are based on wage rates with no mark up for labour related overheads
(Belenky 2011) In Australia the cost saving approach is also used (Austroads 2011) as it is in New
Zealand (Melsom 2003) In New Zealand occupations and industries are taken into account when
calculating wage and non‐wage costs by mode (BCHF 2002 Chapter 8) The World Bank also
advocates the cost saving method though wage rates are adjusted for the shadow price of labour
(Mackie Nellthorp and Laird 2005 TRN‐15) No country that we have surveyed uses either a
Hensher model or values derived from direct elicitation of willingness to pay by employers
Figure A21 Valuation of Business Travel Time Savings in Scandinavian Appraisal Guidance
Sweden and Norway have used the Hensher formula (or variants of it) since the mid 1990s but have both recently changed to a (modified) cost savings approach Denmark has always used a cost savings approach Sweden changed to a pure cost savings approach in 2008 after using Hensher-type formulas since the early 1990s As of 2012 a modified cost savings approach is used Here the BVTTS for train is reduced by 15 to account for productive travel time Norway changed to a pure cost savings approach in 2010 after using a Hensher-type formula since (at least) 1997 Sweden and Denmark do not differentiate the BVTTS with respect to mode or trip distance whereas Norway has a higher BVTTS for air trips due to higher average wage rates for air travellers In Swedenrsquos case it is acknowledged that the BVTTS should in principle be differentiated with respect to mode and travel distance due to wage rate differences but the available data have been too unreliable for this
Principles for ldquocost savingsrdquo calculations
All three countries use the wage rate plus overhead costs as an indicator for marginal labour productivity (MPL) The question whether wages are a good enough approximation of MPL arises regularly but no specific alternative has been suggested
Another discussion is how to define overhead costs Sweden currently uses only indirect labour taxes (social security charges and the so-called ldquoemployer taxrdquo) but no other overhead costs such as costs for office rents administrative support etc The Danish and Norwegian practices seem to be the same although this is not absolutely clear
Motivations for adopting the modified cost saving method
In both Sweden and Norway the crucial argument for abandoning the Hensher-type formula was that in the long run it was expected that workers would not transfer saved time to leisure but would instead transfer it to increased work That is in the Hensher formula r was argued to be zero The motivation for this has been that spending some time travelling outside normal working hours is part of the agreement between employer and employee This argument has been supported by the observation that despite substantial increases in travel speeds over several decades there are no indications that business travellers nowadays spend less of their leisure time on business trips (Metz 2004) hence there seems to be no indication that some of the travel time savings have been converted to leisure time
The debates in both countries seem to acknowledge that it is not enough to try to measure how a travel time saving would be divided between the employer and employee in the very short-term such as focusing on a particular trip The attempts at doing this during the 1990s are hence now viewed as misdirected and that an understanding of the r parameter needs to be based on the long-run effects
Neither Denmark nor Norway adjusts the BVTTS for productivity during the trip although the Norwegian debate acknowledges that this should be done in principle During the period 2008-2012 Sweden likewise had no productivity adjustment although this was based on the misunderstanding that consumer surplus could not be calculated when values of time were different on different modes Once this misunderstanding was corrected it was decided to adjust for productivity during the trip in the 2012 recommendations However the current Swedish recommendation of 15 productivity during train trips is rather arbitrary During the decision process two sources were used (Fickling et al 2008) and Lyons et al 2007) The 15 productivity figure does not directly relate to either of these studies
Current practice
33
34
The content of appraisal guidelines whilst interesting does not necessarily reflect the state of the art
in valuation methods This is because a pragmatic balance between data collection efforts and need
often has to be struck during development of the guidelines Issues of equity also influence the
methods adopted and the level of disaggregation in the values Furthermore guidelines also have to
be developed for the full spectrum of potential stakeholders and recognition therefore has to be
made in the guidelines for the practical realities of the modelling and evaluation methods that will
be employed There have therefore been a plethora of studies that have examined willingness to
pay by business travellers for travel time savings often with a demand forecasting perspective that
are more sophisticated in their valuation methodology than the cost saving method (Shires and de
Jong 2009 Abrantes and Wardman 2011 Hensher 2011) Patterns and trends in these empirical
studies of the value of business travel time savings are presented in Annex 2 of this study However
given that ultimately we are interested in amending national appraisal guidelines we briefly case
study Scandinavian practices where adjusted cost saving modelsrestricted Hensher models have
been implemented and recently altered (Sweden) and replaced by a cost saving approach in
Norway This is presented in Figure 1
A26 ImplementingtheCostSavingMethodinGreatBritain
With the cost saving method the value of the time saving is equal to the marginal gross cost of
labour including labour related overheads In essence the DfTrsquos approach has been to
Use NTS data to derive distance weighted annual incomes by mode of travellers As the NTS
only collects banded income data ndash the mid‐point of the income band is used
Calculate hourly incomes by dividing average annual incomes by 394 hours (which is the
average working week sourced from the New Earnings Survey)
Use the New Earnings Survey to estimate hourly wage rates for commercial vehicle drivers
and occupants
Use the Labour Cost Survey to estimate average non‐wage labour costs On average non‐
wage labour costs form 212 of the wage Uprate average hourly estimates by a factor of
1212 to give estimates of the gross cost of labour plus labour related overheads
Adjust estimates to correct unity of account and price and value base
The current values in webTAG unit 356 (DfT 2012a) were derived from survey data in 19992000
They have been updated to 2010 prices and values by reflecting changes in GDPcapita and inflation
Since these values have been derived the New Earnings Survey has been superseded by the Annual
Survey of Hours and Earnings (ASHE)
Effectively the approach is a two staged approach The first stage estimates the hourly wage of
travellers and the second estimates the nonwage labour costs We comment on these stages
separately
35
A261 DerivingtheHourlyWage
Over time the labour market alters and the way that different modes of transport are used by
different sections of the business community may also change Given that the current average
modal business time saving values were derived from 1999 to 2001 NTS data they are arguably
getting to the point of requiring an update Even if the existing approach is maintained there is a
need to update the current values using more recent travel survey data
Given that the cost saving method requires an estimate of the hourly wage ideally a dataset that is
robust in earned income data should be used The NTS is not such a dataset This is for three
reasons Firstly the personal gross annual income reported in the NTS is from all sources (earnings
benefits pensions savings self‐employment multiple jobs etc) Secondly the survey does not
record the number of hours worked by individuals thus one cannot obtain a robust estimate of an
hourly wage rate Finally the income data is only banded More appropriate datasets for deriving
hourly incomes would be the Annual Survey of Hours and Earnings (ASHE) and the Labour Force
Survey (LFS) These form the basis of ONS estimates of earnings The challenge of course is to link
these more robust estimates of hourly earnings to observed travel behaviour to derive distance
weighted estimates of the value of business travel time savings by say transport mode
The current approach could bias the values Firstly total annual income exceeds earned income The
Family Resources Survey (DWP 2012 Table 23) indicates that earned income comprises on average
about 85 of total income for households with a head of household aged between 25 and 59 That
is using total income as an approximation to earned income overestimates earned income by about
18 (on average across the workforce) Secondly hours worked vary significantly by occupation
Managers and senior officials work about 15 more hours than the average worker56 As these
occupations travel the most (see Section 2 of this report) then using average hours worked by the
average worker risks introducing an upward bias to the estimated hourly wage rate of those
travelling on employersrsquo business Furthermore as travellers will self‐select between modes any
upward bias will vary between modes and will be largest for modes used by those who work the
longest hours (ie modes preferred by managers senior officials and professionals) Ultimately how
significant any biases are is an empirical question that needs further analysis before conclusions can
be drawn
An alternative approach to estimate the distance weighted hourly wage by mode would be to use
each dataset to its full strength Therefore the NTS would be used to describe the types of business
travellers using each mode (in terms of distance weighted proportions by occupation and potentially
5 Census 2001 Table CAS040 6 Some of the additional hours worked by managers and senior officials will not be lsquoofficiallyrsquo contracted but
having an accurate understanding of their hours is essential to calculate their effective hourly wage
36
industrial sectors7) and the LFS or ASHE would be used to derive hourly wage rates for each of these
categories of business travellers ASHE is a survey of employers and responses are based on
documentary evidence whereas responses in LFS are based on individual recollection sometimes by
proxy respondents and sometimes without reference to payslips ASHE is therefore generally
considered more reliable (Ormerod and Ritchie 2007) The ASHE sample is also considerably larger
than LFS although is not as representative of low‐paid workers as LFS does not include unpaid
overtime hours and does not cover self‐employed which the LFS does we discuss the self‐
employed below The LFS is therefore arguably the better dataset from which to derive hours
worked whilst ASHE is considered the best dataset to describe earned income Such an enhanced
approach is similar to that used in New Zealand (BCHF 2002 Chapter 8)
Ultimately the question of whether the existing methodology for calculating distance weighted
average hourly earnings by mode is a good approximation to reality is an empirical question We
have raised a number of issues that would suggest that upward biases exist in the current
methodology (ie the current values of work travel time savings are too high) However how
significant those biases are is an empirical question that needs further analysis before any
conclusions can be drawn
A262 Non‐WageLabourCosts
Our discussions with the ONS indicate the Labour Cost Survey is the most comprehensive dataset for
non‐wage labour costs in the UK It is re‐compiled every four years by the ONS as part of ongoing
commitments to Eurostat Partial annual updates are also made The latest survey relates to 2008
A 2012 survey will also be undertaken which should become available in 2014 once Eurostat has
published it The Labour Cost Survey is not a survey in the strictest sense but is in fact an analysis of
existing datasets ndash the main ones of which are ASHE LFS and the Annual Business Inquiry (ABI) The
main sources of non‐wage labour costs are employersrsquo national insurance and employersrsquo pension
contributions Other non‐wage labour costs are also estimated including paid annual leave paid
maternitypaternity leave training costs sick pay benefits in kind etc Mark‐up factors from
employee wage costs to gross labour costs to the firm per hour of employment are available for the
economy as a whole and by industrial sector
7 The NTS contains National Statistics Socio‐economic Classification (NS‐SEC) data that gives broad occupational data It
also contains data on standard industrial sector (SIC) These are also contained in the LFS and ASHE If disaggregating by
mode NS‐SEC and SIC sample sizes are likely to be small giving imprecise estimates of both distance weighted proportions
(from the NTS) and possibly earned income from the LFS or ASHE Some aggregation of the NS‐SEC categories and SICs will
be necessary Additionally it may be necessary to pool several years of the NTS data to obtain reliable estimates of mileage
weighted proportions at whatever level of disaggregation NS‐SECSIC is chosen Another estimation issue that may arise is
that if business related travel is a function of income rather than job function than an incomemileage distribution may
arise within any specific NS‐SECSIC sample segment Arguably business travel should be a function of the job undertaken
by the worker and not income ndash however there may be whether there is sufficient data in the NTS to identify job functions
accurately enough and some correlations with incomewage may still be present
37
The current non‐wage labour costs are based on the 2000 Labour Cost Survey The existing business
values of time could therefore be updated to be consistent with the 2008 survey (the latest available
survey) The proportion of non‐wage costs varies by industry with skilled service sector industries
incurring higher non‐wage costs than agricultural construction manufacturing and low skilled
service sector employment As travel behaviour (distance travelled and mode choice) varies by
income and job type there is therefore an argument that the non‐wage mark‐up should also be
allowed to vary by mode This would require an analysis of the NTS to indicate the industrial
sectoral split by mode Such an enhanced approach is similar to that used in New Zealand (BCHF
2002 Chapter 8)
A263 ProfessionalDrivers
Employed professional drivers would be treated the same as other employees in this revised
methodology ndash in the sense that the ASHE or LFS would be used to derive their hourly wage
A264 Longrunmarginalcosts
From a cost benefit analysis perspective we are not strictly speaking interested in the marginal
product of labour per se This is because in response to changes in labour productivity the firm will
re‐balance factor inputs (other classic inputs being capital and land) to maximise profits What we
are primarily interested in therefore is how the long run marginal costs to the firm alter in response
to changes in labour productivity As far as we are aware there is no comprehensive evidence on
this For marginal changes in business travel time we would consider that short run responses that
is all inputs aside from labour being held constant would be a suitable approximation
A27 Summary
Business travel whilst forming only a small proportion of the trips made in the UK is a very important
in economic terms Business travel is also very heterogenous in terms of who makes the trips when
those trips are made and how they are made (mode) Importantly
40 of business travellers start their journeys outside of the core working day (9am to 5pm)
The number of and length of business trips increases with socio‐economic
statusoccupation and also by corollary with income and
Travel varies by industrial sector ndash albeit not as much as by occupation
In terms of international appraisal practice the cost saving method dominates valuation methods
used to derive values published in official guidance The adjusted cost saving approach is used in the
Netherlands and in Sweden
38
Currently business values of time used for appraisal in Britain have been derived from the 199901
National Travel Survey (for annual incomes by mode) and the 2000 Labour Cost Survey (for average
non‐wage costs) The New Earnings Survey was used to derive hours worked and the hourly wage of
commercial drivers For a number of reasons these values are considered questionable Firstly the
data upon which they are based are old and secondly the income data is based on the NTS rather
than a combination of the ASHE and the LFS The NTS does not give reliable hourly earned income
data A potentially more robust method to derive hourly wage plus non‐wage costs for travellers by
mode would be to use the NTS to describe who travels on which mode (in terms of occupation and
industry) and other datasets ndash the Labour Cost Survey the ASHE and the LFS ndash to give estimates of
the hourly wage and hourly non‐wage costs by occupationindustry Such an approach would be
similar to that adopted in New Zealand
Annex 2 References
Abrantes PAL and Wardman MR (2011) Meta‐analysis of UK values of travel time An update
Transportation Research Part A 45 1ndash17
Algers S Hugosson B Lindqvist Dilleacuten J (1995) 1994 aringrs tidsvaumlrdestudie Slutrapport Del 1
Resultat Transek AB Solna
Austroads (2011) Updating Austroads RUE Unit Values and Related Methodologies Austroads
Research Report AP‐R37311 Report dated February 2011 Sydney Australia AUSTROADS
Barrington A (1977) Valuing Time Savings in Developing Countries ndash A Comment Journal of
Transport Economics and Policy 11(2) pp195‐201
Beca Carter Hollings amp Ferner Ltd (2002) Review of Benefit Parameter Values for Economic
Evaluation Report to Transfund New Zealand Report dated April 2002
Belenky P (2011) The Value of Travel Time Savings Departmental Guidance for Conducting
Economic Evaluations Revision 2 Memo dated 28 Sept 2011 Available online at
Bickel P Burgess A Hunt A Laird J Lieb C Lindberg G Odgaard T (2005) State‐of‐the‐art in
project assessment HEATCO Deliverable 2 HEATCO ndash Developing Harmonised European
Approaches for Transport Costing and Project Assessment Funded by the 6th Framework RTD
Programme IER Stuttgart Germany Available online at httpheatcoieruni‐stuttgartde
Bickel P et al (2006) Proposals for harmonised guideliens HEATCO Deliverable 5 HEATCO ndash
Developing Harmonised European Approaches for Transport Costing and Project Assessment
Funded by the 6th Framework RTD Programme IER Stuttgart Germany Available online at
httpheatcoieruni‐stuttgartde
39
Coburn TM Beesley ME and Reynolds DJ (1960) The London‐Birmingham Motorway Road
Research Technical Paper 46 London HMSO
Department for Transport (DfT) (2012a) Values of time and operating costs TAG Unit 356 August
2012 London Department for Transport Available online at lthttpwwwdftgovukwebtaggt
(Accessed 23rd August 2012)
Department for Transport (DfT) (2012b) Economic Case for HS2 Updated appraisal of transport user
benefits and wider economic benefits A report to Government by HS2 Ltd January 2012 Available
online at lt httpwwwdftgovukpublicationshs2‐economic‐case‐appraisal‐updategt (Accessed
26th October 2012)
Dodgson JS (1973) External effects and secondary benefits in road investment appraisal Journal of
Transport Economics and Policy 7 (2) pp 169‐185
Dodgson JS (1974) Motorway Investment Industrial Transport Costs and Sub‐Regional Growth mdash
a case study of the M62 Regional Studies 8 (1) pp 75‐91
Eades D (2000 Unpublished) Creating new values of working time (HEN2) Internal note to the
Department for Transport Note dated April 2000
European Investment Bank (2005) RailPAG Rail Project Appraisal Guidelines Brussels EIB Available
online at httpwwweiborginfocentrepublicationsallrailpag‐railway‐project‐appraisal‐
guidelineshtm (Accessed 26th October 2012)
Fickling R Gunn H Kirby H Bradley M amp Heywood C (2008) The productive use of rail travel
time and value of travel time saving for travellers in the course of work ETC Proceedings Available
online at lthttpwwwetcproceedingsorgpaperthe‐productive‐use‐of‐rail‐travel‐time‐and‐value‐
of‐travel‐time‐saving‐for‐tra‐1gt (Accessed 26th October 2012)
Foster CD and Beesley ME (1963) Estimating the benefits of constructing an underground line in
London Journal of the Royal Statistical Society Series A 126 (1) pp 46‐58
Fowkes AS Marks P and Nash CA (1986) The value of business travel time savings Institute for
Transport Studies University of Leeds Working Paper 214
Hague Consulting Group (HCG) (1998) Value of Dutch Travel Time Savings in 1997 Final report A
report for Rijkswaterstaat ndash AVV by Hague Consulting Group The Hague Netherlands
Harrison AJ (1974) The economics of transport appraisal Croom Helm London
Hensher DA (1977) Value of Business Travel Time Pergamon Press Oxford
40
Hensher DA (2011) Valuation of travel time savings In de Palma A R Lindsey E Quinet and R
Vickerman(eds) A Handbook of Transport Economics Cheltenham Edward Elgar pp135‐159
Howe J (1976) Valuing time in developing countries Journal of Transport Economics and Policy
10(2) pp113‐125
Leitch G (1978) Report of the Advisory Committee on Trunk Road Assessment (ACTRA) London
HMSO
Lyons G Jain J amp Holley D (2007) The use of travel time by rail passengers in Great Britain
Transportation Research Part A Policy and Practice 41(1) 107‐120
httpdoi101016jtra200605012
Mackie PJ Nellthorp J and Laird JJ (2005) Toolkit for the Economic Evaluation of Transport
Projects Washington DC World Bank Available online at
httpwebworldbankorgWBSITEEXTERNALTOPICSEXTTRANSPORTEXTROADSHIGHWAYS0con
tentMDK20464962~pagePK148956~piPK216618~theSitePK33866100html (accessed 26th
September 2012)
Mackie PJ Jara‐Diaz S and Fowkes AS (2001) The value of travel time savings in evaluation
Transportation Research Part E 37 pp91‐106
Mackie PJ Wardman M Fowkes AS Whelan GA Nellthorp J and Bates J (2003) Value of
Travel Time Savings in the UK A report to the Department for Transport Institute for Transport
Studies University of Leeds UK
Melsom I (2003 Unpublished) Review of the Benefit Parameters Used in Transfund New Zealandrsquos
Project Evaluation Procedures Information Note Transfund New Zealand Note dated February
2003
Metz DA (2004) Travel time ndash variable or constant Journal of Transport Economics and Policy
38(3) pp333‐344
Odgaard T Kelly CE and Laird JJ (2005) Current practice in project appraisal in Europe ndash Analysis
of country reports HEATCO Deliverable 1 HEATCO ndash Developing Harmonised European Approaches
for Transport Costing and Project Assessment Funded by the 6th Framework RTD Programme IER
Stuttgart Germany Available online at httpheatcoieruni‐stuttgartde
Ormerod C and Ritchie (2007) Linking ASHE and LFS can the main earnings sources be reconciled
Economic amp Labour Market Review 1(3) Office for National Statistics
Ramjerdi F Rand L Inger‐Anne F Saeligtermo I‐AF and Saeliglensminde K (1997) The Norwegian
Value of Time Study Transportoslashkonomisk Institutt (TOI) Oslo Norway
41
Shires JD and de Jong GC (2009) An international meta‐analysis of values of travel time savings
Evaluation and Program Planning 32 pp 315ndash325
42
ANNEX3REVIEWOFEVIDENCEONBUSINESSTRAVELTIMESAVINGS
A31 Introduction
A311 Aims
This review is primarily concerned with the empirics rather than the theory of estimating values of
time for business travellers We are here concerned with existing evidence whether UK or
elsewhere regarding the value of business travel time savings (VBTTS) along with evidence on
parameters that can be used to deduce business time valuations and methodologies for estimation
This review of empirical evidence has three central themes
The first addresses the major national value of time studies insofar as they provide insights
into business time valuations and also other significant studies that we have identified It
focusses upon
Evidence on the p q and r parameters that input to the Hensher equation
Evidence obtained from RP and SP studies
Implications for appraisal and in particular challenges to the widely used cost saving
approach
Other insights and evidence
The second theme is to cover empirical evidence more generally with an emphasis on the
insights provided by our own data sets assembled for the UK and also Europe as a whole as
part of meta‐analyses of valuations of travel time savings
The final theme considers other evidence that provides insights into the VBTTS These
include who pays for the time savings and to whom the benefit accrues self‐employed
compared to employed business travellers high speed rail evidence and methodological
issues
A312 Scope
This review focusses solely on briefcase travellers This annex complements the material discussed in
section 31 of the main report in providing more detail about the original studies The key material
and discussion from the main report that is not repeated here is cross‐referenced We generally here
report values from studies in the original units they were estimated and have as far as is practical
reproduced the questions that underpin the evidence on the Hensher parameters
A313 Structure
The structure of this annex is as follows Section 2 sets outs some definitions of terms relevant to the
research findings reviewed in this annex Section 3 adds detail to our review of major national value
of time studies and other significant studies contained in section 312 of the main report with an
emphasis on those that have sought to compare different approaches or have investigated the
Hensher equation as a means of estimating the VBTTS Other willingness to pay evidence covered in
section 313 of the main report is here the focus of section 4 The remaining two sections point out
what is covered in the main report in terms of its coverage of specific issues that arise from the
review of many studies and its conclusions and recommendations
A32Definitions
The most common alternative to the Cost Savings Approach to the estimation of VBTTS is the
Hensher Equation This is gives a comprehensive conceptual framework for valuing VBTTS which has
found intuitive if not practical favour The equation is given by the following
rVLVWrMPFMPLpqrVBTTS )1()1( (1)
where
r is the proportion of travel time saved that is used for leisure
p is the proportion of travel time saved that is at the expense of work done while travelling
q is the relative productivity of work done while travelling relative to at the workplace
MPL is the marginal product of labour as in the cost savings approach
MPF is the extra output due to reduced (travel) fatigue
VW is the value to the employee of work time at the workplace relative to travel time
VL is the value to the employee of leisure time relative to travel time
[] is the portion of VBTTS that is associated with the employer
is the portion of VBTTS that is associated with the employee
Whilst the Hensher equation has conceptual appeal practical implementation of the complete
framework is difficult The MPF and VW terms are especially difficult to estimate and it is not
unusual to drop these from consideration we shall follow that convention here in what is often
termed the Modified Cost Saving Approach
rVLMPLpqrVBTTS )1( (2)
Another important definitional point first raised by Fowkes et al (1986) is what p and r cover
These two parameters were defined above but two related terms have been widely used These are
what Fowkes et al (1986) term
43
44
p which is the average amount of time spent working during a journey
r which is the proportion of total travel time which occurs in leisure time
A33 ReviewofNationalValueofTimeandOtherSignificantStudies
There have been a number of significant studies that have explored and estimated VBTTS This
review is not restricted to UK evidence but takes a broader perspective given that many of the issues
addressed even if not the absolute VBTTSs themselves are transferable across contexts
For the studies identified and reviewed below we summarise the key findings and where
appropriate and possible provide comments on those findings We have generally attempted to
record the precise questions asked since these are important in interpreting the results as well as
providing an account of each study
The main issues arising from each study are
the evidence on the p q and r parameters
how any estimated values relate to labour costs and how they vary by method and
methodological issues and particular insights into business valuations
Hensher (1977)
This is the pioneering piece of work that first empirically challenged the convention of valuing
business travel time savings at the gross wage rate Note however that it was first codified by
Fowkes et al (1986) based on the concepts elucidated by Hensher (1977)
With regard to the productive use of time Hensher asked
During this last domesticinternational business air journey what percentage of the travel
time do you estimate you devoted to work (ie writing reading thinking discussing work
matters) on each of the following stages of your journey
To the airport on your outward trip
During the flight in the aircraft on your outward trip
From the airport on your outward trip
To the airport on your return trip
During the flight in the aircraft on your return trip
From the airport on your return trip
If some time was devoted to work they were then asked
45
How effective do you think the time spent working during this journey was by comparison
with the equivalent time spent working in your office
with the response required as a percentage
The mean proportions of time spent working (p) for the various categories of trip stage and type of
flight are set out below in Table A31 The proportions are larger for domestic (Dom) than the very
much longer international (Int) journeys and tend to be larger for the outward journey They do
indicate quite modest amounts of travel time spent working with the least on access on the
outward leg and egress on the return leg where car is most likely to dominate
Table A31 Mean Proportions of Time Spent Working (Hensher 1977)
OUTWARD TRIP RETURN TRIP
Access Flight Egress Access Flight Egress
Dom Int Dom Int Dom Dom Dom Int Dom Int
174 96 448 231 481 329 270 145 270 82
The equivalent effectiveness of time spent working during a business air journey was 61 for
domestic travel and 51 for international travel Given that overall p and also q are relatively low
the impact of productivity on the valuations is relatively low
Time savings devoted to leisure are proxied by the amount of business travel time spent in own time
(r) The proportion of travel that was undertaken in the employeersquos own time is reported in Table
A32
Table A32 Mean Proportions of Travel Time in Own Time (Hensher 1977)
OUTWARD TRIP RETURN TRIP
Access Flight Egress Access Flight Egress
Dom Int Dom Int Dom Dom Dom Int Dom Int
62 16 46 8 45 31 64 55 72 54
In general a significant amount of travel is done in the employeersquos own time and perhaps
surprisingly it is greater for domestic than international trips
When the productivity and leisure time effects are both allowed for the value of business travel
times savings for domestic and international travellers are 68 and 30 of the average gross salary
cost respectively Removing the productivity effect would yield figures of 85 and 33 respectively8
8 Our understanding is that Hensher assumed VW to be the same as VL (Hensher 2011) whereas it is more likely that business travellers are indifferent between travelling (working or not) and working in the office which is VW of zero (Fowkes et al 1986)
46
As part of a survey of employers they were asked to imagine a situation where an employee could
save time by an unspecified new means at the egress end of a domestic air journey and what
monetary outlay ranging from $1 to $20 (12 different levels) would be permitted The implied value
in 1973 prices was $436 per hour implicitly for domestic trips The conventional marginal
productivity approach would imply a valuation of $510 per hour for domestic journeys
Hensher noted that individuals are likely to exaggerate the amount of time spent working and the
relative productivity of time spent working while travelling relative to at work so as not to appear
lazy
UK National Value of Time Study (MVA et al 1987)
This was the first of the so‐called national value of time studies Whilst its scope was broad the
remit was primarily private travel and the business travel element was largely left to a parallel
research council funded project that is discussed below Employersrsquo business trips were considered
but only using SP methods and with uncertainty as to what extent they reflected employer
sanctioned or personal willingness to pay Unfortunately the self‐employed sample was too small to
enable a distinction to be made Nonetheless the study made a number of useful comments on
business time valuations
It conceded in 1987 that the possible shortcomings of the assumptions underpinning the cost
saving approach have been ldquowell‐rehearsedrdquo It went on to state ldquoOn the other hand there are a
number of empirical questions which are in principle capable of resolution For instance what values
of time do individuals travelling in the course of work reveal on the basis of their travel choices And
what use is likely to be made of time savingsrdquo
The report distinguishes between those for whom travel is the nature of their job such as
professional drivers and briefcase travellers In the former case it is argued that in the short run
not all time savings can be converted into extra output due to scheduling inflexibilities and even in
the longer run some of the time saved might accrue to leisure as a result of collective bargaining In
such cases non‐work valuations would be applicable for the relevant proportion of time saved To
the extent that the time saving is converted into a wage increase in the longer run this would lead
to some reduction in the demand for labour and hence enforced leisure time and hence a leisure
value of time would be appropriate
Thus whilst the study recognises that even for professional drivers the wage rate related price can
overstate the benefits of the time savings ldquothe difficulty with this argument is the paucity of
empirical data on which to judge the extent of any such adjustment It is for that reason of
practicability rather than anything else that the implicit assumption is made that all working time
saving is converted into extra productive employmentrdquo
For briefcase travellers the vulnerability of the argument is accepted It is stated that ldquoWhere
neither the total job content or the required hours of work are clearly specified and where the
47
travel mode used may permit some work to be undertaken during the journey the convention
based on the marginal productivity theory might appear to break down completelyrdquo Some business
travel time particularly for longer distance trips is done in the employeersquos own time where the
opportunity cost to the employer is zero but there is a benefit to the employee of a time saving that
should be accounted for
The study suggests that an appropriate means of estimating their valuations is through the time‐cost
trade‐off choices they make when making business trips
UK Business Travel Study Fowkes et al (1986)
This SERC funded study into business travel time values paralleled the first UK national value of time
study where non‐business travel was predominant It did not examine commercial vehicles but was
confined to briefcase travellers
The study was both theoretical and empirical It appraises the traditional cost saving approach and
considers the implications for other estimation methods It made use of two surveys of long distance
business travellers and one survey of employers being novel in its use of SP methods in this market
to complement RP based approaches It was one of the first surveys of employers and remains one
of the few
It pointed out that Hensher (1977) departed from the conventional wage rate approach by
recognising that business travel might occur in what is leisure time work might be undertaken
during the journey and the employee might not be indifferent between working in the office and
travelling
The study also identified two studies conducted in the UK in the early 1970s that estimated business
valuations from RP data on the choices between air and rail that found values somewhat lower than
the wage rate It stated that ldquosince revealed preferences are the product of both the constraints on
choice imposed by company travel policy and the preferences of travellers themselves it is difficult
to interpret such resultsrdquo They may be the joint outcome of employersrsquo and employeesrsquo
preferences to save time As such they might be expected to drive behaviour and hence be
appropriate for forecasting but they do not necessarily reflect the sum of the employerrsquos and
employeersquos valuations to save time
As a result of these findings it was recognised that investigations of both the willingness to pay of
employers and of employees would be necessary but ldquoeven this is far from straightforwardrdquo
because there are difficulties in identifying within organisations those who can speak authoritatively
about company decision making whilst for employees it is necessary to create a situation where they
will incur the costs and receive the benefits of a faster journey
This study pointed out that Hensher ( 1977) had specified the productivity element in terms of the
proportion of the overall time spent working which they termed p rather than the proportion of
48
the time saved that would have been spent working which is p If the work can be done even with
the time savings which is possible where p is not equal to one it is likely that p will lie between
zero and p It also pointed out that instead of specifying r as the proportion of time saved that
would be devoted to leisure they used the proportion of total travel time which occurs in leisure
time termed r They state that ldquoSince for some people travel time savings will be replaced by extra
work on other days we would suggest that on average the appropriate value of r lies between zero
and r Whilst a recurring theme in the literature we do not feel that the failure to distinguish r and
r is a serious one but p and p could well be somewhat different
The study covered four methods of valuing business travel time
Wage rate approach
Employerrsquos Stated Preference
Revealed Preference
Synthetic Approach using p q r and employeesrsquo valuations and the Hensher equation
Three surveys were used as the basis for the value of time calculations all covering long distance
trips which were defined as those over 50 miles
Telephone survey of 311 organisations split between the South East and North East of
England and focussing on their travel policies
A self‐completion questionnaire distributed amongst employees of the employers contacted
who agreed to participate This collected RP and SP data for 442 travellers (and was termed
the ORGN sample)
A very similar self‐completion questionnaire of 411 rail travellers on the East Coast Main
Line (and was termed the ECML sample)
Employersrsquo Survey
Employers were asked how employees would make a day return trip between London and
Newcastle and then the following question
Now suppose a first class (only) premium accelerated rail service between London and
Newcastle was introduced saving one hours travel time Would senior staff be allowed to
use the service if the extra cost was pound5 helliphellip was pound20 helliphellip was pound50 And what about other
staff
In terms of current SP methodology this is a crude approach but it is nonetheless pioneering The
value of time was deduced from the cumulative frequency of responses by interpolation The results
showed that
Time savings of what were termed senior staff were valued around 2frac12 times more highly
than for other staff
49
The implied valuations varied by industry type size of organisation and the cost of the mode
used
The values were positively correlated with incomes
For senior staff the companies were on average prepared to pay more than the gross labour costs
but broadly similar to the wage rate for other staff The authors speculate that the former could
reflect the employerrsquos valuation of the disutility incurred by its staff in making business trips On
average the employerrsquos valuation was pound12 per hour
Employeesrsquo Stated Preference
Long distance business travellers were asked to consider a hypothetical 300 mile each way round
trip The available options were air first class rail standard class rail and car defined in terms of
return cost departure time from home and arrival time back at home A fixed lump sum of pound100
would be given by their employer for travel expenses with the respondent paying or keeping the
difference on the actual cost The four alternatives were ranked in order of preference and 12 such
rankings were presented
As far as we are aware this was the first study to aim to estimate employeesrsquo personal values for
time savings incurred during a business trip It was found that the values increased strongly with
income and that values of time savings for journeys starting very early in the morning were
somewhat larger The average values at around pound7 per hour are slightly over half the employersrsquo
average valuation of around pound12 per hour
Employeesrsquo Revealed Preference
The employeesrsquo survey also asked for RP information for their actual and best alternative mode This
allowed models to be developed explaining the choice between car and rail and between air and rail
Only around a third faced a time‐cost trade‐off essential for precise value of time estimation This
combined with the small sample sizes of 234 for the car and rail model and 130 for the air and rail
model meant the time and cost estimates are not precisely estimated Nonetheless the values of
time averaged around pound13 per hour not dissimilar to the employer based values It is clearly higher
than the SP values since the latter reflected a valuation based on personal rather than company
willingness to pay
Synthetic Approach
The study evaluated a modified Hensher approach with the marginal product of labour amended by
the (1‐r‐pq) term and the inclusion of VL Compared to the full Hensher approach VW was assumed
zero and MPF was also assumed zero or else is included within employeesrsquo SP valuations
50
Using the terminology set out above the business travellers were asked to record a log of their most
recent long distance business trip and to indicate how much time they spent working on the trip
(p) and their normal hours of work and salary from which r and MP were calculated
The figures in Table A33 below unsurprisingly indicate that rail is the most productive mode and car
the least Relative productivity is similar between work and travelling for all modes The larger r
values for rail and air might be because once access and egress are accounted for these journeys
take longer and hence incur more out of hours travel
Table A33 Hensher Parameter Estimates (Fowkes et al 1986)
Parameter Car Rail Air
p 003 020 014
q 101 095 099
r 032 042 042
Implications for Appraisal
Table A34 below sets out the values of time in pound per hour from the different methods considered
in this study Whilst the relationships apparent between mode and valuation for the employersrsquo
stated preference and the revealed preference conflict with each other the exploratory nature of
this pioneering study and the precision with which the values are estimated should be borne in
mind However the results do show a reasonably high degree of similarity across methods Fowkes
(2001) stated that ldquoNevertheless it is easy to see why Table 1 [of their report] was not thought to
give any great support to calls for a move away from the current approach towards use of the
Hensher formulardquo
Table A34 Fowkes et al (1986) UK Business VoT Study (poundhr 1985 prices)
Method Car Rail Air
Wage Rate Approach 103 98 119
Employersrsquo Stated Preference1 120 120 120
Revealed Preference 141 126 115
Synthetic (Hensher) r = r p = 0 r = r p = p
104 101
101 77
100 83
Note We have averaged over the ECML and ORGN samples 1 This is the overall SP figure reported
in the paper
The personal valuation of business travel time savings where a strong income effect was apparent
was between 611 and 621 times larger than the official equity values of time for non‐work
journeys The ratio is over 4 even for the lowest income group of business travellers
This was at least in the UK context a pioneering study and the conclusions are worth recounting
particularly since its findings influenced the Department for Transportrsquos retention of the cost saving
method
51
Whilst we find good reason to suppose that much of the time savings in our sample will be
devoted to leisure we still find that these time savings are valued highly by employers and
employees alike Perhaps this is not surprising the reason why we expect time savings to be
used for leisure is that they accrue on (often extremely) unsocial hours
For evaluation purposes the issue is less clear cut The value of time savings has been shown
for our samples to vary significantly according to the valuation methodology adopted
Although we do not possess sufficient evidence with which to decide unequivocally on the
most appropriate to use we believe that the lowest value that it would be reasonable to
contemplate are those which assume that all time savings would be devoted to leisure
activities but that any work undertaken en route would still be done and which use
employeesrsquo stated preference values adjusted for equity considerations This gives values in
the range of 40‐57 of the wage rate approach value Only a modest use of time savings for
work purposes is needed to obtain values close to the wage rate approach value for instance
assuming that the proportion of time savings devoted to work equals the proportion of travel
time in normal working hours will do this
In short although we find no empirical support for the assumptions upon which the present
valuation conventions are based our empirical work suggests these conventions yield values
which are approximately correct
This study did not claim to provide representative values of time What it did aim to do and achieve
was to compare different methods of estimating the values of time However the relationships
apparent do not necessarily apply to shorter distance trips whilst it is possible that the relationship
between the values might have varied over time either with methodological advances or more
significantly with changes in the characteristics of business travel
UK 1994 Study (Hague Consulting Group et al 1999)
Unlike the 1987 national value of time report an explicit objective of this national study was to
derive values of time for work as well as non‐work time Business travel is covered in four aspects
Explicit consideration of the application of the Hensher approach to business travellers
The main car usersrsquo value of time experiments which covered employerrsquos business trips
A repeat of the 1987 studyrsquos analysis of urban car usersrsquo route choices in Newcastle but
including business travel in the RP element
A study of the SP choices of freight operators9
9 Although this was not restricted to the value of time but will also cover operating costs and the value of the commodity
We do not cover this aspect of the study here
52
p q and r evidence
The value to the employer of changes in travel time for the employee (EVoT) was specified as
EVoT = W(a‐bc)
where W is the wage rate inclusive of overheads a is the fraction of the time variation that impacts
on time spent working often referred to as 1ndashr where r is the proportion of travel time saved that is
used for leisure b was specified as the fraction of travel time already spent doing some work which
is p and c is the productivity of work during travel relative to work done elsewhere which is
typically referred to as q
The questions specifically asked of business travellers relating to the formula above were
Suppose that the business trip that you were making when you received this questionnaire
had taken 15 minutes longer as a result of congestion on the roads Would that extra time
have been paid by your employer or would it have mostly come out of your own time
and
Did you use any of the time during that trip to do work which you otherwise would have done
elsewhere for example preparing for a meeting conversations on a portable telephone etc
If so about how much time
Approximately how long would that same work have taken you if you had done it at your
office or at home
The averages for a b and c across the entire business travel sample were 0537 0043 and 102 Not
surprisingly b (p) is low for car given the limited opportunities to work during a car journey
particularly in 1994 The value of r (1‐a) seems high given that many trips would have been made in
normal work hours
The variations in p q and r across a number of dimensions are given below P is higher for
motorways and lower for deliverypickup as expected but the effect is slight and there is hardly any
variation across categories Similarly q is closely centred around one
There is more variation in r with it higher for journeys made after 1600 as might be expected whilst
those attending a seminar which presumably takes up the whole day as well as those attending a
meeting would be more likely to incur the extra travel time in their own time The high figure for
self‐employed could be because there is little point paying themselves extra as a result of a delay
There is a slight but not convincing effect of the expected form from journey duration
53
Table A35 p q and r values (HCG et al 1999)
p q R
Before 10 003 108 042
1000 to 1600 005 101 044
After 1600 005 101 061
10‐30 mins 003 111 047
31‐60 mins 004 101 041
61‐120 Mins 005 100 043
gt 120 mins 005 101 054
Self Employed 003 096 081
Employed 004 102 036
Meeting 006 100 051
Visit Client 005 104 044
Visit Branch Office 004 100 040
Attend Seminar 003 078 066
Deliverypickup 001 098 045
Other Purpose 002 105 047
Motorway 006 098 046
Trunk 004 106 046
Urban 002 099 047
Time Save to Employer 005 105 000
Time Save to Self 003 097 100
Given a gross wage rate of around pound185 per hour the average employer value of time is just over
pound9 per hour However as was pointed out the various components of the Hensher formula are not
independent for example those with higher salaries are more likely to work while travelling
Adopting a sample enumeration approach based on each individualrsquos wage rate and their own a b
and c the average is a little lower at pound88 per hour
Employerrsquos Business Trips SP
There were two SP exercises relating to business (and indeed other) travel The first termed SP1
offered trade‐offs between time and cost and was intended to obtain a personal value of time for
journeys made on company business The respondents were told
If you did not actually pay for the journey yourself please assume that you would receive a
fixed amount of reimbursement equal to the current journey cost so that any additional or
saved costs would go to you10
10 Note that four of the twelve questionnaires (TA TC MB MD) deliberately did not include this text
54
The second SP exercise relating to business travel termed SP311 offered choices between an
untolled A road option and a tolled urban road trunk road and motorway Business travellers were
told
If you think that an employer would reimburse the toll cost then this should be taken into
account when making your choice
The statement about a fixed reimbursement had no significant effect on the cost coefficient in the
business model Those who were reimbursed had a lower cost coefficient but surprisingly it would
not be zero but rather only 20 to 30 less It was concluded that ldquoOverall the effect of cost
reimbursement is not as strong as one might expectrdquo Whilst it was claimed that ldquoall respondents
behaved to some extent as if the SP cost changes would come out of go into their own pocketrdquo
there is nonetheless an element of uncertainty as to what the valuations represent
In distinguishing additionally between whether it was the employerrsquos or the respondentrsquos time and
relative to a base of respondentrsquos time and money business travellers for whom it was their own
time and their employerrsquos money had a 26 higher value reflecting the slight effect above of
reimbursement When it was the employerrsquos time the value was 11 lower when it was the
respondentrsquos money and 11 larger when it was the employerrsquos money This indicates that the
respondent places slightly less importance the employerrsquos time than their own time which is to be
expected if the respondent is primarily taking their own preferences rather than the companyrsquos into
account The variations do seem slight and again raise concerns about the interpretation of the SP
results
Turning to the tolled road SP exercise (SP3) for business travellers the reimbursement was based on
the question ldquoif you were to travel on a tolled motorwaytrunk roadurban road who would pay the
toll costsrdquo It was found that the toll coefficient would not be zero even for those who had all the
toll reimbursed Tests were conducted for strategic bias against tolling but this had little effect on
the non route constant terms
The values from the SP1 and SP3 exercises are reported in Table A36 for all three purposes Despite
one exercise relating to tolls and the other to other car costs which might be seen as causing a
difference due protest against tolls we see little difference between the commuting and other
values for the two exercises We might then conclude that there are other factors causing a
difference between the two results Note that SP3 does not have car passengers and for business
travellers in SP1 these had higher values This would account for some of the difference
11 There was a second SP exercise but it did not relate to business travellers Hence the second SP exercise for
business travellers was the third SP exercise (SP3) offered
55
Table A36 SP1 and SP3 valuations from HCG et al (1999) ‐ pound per hour
Business Commute Other
SP1 73 32 26
SP3 48 32 35
Note Reproduced from Table 104
However it is a little concerning that the SP3 exercise which aims to provide business valuations
more in line with the employers yields lower business valuations than the SP1 valuations which are
intended to be personal values
Repeat Newcastle Study
Unlike the original study business travellers were here asked for RP information in addition to
conducting the SP exercise And two SP exercises were used one was an exact repeat of the
Newcastle route choice SP exercise (SP1) whilst the other was a simple time and toll trade‐off (SP2)
Business travellers were told to bear in mind company policy on cost reimbursement when
answering the SP exercises
The results for the three sets of data are presented below split by journey purpose As expected
the 95 confidence intervals expressed as a proportion of the central estimate are much tighter for
the SP data given their larger samples We observe the business SP values to be larger than the non‐
business values However this can hardly be taken to indicate that respondents have followed the
instructions on reimbursement since we would have reasonably expected much higher multiples
than apparent here The study mean labour cost is 309 pence per minute and is only a little lower
for shorter distance trips
Table A37 Valuations (pound per hour) from Repeat Newcastle Study (from HCG et al (1999)
Business Commute Other
RP Value 95 CI Obs
68 plusmn89 189
24 plusmn39 453
57 plusmn73 222
SP1 Value 95 CI Obs
36 plusmn20 1070
23 plusmn12 2834
22 plusmn20 1528
SP2 Value 95 CI Obs
26 plusmn12 1583
14 plusmn8 3721
20 plusmn9 1661
Note For reference we provide the cost saving value of time of pound185 per hour
Whilst the RP business values are somewhat larger than the corresponding SP values they are not
high and very much less than the wage rate In any event the RP values are also higher than the SP
values for other trips and thus there could well be reasons other than cost reimbursement and
company policy issues that are leading to a discrepancy We would have to conclude that neither
56
the RP nor SP values support the cost savings approach but equally admit that there are some
uncertainties as to what the SP values represent and recognise the imprecision of the RP estimates
Implications for Appraisal
The employer value was derived using the modified cost saving approach of 147 pence per minute
to which is added the employee value of 67 pence per minute The latter was based on SP1 for
those who used their own time and money Note however that the measure of p used (p) was the
average amount of time spent working rather than the amount of time spent working that would be
lost as a result of the time saving More importantly the value of 67 pence per minute should have
been weighted by r which on average is 0463 Thus the total value of time would have been 178
pence per minute of which 310 is the employeersquos value This is 58 of the average gross wage rate
in the sample obtained
Commercial vehicles were also covered SP methods were used to get employerrsquos value of time
saved The study concluded that ldquoas with the Hensher approach for working time we would
recommend adding the personal VOT of the driver and any accompanying staffrdquo
Netherlandsrsquo Experience
The Mott MacDonald (2009a) study identifies the Dutch National Model (LMS) as containing time
and cost effects estimated directly to mode and destination choices Apparently these models have
not been used in evaluation with the reason given being that due to the log‐cost specification the
value of time is not constant with journey duration Notably Mott Macdonald et al (2009a) state
that with respect to the business time valuation ldquothe results obtained may have been similar to the
wage rate at the timerdquo whilst recognising that ldquotrends in societal time use and technology could
change this in futurerdquo
The Dutch national value of time studies of the 1980s and 1990s (Hague Consulting Group 1990a
Hague Consulting Group 1998) indicate that business travellers work during their journey and
particularly for rail the amount of time spent working has increased over time The results of a more
recent Dutch national study are soon to be published and this will presumably provide more insights
into inter‐temporal variations in the Hensher parameters
The Dutch 1988 value of time study (Hague Consulting Group 1990a) used travel demand survey
data covering mode and destination choice including longer distance travel to develop Revealed
Preference models Whilst the business values for car driver were 76 higher than for commuting
and over 5 times leisure with respective figures of 64 and 33 times for train passengers the
standard errors for the business values exceeded the central estimates
Whilst imprecisely estimated the business values are in line with the wage rate The report states
that ldquohellip Revealed Preference values helliphellip should in principle reflect the valuation of the employer as
wellrdquo The SP results were claimed to relate to individualsrsquo personal valuations since business
57
travellers were instructed to consider the SP alternatives as if they were making the exact same
journey but in their own leisure time and at their own expense Noticeably the RP and SP values for
car and train and commuting and other were similar but the SP values were 42 and 39 lower for
car and train business travellers respectively
The business valuations were intended to reflect VL and can be compared with the private leisure
valuations The ratios were 191 to 244 for car depending on the type of time 175 for train and
183 for bustram These presumably reflect the larger incomes of business travellers
In further analysis of the SP experiments offered on public transport users (Hague Consulting Group
1990b) the cost coefficient for business travellers was found to be 37 smaller where the employer
reimbursed some or all of the cost This is surprising given respondents were told to assume that
they would pay for all costs directly so that the values reflect travellersrsquo personal valuations It is
concluded that ldquothe results above indicate that this approach has not been entirely successfulrdquo
The 1988 Dutch study was extended by making use of questions asked in the survey and relevant to
the Hensher approach (Bradley and Gunn 1991) This included the p q and r terms The relevant
questions (for car) asked were
Did you do some work during this car trip which you would otherwise have had to do in the
office If yes how long was it in total
How many minutes would the work in Q13a (above) have taken in the office
Suppose your travel time is 20 minutes less than your current one how would you allocate
this 20 minutes time saving
Table A38 1988 Dutch Study ndash Implications of Modified Hensher Equation
Mode MPL Employer Employee Total MPL
Car 4469 304 212 376 84
Train 3652 157 140 231 63
Bus 2846 118 113 172 60
Note Values in Dfl per hour in 1991 prices The employee value has here been weighted by r and
unlike the report is that which enters the total value reported here
For car train and bus business travellers r was on average 034 053 and 048 The corresponding
figures for p were 002 011 and 003 respectively and for q were 090 089 and 093 respectively
Note however p was not the amount of saved time that would have been spent working but the
amount of time spent working (p) The implied values using the modified cost savings approach are
set out in Table A38 For all modes the value of time is less than the wage rate (MPL) As would be
expected the reduction is larger for public transport modes where the opportunity to work is
greater
58
The repeat Dutch study conducted in 1997 (Hague Consulting Group 1998) followed the same
approach for business travel of using SP to estimate employee valuations and using a modified cost
saving approach to deduce employer valuations Summary statistics relating to the business value of
time are provided in Table A39
For car train and bus business travellers r was on average 045 063 and 065 The corresponding
figures for p were 004 016 and 003 respectively and for q were 090 089 and 093 respectively
The q values on average varied very little between 1988 and 1997 whilst it is only for rail that we see
sizeable increases in the amount of working while travelling
As a result of these changes to p and particularly r the employersrsquo value of time for all modes fell
quite appreciably between 1988 and 1997 The employersrsquo values for car train and bus were 262
117 and 122 in 1997 with the 1988 study providing values of 286 251 and 274 in 1997 prices
Increases in the productive use of time can creditably be related to the greater use of laptop and
mobile phones but it is unclear why the proportion of travel time saved converted into leisure
should increase Indeed given many journeys would be made in normal hours it is surprising the
the r values are so large In reality travellers might not be allowed to convert time savings into
leisure at the rate they perceive and report
Table A39 1997 Dutch Study ndash Implications of Modified Hensher Equation
Mode MPL Employer Employee Total MPL
Car 5097 262 239 370 73
Train 5141 117 192 238 46
Bus 3757 122 116 197 52
Note Values in Dfl per hour in 1997 prices The employee value has here been weighted by r and
unlike the report is that which enters the total value reported here
Swedish Experience
The Swedish 1995 study (Algers et al 1995) contained a section aiming at measuring the Hensher
parameters The relevant questions posed to business travellers were
Did you work during the trip
The proportions working during the trip were 48 for car 25 for air and 56 for train
Unsurprisingly the figure for rail is large but that for car is also high These respondents were asked
In that case how much (percent of total in‐vehicle time)
The proportion of the total in‐vehicle time spent working (p) was 30 for car 50 for air and 50
for train The relative productivity question took the form
How long time would these tasks have taken at your normal workplace
59
The mean for those working during the trip was that they were 93 as efficient as at the office
Travellers were next asked
If you hadnrsquot had the possibility to do these tasks during the trip how much of it (in ) would
you have done during a) normal working hours b) overtime c) leisure time d) not at all
50 would have done the work during normal hours and for 6 it would have been overtime It
would have been done in leisure time for 36 and not at all for 8 This was followed by
If the value of working time at your normal working place is 100 how high would you
value your working time on the train
The mean value was 65 with 17 stating between 0 and 33 31 stating between 33 and 66
and 52 stating between 67 and 100 Business travellers were then asked
If the travel time of this trip had been shorter how much of this time had you spent working
and how much would have been leisure time
This question was asked in two versions one where the travel time reduction meant that the
traveller would start later and one version where the traveller would arrive earlier On average 30
of the time would be used for work Table A310 summarises the results for the Hensher parameters
split by mode
As tends to be the case across studies the relative productivity of work done while travelling and at
the office (q) is close to one overall However as can be seen there are several cases where q is
somewhat over 1 and this is not plausible This is something the study wrestled with including
distinguishing between relative productivity whether the activities would have been undertaken
outside of travelling and the value of the activities being undertaken as addressed by two of the
questions above Whilst it did appear that the activities would have been undertaken it was
concluded that they had only two thirds of the value12
The p values are generally low with a greater tendency to work on public transport modes as
expected whilst the higher r values for rail and air and indeed long distance bus may well reflect the
longer duration of these journeys and hence a greater likelihood that travel is undertaken in
personal time or in unsocial hours Nonetheless concerns were raised about the high values of r
and it was concluded that the total amount of work should not fall after a time saving thereby
setting 1‐r to the maximum of 1‐r or pq)
12 The study therefore weighted q values by 065 It also assigned the same value to VW as VL In our calculations later we
have for consistency with other studies used the reported q values set VW to zero and weight VL by r
60
Table A310 Swedish Value of Time Study p q and r values (Algers et al 1995)
Mode p q R
Car 014 101 054
Car Self Employed 010 120 066
Air 013 097 084
Air Self Employed 011 102 085
Train Inter 028 103 078
Train Self Employed 023 108 075
X2000 028 104 079
Train Regional 018 115 082
Bus Inter Urban 013 093 085
Bus Regional 017 126 086
Comp Car 019 111 047
In order to estimate the private value of time VL travellers were subject to an SP experiment where
changes in travel costs were to be covered with the travellerrsquos own money A special study similar
to the main study was also carried out on self‐employed travellers Presumably for them the
lsquocompanyrsquosrsquo value of time would be completely internalized Nonetheless the results were not
markedly different from those in the main study
Finally an SP study where the respondents were told to choose ldquoaccording to company guidelines
and rulesrdquo was carried out This gave considerably higher valuations especially for air and train trips
Table A311 summarises four estimates of the business value of travel time savings the Hensher
equation with the original parameters and with VW set to VL the Hensher equation with the
original parameters and VW set to zero which are obviously lower and indeed somewhat so figures
which set revised values for q (q=065 (1‐r)gtpq for each individual) given concerns about the q and r
values which leads to higher than original values and the lsquocompany guidelinesrsquo WTP choice
experiment
Table A311 Swedish National Study Various Values of Business Travel Time (Algers et al 1995)
Original VW = 0 Revised WTP
Car 145 118 167 150
Air 122 107 141 223
Train 100 70 134 201
The original values are pretty much between the VW=0 and revised values but the WTP values for
rail and air are very much higher These values offset the higher p values for train that lead to its
otherwise relatively low values Whilst the WTP values for rail and air might be regarded to be too
high around twice as high as those of the Hensher equation with the original parameters we can
point out that the car WTP values are reasonably in line with the other Hensher figures and we
might expect air and train business travellers to have relatively high values because of more senior
positions longer journey length travel at inconvenient times and relatively high productivity at the
destination
61
Norwegian Experience
The Norwegian 1997 study (Ramjerdi et al 1997) was similar in many ways to the Swedish 1995
study A number of questions aimed to estimate the Hensher parameters and the survey also
contained a choice experiment where changes in travel costs were covered with the respondentrsquos
own money to capture VL The p q and r questions are reproduced below
How much of the travel time is within your normal working hours
Do you get any compensation for travel time outside normal working hours
Permissible responses were wage wage and overtime half wage can get time back through
rescheduling other work no and donrsquot know
Did you work during the trip (eg made a call read write)
If the traveller replied yes then they were asked
How much time did you work and
How long would the same task have taken at your normal workplace
Note that in Fowkes et al (1986) terminology these questions elicit p and r The table below
summarises results for inter‐urban and urban travel respectively It is not clear why the q values are
so low and out of line with values typically obtained of around 10 The r values tend to be large for
the inter‐urban modes presumably because of the prevalence of travel outside of normal working
hours due to the distances involved The figure falls noticeably for urban trips Productivity levels
also seem atypically low when compared with other studies but this might also be a function of
travelling in personal time The study offers little by way of explanation for some surprising values
particularly for q which are out of line with the evidence from other studies
Table A312 Norwegian Value of Time Study p q and r values (Ramjerdi et al 1997)
p q r
Inter‐Urban Car 003 032 057
Inter‐Urban Air 007 028 064
Inter‐Urban Train 018 039 072
Inter‐Urban Bus 006 020 074
Inter‐Urban Ferry 003 019 063
Urban Car 021 002 039
Urban Public Transport 030 007 043
The SP exercise clearly stated that the respondent would directly incur or benefit from any cost
variations but it did not state what the time savings would be spent on The authors segmented the
models according to the proportion of the time (r) that would be used for leisure For car bus train
62
and air the values of time were between 18 and 58 lower when r exceeded 90 than when it
was less than 10 This suggests that care needs to be taken in specifying what the time saved
would be used for
The implied values of time using the Hensher approach are set out in Table A313 In the lsquoFull
Hensherrsquo equation VW is set equal to VL This seems difficult to justify as argued by Fowkes (2001)
and the very much higher values are unwarranted The lsquoModified Hensherrsquo approach sets VW to
zero In both cases MPF is assumed zero The modified Hensher approach generally provides values
less than the cost savings approach although notably air users are assigned higher values
presumably due to their high values of VL
Table A313 Norwegian National Study Various Values of Business Time (Ramjerdi et al 1997)
MP Full Hensher
Modified Hensher
VLLeisure VoT
Inter‐Urban Car 185 259 (140) 181 (98) 215
Inter‐Urban Air 201 379 (189) 267 (133) 202
Inter‐Urban Train 153 148 (97) 116 (76) 219
Inter‐Urban Bus 132 90 (68) 75 (57) 123
Inter‐Urban Ferry 161 172 (106) 130 (81) 123
Urban Car 170 190 (112) 137 (81) 223
Urban Public Transport 131 152 (116) 106 (81) 276
New Zealand Study
A major New Zealand value of time study was reported by Beca Carter Hollings and Ferner et al
(2002) and a part of this covered the estimation of the p q and r values through telephone surveys
of 600 business travellers including professional drivers
p q and r evidence
The use of a telephone survey contrasts with intercept surveys (for instance on train or at service
stations) in two important respects Firstly we can be sure the questions are answered after the
journey has been completed Secondly the farther in the past was the actual trip then the greater
the potential problem of recall
The questions asks in investigating p q and r are set out below
I am now going to ask you about some activities that people do while travelling Please tell
me if you did any of these as part of your job (that is not for personal reasons) on that
specific trip
Permissible responses were use a phone reading use a computer dictation discuss workbusiness
with travelling companions or none of these This was followed by
63
Did you do anything else while you were travelling that was part of your job (not including
driving for professional drivers)
If the answer was yes then the respondent stated what the activity was
The interview then proceeded to determine how much time during the course of the journey was
spent on each activity separately
You said your trip took hellip hours hellip minutes How much of the travelling time did you spend
(talking on the phonereadingusing a computerdictatingtalking to travelling companions)
to do with your job
This p question was followed up with questions on relative productivity
If you hadnrsquot spent time (activity description) while travelling when would you have done it
Permissible responses were in other time at work while travelling tofrom work during personal
time (outside work hours but not while commuting) would not have done it at all and other This
was followed by
Would (activity description) have taken longer about the same time or less time if you had
done it (at work in own time etc)
The response categories were about the same more time and less time and the latter two were
followed up with questions on the amount of time more or less The next question related to what
they would do with any saved time
Now with the same trip in mind I want you to imagine that recent improvements to the
(road and traffic systembus servicerail service) meant that you knew you would save some
travelling time on this trip Do you think that you would have used that time for more time
working more personal time some of each)
Followed with
How much if each (frac14 work frac34 other frac12 work frac12 other frac34 work frac14 other)
The final question relating to the Hensher equation was
You said you spent (hours minutes) (activity) during your (hoursminutes) trip If the (road
and traffic systembus servicesrail service) improvements meant that your journey was
shorter would it have reduced the time you spent on any of these activities
If the answer was yes then they were asked
64
If your journey had been say 5 minutes shorter how much less time would you have spent
on (activity)
Hence questions on p and p were asked alongside q and r
Almost 60 of trips involved no work activity while travelling and p was on average 022 but with a
strong negative correlation with distance The relative productivity of activities in travel compared
to elsewhere slightly exceeds one with travel based activities around 7 more productive on
average However a cap of one was applied so that working while travelling could not be more
productive than elsewhere for any individual whereupon the central estimate for q was 093
The proportion of time saved that would be devoted to leisure is around 28 with relatively little
variation across occupations However the response categories were crude The mean reduction in
time spent on work activities for those working during the journey was only 7 implying a value of p
overall of 0028 This is not surprising given the dominance of car
VL was not estimated in this study and instead the behavioural value for all non‐work travel was
used instead The latter can be expected to understate VL not least because business travellers have
higher incomes
As a result of applying a modified Hensher correction that is ignoring MPF and setting VW to zero13
the car driver kilometre weighted business valuation falls by 18 The adjustments are small
because the scope for working during the course of a car journey is relatively limited and the time
savings would not be predominantly at the expense of working while travelling The reduction for PT
users is 24
Switzerland Value of Time Study
As part of this study which primarily addressed private travel a small sample of 62 answered
questions relating to the Hensher parameters 16 of these would not work during a business journey
and 19 stated that any time saved would not be used for work
The questions were
Do you work during your business trips (ie telephone read write discussion with
colleagues or clients etc)
Responses were never or normally If the answer was normally then the amount of time was
established This was followed with a question relating to q
13 Note that VL was correctly weighted by r
65
How long would this work take at your workplace
which could be the same time or X minutes on average shorter or longer As for r respondents were
asked
Imagine that improvements in travel conditions were to reduce the journey by 15 minutes
How would you use this time
Responses distinguished between work time (at workplace with clients etc) own time and a mixture
of the two A similar question was asked relating to p
Imagine that improvements in travel conditions were to reduce the journey by 15 minutes
How long would you then work during the journey
Permissible answers were the same time X minutes less or not at all
The mean level of working while travelling across the sample was 64 whilst relative productivity (q)
was 98 The proportion of saved time that would be used for work was 49
The study concluded that ldquoBased on these average figures we obtain a business VTTS of 2135CHFh
(compared to a wage rate of 6649 CHFh) This seems implausible in relation to other references
both in the level and in its relationship to other purposesrdquo It is because the employerrsquos value is
negative given that pq is large relative to 1‐r Essentially the time is being transferred from working
while travelling to leisure and hence is a loss to the employer We can note three things Firstly it is
not p but p which is measured and if the work is so important it may still be done after time
savings occur whereby p will be much small than p Secondly the figure of p is very large relative
to evidence from other studies Finally the sample is small
We have included this Swiss study for completeness but little emphasis should be placed upon it as
far as business travel is concerned given the small sample and strange results Nonetheless it does
point to some lsquounsavouryrsquo implications when pq is large relative to 1‐r
UK Rail Travel Time Productivity
This Study of the Productive Use of Rail Travel (SPURT) is reported in Mott MacDonald et al (2009a
2009b) It is one of the first and certainly the most comprehensive examinations in the UK of the
amount of time spent working on trains by business travellers and the activity consequences of time
savings
The study is useful for several purposes Firstly in estimating p q and r values and working through
the implications for business valuations of time savings in the rail market Secondly in inspecting
how these parameters might vary across a range of situations Thirdly in undertaking SP research to
66
obtain personal valuations of time savings for those undertaking business travel including crowding
and other benefits Finally it provided a review of some important studies
p q and r Evidence
A sample of 1660 valid and checked questionnaires were obtained from on‐train surveys conducted
in Spring 2008 Respondents were asked to complete the questionnaire ldquotowards the end of the
train journey you are makingrdquo to be returned by mail A very creditable response rate of 35 was
achieved
Respondents were asked
Could you please estimate the amount of time you spent on this train doing each of the
following activities
Permissible responses were settling down work activities related to employment personal
activities and preparing to disembark Responses could be in minutes or proportion of overall
journey This was followed by
Which if any of the following work activities related to your employment did you do on this
train
Response categories were none prepare for a meeting make or receive business callstexts talk to
colleagues use laptop use PDABlackberry and other work related to employment
Respondents were then asked to indicate on a lsquotimelinersquo when they undertook work related
activities during the course of the journey This seems to be a novel and well worthwhile feature of
the study
With regard to the relative productivity of working while travelling and in the usual work
environment the respondent was asked
Approximately how long would the work‐related activity have taken you if you had done it at
your normal place of work
Permissible responses were about the same time more time and less time In the latter two cases
the respondent was invited to state how many more or less minutes Whilst it is possible that some
things can be done more productively while travelling say because there are fewer disturbances
this is offset by the range and value of activities that can be done in the normal workplace being
higher
67
There were then a set of questions relating to how journey time variations which varied from 10
minutes for the shorter journeys through 15 minutes to 20 minutes for the longest would impact on
work undertaken Two questions related separately to a shorter and a longer journey
Suppose this rail journey was scheduled to last 101520 minutes longer (shorter) how long
would you have spent undertaking work‐related activity on train
The answers could be the same or more or less time with the amount specified Following on from
this was a question on the use of the time saved This was
If this train was scheduled to arrive at your destination station 10 minutes later (earlier)
would you have spent the additional time working on the train (do you think you would have
worked or not in the 10 minutes saved time)
For earlier arrivals permissible responses were not worked worked in usual workplace worked in
other workplace worked at home worked elsewhere (eg cafeacute hotel) and other For later arrivals
the responses were spend all of the additional time working on train spend some of the additional
time working on the train spend none of the additional time working on the train and donrsquot know
Other questions related to levels of crowding and its impact on productivity presence of facilities to
support working while travelling and detailed activities undertaken during the journey
Around 80 of rail business travellers in Spring 2008 are now working during a train journey with
82 working on the outward leg and 77 on the return journey This is contrasted with an estimate
of 52 from the National Passenger Survey (NPS) of 2004 and is facilitated by more power points on
trains and more Wi‐Fi connectivity This was over a period of only 3frac12 years and is therefore a large
increase The NPS did not reveal the actual amount of time spent working Although not
undertaken on a comparable basis it was estimated that 30 of journey time was spent working in
2004 increasing to reported levels of 57 in 2008
Across both directions of travel on average business travellers spent 46 of travel time working in
2008 which represents p and this contrasts with a value for p of 041 However the latter does
vary across time bands This value of p is high compared to other evidence and presumably a
contributory factor is that it is the most recent rail evidence and we would expect p to increase over
time
A key issue is how productive this is relative to work done in the office environment It was found
that there was little difference with train time having 97 of the productivity of work‐place time
This falls to 89 in crowded conditions where 90 or more of seats are occupied but hardly varies at
all with journey length The credibility of these results can be questioned
Of the time that is saved after an earlier arrival on average 48 of that time would be spent working
off‐train although this varies by factors such as journey length and direction of travel This r value of
68
052 is high However it would be difficult argue that the main reason is because of the long
distance involved since only 19 of journeys exceeded 90 minutes
Explaining travel behaviour14
There are quite a number of studies that provide estimates of p q and r but there has been little
research conducted into how the parameters vary across different circumstances
A novel feature of this study was that the questions set out above were subject to an extensive
amount of segmentation by relevant factors although without conducting the detailed empirical
analysis to systematically explain and quantify how these figures vary across individuals travel
conditions and journey characteristics so as to have predictive models of time use
Although the vast majority of the data covers trips of less than 90 minutes it is interesting to
observe how the various parameters vary with journey length These are reported in Table A314
below
Table A314 Hensher Parameter Variation by Journey Length
p p q r
lt 45m 060 041 098 048
45‐89m 035 049 097 051
90‐149m 028 049 098 056
150m+ 022 049 096 065
The relative productivity varies little with distance unsurprisingly whilst we might expect r to
increase with distance as more trips are then made out of normal office hours The average level of
productivity (p) varies little when we might have expected some downturn for longer distances
although it is not surprising that it is lowest for short distance journeys In contrast p quite clearly
decreases with journey duration This seems realistic there will be less pressure on working time
on longer journeys and hence the amount of productive effort foregone will be less
The type of activities and amount of productive time (p) undertaken during a train journey varied
generally in an expected manner with a range of factors such as direction of travel occupation
flow type crowding and on‐board facilities all having a bearing Interactions between variables were
apparent whilst there were variations in effect between the proportion working and the proportion
of time spent working The timing of work undertaken peaks earlier in the journey and this is a
possible explanation of why p is less than p Perhaps surprisingly there was little difference
between first and standard class in the propensity to work on the outward leg although a 10
percentage point difference was apparent on the return leg
14 The discussion below is based on our understanding of the significant amount of outputs from this
important study However the discussion is often detailed and in some cases not easy to follow or interpret
69
Less attention was paid to variations in p q and r with the distance segmentation reported above
being the most significant analysis and there being no clear effect from the amount of time saved on
p The exception to this was crowding levels where a number of segmentations were presented
Crowding is potentially a key issue and as far as we are aware this study provides the first insights
into how crowding impacts on the Hensher parameters although there is a considerable amount of
evidence on how crowding impacts on valuations (Wardman and Whelan 2011) Unfortunately
though and as also applies to the examination of distance effects the analysis of the crowding
issues was hindered by small samples in the more crowded categories
It was only at load factors over 90 with some standing that the relative productivity is impacted At
that level q falls from around 1 to around 09 We can but speculate that it will be somewhat lower
when standing is involved but further research is required on this issue not least because one could
imagine that crowding would have a larger impact than this study revealed
Even if we accept that q does not vary greatly with load factor providing if it is possible to be seated
we would expect the ability (or indeed willingness) to work during the journey to fall with the load
factor The results with regard to crowding and productivity are not conclusive but it appears that
at 75‐90 load factor 50 of the journey was spent working (ie p = 05) At load factors over
90 (without standing) it was 38 For passengers who are forced to stand the evidence denotes
that p might be halved
The level of crowding in terms of proportion of seats occupied did not greatly affect whether work
was undertaken during the course of a journey It was only when the conditions on the departing
train involved (a few) people standing that there was a significant drop‐off in the proportion working
during the journey When related to the proportion of the journey the respondent was seated the
results are limited by the ability of most to be able to sit for most of the journey The study states
ldquothe conclusion remains that work activity is affected by whether one can sit all the time or not but
further insights are desirablerdquo and ldquothe effect of crowding andor seating availability needs
therefore to be explored furtherrdquo
The dominance of short business journeys might be seen as something of a weakness since they can
be expected to be somewhat different in nature as we have to some extent seen In addition a very
useful addition to the literature would have been a model that explains how p q and r vary over
different travel and personal circumstances
SP Research
An SP exercise was used in which business travellers had the opportunity to trade‐off their own
money against time variations and also crowding levels and the quality of mobile phone reception
However the crowding variable denoted the proportion of seats taken (25 50 75 100) but
did not indicate whether the respondent would get a seat or not
70
The manner in which the personal payment was introduced was that the company would provide an
allowance of pound15 for the journey Any increase in the SP exercise on a pound15 fare would have to be
paid by the respondent but conversely if the fare was less than pound15 they could keep the difference
This is now the standard approach for estimating VL The value of time that emerged varied with
model specification
This study also provides estimates of how VL varies with crowding levels with a fairly strong effect
on VL from crowding above the 75 occupancy level This is consistent with other crowding
evidence that load factor seems to have an effect at this sort of level prior to standing occurring
(Wardman and Whelan 2011) However it only examined crowding up to a level of 100 of seats
taken Even then it is unclear at that level whether the respondent would have got a seat or had to
stand the difference in valuation between the two can be expected to be large
An effect related to clear mobile reception was also detected but presumably this is not a significant
issue going forward
Appraisal Consequences
The consequences for appraisal values of time under various scenarios for the sample obtained were
calculated (Mott Macdonald et al 2009b) Four scenarios are reproduced below
Scenario 1 The cost saving approach
Scenario 2 Consider working time lost on the train but assumes all time saved is converted
to work time (r=0)
Scenario 3 For home based trips this takes into account leisure time increases in addition to
working time lost but assumes all time saved is converted to work time for other trips
Scenario 4 This is the short run modified cost saving approach with levels of on‐train
working and proportions of time saved as in the SPURT survey
The train user business valuations in pound per hour 2008 prices and income under each scenario
reproduced in Table A315
Table A315 Train User Valuations (pound per Hour) from SPURT (Mott MacDonald et al 2009b)
Scenario Employer VoT Employee VoT Total VoT
1 3909 0 3909
2 2511 0 2511
3 1089 707 1796
4 469 1780 2249
Note Fowkes (2001) has pointed out that many studies incorrectly do not apply the r weight to VL
effectively treating VW as VL If r is applied to VL then the total value of time falls to 1376 in
scenario 4
71
Departing from the conventional wisdom leads to a large reduction in the business travel value of
time The main effect is from allowing for the time spent working on train that would be lost which
reduces the value of time by 36 When the transfer to leisure time is taken account for home
based trips and the employeersquos valuation included the reduction is 55 In scenario 4 which
represents the modified cost saving approach the business valuation would be reduced by 43
increasing to a massive 65 when r is applied to VL
The study made a number of useful recommendations for further work notably extending to other
modes on‐going monitoring more focus on what it termed inter‐metropolitan trips and
behavioural modelling to determine how the ability to work productively influences the demand for
rail travel
Summary of p q and r values
A detailed summary is provided in section 312 of the main report which is not repeated here In
particular it contains
Table A32 (Summary of p q and r evidence)
Table A33 (Impact of Modified Cost Savings on Cost Saving Value of Time)
Table A34 (Comparison of Valuations)
Table A35 (Within Study Comparison of WTP and Modified Cost Saving Methods)
Section 315 arrives at representative figures for p q and r based on the evidence reviewed
A34WillingnesstoPayEvidence
We have also examined a large amount of willingness to pay evidence and in particular the extent to
which it aligns with the values implied by the conventional Cost Saving Approach We cover three
separate sets of evidence
A data set covering UK and mainland European values of time assembled as part of a recent
meta‐analysis (Wardman et al 2012)15
Some evidence from a recent large scale study in Japan
Evidence from high speed rail studies as it relates to business travel
15 Whilst this data set covers out‐of‐vehicle time reliability terms and departure time shifts it does not cover crowding
values We therefore cover these in the next section
72
This data is in large part separate from the willingness to pay evidence discussed in section A33
Whilst the evidence in section A33 covers business values from UK and European studies it was
generally based around the estimation of vL whereas the evidence covered here contains much
more business travel evidence and it covers high speed rail
A341ReviewofEuropeanWTPEvidence
We have at our disposal some data sets that have been assembled for the purposes of meta‐
analysis These are
A data set covering 3109 monetary valuations from 389 studies across 26 European
countries from 1960 to 2011 The UK provides 1862 valuations (60) across 233 studies
These money values are largely made up of IVT (60) but walk and headway each provide
10 whilst the remaining cover reliability variables wait time departure time shift and
congested travel time
Related to this data we have time multipliers for 1389 observations from 244 studies Of
these 63 are for the UK These provide for a more controlled assessment of time
multipliers since they all reflect lsquowithin studyrsquo variations than comparing money valuations
of various attributes with money values of IVT
We must though bear in mind that these data sets contain a relatively small proportion of business
values the former contains 14 of business valuations whereas the latter contains 9 Nonetheless
there is sufficient data to be able to conduct meaningful analysis
Our UK data does not include SP studies as far as we are aware where the value of time on business
travel was explicitly a personal valuation (VL) that is where the respondent was told that they
would personally incur any cost increases in return for times savings or receive cost reductions after
a time loss when undertaking a business trip
In the other European studies where personal values have been estimated they have been used to
calculate Hensher type business values The latter are contained in our data set and can be
separately identified
Our SP values are certainly not explicitly personal values but are derived from SP exercises offered
to those making business trips We therefore contend that there is a degree of ambiguity as to what
they represent Our impression is that most studies have taken a quite lsquocavalier attitudersquo and do not
specify what the respondent should assume in terms of company policy and who pays It would have
been a large task to go back to each study and determine this information and in some cases the
studies do not report the questionnaire The values are therefore dependent upon how
respondents interpreted the SP exercises presented to them
73
The sorts of insights that analysis of our meta‐data sets can provide are
To what extent are the estimated WTP business values of time in line with labour costs
given the cost savings approach is an appropriate benchmark
Given that the modified cost saving approach would lead us to expect rail values of time to
be lower than car all else equal is there any WTP empirical support for this
A related point is the modified cost saving approach might lead us to expect a falling
valuation over time as the opportunities for productive use of travel time increase
We might expect RP valuations to exceed SP valuations on the grounds that the latter do
not fully represent company policy Is this apparent in the WTP evidence and if so how do
the latter compare with values obtained by other means
Given SP evidence now dominates but without the resource to investigate what each SP
exercise might have been valuing in terms of personal or company values is there evidence
to indicate that SP based valuations vary according to relevant indicators such as whether
the purpose of the study was forecasting or the choice context was a real one
To what extent are the relationships between estimated business valuations and distance
mode and other relevant variables consistent with the different approaches to business time
valuation
In the cost saving approach time is time Is there evidence to indicate that for business
travel different aspects of time such as walking waiting and in‐vehicle attract different
weights
Section 313 of the main report contains a detailed account of our analysis of the assembled value
of time evidence for the UK and mainland Europe We therefore do not repeat it here
A342 RecentJapaneseEvidence
A major three year value of time study has recently been completed in Japan covering RP analysis of
motoristsrsquo route choices SP analysis and a meta‐analysis of a large number of Japanese values of
time It did not major on business travel value of time but nonetheless it provides some insights
The RP analysis was based on the 2005 Road Traffic Census and examined motoristsrsquo choices
between ordinary roads and an alternative that included ordinary roads and a tolled expressway
(Kato et al 2013) Short distance intra‐zonal journeys were removed as were trips where the time
expressway option was more than 70 minutes quicker or greater than 20 minutes slower It was
observed that in such circumstances there was little variation in the choice rate whereas between
74
these points the expressway option was observed to increase its share as the journey time
difference increased
Separate models were estimated for business travel commuting and other and Table A315 reports
the values of time
As would be expected with such large sample sizes the coefficient estimates were precisely
estimated with t ratios over 25 The value of time per person for business travel is not far short of
the average wage rate which at the time was 372 yen per minute but note that the distance
elasticity was estimated to be 077 which is very large and would imply implausible variations in the
value of time for even relatively small changes in distance
Table A315 Japanese Values of Time (Yen per Minute)
Sample VoT
Commuting 82068 245
Business 12328 339
Other 51621 210
Kato and Tanishita (2013) report a meta‐analysis of 261 Japanese values of time obtained from 68
papers between 1979 and 2003 The business values average 158 yen per minute in 2000 prices
from 15 observations contrasting with 409 for home to work from 40 observations and 558 for
leisure from 30 observations Note that the business values are largely inter‐urban and hence a
distance effect may have influenced the results as implied by the elasticity of 077 above whilst all
15 values were from RP studies16 which might also lead to higher values Indeed removing the air
studies with average values of 177 yen per minute leaves an average value somewhat lower of 83
yen per minute but still larger than the then average wage of 30 yen per minute
The meta‐model itself obtained a very low income elasticity of 031 and therefore we do not regard
it to be a reliable means of predicting absolute values of time for business travel or indeed other
forms of travel Notably the meta‐model found that RP values were over 30 larger than SP values
in line with previous UK meta‐analysis evidence whilst inter‐urban trips were 50 larger backing up
the distance effect above These findings might partly explain why the business values reported in
this study were so large
SP surveys were conducted in 2010 and based upon motoristsrsquo route choices The results based on a
web survey obtained very high values for commuting (874) and very low for business (111) The
paper based questionnaire seems to have obtained more reliable evidence with a business value of
519 yen per minute falling to 455 when estimated to combined RP and SP data The official
business value of time in 2008 based on the wage rate was 440 yen per minute
16 5 are route choice 8 are mode choice and 1 is destination choice Air travel is the focus of 3 route choice and
all of the mode choice studies and these can be expected to be large values
75
This Japanese evidence would if anything support the valuation of business travel time savings in
the conventional manner in line with the wage rate
A343 HighSpeedRailEvidence
Whilst this scoping study is not primarily concerned with rail this aspect of it relates to briefcase
travellers and rail is an important mode for this market segment Given this and that high speed rail
projects are of interest because they offer large time savings we here cover the WTP evidence that
relates to high speed rail of which we are aware This evidence is summarised in Table A318
There is some evidence from Eurostar (Wardman and Murphy 1999) but it might be regarded to be
a different market to domestic UK travel and it certainly generated yields very much higher values
than the potential High Speed rail studies in Britain as is apparent in Table A318 below
At about the same time and for a similar market Halcrow Fox (1998) used SP methods to examine
preferences towards a high speed link between Heathrow and Paris For point‐to‐point business
travellers and in 2010 prices and income the value of time was estimated at pound68 per hour This is
45 higher than the official value for rail However the sample relates to air travellers for whom
income levels will be relatively high
Steer Davies Gleave (2009) undertook SP exercises in the context of a new high speed line between
London and Scotland One related to the choice between car air and rail whilst another examined
the choice of access mode The estimated values are reproduced in Table A316
The high speed values are lower presumably due to a comfort effect in that time spent in the
proposed high speed train incurs less disutility than time spent in a conventional train Having said
that we cannot be certain that this is not the result of strategic bias in favour of a new high speed
service although it is commendable that mode specific valuations have been explored rather than
imputing all the quality benefit of high speed as a fixed amount regardless of distance as would be
the case if the conventional approach of specifying alternative specific constants had been pursued
The estimated car usersrsquo values are somewhat less than the official values of pound34 per hour Similarly
the estimated air and rail usersrsquo values are somewhat less than the pound47 per hour for rail travellers in
Webtag
Table A316 In‐Vehicle Time Values (Steer Davies Gleave 2009)
Air and Rail Users Car Users
Business Leisure Business Leisure
Rail 396 252 240 200
High Speed Rail 302 233 190 150
Air 361 353
Car 230 110
Note Values in pound per hour January 2009 Prices and Incomes
76
These business values are low compared to official recommendations Note that the business
values are not much larger than the leisure values although they are themselves large relative to
official values It may be that the business values reflect personal rather than company willingness to
pay the ratios would not be out of line with the VL values relative to personal leisure values
reported above
The estimated access time values are reported in Table A317 These were obtained from a separate
SP exercise related to access mode choice
Table A317 Access Time Values (Steer Davies Gleave 2009)
Rail Users Car Users Air Users
Business Leisure Business Leisure Business Leisure
180 120 290 120 350 180
Note Values in pound per hour January 2009 Prices and Incomes
For car users the values of access time for business travellers are higher than the values of IVT
although not by the customary amount and a premium of around 30 might seem appropriate For
air users it would seem that access time is valued more or less in line with IVT In contrast rail usersrsquo
access time on business trips is valued somewhat less than the value of IVT Whilst access time
multipliers significantly in excess of one are not consistent with the cost savings approach this
evidence taken as a whole is not inconsistent with the cost saving approach
The Atkins (2002) high speed line study for SRA used SP mode choice exercises amongst rail air and
car users covering high speed rail journey times The values of time were pound370 per hour for air
travel and high speed rail and pound307 per hour for car and conventional rail These are broadly in line
with official values at the time of pound264 per hour for car and pound370 for rail
Burge et al (2010) undertook an SP mode choice exercise to complement the long distance model
(LDM) estimated to NTS data The SP exercise covered car air existing rail and a new high speed rail
service with the travel attributes being in‐vehicle time cost access and egress time service
frequency rail interchange airport waiting time rail crowding and percentage of trips on time
The form of the cost parameter means that the value of time increases with cost and is largest for
those modes with the highest costs This restricts the usefulness of the value of time results since
the value of time increases as costs increase However the model finds little variation in the time
coefficients across air rail and car Access and egress has a 40 premium on rail and air time whilst
waiting at the airport is values slightly less than in‐vehicle time
Recent reworking of the Long Distance Model SP data (Bates 2012) obtained a mean value of time
for business travel of pound5676 per hour although with considerable variation around this depending
upon model specification The LDM itself provides a value for rail at its mean cost of pound5520 These
contrast with webTAG values of pound3412 for all users being 65 larger However a more appropriate
77
denominator is some kind of average of pound3374 for car drivers and pound4718 for rail If we take a simple
average given that air users will also have large values then we have a value of pound405 per hour The
estimated value is therefore 40 larger than labour cost The Bates (2012) reworking provides a
value for leisure travel of pound2130 per hour and access and egress multipliers in the range 12 to 14
Gonzaacutelez‐Savignat (2004a) offered SP exercises to current air users between Madrid and Barcelona
to examine the propensity to switch to a high speed rail option The value of time for business
travellers was 55euro per hour although the value of access time was somewhat less at 22euro per hour
with the value of leisure time not much less than the business value at 37euro per hour Our estimate
of the labour costs at the time is 10euro per hour but this is not specific to air travellers who may well
have higher incomes
In a related study (Gonzaacutelez‐Savignat 2004b) but instead focussing on car users between Madrid
and Barcelona and their propensity to switch to high speed rail business travellers were estimated
to have a value of time of 124euro per hour for short journeys (Madrid or Barcelona to Zaragoza) and
115euro per hour for the longer distance trips Relative to our estimate of 10euro per hour for gross labour
costs the values here seem reasonable
Wardman et al (1992) used an SP choice exercise to examine business travellersrsquo choices between
air and rail for journeys between Edinburgh and London The SP exercise specifically reinforced the
point that the respondent was to bear in mind company travel policy when answering the SP
questions What emerged was a value of time of pound30 per hour This is high even given that 80 of
the sample were current air users
The study speculated that because the fares offered were less than the current air fares which all
the air users were authorised to purchase then there is no constraint from company policy for at
least 80 of the sample It is then hardly surprising if the sensitivity to cost is low and the value of
time is high
A large scale SP survey was undertaken in Australia in 1987 that examined the potential for a very
fast train alongside air coach car and the current train service (Gunn et al 1992) Updated to 2010
prices and incomes the values of time obtained for car were AUD956 per hour and AUD444 per
hour for business and non‐business respectively The corresponding figures for air were AUD1050
per hour and AUD408 per hour The official value based on the gross wage rate is AUD422 per
hour These values clearly exceed the official values It is not beyond belief that values have been
influenced by strategic bias to the extent that travellers would like to influence policy regarding a
new high speed rail service
In a study of high speed rail between Sydney and Canberra the so‐called Speedrail project our
understanding is that the SP based values in 2010 prices and income were
Sydney‐Canberra market business AUD785 per hours
Sydney‐Canberra market non‐business AUD162 per hour
78
Intermediate markets business AUD31 per hour
Intermediate markets non‐business AUD175 per hour
What is interesting here is not only that there are differences in WTP values by flow but that the
relativities between business and leisure are far different at 48 for the Sydney to Canberra market
but only 18 for the intermediate markets The values for the Sydney to Canberra market somewhat
exceed the wage rate
Table A318 Summary of High Speed Rail Evidence
Study MPL OVTIVT Business Leisure
SP Instruction Comment
Bates (2012) 14 12‐14 266 Removes log cost of Burge et al (2010) and easier to interpret
SDG (2009) 08 06 08 07 06 07
088 amp 045 116 amp 059 097 amp 050 121 153 126
157 129 103 120 127 209
No specific Air and Rail Users Rail Air and Rail Users HSR Air and Rail Users Air Car Users Rail Car Users HSR Car Users Car Rail MPL value used for air
Gonzaacutelez‐Savignat (2004a)
50 04 149 Unknown Air Users Wage rate figure expected to be too low for air users
Gonzaacutelez‐Savignat (2004b)
12 11
‐ ‐
175 174
Unknown Short Long Car Users
Wardman et al (1992)
14 ‐ ‐ Consider company policy
Rail user official value used for MPL
Atkins (2002)
14 amp 101
12 amp 081 12 amp 081 14 amp 101
108 130 130 108
180 202 202 180
No specific Air Car Rail HSR
Wardman and Murphy (1999)
158 318
073 081
239 182
Consider company policy
Rail Users Air Users Official value for rail users
Halcrow Fox (1998)
145 na ‐ No specific Air users Rail user valuation used as base
Gunn et al (1992)
249 227
‐ ‐
‐ ‐
No specific Air Car
Speedrail 186 074
‐ ‐
48 18
Unknown Sydney‐Canberra Intermediate
Yao and Morikawa (2005)
239 231
077 080
279 269
Unknown Rail and Air Car and Bus Japanese evidence
Note 1 First figure is Car MPL denominator and second is rail MPL denominator This is the same as
Table 313 in the main report
79
Outwater et al (2010) examined demand for high speed rail in California offering an SP choice
exercise that covered car air and rail and another exercise dealing with access and egress mode
choice The business model reported also contains commuters but given the distances involved
there will be few of the latter The implied value of time in the main mode choice model was $6364
per hour nearly 3frac12 times larger than the $1845 per hour for recreation and other trips In the
access mode choice model the values were $48 and $15 per hour respectively a ratio only slightly
less than for main mode choice
Yao and Morikawa (2005) examined high speed rail in Japan Their mode choice model covered rail
air bus and car and was estimated jointly to RP and SP data The business model estimated to nearly
19000 observations recovered very similar values of time for rail and air and for car and bus of 1070
and 1033 yen per minute in 2000 prices Access time was valued slightly less at 826 yen per
minute In contrast the value for non‐business trips was 384 yen per minute across all modes
The evidence from this raft of high speed rail studies is that the values implied by the cost saving
approach are broadly supported It would be difficult to make a case in favour of the Hensher
approach with its typically lower values for rail on the basis of these findings Having said that the
sort of business travellers involved are likely to be more senior and to be travelling long distances
and these would tend to inflate the values although not necessarily their relationship to MPL The
large time savings on offer might also have a bearing but the studies provide little insight into how
the unit value of time varies with the size of the time saving
A35SpecificIssuesandInsights
In reviewing studies that have addressed the valuation of business travel time savings we can draw
out some common threads over and above the p q and r parameters and relationships between
different valuation methods covered in the previous sections Other more specific insights have
been provided by these studies whilst it is useful to draw somewhat disparate insights together to
inform our review
The specific issues we here examine are
Who pays for the time saving and who benefits
Self‐Employed and Employees
SP and company policy
Distance Effects
Crowding Comfort and Soft Factors
RP and SP
These issues are discussed in detail in section 314 of the main report
80
A36 Conclusions
The evidence we have reviewed does not tell an entirely consistent story On the one hand the
Hensher equation would imply in some cases and particularly for rail significant reductions on the
value of time of the traditional cost savings approach On the other hand the WTP evidence is more
in line with the values of the costs savings approach whilst multiplier evidence would indicate that
some premium should be attached to out‐of‐vehicle time and crowding
Section 3 of the main report draws together the evidence and hence we do not repeat it here In
section 315 it provides
A summary of the Hensher equation evidence
A summary of the WTP evidence
A summary of the insights evidence
A summary of the empirical support for and challenges to valuation methodologies
It also sets out
Recommendations for further Hensher equation research
Recommendations for further WTP research
Annex 3 References
Accent Marketing and Research Hague Consulting Group and Steer Davies Gleave (1989) InterCity
Business Travel Price Elasticity Research Prepared for InterCity Marketing Planning Manager British
Railways Board
Algers S Dillen JL and Widlert S (1995) The National Swedish Value of Time Study Proceedings
of Seminar F PTRC Summer Annual Meeting
Atkins (2002) High Speed Line Study Stated Preference and Revealed Preference Surveys Prepared
for Strategic Rail Authority
Bates J (2012) A Short Analysis of the Long Distance Modelrsquos Stated Preference Data 14th August
2012
Beca Carter Hollings and Ferner Steer Davies Gleave Forsyte Research and Brown Copeland and Co
(2002) Project Evaluation Benefit Parameter Values Prepared for Transfund New Zealand
Bradley M and Gunn HF (1991) Further Application and Validation of the Netherlands Value of
Travel Time Study
81
Burge P Rohr C and Kim CW (2010) Modelling Choices for Long Distance Travellers in the UK An
SP Analysis of Mode Choice Paper presented at European Transport Conference Glasgow
Fowkes AS Marks P and Nash CA (1986) The Value of Business Travel Time Savings Working
Paper 214 Institute for Transport Studies University of Leeds
Fowkes AS (2001) Principles of Valuing Business Travel Time Savings Working Paper 562 Institute
for Transport Studies University of Leeds
Gonzaacutelez‐Savignat M (2004a) Competition in Air Transport The Case of the High Speed Train
Journal of Transport Economics and Policy 38 (1) pp77‐108
Gonzaacutelez‐Savignat M (2004b) Will the High Speed Train Compete Against the Private Vehicle
Transport Reviews 24 (3) pp293‐316
Gunn HF Bradley MA and Hensher DA (1992) High Speed Rail Market Projection Survey
Design and Analysis Transportation 19 pp117‐139
Hague Consulting Group Accent Marketing and Research and Department of Environment Transport
and Regions (1999) The Value of Travel Time on UK Roads The Hague
Hague Consulting Group (1990a) The Netherlandsrsquo Value of Time Study Final Report Prepared for
Dienst Verkeerskunde Rijkswaterstaat
Hague Consulting Group (1990b) Further Analyses of the Netherlands Value of Time Study Public
Transport Survey Data Final Report to Ministerie Van Verkeer en Waterstaat
Hague Consulting Group (1998) Value of Dutch Travel Time Savings in 1997 Final Report to
Rijkswaterstaat ndash AVV
Halcrow Fox (1998) Project Isambard Demand and Revenue Study Final Report to British Airways
Hensher DA (1977) Value of Business Travel Time Pergamon Press
Hensher D A (2011) Valuation of Travel Time Savings in Handbook in Transport Economics ed
Andre de Palma Robin Lindsey Emile Quinet Roger Vickerman Edward Elgar Publisher London
United Kingdom pp 135‐59
Kato H Oda T and Sakashita A (2013) Valuation of Travel Time Saving with Revealed Preference
Data in Japan Further Analysis Paper to be presented at 13th WCTR Conference Rio de Janeiro
82
Kato H and Tanishita M (2013) A Meta‐Analysis of the Value of Travel Time Savings Evidence from
Japanese Passenger Travel Paper to be presented at Annual Transportation Research Board
Conference Washington
Mott MacDonald Hugh Gunn Associates TRI Napier University Accent and Mark Bradley Research
and Consulting (2009a) Productive Use of Rail Travel Time and the Valuation of Travel Time Savings
for Rail Business Travellers Final Report to the Department for Transport
Mott MacDonald Hugh Gunn Associates TRI Napier University Accent and Mark Bradley Research
and Consulting (2009b) Value of Working Time and Travel Time Savings Long Run Implications
Report Prepared for the Department for Transport
MVA Consultancy Institute for Transport Studies University of Leeds Transport Studies Unit
University of Oxford (1987) The Value of Travel Time Savings Policy Journals Newbury Berks
Outwater M Tierney K Bradley M Sall E Kuppam A and Modugula V (2010) California
Statewide Model for High Speed Rail Journal of Choice Modelling 3(1) pp58‐83
Ramjerdi F Rand L Saeligtermo IA and Saeliglensminde K (1997) The Norwegian Value of time Study
Part 1 TOslashI Report 379 Report to Ministry of Transport and Communications The Norwegian
Railways the Norwegian Public Road Administration and the Norwegian civil Aviation
Administration
Steer Davies Gleave (2009) New Line Programme Demand and Revenue Modelling Report Prepared
for Network Rail London
Wardman M Holden D and Fowkes AS (1992) An Analysis of the Mode Choice Behaviour of
Business Travellers between Edinburgh and London Technical Note 304 Institute for Transport
Studies University of Leeds
Wardman M Chintakayala P de Jong G and Ferrer D (2012) European Wide Meta‐Analysis of
Values of Travel Time Report to European Investment Bank
Wardman M and Whelan GA (2011) 20 Years of Rail Crowding Valuation Studies Evidence and
Lessons from British Experience Transport Reviews 31 (3) pp379‐398
Wardman M and Murphy P (1999) Eurostar Demand Forecasting Research Technical Note 425
Institute for Transport Studies University of Leeds
Yao E and Morikawa T (2005) A Study of an Integrated Intercity Travel Demand Model
Transportation Research Part A 39 pp 367‐381
83
ANNEX4 TRAVELTIMEUSEndashANEXAMINATIONOFEXISTINGEVIDENCE
A41Context
This is a contribution to the Institute for Transport Studies (University of Leeds) 2012 study for the
Department for Transport (DfT) entitled ldquoValuation of Travel Time Savings for Business Travellersrdquo It
is based on the assembly of a set of 66 potentially relevant articles and close review of around a
third of these The full bibliography is attached The purpose was to identify and examine existing
evidence on how people use and interpret their travel time particularly in the context of business
travel Views expressed in interpreting the evidence are those of the author
A42 Introduction
The orthodox wage‐rate approach in economic appraisal has at its heart a key assumption regarding
business travel time ldquoTime spent travelling during the working day is a cost to the employerrsquos
business It is assumed that savings in travel time convert non‐productive time to productive use and
that in a free labour market the value of an individualrsquos working time to the economy is reflected in
the wage rate paidrdquo (DfT 2012a) This has been a source of academic provocation which has
contributed to a growing number of pieces of work in both transport studies and mobilities research
in the social sciences concerned with peoplersquos use of and opinions regarding their travel time use
The implication of the assumption is that all business travel time is wasted time Academic studies
have set about gaining empirical insights into how travel time is used with in part an aim to refute
this implication Of course the appraisal of travel time focuses on travel time saved not upon travel
time used It has been argued that productive use of a proportion travel time does not necessarily
compromise the validity of the assumption above unless the saved time would otherwise have been
used productively within the journey
In 2005 a conceptual paper by Lyons and Urry was published which examined travel time use in the
information age and potential implications for economic appraisal This has become a point of
reference for many subsequent articles with over 170 citations ndash reflective of the scale of interest in
the topic of travel time use in recent years Empirical studies of travel time use employing a range of
methodologies can be found for the UK Netherlands Sweden Norway USA Japan and New
Zealand These have variously considered specific modes or journey purposes Some have involved
observational methodologies while others have employed self‐reporting There are in‐depth
qualitative studies which seek to elicit greater insight into the meaning of travel time use for
individuals There are few studies which specifically concern themselves with trying to examine
notions of productivity in relation to travel time use and those which touch upon this have not done
84
so in a way that would align with the parameters in the Hensher equation17 However there are also
insights in the literature concerning the changing nature of work in the knowledge economy which
raise if not answer some wider questions about how travel time and travel time savings are treated
in relation to ownership of time and productivity of time
A43 EmpiricalInsightsintoTravelTimeUse
It is important to stress that especially for information workers the forms of communication and
ways of equipping oneself and undertaking work are changing over time It is therefore important to
be aware that cross sectional empirical insights at a point in time may not hold true over time
Not all studies in the literature have sought to focus (solely) upon business travel or have
predominantly considered what have been referred to as lsquobriefcasersquo travellers It is appropriate to
summarise empirical insights according to mode of travel The literature has predominantly
concerned itself with public transport and rail in particular but t here are also some helpful studies
addressing car travel
Time Use During Rail Travel
On two occasions in 2004 and 2010 questions on travel time use have been included in the National
(Rail) Passengers Survey for Great Britain This survey instrument has the advantage that it captures
passengersrsquo views about the specific train journey they were on when receiving the questionnaire It
also has a limitation in terms of the scope of questions able to be asked ndash all being closed questions
with pre‐defined response options The questions have addressed (i) what rail passengers do with
their time on the train (ii) how worthwhile they consider this time to be (iii) how they equip
themselves for using their time and (iv) the extent to which they plan in advance how to use the
time on the train The response sample sizes for the 2004 and 2010 surveys were 26221 and 27556
respectively (however the comparative analysis between the two surveys (see below) used sample
sizes of 22866 and 19715 respectively)
Key findings for 2004 were as follows (Lyons et al 2007) 55 of business travellers spend some of
their time on the train workingstudying on their outbound journey (for 35 it is the activity they
spend most time on) the figures are 48 and 27 respectively for the return journey They are
more likely to be reading for leisure on the return journey Meanwhile 13 of commuters indicate
workingstudying as the activity they spend most time on (around 28 spend some time
workingstudying) Journey duration has an effect on what people do with their time with window
17 See Section 24 and Annex 1 for a fuller discussion of the Hensher equation He proposed a formula for
calculating the value of business travel time savings which attempts to account for the following the
proportion of travel time saved at the expense of work done while travelling (p) the productivity of work done
while travelling relative to at the workplace (q) and the proportion of travel time saved used for leisure (r)
85
gazingpeople watching showing a marked increase for journeys of less than 15 minutes in duration
Only 2 of respondents indicated spending most of their time being bored and 1 spent most of
their time being anxious Business travellersrsquo aligned as follows with one of these three statements
ldquoI made very worthwhile use of my time on this train todayrdquo ndash 27 ldquoI made some use of my time on
this train todayrdquo ndash 58 and ldquoMy time spent on this train today is wasted timerdquo ndash 13 (2 not
answered) While not specific to business travellers travellers overall reflected on the role of mobile
technologies in their travel time experience ldquo[o]ver a fifth of rail passengers to whom the question
applied considered having electronic devices with them made the time on the train a lot better
However nearly half of all passengers 46 considered electronic devices had not made the travel
time any betterrdquo There was a marked difference in opinion by respondent age with a declining
proportion indicating lsquoa lot betterrsquo with increasing age The results of this survey underlined the
heterogeneity of travel time use and experience with for example distinct differences in lsquotime
worthrsquo assessments for given types of main time use Unfortunately questions relating to the effect
of mobile technologies on travel time experience were not included in the 2010 survey The 2004
survey predates the launch in the UK of the first iPhone in 2007 the Kindle in 2009 and the iPad in
2010
In 2010 a core subset of questions on time use were repeated enabling what appears to be the first
case of longitudinal comparison of travel time use (Lyons et al forthcoming Susilo et al 2012) The
comparative analysis reveals a broad consistency overall over the six years in terms of the most
popular activities ndash reading for leisure window gazingpeople watching and workingstudying There
are two key findings in terms of change There has been an overall upward move in terms of
positively viewing time lsquoworthrsquo ldquoThere has been a 37 reduction over six years in the proportion of
business travellers indicating that their time on the train was wastedrdquo 34 of business travellers in
2010 considered they had made very worthwhile use of their time on the train compared to 28 in
2004 The other key change relates to the increasing availability and use of mobile technologies ndash
here applying to all passengers ldquoTaking netbooks and laptops together then the proportion of people
with such a device has increased by 77 in six years from 7 in 2004 to 13 in 2010 The proportion
of travellers who have and use a laptop computer has increased by 60 The proportion of people
with a mobile phone has only increased modestly over the six years However a much higher
proportion of those who have a phone with them are now using it [for any purpose] during the
journey ndash 54 compared to 36 for 2004 The proportion of people who have a music player and the
proportion who have one and use it have doubled in six yearsrdquo The National (Rail) Passengers
Survey between 2004 and 2010 also revealed an overall increase in the proportion of travellers who
were veryfairly satisfied with the punctualityreliability of their train and who rated the train very
good or good in terms of there being sufficient room for all the passengers to sitstand Perceptions
of level of service and the uptake of mobile technologies then have increased in tandem with an
overall increase in the sense of travel time being worthwhile Advance planning of how an individual
is going to use their time on the train seems significant ndash for all rail travellers individuals who have
planned a lot in advance are three times more likely to consider their time use very worthwhile
compared to those who have not planned at all and seven times less likely to consider their time has
been wasted
86
Drawing upon the question design used in the National (Rail) Passengers Survey in Great Britain
Gripsrud and Hjorthol (2012) examined responses from 1196 rail travellers in Norway in 2008 The
study revealed that ldquoa high proportion of ordinary commuters and business people work on board
while travelling by train ie 35 of commuters and 43 of business peoplerdquo It is found that 27 of
commuters responding to the survey indicate having travel time approved of as working hours by
their employer The figure is 53 for business travellers In this Norwegian study it was found that
ldquo[a]bout 40 of commuters and business travellers take a laptop on board the train and in total
25 use itrdquo These figures are considerably higher than those for the 2004 GB study though noting
above the changes in the GB context revealed by later 2010 data In the Norwegian study ldquo[m]ore
than half of all commuters and 41 of business travellers state that use of an electronic device
during the journey makes the trip more worthwhile than it would otherwise berdquo It was also found
that the majority stated ldquothat the use of ICT while travelling by train made the time pass more
quickly and about one third of the commuters and business travellers are claiming that they made
good use of the time on boardrdquo Only 10 of respondents in this survey indicated that their travel
time was wasted ndash lower than the findings for the GB study 4 years earlier
A study called lsquoSurvey on the Productive Use of Rail Travel‐time lsquo (SPURT) has examined productive
use of rail travel time for business travellers and the value of time savings The findings were first
made available as Fickling et al (2008) and subsequently as a published report (Mott MacDonald et
al 2009) The study undertook its own empirical work but first reviewed other key studies This
included work based on the National Rail Passengersrsquo Survey data from 2004 by TRi Napier for Virgin
Trains which applied an analytical technique to estimate activity durations It was found that ldquofor
journeys in the 1‐3 hour range 30 of the journey time (across all business travellers) was spent
working (43 for those business travellers who did some work)rdquo SPURT secured responses to a
questionnaire including a revealed preference section a stated intentions section a set of stated
preference games and some socio‐economic questions The survey found that ldquoaround 80 of the
business rail travellers reported undertaking work during their journey The longer the journey the
higher the percentage of travellers workingrdquo The study team in drawing comparison between the
2008 data and the 2004 data from the National Rail Passengersrsquo Survey found that ldquothe proportion
of business travellers who spend some time workingstudying as 52 in Autumn 2004 79 in Spring
2008 Whilst a like‐for‐like comparison of the percentage of time they spend workingstudying has
not yet been undertaken the two surveys yield estimates of 43 in 2004 (for 1h‐3h journeys) and
57 in 2008 again suggestive of a strong upward trendrdquo (Fickling et al 2008) The study also
examined crowding and found that while there was some impact on productivity even in crowded
conditions productivity could remain high The lsquoAverage [weighted] minutes change in the amount of
working time needed if the work was done at the officersquo was ‐1 when 25 of the seats on the train
were occupied compared to ‐56 when lsquo90 of seats occupied a few people standingrsquo (Fickling et al
2008) 87 of the journeys in the survey response sample were 45 minutes or longer in duration
40 were 90 minutes or longer (DfT 2009)
The most recent UK data in relation to rail travel comes from the April 2012 omnibus survey
commissioned by the DfT (DfT 2012b) This study estimated from its results that just over a quarter
of the public had used a long distance train service (a journey of over 50 miles) in the previous
87
twelve months Those respondents who had undertaken a long distance train journey were asked
for their last such journey to recall how they had spent their time It was found that ldquo[t]he most
popular ways that users had passed time on their last long distance train journey included reading
books magazines and newspapers (69 per cent) looking at the view (47 per cent) sending texts
making calls or sending emails for personal reasons (38 per cent) eating or drinking (38 per cent)
and using electronic devices to watch films listen to music play games or use the internet (37 per
cent) A majority (40 per cent) of users said they had spent most time readingrdquo 11 spent most time
doing work for their job (including work textcallsemails) ndash 20 spent some time doing this These
figures are comparable to (though slightly lower than) those from the 2004 and 2010 National Rail
Passenger Surveysrsquo results
Work by Russell et al in New Zealand employed a structured observation approach (812 passengers)
to examine what people do on trains and buses (Russell et al 2011) It was found that ldquonearly two
thirds of passengers observed spent some of their travel time looking ahead or out of the window
(653)rdquo This study also reflected on methodological issues and drew comparison with other studies
including an observational survey of 161 Bay Area Rapid Transport System users in San Francisco
(Timmermans and Van der Waerden 2008) and an observational survey of 84 train users in the
Tokyo Metropolitan Region (Ohmori and Harata 2008) The San Francisco study observed few
people doing more than one thing during their journey and with doing nothing being the case for
64 of observed travellers The study in Japan focused on a short distance train which departed
from Machida at 630am and arrived at Shinjuku at 704am It found sleeping to be the most
observed activity (67 of observed passengers) followed by 62 observed reading 17 were
observed doing nothing Authors for all three studies note limitations in the observation approach to
studying travel time use Russell et al caution against the assumption that just because someone
appears to be doing nothing they are in fact doing so suggesting that in fact they could be lsquodoing
somethingrsquo ndash ldquothinking planning remembering praying daydreamingrdquo
A further observational study has concerned London Underground users (Gamberini et al 2012) It
confined itself to the observation of seated passengers with 1722 passengers and 1965 occurrences
of coded activities observed The authors note official data which indicates the average time spent in
a single underground car to be 127 minutes 26 of observed activities concerned technology use
22 talking with other passengers and 18 reading a book or paper Men were statistically more
likely than women to be using at least one technology device As with the national rail insights where
journeys of less than 15 minutes have a stronger likelihood of lsquopassiversquo activities such as window
gazing being dominant passive activities are also common on the Underground when people are
travelling for only two stops However ldquo[f]or people leaving at the fourth fifth or sixth stop after
they got on the train passive occupations were not the most common activityrdquo The study also drew
attention to findings from a recent Which report revealing that ldquothe majority of mobile phone
owners would welcome mobile coverage as they travelled on the London Undergroundrdquo with
ldquoapproximately one third of respondents stat[ing] that they would use it to do work during their
tripsrdquo
88
Time Use by Car Drivers
By comparison to public transport fewer studies have examined travel time use by car drivers yet
this is important given the assumptions in the absence of data that such time use would be less
worthwhile or productive than that by train in particular because of the constraints to multitasking
of the driving task itself
Eric Laurier has been noted as one of the pioneers of in‐depth work into the use of the car as a
mobile office or place for activity (Laurier et al 2008) However the study that perhaps has most
salience for considering business travel time and value of time savings is one by Hislop (2012) He
undertook a survey of business travellers at a motorway service station (149 responses) and a set of
15 follow‐up interviews The survey evidence concerned individuals for whom journeys ldquowere
intrinsic to their work and involved travelling between diverse locations during the working dayrdquo
Nearly a third of respondents regularly (2‐3 times per week) used their car for work‐related purposes
and over half used their phone while driving either lsquoquite a lotrsquo or lsquoa great dealrsquo Hislop suggests that
drivers use their phones extensively whilst being aware of the distraction they cause because ldquothey
felt under pressure both to make use of their driving time productively and to deal with calls
regarded as urgent or necessaryrdquo He also found that ldquoa number of interviewees argued that driving
time could be used for thinking about workrdquo The study also explored driversrsquo use of service stations
finding that ldquobusiness travellers often utilized much of their time spent in their cars when parked to
communicate with remote people such as clients or colleaguesrdquo Car environments were seen as
ldquorelatively private spaces over which drivers had a reasonable level of controlrdquo At the same time lack
of space could inhibit ability to work prompting advice to car manufacturers about how design could
improve in terms of facilitating use of a vehicle as a working environment
A second study merits brief review for the principal reason of highlighting how change has occurred
over time in relation to mobile technologies and forms of communication A 1994 study looked at a
sample of 90 business people ldquostopping at roadside restaurants and service areasrdquo (Eost and Flyte
1998) Implicit in the reporting was that activities undertaken in the car were referring to those done
while the car was stationary and the principal focus was on paperwork as the medium The following
extracts from the paper itself reflect how 18 years ago mobile technologies were different in their
nature availability and use ldquoOf the 70 people who used a telephone to keep in touch the most
commonly used type of telephone was a fixed car telephone (39) with analogue cell telephones the
next largest category (28) Two of the case study respondents were expected by their company to
keep in touch using public telephones as were 18 of those in the interview surveyrdquo ldquoFifteen
interview survey respondents had a computer in their car [d]ata were usually sent to or from the
office only once a day or lessrdquo ldquoThe number of people using an in‐car computer was small although
it is likely to rise as more and more companies utilise computers in their business dealingsrdquo
ldquoCompared with office environments the use of computers for word processing in the mobile
environment was hardly ever mentionedrdquo
89
Time use by pedestrians
A study by Middleton (2009) provides a reminder that while receiving less attention in the literature
walking too can be a mode where travel time use has positive connotations for work productivity
The study examined walking in London using a mixed method approach including a postal survey
walking diaries and in‐depth interviews The author observes that ldquofor many residents walking is a
significant part of their day‐to‐day working life ndash they work whilst they walkrdquo To illustrate this
observation the following quote from a participant is offered
ldquoThe next few minutes are lost to me I must have walked past the theatre but didnt notice
as my brain has switched to thinking about brochure spreads and advertisements Its
amazing how I suddenly start conceiving ideas about work whilst walking along even without
realizing it Since I get paid to think I wonder if I should be paid for my walking But then
again I also get paid to be in by 9rdquo
Multi‐Modal Studies
Two studies examine travel time use across public and private transport modes Ettema et al (2010)
secured 662 responses to an activity‐travel‐communication diary in the Netherlands with the sample
skewed towards highly‐educated professionals It was found that ldquowith increasing travel time the
share of travellers not engaging in any activity during travel becomes smaller both for car and for
train For train the share working during the trip increases from 56 for trips under 30 minutes to
423 for trips longer than 90 minutesrdquo Further it was noted that ldquotravel mode is the major
predictor of working while travelling Working on the move hardly happens for car drivers and
passengers although it happens to some extent (49) on trips longer than 60 minutesrdquo
OrsquoFallon and Wallis (2012) have surveyed 512 Auckland and Wellington metropolitan area residents
in terms of ldquothe lsquoutilityrsquo of travel time when commuting to work on tertiary studyrdquo The study
explored peoplersquos estimated commute times against their stipulated ideal commute times ldquoThe
median existing or estimated commute time (EC) for all commuters was 20 minutes The median
ideal commute time (IC) of 10 minutes identified by our sample meant that 68 of respondents spent
more time commuting each day than they would have liked tordquo In relation to the statement lsquoI enjoy
the time I spend commuting to workrsquo 35 of those driving a car most frequently for commuting
strongly agreed or agreed the figures were 68 for walkcycle and 35 for public transport
Considering estimated commuting time to workstudy in relation to the statement the proportions
agreeing or strongly agreeing were as follows 0‐9 mins ndash 58 10‐19 mins ndash 47 20‐29 mins ndash 39
30‐39 mins ndash 32 40+ mins ndash 24 In other words lsquoenjoymentrsquo of the commute diminishes with
commute duration It was also found that those who enjoyed their jobs were more likely to enjoy
their commute The study found that ldquo[a]bout one‐fifth reported doing work or study activity
namely readingwritingtypingthinking while commuting One‐third (33) of commuters were
contented with their time spent commuting enjoying it and finding it a useful transition between
home and workrdquo
90
Understanding Business Travel Time
Gustavson (2012) undertook 12 semi‐structured interviews with travel managers in Sweden followed
by interviews with 22 employees in relation to their business travel (across modes ‐ it was noted that
lsquo[r]elatively few travellers in the study made business trips by carrsquo) He found that employers do not
tend to have explicit expectations about work during travel time ndash however expectations were
instead about ldquogetting onersquos work done in a satisfactory wayrdquo The study revealed that ldquoalthough
travellers often appreciate having good working conditions while travelling the first priority for many
frequent travellers is to minimize time spent away from home and family rather than to make
productive use of their travel timerdquo In this regard there were strategies to replace physical meetings
with virtual equivalents or to combine meetings associated with a given journey The author
identified four different attitudes to travel time and working time
1 Travel as any other working time ndash mobile workers whose work goes with them and is done
wherever they are including travelling
2 Travel on long distance journeys as a special kind of working time ndash ldquoan opportunity to perform
work tasks that demand undisturbed and uninterrupted time and are therefore difficult to do at
onersquos regular workplacerdquo
3 Travel as inappropriate for or a poor second for undertaking work ndash leading to no work being
done or done with limited efficiency
4 Travel as valuable lsquotime outrsquo ndash ldquotime that travellers use for relaxation and restorationrdquo
Holley et al (2008) provide an examination of time for work which is specifically oriented towards
questioning the wage‐rate approach in economic appraisal This is a theoretical paper informed by
UK empirical evidence from a national rail passenger survey and from an in‐depth case study of a
knowledge worker The paper in reflecting on current approaches to economic appraisal of
transport schemes notes a further assumption beyond those often recognised namely ldquothat it is
possible to clearly distinguish between what constitutes productive or unproductive use of time and
in turn assign corresponding economic valuesrdquo It points out that Taylorism and Fordism18 provide
the roots to the current economic appraisal approach ndash with the notion that business travel time is
lsquoemployer ownedrsquo time and leisure and commute travel time is lsquoownedrsquo by the individual The
authors argue that the knowledge economy has brought a ldquoreduced (and reducing) dominance of the
18 ldquoIn 1911 Taylor first published The Principles of Scientific Management (19111972) which introduced the
idea of breaking manual labour into its component parts (or motions) in order to remove those which were not
necessary and rearrange the remaining components so that they were conducted in a more efficient manner
and achieved greater productivity It also resulted in a complete removal of workersrsquo autonomy A similar
approach was taken by Henry Ford for car production lines a few years later A dominance of these work
practices would aid in the justification of transport appraisalrsquos approachrdquo (Holley et al 2008)
91
clock‐controlled industrialized time and a resurgence of the pre‐industrial task‐oriented concept of
timerdquo They go on to suggest that ldquoa strict adherence to the task‐oriented concept of time would
imply that the lsquoownershiprsquo of the time is determined by the activity consuming that time Time spent
conducting non‐work activities while travelling is not automatically a cost to the employer that needs
to be reducedrdquo Over and above adding evidence concerning productive use of travel time this paper
puts forward further challenges ldquoto the current understanding of business travel time informing UK
transport appraisalrdquo
1 Why does the purpose of a journey define what constitutes time use within it and related
saved time In a task‐oriented knowledge economy ownership of time is more sophisticated
than this
2 ldquothe possibility that business travel time serves a similar function to traditional work breaks ndash
providing anti‐activity time which can assist productivity at other time periods and assist
creativity by providing lsquoincubationrsquo timerdquo
A44 AConceptualisationofTravelTimeProductivity
Reference was made at the start of this review to a paper by Lyons and Urry (2005) The literature
above has tended to be lsquoin search of positive utility of travel timersquo Lyons and Urry recognised that
not all travel experience is positive and put forward a conceptualisation of travel time productivity
This postulates that across all travellers and journeys for a given mode a distribution of levels of
productivity of time use must exist and that these distributions would vary across modes To be of
practical value this would require calibration with empirical data Nonetheless the conceptualisation
(reproduced below) illustrates what might be seen as the full array of productivity consequences of
time invested in travel This extends beyond the two apparent bounds of lsquounproductiversquo and lsquorsquofullyrsquo
productiversquo to include lsquocounter‐productiversquo (ldquotime use that not only achieves no benefit in itself but
also has an adverse effect on time use beyond the journey (eg a stressful commute journey affects
an individualrsquos level of productivity once they reach work)rdquo) and lsquorsquoultrarsquo productiversquo (ldquothe use of time
on the journey has been more beneficial than had that time been used otherwise (eg getting more
work done because of the lack of interruptions which tend to disrupt thinking in the office)rdquo)
Figure reproduced from Lyons and Urry (2005) ndash ldquoillustrative frequency [f] distributions of
lsquoproductivityrsquo of travel time by moderdquo
A45 ReflectionsontheLiteratureExamined
A number of key summarising points can be made from this examination of available literature on
travel time use
1 Methodological approaches to gaining insights into travel time use are varied and studies often
appear to face significant constraints in terms of balancing breadth and depth of coverage
Observing or recording what people do with their time falls short of understanding why they use
the time in the way that they do and how this time use finds its place in their overall time use
2 The evidence as gathered is limited in terms of attempts to distinguish between different types
of business travel and is likely to have an implicit focus upon or leaning of emphasis towards
lsquobriefcase travellersrsquo It is important to recognise this potential lsquoevidence gaprsquo It should certainly
not be assumed in the absence of evidence that productive travel time use is less prevalent
within business travel beyond the bounds of briefcase travellers
3 There are clear modal differences in relation to productive use of travel time While the
assumption that rail holds more prospect than car for productivity is likely to be robust the car
environment nevertheless has prospect for worthwhile time use and indeed this may be
increasing over time
4 Attempts to judge any sense of relative productivity of time use between travel and non‐travel
are especially scarce in studies of time use which are often not principally concerned with
consequences for economic appraisal
5 However there are qualitative insights to suggest that the full span of the conceptualised
distributions depicted by Lyons and Urry (2005) occur in practice In other words for some the
92
93
6 There is recognition of the permeability between work and non‐work time or indeed the drift
towards unbounded work and non‐work time such that individuals are incorporating their travel
time use into a wider blend of daily time use that is geared towards meeting work social and
personal goals There is clear evidence for example that some people use some of their
commute time for work activity and some people use some of their work‐related travel time for
personal activities
7 Evidence for rail suggests that change over time is occurring in terms of ways of working and
communicating in the knowledge economy and a reducing distinction between the key facilities
for work in lsquothe officersquo or lsquoon the moversquo For both rail and car (and likely all modes) technologies
are evolving that appear to increase the versatility of and support of work and personal activities
that can be undertaken during travel Evidence is now available that highlights change over a six‐
year period With scheme appraisal potentially covering ten times longer into the future change
could be dramatic and unpredictable and not necessarily in one direction
8 Observation or self‐completion questionnaires are likely to massively over‐simplify how activities
relate to an individualrsquos overall productivity in their employment role To fulfil for example a
knowledge workerrsquo role is likely to involve a blend of reflecting thinking planning reading
writing typing talking and so on There is evidence to suggest that with suitable advance
planning individuals are able to align the travel environment and time with appropriate
elements of this blend to good effect
9 While there are clearly some journeys for which the experience for the traveller does not offer
much if any positive utility the evidence points towards an appreciable existence of positive
utility within travel across modes It is contestable whether notions of proportions of a journey
which are either productive or not productive are too reductionist added to then by notions of
determining the relative productivity of productive time on the move compared to that outside
of travel
10 It seems clear that there is significant heterogeneity of travel time experience and utility across
people modes and specific journey contexts In some respects this heterogeneity is
accommodated within the wage rate approach which has its focus upon the average or
aggregate picture However the evidence on travel time use in particular highlights how time
use varies with journey duration which in turn will have consequences for the (subjective) utility
the time is judged to offer This may be difficult to accommodate in any approach to economic
appraisal unless some forms of disaggregation of travel circumstances are introduced and
treated separately Such disaggregations may relate for example to journey duration
There is evidence then to suggest a strong presence of travel time use activities that derive personal
or work benefits The extent to which this positive utility prevails is likely to vary by context At the
94
same time there is some evidence to support the view that mobile technologies and changing ways
and norms of working are contributing to increasing the propensity for travel time to be used in
ways that derive benefit to the individual in either their work or personal lives The emerging
evidence also underlines the sophistication of how society and the individuals within it choreograph
activity participation in time and space Such sophistication may defy any attempt to adequately
reflect it through metrication and measurement as is implied by the thinking embodied within the
Hensher formula Productivity eludes being commoditised in blocks of time where it can be judged
for different spatial contexts as being lsquomorersquo or lsquolessrsquo productive Such a reductionist way of thinking
may well be perilous and far from lsquofuture proofrsquo as we move ever further from the FordistTaylorist
approaches to work
Annex 4 References
DfT (2009) Productive Use of Rail Travel Time and the Valuation of Travel Time Savings for Rail
Business Travellers ‐ Final Report
DfT (2012a) Values of Time and Vehicle Operating Costs TAG Unit 356 Department for Transport
August
DfT (2012b) Public attitudes towards train services results from the April 2012 Opinions Survey
Department for Transport
Eost C and Galer Flyte M (1998) An investigation into the use of the car as a mobile office Applied
Ergonomics 29(5) 383‐388
Fickling R H Gunn et al (2008) The productive use of rail travel time and value of travel time
saving for travellers in the course of work Proc European Transport Conference Association for
European Transport Leeuwenhorst Conference Centre The Netherlands
Gamberini L Spagnolli A Miotto A Ferrari E Corradi N and Furlan S (2012) Passengersrsquo
activities during short trips on the London Underground Transportation
Gripsrud M and Hjorthol R (2012) Working on the train from lsquodead timersquo to productive and vital
time Transportation 39 941ndash956
Gustafson P (2012) Travel time and working time What business travellers do when they travel
and why Time amp Society 21(2) 203ndash222
Hislop D (2012) Driving Communicating and Working Understanding the Work‐related
Communication Behaviours of Business Travellers on Work‐related Car Journeys Mobilities
Holley D Jain J and Lyons G (2008) Understanding Business Travel Time Use and its Place in the
Working Day Time amp Society 17 (1) 27‐46
95
Laurier E Lorimer H Brown B Jones O Johlin O Noble A Perry M Pica D Sormani P
Strebel I Swan L Taylor AS Watts L and Weilenmann A (2008) Driving and lsquoPassengeringrsquo
Notes on the Ordinary Organization of Car Travel Mobilities 31 1‐23
Lyons G and Urry J (2005) Travel time use in the information age Transportation Research 39(A)
257‐276
Lyons G Jain J and Holley D (2007) The use of travel time by rail passengers in Great Britain
Transportation Research 41(A) 107‐120
Lyons G Jain J Susilo Y and Atkins S (nd) Comparing rail passengers travel time use in Great
Britain between 2004 and 2010 Forthcoming in Mobilities
Middleton J (2009) `Stepping in time walking time and space in the city Environment and
Planning A 41 1943‐1961
Mott MacDonald Hugh Gunn Associates TRI Napier University Accent and Mark Bradley Research
and Consulting (2009) Productive Use of Rail Travel Time and the Valuation of Travel Time Savings
for Rail Business Travellers Final Report to the Department for Transport
OrsquoFallon C and Wallis I (2012) A wider look at how travellers value the quality and quantity of
travel time NZ Transport Agency research report 469
Ohmori N and N Harata (2008) How different are activities while commuting by train A case in
Tokyo Tijdschrift voor economische en sociale geografie Royal Dutch Geographical Society 99(5)
547‐561
Russell M R Price et al (2011) What do passengers do during travel time Structured
observations on buses and trains Journal of Public Transportation 14(3) 123‐146
Susilo Y Lyons G Jain J and Atkins S (2012) Rail Passengersrsquo Time Use and Utility Assessment
2010 findings from Great Britain with multivariate analysis Proc 91st Annual Meeting of the
Transportation Research Board Washington DC January And forthcoming in Transportation
Research Record
Timmermans H and Van der Waerden P (2008) Synchronicity of Activity Engagement and Travel in
Time and Space ‐ Descriptors and Correlates of Field Observations Transportation Research Record
Journal of the Transportation Research Board No 2054 Transportation Research Board of the
National Academies Washington DC 1ndash9
96
ANNEX5 LABOURMARKETCONDITIONSANDIMPLICATIONSFORTHEVALUATIONOFBUSINESSTRAVELTIMESAVINGS
A51 Introduction
A511 Objectives
This note forms an annex to the main report to the Department for Transport on the valuation of
travel time savings to business travellers The purpose of the annex is to review UK labour market
conditions and their implications on the valuation of the business value of time for use in cost
benefit analysis The issue of the use of time whilst travelling (ie the productivity of travel time) is
discussed in a different working report (Annexes 3 and 4)
Such a review is necessary as the different valuation methods cost saving method adjusted cost
saving method Hensher model etc (see Chapter 2 of main report for brief descriptions of the
different methods) require competitive labour and product markets to give robust valuations By
assuming a competitive labour market the marginal product of labour can be taken to be the
observed wage rate plus non‐wage costs Historically this has been taken to be quite a reasonable
assumption in developed economies For developing or emerging economies this condition has long
been recognised as being inappropriate If markets are not competitive either the wage plus non‐
wage costs may differ from the marginal product of labour or the resource value of labour released
into the labour market will not equal its marginal product
Given this transport appraisals in developing countries use shadow prices for labour when it is clear
that markets are not competitive (Howe 1976 Barrington 1977 Mackie Nellthorp and Laird 2005
TRN‐15) The assumption that markets approximate competitive conditions in developed countries
is now also challenged when compared to the situation forty or fifty years ago when the cost saving
method was introduced They are challenged on a number of fronts Firstly the Department for
Transport as part of its wider impacts guidance has acknowledged that the product market is
sufficiently different from competitive conditions to warrant including product market surpluses in
the cost benefit analysis (DfT 2012b) Secondly the recent economic downturn has once again put
the spotlight on high unemployment levels as being indicative of structural unemployment and a
market failure in the labour market Furthermore the concept of competitive labour market
conditions for all sections of the workforce is being challenged (Manning 2003) The question that
this annex therefore aims to address is whether it is necessary to adjust the market wage (ie
shadow price labour in some form) when estimating the business value of travel time savings
97
A512StructureofAnnex
For completeness of discussion we present in this report all relevant market failures that affect or
potentially can affect the labour market and discuss their implications for valuing business travel
time savings Following this short introductory section the second section discusses the implications
of labour taxes (ie income tax) whilst the third section discusses the implications of structural
unemployment Imperfect competition in the goods market and in the labour market are discussed
in sections four and five respectively whilst section 6 contains a discussion regarding the impact of
increased flexible working on whether time savings are transferred to additional work or leisure
The final section summarises the main points and identifies areas of further research the
implications of the different labour market conditions for the different valuation methods and the
implications for appraisal
A52 IncomeTax
Income taxes distort the labour market by driving a wedge between the wage faced by employers
and that received by employees This restricts employment to levels below that associated with fully
competitive conditions This distortion generates welfare benefits (equivalent to the increased tax
take) additional to user benefits when employment expands or wages increase (eg through
agglomeration impacts) (DfT 2005 Venables 2007 DfT 2012b) Departmental guidance recognises
these additional welfare benefits
From a business VTTS perspective income tax in an otherwise competitive economy does not
prevent the gross of tax wage equalling the marginal product of labour In a competitive economy
the presence of an income tax therefore means that the gross of tax wage can be used as a basis to
derive the marginal product of labour for workers
A53 StructuralUnemploymentExcessLabourSupply
If there is an excess supply of labour that is some form of market failure is preventing the wage rate
falling and the labour market clearing then the wage will not be a good reflection of the social value
of reducing employment or increasing employment (Boardman et al 2011 Chapter 4 Haveman and
Farrow 2011) This is important if valuing the business travel time savings using the cost saving
approach the Hensher model or variants of them This is because an implicit assumption of these
models is that labour if released into the labour market will be able to find work at their existing
marginal product ndash which if there is structural unemployment will not occur In such situations the
shadow price of labour could be used instead of the wage rate to reflect the social value of business
time savings
The shadow pricing of labour due to unemployment is well established aspect of cost benefit
analysis Certain texts on the matter suggests that when unemployment levels are below 5
98
frictional unemployment dominates and the opportunity cost of labour is the wage (see eg
Boardman et al 2011 pp105‐108) When it is higher than 5 the opportunity cost is less than the
wage and some form of shadow pricing is needed As can be seen from Table A51 unemployment
levels exceed 5 in 84 of local authorities in Great Britain and exceed 10 in 17 of local
authorities
Table A51 Unemployment Levels in GB (2011‐12) at a Local Authority Level
Local authorities in GB
Unemployment rate
Number Percentage
Unemployment greater than 10 69 17
Unemployment greater than 75 and up to or equal to 10 94 23
Unemployment greater than 5 and up to or equal to 75 178 44
Unemployment greater than 3 and up to or equal to 5 65 16
Unemployment greater than 0 and up to or equal to 3 0 0
Total 406 100
Source ONS annual population survey [Apr 2011-Mar 2012] accessed via wwwnomiswebcouk (Oct 5th 2012) Note Numbers and are for those aged 16 and over is a proportion of economically active Figures and percentages are modelled based
Obviously the rate of unemployment varies geographically but it also varies systematically in other
ways for example by gender age and skill level Additionally it will vary temporally as ideally the
rate of unemployment will return to pre‐2008 levels at some point in the future
To understand whether shadow pricing labour for unemployment is empirically relevant to the
valuation of business travel time savings we need a comparison between the skill levels of the
unemployed and business travellers This comparison needs to relate to the area in which the
business travellers originatereside The market wage would only be adjusted to a shadow price if
the unemployed and business travellers are substitutable For this study such information is not
available We would however conjecture that for modes of travel that cater for mobile high skilled
workers (eg rail travel) that the skills of the unemployed cannot be substituted for such workers
Adjusting the business value of time for modes such as rail is not therefore likely to be empirically
relevant In contrast where a reasonable percentage of business travel is be undertaken by low and
medium skilled workers (eg those in administration or construction sectors in an urban area) then
the skills of the unemployed and some lsquobusinessrsquo travellers might be considered substitutable
Further research however would be needed to confirm this conjecture
Shadow pricing labour for unemployment may have implications in other aspects of appraisal that
include a labour component These are as follows
99
Capital costs
Operating costs both of public transport services and cars (non‐fuel element)
Wider impacts (agglomeration and move to more productive jobs)
At this point in time it is unclear how empirically relevant to a cost benefit analysis shadow pricing
labour for unemployment would be nor how onerous the task would be to shadow price labour for
unemployment effects Further research on this topic is required before such conclusions can be
drawn
A54ImperfectlyCompetitiveMarkets
A541 ImperfectGoodsProductMarket
A competitive goodsproduct market is a necessary condition for the cost saving method for the
Hensher model and its variants There are two relevant goodsproduct market failures indirect
taxation and imperfect competition arising through for example product differentiation or
geographic monopolies Appraisal methods account for both of these market failures in that any
surpluses additional to user benefits are estimated in the cost benefit analysis (DfT 2011 2012b)
The average rate of indirect taxation in the economy is 190 (DfT 2012a) whilst marginal costs are
taken to be 20 lower than shop prices (DfT 2005 p49) The evidence reviewed by DfT (2005)
however shows that this lsquoaveragersquo mark‐up disguises tremendous variability by industry with a range
in the mark‐up from 0 to mark‐ups in excess of 40 in some sectors
There is also ample evidence at an international level that perfect competition does not prevail For
example for 10 EU countries Badinger (2007) estimates markup factors of price above marginal costs
of approximately 13 for manufacturing and construction and 137 for services for the late 1990s
Christopoulou and Vermeulen (2008) also find evidence that rejects the perfect competition
hypothesis with price‐marginal cost factors of 137 in 8 Euro area countries and 131 in the US They
also find that the price‐marginal cost margins are not uniform with significant variation by industry
and country lying behind these headline numbers
In both situations the market failure reduces output below that which would occur under
competitive conditions Employment levels are therefore lower in the presence of either indirect
taxes or imperfect competition than they would be under perfect competition Whilst the firm is a
wage taker (and the labour supply curve it faces is perfectly elastic) these market failures can
operate at an economy wide level As the labour supply curve for the economy as a whole is elastic
there then exists a gap between the wage and the marginal product of labour (with a competitive
labour market) This is because the firm equates the wage to the marginal revenue product of
labour Therefore with an imperfectly competitive goods market and a competitive labour market
the value of marginal product of labour is greater than the wage The situation of an imperfectly
competitive labour market is discussed below
100
‐unionised elements of the workforce
A542ImperfectLabourMarkets
Whilst the pervasive view is that labour markets in developed economies are competitive19 this
view faces a number of challenges (Manning 2011) One of the central criticisms is that the
competitive labour market model regards firms as wage takers where if the wage rate was lowered
by 1 penny the firm would lose all its employees This is clearly a simplification Other
characteristics of labour markets that can be taken to be symptomatic of the presence of
imperfections include firms attitudes to general training (ie transferable between firms) and
recruitment costs job search costs of employees as well as differences in pay and conditions
between public and private sector union and non
From the perspective of transport policy cost benefit analysis the issue is not what causes the
imperfections but whether any market imperfection leads to the wage departing from the marginal
product of labour This is because we are interested in whether the market wage needs to be
adjusted (ie shadow priced) in some way to reflect the actual marginal product
In an imperfectly competitive labour market rents are derived from the employment relationship
either by the employer or worker or both If an employer gets rents the marginal product is above
the wage whilst if a worker gets the rents then the wage is a good indicator of the marginal product
of labour Manning (2011) in reviewing the evidence on the size of such rents in the labour market
concludes that rents in the region of 15 to 30 are plausible There is however a lot of variation
and enormous uncertainty in these estimates The limited evidence that does exist suggests that
most of the rents are being accrued by workers ndash implying wages are close to marginal product
Evidence that imperfect competition exists in the labour market can also be found through a joint
transport sector labour market analysis With imperfect competition in the labour market
commuting costs will not be fully compensated if firms have more market power than workers
Manning (2003) shows that this is the case for the UK whilst Rouwendal and Van Ommeren (2007)
demonstrate that it is the case for the Netherlands Whilst these averages suggest that on the whole
labour markets are imperfectly competitive arguably the level of competitiveness will vary with
labour market segment Mobile workers typically high skilled and the primary wage earner in a
household arguably would face a competitive labour market as the household may move or migrate
in response to their work Workers in lower skilled occupations women ethnic minorities arguably
face restricted geographic search areas and high mobilitymigration costs (Madden 1981 1985 Zax
1991 Ihlanfeldt 1992 McQuaid Greig and Adams 2001) and therefore are more likely to face an
imperfectly competitive labour market Laird (2008) finds evidence for varying degrees of imperfect
competition by labour market segment Following the work of Manning and Rouwendal and Van
Ommeren in a Scottish context Laird finds that the level of compensation for commuting costs
19 A labour market can be competitive even when the product market is not competitive
101
varies by labour market segment urbanrural gender and skill level The implication is that the
market wage is likely to be a good estimate of the marginal product for lsquomobilersquo workers
A543Synthesis
The lack of evidence in this field makes it difficult to give recommendations on the size of any gap
between the wage and the marginal product of labour for business travellers On the basis of what
evidence there is it would seem that the wage is a reasonable approximation for the marginal
product of labour for business travellers despite the prevalence of market imperfections This is
because firstly a lot of business travel is conducted by lsquomobilersquo workers and secondly that what
evidence there is suggests the rents accrue to workers That is there is no need to shadow price
labour as a consequence of market imperfections ‐ further research however may be needed to
confirm this
A544FlexibleWorking
The cost saving approach was devised at a time when it could be argued there was a degree of
rigidity in the labour market So the distinction between employerrsquos business time and non‐working
time was relatively clear cut The modern service economy is no longer characterised by the
formalised work contract The lsquowhite collarrsquo and lsquopink collarrsquo worker now dominate the lsquoblue collarrsquo
worker in the workforce20 Simultaneously there has been an increase in a more flexible working
environment flexi‐time job‐sharing flexible working Sunday working has also increased
particularly in retail and entertainment This is relevant to the context of business travel time
savings because the value of business travel time savings will vary depending amongst other reasons
upon the contractual arrangements the worker has with the employer (primarily whether they work
paid or unpaid overtime) ndash see section 2 of the main report and Annex 1 for further discussion The
discussion contained in this section is complementary in many ways to that in Annex 4 on the use of
travel time
There has been notable shift to more flexible working over the years The number of hours worked
in a lifetime has decreased from 124000 in 1856 to 69000 in 1981 (Ausubel and Gruumlbler 1995)
Average weekly hours of a manual worker have fallen from 53 hours in 1943 to 435 in 1987 (ONS
2003) This trend has continued with average hours worked having fallen by 47 since 1991 (ONS
2011) The ONS attribute this latest decrease to a ldquomixture of structural changes in the economy
and more flexibility in the hours chosen by employees or offered by employers (including more part‐
time working)rdquo Part‐time working21 is obviously a key component of flexible working with part‐
20 White collar workers work in offices typically at a desk blue collar workers undertake manual work whether it is skilled or unskilled whilst pink collar workers undertake work that involves customer interaction (eg entertainment and sales) 21 There is no formal definition of part‐time working in the UK Workers are asked to categorise themselves as either part‐time or full‐time
102
time workers form 27 of the UK workforce (ONS 2011) The structural shift in the economy from
manufacturing to service sector is one of the key reasons that more flexible working arrangements
have been adopted The service sector currently comprises 80 of employment in Britain compared
to 68 in 1992 and in 2011 part‐time workers comprised 31 of the service sector workforce
compared to only 8 of the manufacturing workforce (ONS 2011) There is no reason to expect a
shift to more part‐time work to halt For example 49 of workers in the Netherlands are part‐time
(ONS 2011)
Flexible working extends beyond working part‐time In 2003 some 6 million workers22 (27 of
women and 18 of men) it is estimated had working patterns that differed from the standard
pattern (Hibbet and Meager 2004)23 Such variability arises from flexitime term‐time working
annualised hours job sharing nine‐day fortnights and zero hour contracts (see Table A52)
Furthermore as can be seen from this table in the three years analysed there was a continuing trend
towards increased variability in working patterns In addition to these types of working patterns
some 5 of the workforce also engage in telework24 (White et al 2007) These workers typically
are the higher income workers holding senior positions who use computers and telephones as part
of their daily jobs Such workers are typically judged on the outcomes they produce rather than the
hours of work they give to the firm The nature of teleworking also means that manual workers
(blue collar) and customer focused workers (pink collar) typically do not telework
Table A52 Variations in Working Patterns in Great Britain
Percent
Women Men
Working patterns
2000 2003 2000 2003
Flexitime 11 12 8 9
Term-time working 7 8 1 1
annualised hours 4 5 4 5
Job sharing 1 2 ~ ~
Nine day fortnight 1 1 2 2
Zero hours 1 1 1 1
None of the above 75 73 84 82
Source Hibbet and Meager (2003)
22 Both part‐time and full‐time 23 This includes part‐time and full‐time workers ndash though being part‐time itself does not constitute flexible working 24 Telework is a work arrangement in which employees do not commute to a central place of work
103
The move away from the formalised working week in todayrsquos economy is also evident by the
importance of weekend working (some 29 of workers usually work on Saturdays whilst 21
usually work on Sundays) and by the fact that 35 of the workforce sometimes work either paid or
unpaid overtime25
The evidence clearly points towards a very different labour market today than that of forty or fifty
years ago The structure of the economy has altered and with it the need for flexibility and
variability in working patterns The labour market however remains very heterogeneous Whilst
flexible working employees (ie those that work non‐standard work patterns and part‐time) are now
a very significant component of the workforce the majority of the workforce still do not have any
flexibility in their work and furthermore the majority of workers do not work overtime Some
groups of workers are judged on outputs whilst others remain contracted to provide hours of work
(albeit those hours may be subject to some form of flexible working) The latter distinction is what is
most relevant to the valuation of business travel time savings From a business value of travel time
savings perspective different employment models are relevant to different workers and therefore
business trips
(i) Workers with fixed hours contracts with paid overtime Here travelling time will displace
time at the workplace no matter what time the trip occurs
(ii) Workers with flexi‐time contracts with ability to re‐coup overtime through days off Again
travelling time will displace time at the workplace no matter what time the trip occurs
(iii) Workers with contracts with unpaid overtime and the self‐employed
a Travelling during normal work hours Here business travel would be expected to
displace work
b Travelling outside normal working hours Here travelling for business may displace
leisure time as well as work time Employee would require compensation through
the wage at a rate depending on how onerous the travelling is compared to leisure
A reduction in travelling time would lead in the long run to a reduction in the level
of wage compensation required
For workers with paid overtime or flexitime (ie (i) and (ii) above) business travel will only displace
work activities That is the r term in the Hensher formula will be zero or close to zero ndash though this
should be tested empirically For workers working unpaid overtime but who travel during normal
work hours (ie (iii)a above) business travel displaces work and leads to an increase in unpaid
overtime Travel time savings would therefore lead to a reduction in unpaid overtime For workers
who are not paid overtime and travel outside of normal working hours (ie (iii)b above) business
travel could displace both work and leisure time For these workers (iii)a and (iii)b the r term in the
25 Source Quarterly Labour Force Survey (April ndash June 2012) Accessed via the Economic and Social Data
Service Nesstar Catalogue (accessed October 12 2012)
104
Hensher model will be greater than zero Whilst undoubtedly these travellers comprise a minority of
the workforce they are likely to be very relevant for certain policy interventions ndash particularly long
distance rail interventions This is because rail travellers are typically high skilled workers who are
not paid overtime and the long distance element of the rail market can involve early departures and
late returns home
A55SynthesisandFurtherResearch
A551 LabourMarketConditions
Drawing this evidence together the following points emerge
Income tax does not prevent the marginal product of labour elsewhere in the economy equalling the
wage plus non‐wage income
Unemployment levels in the UK are currently at levels typically associated with structural
unemployment which some suggest may justify some form of shadow pricing of labour This has
implications to other aspects of cost benefit analysis (eg treatment of capital costs in particular)
and also conflicts with current Treasury guidance The shadow price of labour will also vary with the
rate of unemployment ndash ie it will vary regionally
How the wage differs from the marginal product of labour varies with the type of market failure
Goods and labour market imperfections would suggest the wage is lower than the marginal product
Contrastingly an excess supply of labour would suggest that the resource cost of labour is below the
wage
There is a lot of variability in the labour market Some aspects of the labour market will be
competitive whilst at the same time others will be experiencing imperfect competition If these
imperfections vary systematically with income then because mode choice also varies systematically
with income then any adjustments to the wage rate to reflect market imperfections may need to
also vary by mode
There is a growing body of evidence that both the goods and labour markets are imperfectly
competitive in developed economies like the UK The degree of imperfection in both the goods and
labour markets appears to be empirically relevant With respect to the goods market this is already
recognised in DfT guidance The difference between the wage and the marginal product due to
imperfectly competitive markets is a function of market power and information asymmetries We
would therefore expect it to vary systematically by industry and occupation Evidence to date
suggests that workers seem to on average be exacting the majority of the rents Therefore despite
the markets being imperfectly competitive on average the wage may not differ too significantly from
105
the marginal product of labour ndash though to a certain extent this is conjecture as the evidence base is
small
With the shift to a more service based economy flexible working in all its different forms is much
more prevalent today than say forty years ago ndash when transport cost benefit analysis methods were
developed However standard working patterns still dominant Those working overtime are in a
minority (although a sizeable minority) but because such workers may self select to certain modes
of transport (eg rail) an explicit treatment of them in deriving business values of time is likely to be
necessary
A552 ValuationMethods
Aside from a direct elicitation of willingness to pay through either revealed or stated preferences
the other valuation methods typically build up a composite value of time from different components
of work plus the value of transferring travel time to non‐work activities As the discussion in this
report has solely concerned the adjustment to the wage to reflect the social value of transferring
more time to work only those aspects of the Hensher model (and its variants) would need to be
adjusted
The willingness to pay (by employers) approach circumvents much of the discussion regarding
imperfect goods and labour markets as well as the discussion regarding the transfer of time savings
to either work or leisure activities
A553FurtherResearch
In the short term (elapsed time less than 6 months) research could be conducted to examine the
influence of shadow pricing labour for high unemployment on a cost benefit analysis This would
require analysis of regional labour markets and a view on the longevity of the high unemployment
levels we are currently seeing A view on whether all parts of the labour market should be shadow
priced needs to be made as well A case may exist for shadow pricing low incomes and altering
transport appraisal guidance to disaggregate by income rather than by mode A key issue to note is
that current Treasury guidance in the form of the Green Book does not permit the shadow pricing of
labour
Similarly in the short term (within 6 months) given differing working conditions we would expect
that some elements of the labour market will transfer time savings to lsquonon‐workrsquo activities and
others to increased work This heterogeneity in the labour market needs to be taken account of in
future surveysresearch as it appears to vary systematically with occupation which is correlated
with travel behaviour (eg mode choice) and incomewages Key questions that need to be
addressed in future work would include
106
Which sections of the labour market have flexibility to transfer travel time savings to leisure
What are their characteristics
How does the proportion of such travellers vary by mode long and short distance
urbaninter‐urban and time of day
Is there evidence that employers are willing to pay to save such employees travel time early
in the morning or late at night (either revealed preference or stated preference)
In the longer term (elapsed time 12 months plus) the Department could commission research to
better identify the gap between the wage and the marginal product of labour which would help
implement the cost saving and Hensher methods (and their variants) Most of the problems related
to the Henshercost‐savings method arise because worker wages and costs are used as a proxy for
the increased output obtained from marginal increases in available working time but wages deviate
from marginal product for all the reasons discussed
An alternative potential approach which circumvents many of these problems is to obtain estimates
of the productivity of work time directly using firm micro‐data with information on firm outputs and
labour inputs Better still is to link these data to worker level data with detail on worker
characteristics wages and hours Recent research in labour economics has developed methods for
working with this type of linked employer‐employee data (Abowd and Kramarz 1999) and a
growing body of literature provides empirical applications Detailed firmplant level data and
individual worker data that can merged together by workplace identifiers is increasingly available
and the Annual Respondents Database (ARD) firm data and Annual Survey of Hours and Earnings
provides the potential for this analysis for the UK
Although not without its problems both in terms of data set up and analysis direct measurement of
the marginal product of working hours from firm level data provides an alternative strategy which
could be used to provide a point of comparison with wage‐based estimates of the value of business
travel time savings The size of these datasets also allows scope for analysis by occupational
industrial and geographical groups to provide greater insights into the heterogeneity both in
marginal product of work time and on the deviation between marginal product and wages Some
papers have already looked explicitly at the correspondence between wages and the marginal
product of labour using these kinds of data both in the US (Hellerstein Neumark and Troske 1999)
and for Britain (Galindo‐Rueda and Haskel 2005 Haskel et al 2005) and provide potential prototypes
A554 ImplicationsforAppraisal
The implications of the observed heterogeneity in the labour market are reasonably large if they
need to be taken account of fully It is clear the value of travel time savings will vary by time of day
(ie whether it is within or without the core business day) and by occupation of business traveller
The latter variation will lead to variations in values by (mode) and also most likely by short and long
107
distance trips or correspondingly between urban and inter‐urban trips The former (variations by
mode) are already reflected in appraisal practise but the latter (variations by shortlong distance)
are not Similarly variations by whether the trip occurs within or outside core business hours is not
reflected in current guidance
Annex 5 References
Abowd J M and F Kramarz (1999) Chapter 40 The analysis of labor markets using matched
employer‐employee data In Orley C Ashenfelter and David Card Editor(s) Handbook of Labor
Economics Elsevier Volume 3 Part B Pages 2629‐2710
Ausubel JH and Gruumlbler A (1995) Working Less and Living Longer Long‐Term Trends in Working
Time and Time Budgets Technological Forecasting and Social Change 50 pp195‐213
Badinger H (2007) Has the EUs Single Market Programme Fostered Competition Testing for a
Decrease in Mark‐up Ratios in EU Industries Oxford Bulletin of Economics and Statistics 69(4)
pp497‐519
Barrington A (1977) Valuing Time Savings in Developing Countries ndash A Comment Journal of
Transport Economics and Policy 11(2) pp195‐201
Boardman AE DH Greenberg AR Vining and DL Weimer (2011) Cost‐Benefit Analysis Concepts
and Practice Fourth Edition Upper Saddle River New Jersey
Christopoulou R and P Vermeulen 2008 Markups in the Euro Area and the US Over the Period
1981‐2004 A Comparison of 50 Sectors ECB Working Paper No 856 Report dated January 2008
Coburn TM Beesley ME and Reynolds DJ (1960) The London‐Birmingham Motorway Road
Research Technical Paper 46 London HMSO
Department for Transport (2005) Transport Wider Economic Benefits and Impacts on GDP
Discussion Paper July 2005
Department for Transport (DfT) (2011) Transport User Benefit Calculation TAG Unit 353 London
Department for Transport Available online at lthttpwwwdftgovukwebtaggt (Accessed 23rd
August 2012)
Department for Transport (DfT) (2012a) Values of time and operating costs TAG Unit 356 August
2012 London Department for Transport Available online at lthttpwwwdftgovukwebtaggt
(Accessed 23rd August 2012)
108
Department for Transport (DfT) (2012b) The Wider Impacts Sub‐Objective TAG Unit 3514 Draft
May 2012 London Department for Transport Available online at
lthttpwwwdftgovukwebtaggt (Accessed 23rd August 2012)
Galindo‐Rueda F and J Haskel (2005) Skills Workforce Characteristics and Firm‐Level Productivity
Evidence from the Matched ABIEmployer Skills Survey IZA discussion paper 1542 IZA Bonn
Haskel J Hawkes D and Pereira S (2005) How much do skills raise productivity UK evidence
from matched plant worker and workforce data CEPPR discussion paper 5334
Hellerstein JK D Neumark and KRTroske (1999) Wages Productivity and Worker Characteristics
Evidence from Plant‐Level Production Functions and Wage Equations Journal of Labor Economics
17(3) 409‐446
Hibbett A and Meager N (2003) Key indicators of womenrsquos position in Britain In Office for
National Statistics (ed) Labour Market Trends October 2003 pp503‐511
Howe J (1976) Valuing time in developing countries Journal of Transport Economics and Policy
10(2) pp113‐125
Fowkes AS Marks P and Nash CA (1986) The value of business travel time savings Institute for
Transport Studies University of Leeds Working Paper 214
Ihlanfeldt KR (1992) Intraurban wage gradients evidence by race gender occupational class and
sector Journal of Urban Economics 32 pp70‐91
Mackie PJ Nellthorp J and Laird JJ (2005) Toolkit for the Economic Evaluation of Transport
Projects Washington DC World Bank Available online at
httpwebworldbankorgWBSITEEXTERNALTOPICSEXTTRANSPORTEXTROADSHIGHWAYS0con
tentMDK20464962~pagePK148956~piPK216618~theSitePK33866100html (accessed 26th
September 2012)
Mackie PJ Jara‐Diaz S and Fowkes AS (2001) The value of travel time savings in evaluation
Transportation Research Part E 37 pp91‐106
Mackie PJ Wardman M Fowkes AS Whelan GA Nellthorp J and Bates J (2003) Value of
Travel Time Savings in the UK A report to the Department for Transport Institute for Transport
Studies University of Leeds UK
Madden JF (1981) Why women work closer to home Urban Studies 18 pp181‐194
Madden JF (1985) Urban wage gradients empirical evidence Journal of Urban Economics 18 pp
291‐301
109
Manning A (2003) Monopsony in Motion Imperfect competition in labour markets Princeton NJ
Princeton University Press
Manning A (2011) Imperfect Competition in Labour Markets In (eds) Ashenfelter O and Card D
Handbook of Labor Economics volume 4 Chapter 11 pp976‐1041North‐Holland Amsterdam
McQuaid RW M Greig and J Adams (2001) Unemployed job seeker attitudes towards potential
travel‐to‐work times Growth and Change 32(3) pp355‐368
Office for National Statistics (ONS) (2011) Hours worked in the labour market ndash 2011 Report dated
8th December 2011
Rouwendal J and J Van Ommeren (2007) Recruitment in a Monopsonistic Labour Market Will
Travel Costs be reimbursed Tinbergen Institute Discussion Paper TI 2007‐0443 Report dated 23
April 2007 Amsterdam Tinbergen Institute Amsterdam
Venables AJ (2007) Evaluating Urban Transport Improvements CostndashBenefit Analysis in the
Presence of Agglomeration and Income Taxation Journal of Transport Economics and Policy 41(2)
pp173ndash188
White P Christodoulou G Mackett R Titheridge H Thoreau R and Polak J (2007) The Role of
Teleworking in Britain Its Implications for the Transport System and Economic Evaluation European
Transport Conference Noordwijkerhout 17‐19 October 2007 London AET Transport
Zax JS (1991) Compensation for commutes in labour and housing markets Journal of Urban
Economics 30 pp192‐207
- ANNEX 1 TECHNICAL ANNEX ON THE HENSHER EQUATION
-
- A11 Introduction
- A12 Previous Literature
- A13 Defining the Objective Problem Behind the Hensher Equation
- A14 Solving the Objective Problem
- A15 Revealed Properties of the Hensher Equation
- A16 Special Cases of the Hensher Equation
- A17 Synthesis and Conclusions
-
- ANNEX 2 CURRENT APPRAISAL PRACTICE
-
- A21 Objectives
- A22 Structure of this annex
- A23 Business Travel in Great Britain
- A24 Measuring the Value of Business Travel Time Savings
-
- A241 GB practice and the Cost Saving Method
- A242 Alternative Valuation Approaches
-
- A25 International Appraisal Practice
- A26 Implementing the Cost Saving Method in Great Britain
-
- A261 Deriving the Hourly Wage
- A262 Non-Wage Labour Costs
- A263 Professional Drivers
- A264 Long run marginal costs
-
- A27 Summary
-
- ANNEX 3 REVIEW OF EVIDENCE ON BUSINESS TRAVEL TIME SAVINGS
-
- A31 Introduction
-
- A311 Aims
- A312 Scope
- A313 Structure
-
- A32 Definitions
- A33 Review of National Value of Time and Other Significant Studies
- A34 Willingness to Pay Evidence
-
- A341 Review of European WTP Evidence
- A342 Recent Japanese Evidence
- A343 High Speed Rail Evidence
-
- A35 Specific Issues and Insights
- A36 Conclusions
-
- ANNEX 4 TRAVEL TIME USE ndash AN EXAMINATION OF EXISTING EVIDENCE
-
- A41 Context
- A42 Introduction
- A43 Empirical Insights into Travel Time Use
- A44 A Conceptualisation of Travel Time Productivity
- A45 Reflections on the Literature Examined
-
- ANNEX 5 LABOUR MARKET CONDITIONS AND IMPLICATIONS FOR THE VALUATION OF BUSINESS TRAVEL TIME SAVINGS
-
- A51 Introduction
-
- A511 Objectives
- A512 Structure of Annex
-
- A52 Income Tax
- A53 Structural Unemployment Excess Labour Supply
- A54 Imperfectly Competitive Markets
-
- A541 Imperfect GoodsProduct Market
- A542 Imperfect Labour Markets
- A543 Synthesis
- A544 Flexible Working
-
- A55 Synthesis and Further Research
-
- A551 Labour Market Conditions
- A552 Valuation Methods
- A553 Further Research
- A554 Implications for Appraisal
-

2
Contents
ANNEX 1 TECHNICAL ANNEX ON THE HENSHER EQUATION 5
A11 Introduction 5
A12 Previous Literature 7
A13 Defining the Objective Problem Behind the Hensher Equation 7
A14 Solving the Objective Problem 13
A15 Revealed Properties of the Hensher Equation 16
A16 Special Cases of the Hensher Equation 18
A17 Synthesis and Conclusions 22
ANNEX 2 CURRENT APPRAISAL PRACTICE 26
A21 Objectives 26
A22 Structure of this annex 26
A23 Business Travel in Great Britain 26
A24 Measuring the Value of Business Travel Time Savings 31
A241 GB practice and the Cost Saving Method 31
A242 Alternative Valuation Approaches31
A25 International Appraisal Practice 31
A26 Implementing the Cost Saving Method in Great Britain 34
A261 Deriving the Hourly Wage 35
A262 Non‐Wage Labour Costs 36
A263 Professional Drivers 37
A264 Long run marginal costs37
A27 Summary 37
ANNEX 3 REVIEW OF EVIDENCE ON BUSINESS TRAVEL TIME SAVINGS 42
A31 Introduction 42
A311 Aims 42
A312 Scope 42
A313 Structure 43
A32 Definitions 43
A33 Review of National Value of Time and Other Significant Studies 44
A34 Willingness to Pay Evidence 71
A341 Review of European WTP Evidence72
3
A342 Recent Japanese Evidence73
A343 High Speed Rail Evidence75
A35 Specific Issues and Insights 79
A36 Conclusions 80
ANNEX 4 TRAVEL TIME USE ndash AN EXAMINATION OF EXISTING EVIDENCE83
A41 Context 83
A42 Introduction 83
A43 Empirical Insights into Travel Time Use 84
A44 A Conceptualisation of Travel Time Productivity 91
A45 Reflections on the Literature Examined 92
ANNEX 5 LABOUR MARKET CONDITIONS AND IMPLICATIONS FOR THE VALUATION OF BUSINESS
TRAVEL TIME SAVINGS96
A51 Introduction 96
A511 Objectives 96
A512 Structure of Annex97
A52 Income Tax 97
A53 Structural Unemployment Excess Labour Supply 97
A54 Imperfectly Competitive Markets 99
A541 Imperfect GoodsProduct Market 99
A542 Imperfect Labour Markets100
A543 Synthesis 101
A544 Flexible Working 101
A55 Synthesis and Further Research 104
A551 Labour Market Conditions104
A552 Valuation Methods 105
A553 Further Research 105
A554 Implications for Appraisal106
4
Acknowledgements
We would very much like to recognise the valuable assistance and advice provided to us by Jake
Cartmell and Dan Thomas of the Department for Transport in conducting this research
Disclaimer
Although this report was commissioned by the Department for Transport (DfT) the findings and
recommendations are those of the authors and do not necessarily represent the views of the DfT
DfT does not guarantee the accuracy completeness or usefulness of that information and it cannot
accept liability for any loss or damages of any kind resulting from reliance on the information or
guidance this document contains
ANNEX1 TECHNICALANNEXONTHEHENSHEREQUATION
A11Introduction
According to conventional theory savings in business travel time may derive benefits to the
employer and employee in the following ways
From the point of view of the employer
a) The time saving may be used to undertake more productive work at home or at the normal
place of work
From the point of view of the employee
b) The time saving may be devoted to additional leisure time at home
c) The time saving may be devoted to additional work time at the regular place of work
d) The time saving may permit a later departure for the business trip or an earlier arrival
home possibly leading to reduced fatigue
A number of approaches have been adopted for the estimating the potential benefits listed above
the predominant ones being the so‐called lsquocost savingrsquo and lsquoHensherrsquo approaches The cost saving
approach focuses upon the benefit source a) above and is underpinned by the following five
assumptions (Mackie et al 2003)
i Competitive conditions in the goods and labour markets
ii No indivisibilities in the use of time for production
iii All released time goes into work not leisure
iv Travel time is 0 productive in terms of work
v The employeersquos disutility of travel during work time is equal to their disutility of working
If these assumptions hold then cost savings arise from the direct compensationreward to the
employee plus any additional costs of employing staff On this basis the cost saving approach is
often referred to as lsquowage plusrsquo and the value of business travel time savings (VBTT ) is
formalised
S
VBTTS w c (1)
where
w is the gross wage
is the non‐wage cost of employing labour c
5
In contrast to the cost saving approach the Hensher approach considers benefit sources a) to d) and
thus combines the perspectives of the employer and the employee Whereas Hensher (1977) was
responsible for the intuition behind the approach Fowkes et al (1986) were responsible for its
lsquocodificationrsquo as follows
1 1VBTTS r pq MPL MPF r VW rVL (2)
where
r is the proportion of travel time saved that is used for leisure
p is the proportion of travel time saved that is at the expense of work done while travelling
q is the relative productivity of work done while travelling relative to at the workplace
MPL is the marginal product of labour1
MPF is the extra output due to reduced (travel) fatigue
is the value to the employee of work time at the workplace relative to travel time VWVL is the value to the employee of leisure time relative to travel time
is the portion of VBTT that is associated with the employer S
is the portion of VBTT that is associated with the employee S
Whilst the Hensher equation has found conceptual appeal practical implementation of the
complete framework has proved difficult Consensus seems to be that the and VW terms
are especially difficult to estimate (see the discussion in Mackie et al (2003) for example) and it is
not unusual to drop these from consideration Various authors have asserted that VL is simply the
non‐work VT and can thus be populated using standard values Of particular relevance to the
current discussion is the situation where the Hensher and traditional cost‐saving approaches arrive
at the same estimate of according to Mackie et al this is where and
In a similar vein a number of studies have implemented restricted
versions of the Hensher approach A notable example is the AHCG (1994) study which assumed
and (ie work and leisure are valued equally) thereby deriving the
identity
MPF
TS
PF M
VP
VBTTS
VL
0r p 0VW M PL
0MPF VW
1VBTTS r pq MPL VP
(3)
The identity (3) has also been implemented in several subsequent studies such as Algers et al
(1995) and the most recent Dutch study (not yet releasedpublished) In the subsequent discussion
we shall question the validity of (3)
1 To be more precise this term should be interpreted as the marginal revenue product of labour
6
A12PreviousLiterature
Despite the attention that it has received it is notable that Hensher never offered a formal
derivation of (2) from first principles Furthermore Fowkes et alrsquos (1986) codification of the Hensher
equation entailed a formal statement of (2) rather than derivation from first principles Working
Paper 3 from the 1987 UK national non‐work VTTS study (MVA ITS amp TSU 1987) contributed a
different piece of the jigsaw by defining an economic problem apparently underpinning the Hensher
equation (p72) but did not proceed to solve the problem This gap in the literature motivated the
recent contributions of Karlstroumlm et al (2007) and Kato (2012) Karlstroumlm et alrsquos derivation claims to
lsquocome closersquo to deriving the Hensher equation whilst Kato claims to derive it exactly
Karlstroumlm et al (2007) generalised Hensher by distinguishing between short distance and long
distance trips the latter were defined as trips where it would not be feasible to return to the office
at the end of the day after completion of the business trip They further distinguished between
private and social valuations of travel time savings where social valuations account for the incidence
of tax Kato (2012) adopted Karlstroumlm et alrsquos definition of short and long distance trips but
proposed a different definition of the objective function as the conflation of welfare accruing to the
employee and employer By contrast Karlstroumlm et alrsquos objective function was defined in terms of
the employeersquos welfare only with the employerrsquos interests represented only as a constraint
Despite being the more faithful to (2) Kato derivation is complicated and involves several
superfluous terms (for example the contribution to the employeersquos utility from leisure travel is
irrelevant to the derivation of VBTT ) Moreover the key transition (from his equation (26) to
(27)) and the interpretation of the resulting terms that give rise to the Hensher equation are
(arguably) not as clear as they might be The contribution of the subsequent discussion will be to
draw upon both Karlstroumlm et al and Kato but present a simpler derivation of the Hensher equation
(2) from first principles This will serve to clarify the interpretation of the terms within (2) and
expose several assumptions and properties
S
A13 DefiningtheObjectiveProblemBehindtheHensherEquation
In what follows we shall outline an optimisation problem wherein
The problem is defined in terms of the joint interests of the employer and employee
More specifically the objective statement is one of maximising welfare where welfare is
additive in profit generated by the employer (converted into utility units) and the utility of
the employee subject to a time resource constraint
7
More formally
Max
st
1
w l ww
T T X t
w w l
W PX wT U
T T r t r T
(4)
where
1 1w wX X T r p q r p q t
w w l w wU U T r t T r t t
and
W is social welfare
is the marginal utility of income
P is the sales revenue per unit of goods produced
X is the quantity of goods produced
X is the production function of the produceremployer
w is the wage rate
wT is the quantity of lsquocontractedrsquo work time
U is the utility function of the employee
T is the total time devoted to lsquocontractedrsquo work leisure and business travel (ie 24 in any one day)
wt is the quantity of business travel time which could straddle lsquocontractedrsquo work and leisure time
lT is the quantity of leisure time given the work contract
is the marginal utility of time (and the Lagrange multiplier in (4))
r is the proportion of business travel time that takes place in leisure time this should be
distinguished from the term in (2) which relates to travel time saving specifically rp
p
is the proportion of business travel time that is productive this should be distinguished from the
term in (2) which relates to travel time saving specifically
q
8
It is important to understand the salient features of the objective problem as follows
With reference to the profit function we assume that revenue is generated through the
sale of goods and that costs are incurred through the employment of labour For simplicity
we further assume that the non‐wage costs of employing labour are zero (ie with reference
to (1) we assume that c 0 ) and omit explicit consideration of tax (ie implicitly we
assume that the taxation regime is neutral between employer and employee) Both issues
can be introduced into the analysis but with a modest increase in complexity
is as defined in (2)
With reference to the X function production depends solely upon the time contributed by
the labour input adjusted for the productivity of the time Productive time could
conceivably include not only lsquocontractedrsquo work time but also a proportion of leisure time
hence the notion of lsquoeffectiversquo work (and leisure) time
With reference to the U function utility depends solely upon the quantities of lsquoeffectiversquo
work time lsquoeffectiversquo leisure time and business travel time (but not the consumption of
goods see subsequent comment on page 6)
With reference to the constraint the time resource constraint is ostensibly the sum of
lsquocontractedrsquo work and leisure time but entails three key propositions concerning business
travel time namely that
Business travel time may straddle lsquocontractedrsquo work and leisure time (hence the
term and the notion of lsquoeffectiversquo work time)
r
Business travel time may ‐ to some extent ‐ be unproductive (hence the p and q
terms)
Although business travel time may straddle lsquocontractedrsquo work and leisure time p
and q remain constant This gives rise to the implicit assumption that the
productivity of business travel is constant irrespective of whether it is undertaken
during lsquocontractedrsquo work or leisure time For a practical illustration of the objective
problem (4) see Figures 1 and 2
In contrast to conventional work‐leisure optimisation problems such as Becker (1965) and
Oort (1969) it is notable that (2) omits a budget constraint This reflects the following
considerations
It is assumed that the employer and employee face a common marginal utility of
income
It is assumed that the labour costs incurred by the employer in the course of
production straightforwardly transfer to the wage‐related income of the employee
It is assumed that non‐wage income to the employee is zero
Since labour costs already feature in the objective statement and we have assumed
zero non‐wage income there is no need to also include a budget constraint2
2 In the vein of Karlstroumlm et al (2007) an alternative (but equivalent) way of specifying the problem (4) is to
include a budget constraint but represent the objective statement entirely in terms of the employee as
9
Note furthermore that wage‐related income refers to contracted work time wT only
in effect no wages are paid or received for business travel that takes place during
leisure time wr t In section 4 we will relax this assumption
Given these features it is important to consider what forms of employment are compatible with the
objective problem (2) Our conclusion consistent with both Kato (2010) and Batesrsquo (2013)
assessment of Karlstroumlm et al (2007) is that the Hensher equation is most applicable to the case of
self‐employment That is to say self‐employment would justify
The notion of a joint welfare function combining the perspectives of the employer and
employee (who in this case would be one‐and‐the‐same)
The proposition that labour costs (income) should be represented in either the objective
statement or the cost (budget) constraint but not both
The Hensher equation might also be appropriate for representing some forms of co‐operative or
barter economy but is less appropriate for economies that embody some degree of competitive
behaviour between employer and employee
10
Max
st
1
w l wX T T t
w
w w l
W U
PX wT
T T r t r T
1w w w lL U PX wT T T r t r T
(f1)
This problem yields exactly the same Lagrangian function as (4) specifically
(f2)
Figure 1 Schematic diagram illustrating the workings of the Hensher
Leisure time given work contract
Contracted work time
Business trav l time
600 2100 2400
Effective work tim
000
Effective work amp leisure
Contracted work amp leisure
900 1800
Business travel
SCHEDULING OF ACTIVITIES
Business travel time
Effective leisure time
Leisure time given work contract
24 HOUR TIME PROFILE
Effective leisure time
1200
Example
Consider an employee whose contracted work time is 9 hours per day which is usually scheduled between 900 and 1800 For expositional simplicity we shall assume that no lunch break is taken (but such breaks could be admitted without substantive complication) Given the work contract of 9 hours leisure time accounts
for the residual time of 15 (ie 24-9) hours per day
On a particular working day the employee is required to travel to London to meet a client In practice this entails a 3 hour journey at each end of the day giving total business travel time of 6 hours Once in London however the employee is expected to perform the normal contracted work time (eg heshe is expected to undertake
a full schedule of meetings thereby maximising the benefit of the journey) such that effective work time is 15 hours and effective leisure time is 9 hours
I Since business travel is in this case undertaken outside of contracted work time the proportion of business travel time that takes place in leisure time is 1 (ie r=1)
11
12
Example
Now suppose that travel time to London is reduced by 1 hour in each direction
In terms of the Hensher equation we are interested in the allocation of the 2 hour saving in total business travel time which could be
1) Retained for work at home or at the normal workplace such that effective work time is the same as Figure 1 (possibly to the benefit of the employee if working at home or the normal workplace is preferred to travel and possibly to the benefit of the employer if productivity is enhanced) This is the outcome shown in
Figure 2 above 2) Returned to leisure such that effective leisure time increases by 2 hours as compared with Figure 1 (again to the benefit of the employee but to the loss of
the employer as productive output is reduced) 3) Split between work and leisure such that the final outcome is intermediate between 1) and 2)
Figure 2 Schematic diagram illustrating the workings of the Hensher equation
Leisure time given work contract
Contracted work time
Business trav l time
700 2000 2400
Effective work tim
000
Effective work amp leisure
Contracted work amp leisure
900 1800
Leisure time given work con rac
Effective leisure time
24 HOUR TIME PROFILE
Effective leisure time
1200
Business travel
SCHEDULING OF ACTIVITIES
Business tra el me
600 2100
A14 SolvingtheObjectiveProblem
Having outlined the objective problem of interest we will now proceed to solve it In solving (4) it is
appropriate to first solve for lsquocontractedrsquo work time since this will determine the productive
capacity of the firm as well as the leisure time available to the employee
wT
w w w
W X UP
T T Tw (5)
In practice will be determined by the employeersquos supply of hours (and thus the interaction
between work leisure and consumption) and the employerrsquos demand for hours (and thus the firmrsquos
planning decisions regarding the volume of production) as follows
wT
1
l l
W Ur
T T (6)
WP
X
(7)
The final first order condition relates to travel time specifically
w w w w w
W X U U UP
t t t t t r (8)
In principle the value of business travel time (VB ) is given by TT
w
WVBTT
t
(9)
As we shall demonstrate the Hensher equation arises from a distinct focus on the value of
transferring business travel time (which may be less than fully productive and potentially
overlaps into leisure time ie ) into lsquocontractedrsquo (and fully productive) work time Drawing
upon (5) and (8) in particular we can derive the Hensher equation as follows
wt
wr t wT
13
1
1
1
1
w w
w w
w w w
w
W WVBTTS
T t
XP w
T t
U
T t t
U
t
r
U
(10)
This derivation of VBTTS clarifies the interpretation of some of the terms in (2) which might be
re‐labelled as follows
1
1 1
1
1
w
w w
MPL
w w
VW VL
w w
Vot
w
VoT
W WVBTTS
T t
XP w
T t
U
T t t
U
t
r
w
U
VL is the value of lsquoeffectiversquo leisure time to the employee
w is the value of business travel time to the employee (this replaces the MPF term in (2) Vot
again we shall explain this subsequently)
VoT is the value of time as a resource
(11)
where
MPL is the marginal product of labour3
VW is the value of lsquoeffectiversquo work time to the employee (we shall explain the terminology used in
subsequent discussion)
3 In common with footnote 1 this term should more precisely be interpreted as the marginal revenue
product but we have used the notation MPL in order maintain consistency with (2)
14
Continuing with our derivation
1 1 1
11
1
1
w
XVBTTS P r p q r p q w
U Ur r
U
t
r
(12)
If as is commonly assumed MP then we can achieve further simplification L w
1
11
1
1
w
XVBTTS P p q r
U Ur r
U
t
r
(13)
where we would expect a priori 0U U and 0wU t
In this way we derive the identity (13) which basically reproduces (2) but calls for us to reinterpret
some of the terms of (2) as follows
With regards to work time we should distinguish between the value of lsquocontractedrsquo work
time wU T ) to the employee and the value of lsquoeffectiversquo work time U to
the employee where the latter includes business travel undertaken during leisure time (eg
Figure 1 entails lsquocontractedrsquo work time of 9 hours per day plus 6 hours of business travel
time) Given this distinction two clarifications are appropriate First the VW term in (2)
which Fowkes et al (1986) interpreted as lsquothe value to the employee of work time at the
workplace relative to travel timersquo is better interpreted as the value of lsquoeffectiversquo work time
Second the factor 1 r represents the proportion of business travel time that falls
within lsquocontractedrsquo work time Moreover the term 1VW r as a whole represents the
value to the employee of transferring business travel time to lsquocontractedrsquo work time (eg
outcome 1 in Figure 2)
15
With regards to leisure time and in a similar vein to the discussion above the VL term in
(2) is better interpreted as the value of lsquoeffectiversquo leisure time to the employee and not lsquothe
value to the employee of leisure time relative to travel timersquo (Fowkes et al 1986) The factor r represents the proportion of business travel time that given the work contract falls
within leisure time Moreover the term VL r as a whole represents the value to the
employee of transferring business travel time to leisure time (eg outcome 2 in Figure 2)
1VW r VL r
More importantly ‐ aside from the above clarifications ‐ Fowkes et al correctly interpreted
as the value of business travel time savings to the employee
accounting for the possibility that such savings could be allocated to work or leisure
Comparing against (2) (13) includes an additional term namely VoT The role of the VoT
term is to represent the benefit of relaxing the time constraint as travel time is saved
thereby permitting reassignment between work and leisure The omission of the VoT term
from (2) might thus give the impression that no account has been taken of the time
constraint However this would be to overlook the role of the r term in (2) as distinct from r in (13) which represents the proportion of travel time saved that is used for leisure That
is to say the VoT and r terms represent similar effects We shall discuss the VoT term
more fully in section 6 of this annex
Since (2) effectively represents the employer and employee as one‐and‐the‐same the
MPF term in (2) can be attributed to either party On this basis ‐ but in contrast to Fowkes
et al ‐ we reinterpret this term as the value of business travel time to the employee wVot
(arguably this is the more natural interpretation) Since we would expect 0w it
should be the case that wMP
U t
F Vot
A15RevealedPropertiesoftheHensherEquation
The above analysis has revealed a number of properties arising from (4) which can now be
summarised
The Hensher equation is no different to the cost saving method in assuming that the
marginal product of labour is equal to the wage rate ie MPL w
In perfect equilibrium we would expect the marginal value of lsquocontractedrsquo work and leisure
time to be equal to the wage rate ie w lU T U T w but if 0r this
precludes the possibility that VW VL Thus by assuming the latter AHCG (1994)
effectively imposed a position of labour market disequilibrium
16
As noted in section 3 above the Hensher equation implicitly assumes that business travel
which takes place during leisure time is equally as productive as business travel that takes
place during work time If business travel during leisure is in practice less productive then
VBTTS will be understated (ie (13) will understate the benefits of transferring
unproductive travel time to leisure) Taking the extreme case where business travel during
leisure time is entirely unproductive (13) becomes
1
11
1
1
w
XVBTTS P p q r r p q
U Ur r
U
t
r
(14)
The reality will perhaps fall somewhere between (13) and (14)
It has already been noted that the Hensher equation implies that no wages are paid or received for
business travel that takes place during leisure time If instead all lsquoeffectiversquo work time were
fully remunerated then VBTT should be revised upwards as follows
wr t
S
1
11
1
1
w
XVBTTS P p q
U Ur r
U
t
r
(15)
Last but not least a more fundamental issue is the nature of the production function since the
Hensher equation assumes that labour is the sole input to production and that (apart from
productivity issues) this input plays the same function whether at the regular place of work or
travelling If in practice the productive contribution of business travel is not simply one of labour
input but a broader one of generating andor facilitating production (eg by visiting clients or
suppliers) then there is a case for adjusting (13) along the lines
17
1
11
1
1
w
w
X XVBTTS P p q r
f t
U Ur r
U
t
r
(16)
where wX f t is the marginal product of business trips and wf t is some function to be
estimated That is to say savings in business travel time would allow more (or longer) business trips
to be carried out or allow more meetings to be conducted on a given business trip thereby realising
a potential benefit Indeed Kato (2010) formalises this proposition by specifying two productive
functions within the objective problem one where business travel has a negative impact on
productive output (in the spirit of the Hensher equation) and a second where business travel has a
positive impact on productive output
A16 SpecialCasesoftheHensherEquation
Having derived the Hensher equation from first principles let us now consider some special cases of
the equation We shall begin by considering the same four cases derived by Bates (2007) before
considering other cases
Case 1 Productive travel time is saved and transferred to productive time in the workplace
This case simply amounts to imposing 0r and 1p on (12) as follows
2
1
1
1
w
XVBTTS P q w
U
U
t
r
(17)
If we further assume MP then (17) simplifies to L w
18
1
1
1
1
w
XVBTTS P q
U
U
t
r
(18)
The above result replicates Batesrsquo result for Case 1 with the exception that (18) includes the VoT
term ‐ namely the resource value of time ‐ whilst Batesrsquo result omits this term from consideration
The same qualification applies to Case 2‐4 which follow We shall consider the resource value of time
in more detail in Case 6
Case 2 Unproductive travel time is saved and transferred to productive time in the workplace
This case simply amounts to imposing 0r and 0p on (12) thus
2
1
1
1
w
XVBTTS P w
U
U
t
r
(19)
If we further assume MP then (19) simplifies to L w
1
1
1
w
XVBTTS P
U
U
t
r
(20)
19
Case 3 Productive travel time is saved and transferred to leisure time
This case simply amounts to imposing 1r and 1p (and again MPL w ) on (12) and yields
the following
1
1
w
XVBTTS P q
U
U
t
(21)
Case 4 Unproductive travel time is saved and transferred to leisure time
This case simply amounts to assuming 1r and 0p (and MPL w ) on (12) and yields
1
1
w
UVBTTS
U
t
(22)
Case 5 Cost saving approach
Further to the comment in section 1 if we assume r 0 p 0 U 0 and U tw 0
(ie all business travel takes place during work time and is non‐productive and the marginal
valuations of both work time and business travel time are zero) and also assume MPL w then ‐
aside from the VoT term ‐ (12) collapses to the lsquocost savingrsquo approach
X
VBTTS P
(23)
Reflecting further however the five assumptions underpinning the cost saving approach detailed in
section 1 (notably competitive conditions and no indivisibilities) effectively render the time resource
constraint (and term) redundant Thus if these assumptions hold (23) will in practice be
equivalent to (1)
VoT
20
Case 6 Accounting for the resource value of time
In contrast to Case 5 the VoT term plays a substantive role in Cases 1 and 2 We shall therefore
complete our analysis by considering the term in more detail Employing (5) and (6) we can
derive the identity
VoT
w ww
X UP w
T TW T
W X P
(24)
Simplifying and rearranging
w w
w
UTX W
P wT W
T
X P (25)
Assuming MP (25) further simplifies to L w
ww
UW T
T
(26)
Finally if we substitute for in (12) then VBTTS can be re‐stated equivalently
1
11
1
1
w
ww
XVBTTS P p q r
U Ur r
U
t
UW T
Tr
(27)
Rationalising (26) intuition suggests that the value of lsquocontractedrsquo work time to society must be at
least as great as the value of lsquocontractedrsquo work time to the employee work would not otherwise
take place This implies that U T w w W T 0 In Cases 1 and 2 therefore the
VoT term potentially offers a positive contribution to VBTTS
21
A17 SynthesisandConclusions
Following a brief review of methods for estimating we have devoted particular attention
to the Hensher equation not least because it offers a general theoretical framework from which
most of the competing methods can be derived or conceptualised In particular we derived the
Hensher equation (2) from first principles considered various special cases of the equation and
reconciled these special cases with similar work by Bates (2007) This exercise has given us
reassurance that the Hensher equation can be rationalised in terms of the microeconomic theory of
consumption and production but has exposed a series of assumptions and properties the
appropriateness of which might be debated namely
VBTTS
i Production is assumed to be a function of a single input ‐ labour ‐ which could include not
only lsquocontractedrsquo work time but also a proportion of leisure time
ii The marginal product of labour is assumed to be equal to the wage rate but the employer
does not pay for business travel time that takes place during leisure time (ie nil overtime
payments are assumed)
iii Business travel time that takes place during leisure time is assumed to be equally as
productive as business travel time during lsquocontractedrsquo work time
iv Utility to the employee is assumed to be a function of lsquoeffectiversquo work and leisure time and
business travel time The MPF term in (2) can be otherwise interpreted as the value of
business travel time to the employee wVot in (13) That is to say it makes little practical
difference whether the (negative) utility of travel per se is a burden to the employer or
employee
v The VoT term in (13) is omitted from (2) but is instead proxied by the r term (as distinct
from r )
vi The Hensher equation takes no account of the potential for business travel to have a
broader function of generating and facilitating economic activity
Moreover it is important to consider what forms of employment are compatible with the notion of a
joint welfare function for the employer and employee and the proposition that labour costs
(income) should be represented in either the objective statement or the costs (budget) constraint
but not both Our conclusion is that the Hensher equation is most applicable to self‐employment or
economies that operate on a co‐operative basis
In principle the above assumptions and properties can be relaxed but this may have implications
for estimates of Table A11 illustrates this by comparing a lsquobasersquo specification of the
Hensher equation with five variants specifically
VBTTS
Model 1 this is taken to be the lsquobasersquo and restricts (13) to the case where the employeersquos
value of business travel time is zero and the time resource constraint is not binding ie we
assume 0wVot (or 0 ) and 0VoTMPF
22
Model 2 we adjust Model 1 such that business travel during leisure time is zero‐productive
ie we assume 0q during leisure This has the effect of increasing VBTTS relative to
the base but typically not to the extent that it will exceed w
Model 3 we adjust Model 1 such that overtime is paid ie we assume that labour costs
equal VBTTS increases relative to the base but typically will be less than
w
w ww T r t
Model 4 Model 1 is adjusted such that the value of business travel time savings to the
employee is admitted ie we assume 0wVot (or 0MPF ) VBTTS increases relative
to the base and could in some circumstances exceed w
Model 5 we adjust Model 1 such that the value of time as a resource is admitted ie we
assume 0VoT VBTTS increases relative to the base but typically will be less than w
Model 6 this is as Model 1 but admits the possibility that business trips have a productive
benefit beyond the basic labour input ie we assume 0wX f t Again VBTTS
increases relative to the base and could possibly exceed w
Although Models 2‐6 outline cases where VBTT increases relative to Model 1 it is important to
note that Models 2 3 and 5 would still be expect
Sed to yield a VBTT less than the wage rate By
contrast Models 4 and 6 could in some circumstances yield a VBTT above the wage rate
SS
23
Table A11 Variants of the Hensher equation and impacts on VBTTS
Model Description Formula for VBTTS VBTTS relative to Base
1 Assume
MPF
Votw
0 ) and
0 (equivalent
VoT 0
to VBTTS1 P
X1
p q r 1
U1
r U
r
Base VBTTS 1
2 Assume
p q 0
zero productivity
) during leisure time
(ie VBTTS2 P
X1
p q r r p q 1
U1
r U
r
VBTTS VBTTS1 2
typically less than w
but
3
Assume overtime
costs equal w Tw
is paid
r tw
ie wage VBTTS3 P
X1
p q 1
U1
r U
r
VBTTS VBTTS1 3
typically less than w
but
4 Assume Vot 0 (or MPF 0 ) w
implying that travel has a fatigue effect on the employee
VBTTS4 PX
1
p q r 1
U1
r U
r
U
VBTTS VBTTS 4 1
and possibly greater than w tw
5 Assume VoT 0 implying that time
savings allow reassignment of work and leisure time
VBTTS5 PX
1
p q r 1
U1
r U
r 1
r VBTTS VBTTS1 5
typically less than w
but
6 Assume business trips
business ie X f t w generate
0 VBTTS6 P
X1
p q r X
f tw
1
U1
r U
r
VBTTS VBTTS1 6
possibly greater than w
and
24
25
Annex 1 References
Accent amp Hague Consulting Group (AHCG) (1999) The Value of Travel Time on UK Roads Prepared
for Department for Transport
Bates J (2007) Business value of time and crowding ndash some thoughts Private communication
Bates J (2013) Assessment of lsquoTechnical Annex on the Hensher Equationrsquo Private communication
Becker GS (1965) lsquoA theory of the allocation of timersquo The Economic Journal 75 pp493‐517
DeSerpa A (1971) lsquoA theory of the economics of timersquo The Economic Journal 81 pp828‐846
Forsyth PJ (1980) The value of time in an economy with taxation Journal of Transport Economics
and Policy Vol XIV pp337‐361
Fowkes T (2001) Principles of valuing business travel time savings Institute for Transport Studies
University of Leeds Working Paper 562
Fowkes AS Marks P amp Nash CA (1986) The value of business travel time savings Institute for
Transport Studies University of Leeds Working Paper 214
Hensher DA (1977) Value of Business Travel Time Pergamon Press Oxford
Karlstroumlm A Eliasson J amp Levander A (2007) On the theoretical valuation of marginal business
travel time savings European Transport Conference
Kato H (2012) On the value of business travel time savings derivation of Hensherrsquos formula
Working paper
Mackie P Wardman M Fowkes AS Whelan G Nellthorp J amp Bates JJ (2003) Values of travel
time savings in the UK Report to Department of Transport Institute for Transport Studies
University of Leeds amp John Bates Services Leeds and Abingdon
MVA ITS amp TSU (1987) Working Paper 3 Theoretical considerations Report to the APM Division
Department of Transport
Oort O (1969) The evaluation of travelling time Journal of Transport Economics and Policy 3
pp279‐286
26
ANNEX2 CURRENTAPPRAISALPRACTICE
A21 Objectives
This note forms an annex to the main report to the Department for Transport on the valuation of
travel time savings to business travellers The purpose of this annex is to
Give some context to the current practice of valuing business travel time savings in the UK
Review international practices on valuing business travel time savings
Review the sources of wage data working hours etc the Department uses for the
calculation of business travel time savings
A22 Structureofthisannex
Following this short introductory section the second section of this annex gives some context to
business travel in GB in terms of its economic importance how these trips are made (timing and
mode) and who makes them (occupations and industries) The third section summarises the
approach used in Britain to value business travel time savings and briefly introduces alternative
approaches In the fourth section practice across Europe and other countries with developed
appraisal systems is compared whilst in the fifth section the methodology and data used to
implement the cost saving method to valuing business travel time savings in GB is critically reviewed
The final section presents a brief summary of the main points contained within this annex
A23 BusinessTravelinGreatBritain
For infrastructure projects with the objective of improving accessibility business travel time savings
are important ‐ travel time savings typically comprise the majority of the direct benefits of such
projects As business trips are valued on average at more than 4 times non‐working time savings
(DfT 2012a) the value of business time savings is critical to the economic appraisal of such projects
For example time savings form half of all user benefits for the proposed London to West Midlands
high speed rail line and business time savings are almost three times those for non‐work time
savings (DfT 2012b Table 10 p42)
Despite its economic importance business travel actually comprises a minority of trips made in Great
Britain (GB) 85 of all trips made per year within GB and 88 of all miles travelled per year4 are
4NTS 2010 Tables 0409 and 0410 Note that the National Travel Survey excludes professional driver mileage
the UK NTS specifically excludes the following types of motorised trips as they are commercial rather than
personal travel trips made specifically to delivercollect goods in the course of work trips made by
professional drivers or crew in the course of their work trips made by taxi drivers if they are paid or charge a
27
made on employersrsquo business We can also see that there is a great deal of heterogeneity in who
makes business related trips and when they are made Cars and vans dominate the mode of travel
for business travellers as is apparent in Table A21
Table A21 Proportion of Business Trips by Mode (by Distance Travelled and by Trips Made)
Walk Bicycle Car van driver
Car van pass
Motor-cycle
Other private1
Local bus
Rail2 Other public3
All modes
By distance 02 02 730 82 03 06 07 115 53 1000 By trip 61 14 716 79 08 05 40 65 13 1000
1 Mostly private hire bus (including school buses) 2 Surface rail and London underground 3 Non-local bus taximinicab and other public transport (air ferries light rail) Source NTS 2011 Tables 0409 and 0410
Most business trips (60) start within the core of the working day (9am to 5pm) as can be seen in
Table A22 though 21 start before 9am and 18 after 5pm A greater proportion of business trips
start outside the core working day when looking at rail as 33 of business trips start before 9am
and 20 after 5pm
There also exist differences between the types of workers who make business trips as is apparent in
Table A23 Managerial and professional staff not only make more trips per person (averaging at
more than 1 per week) but also travel the furthest Whilst there is no NTS table to show it we
would also hypothesise that such workers dominate travel by rail (for business purposes) ndash given the
high wages of such travellers (DfT 2012a) and their propensity to travel further (see Table A23)
We can also see in Table A24 that whilst travel is more evenly split between different industrial
sectors (compared to occupations) employees in certain industries appear to travel further than
others These are employees in the high value service sector (financial and real estate) and those in
construction and agriculturefishing
fare for making a trip and trips made by professional driving instructors whilst teaching or driving their
vehicles in the course of their work
28
Table A22 Start Time of Trips (All Modes and Rail Only)
Start time All modes
Rail
0000 - 0059 0 0 0100 - 0159 0 0 0200 - 0259 0 0 0300 - 0359 0 0 0400 - 0459 0 0 0500 - 0559 1 2 0600 - 0659 3 9 0700 - 0759 7 13
Before 9am
0800 - 0859 10 10
0900 - 0959 8 6 1000 - 1059 7 4 1100 - 1159 7 4 1200 - 1259 7 4 1300 - 1359 7 5 1400 - 1459 7 5 1500 - 1559 8 7 1600 - 1659 9 11
Between 9am and 5pm
1700 - 1759 8 10 1800 - 1859 4 5 1900 - 1959 2 2 2000 - 2059 1 1 2100 - 2159 1 1 2200 - 2259 1 1
After 5pm
2300 - 2359 1 0
All day 100 100
Source NTS 2011 Table 0503
29
Table A23 Business Travel by Socio‐Economic Classification (All Modes)
NS‐SEC 2010
Average number of trips (per person per year)
Managerial and professional occupations 58
Intermediate occupations 38
Routine and manual occupations 20
Never worked and long-term unemployed occupations 2
Not classified3 26
All people (aged 16+) 35
Average distance travelled (miles per person per year)
Managerial and professional occupations 1516
Intermediate occupations 596
Routine and manual occupations 258
Never worked and long-term unemployed occupations 15
Not classified3 463
All people (aged 16+) 7291 Business purpose trip personal trips in the course of work including a trip in the course of work back to work This includes all work trips by people with no usual place of work (eg site workers) and those who work at or from home 2 = not applicable 3 Most of the people in the not classified category are full-time students
Source NTS2010 Table 0708 (edited)
30
Table A24 Business Travel by Industry (All Modes)
Industry group 200809
Average number of trips (per person per year)
Agriculture and fishing 88
Energy water mining etc 34
Manufacturing 24
Construction 69
Distribution and hotels 16
Transport and communication 25
Financial and real estate 54
Public administration education and health 50
Other service 57
All people (aged 16+) 40
Average distance travelled (miles per person per year)
Agriculture and fishing 931
Energy water mining etc 786
Manufacturing 717
Construction 1586
Distribution and hotels 356
Transport and communication 836
Financial and real estate 1349
Public administration education and health 597
Other service 761
All people (aged 16+) 780
Note Business purpose trip personal trips in the course of work including a trip in the course of work back to work This includes all work trips by people with no usual place of work (eg site workers) and those who work at or from home
31
A24 MeasuringtheValueofBusinessTravelTimeSavings
A241GBpracticeandtheCostSavingMethod
The 1960s heralded the first UK applications of social cost benefit analysis to transport projects
(Coburn et al 1960 Foster and Beesley 1963) By the 1970s transport cost benefit analysis theory
had been developed to a satisfactory state of the art and was widely accepted (Dodgson 1973
1974 Harrison 1974 Mohring 1976 Leitch 1978) In these early studies business travel was valued
using what has now been termed the cost saving method Some fifty years later the cost saving
method is still in use in the UK and in fact in much of the rest of the world where transport
appraisal is actively practised Eades (2000) sets out the approach used by the Department for
Transport in deriving business values for travel time savings
The cost saving method says that in a competitive labour and product market firms hire labour to
the point at which the value of the marginal product is equal to the wage rate Thus the value of the
time saving is equal to the marginal gross cost of labour including labour related overheads To
arrive at this conclusion a number of well documented assumptions are implied regarding the labour
market and the allocation of time between work and leisure (Harrison 1974) Specifically travel time
is assumed to be unproductive reductions in travel time are assumed to go into work not leisure
the labour and product markets are assumed to be competitive and there are no indivisibilities in the
use of time for production
A242AlternativeValuationApproaches
Alternative approaches to valuing business travel time savings are discussed in detail in Annex 1 and
also in Section 2 of the main report They are the Hensher model the Modified Cost Saving
ApproachRestricted Hensher Model and Willingness to Pay
A25 InternationalAppraisalPractice
When looking at international appraisal practice it is important to recognise that in many countries
no firm guidelines are provided The requirement on the transport analyst is to use best practice
methods In a 2005 survey of appraisal practice in the EU plus Switzerland Odgaard Kelly and Laird
(2005) found that lsquonational guideline valuesrsquo which are used in almost all appraisal circumstances
only exist in 10 of the 27 countries surveyed Seven of the 27 countries have no guideline values
whatsoever and the remaining countries have guideline values but there is no requirement to use
them In fact for four of the latter group of countries the guideline values are only rarely used
(Odgaard Kelly and Laird 2005 Table 51)
32
Looking at the ten EU countries where guideline values are provided and used in almost all
circumstances we find that three different valuation methods for business travel time savings are in
use As shown in Table 25 the cost saving method for valuing business travel time savings is the
most popular method Adjusted cost savingrestricted Hensher models have been estimated in
Sweden (Algers Hugosson and Lindqvist Dillen 1995) and the Netherlands (HCG 1998) Norway
used to use an adjusted cost savingrestructed Hensher method (Ramjerdi et al 1997) but in 2010
reverted back to using a cost saving approach Switzerland is unique in that it marks up the non‐
working time savings value (Bickel et al 2005 p118) The European Investment Bank (EIB 2005) and
the EC (Bickel et al 2006) also advocate the cost saving method
Table A25 Approaches to Estimating Business Values of Travel Time Savings (for
CountriesOrganisations with Guidelines for Appraisal)
Method Countries
Cost saving method Europe Denmark Finland France Germany Ireland Norway UK European Investment Bank EC
Non-Europe Australia New Zealand USA World Bank
Adjusted cost savingRestricted Hensher Europe Sweden Netherlands
Non-Europe ---
Hensher model Europe ---
Non-Europe ---
Willingness to pay Europe ---
Non-Europe ---
Other Europe Switzerland
Non-Europe
Source Odgaard Kelly and Laird (2005) updated to 2012 and to include Australia New Zealand Norway USA World Bank and EIB with authorsrsquo own work
Outside of Europe we find that the cost saving method also dominates In the United States
business values of time are based on wage rates with no mark up for labour related overheads
(Belenky 2011) In Australia the cost saving approach is also used (Austroads 2011) as it is in New
Zealand (Melsom 2003) In New Zealand occupations and industries are taken into account when
calculating wage and non‐wage costs by mode (BCHF 2002 Chapter 8) The World Bank also
advocates the cost saving method though wage rates are adjusted for the shadow price of labour
(Mackie Nellthorp and Laird 2005 TRN‐15) No country that we have surveyed uses either a
Hensher model or values derived from direct elicitation of willingness to pay by employers
Figure A21 Valuation of Business Travel Time Savings in Scandinavian Appraisal Guidance
Sweden and Norway have used the Hensher formula (or variants of it) since the mid 1990s but have both recently changed to a (modified) cost savings approach Denmark has always used a cost savings approach Sweden changed to a pure cost savings approach in 2008 after using Hensher-type formulas since the early 1990s As of 2012 a modified cost savings approach is used Here the BVTTS for train is reduced by 15 to account for productive travel time Norway changed to a pure cost savings approach in 2010 after using a Hensher-type formula since (at least) 1997 Sweden and Denmark do not differentiate the BVTTS with respect to mode or trip distance whereas Norway has a higher BVTTS for air trips due to higher average wage rates for air travellers In Swedenrsquos case it is acknowledged that the BVTTS should in principle be differentiated with respect to mode and travel distance due to wage rate differences but the available data have been too unreliable for this
Principles for ldquocost savingsrdquo calculations
All three countries use the wage rate plus overhead costs as an indicator for marginal labour productivity (MPL) The question whether wages are a good enough approximation of MPL arises regularly but no specific alternative has been suggested
Another discussion is how to define overhead costs Sweden currently uses only indirect labour taxes (social security charges and the so-called ldquoemployer taxrdquo) but no other overhead costs such as costs for office rents administrative support etc The Danish and Norwegian practices seem to be the same although this is not absolutely clear
Motivations for adopting the modified cost saving method
In both Sweden and Norway the crucial argument for abandoning the Hensher-type formula was that in the long run it was expected that workers would not transfer saved time to leisure but would instead transfer it to increased work That is in the Hensher formula r was argued to be zero The motivation for this has been that spending some time travelling outside normal working hours is part of the agreement between employer and employee This argument has been supported by the observation that despite substantial increases in travel speeds over several decades there are no indications that business travellers nowadays spend less of their leisure time on business trips (Metz 2004) hence there seems to be no indication that some of the travel time savings have been converted to leisure time
The debates in both countries seem to acknowledge that it is not enough to try to measure how a travel time saving would be divided between the employer and employee in the very short-term such as focusing on a particular trip The attempts at doing this during the 1990s are hence now viewed as misdirected and that an understanding of the r parameter needs to be based on the long-run effects
Neither Denmark nor Norway adjusts the BVTTS for productivity during the trip although the Norwegian debate acknowledges that this should be done in principle During the period 2008-2012 Sweden likewise had no productivity adjustment although this was based on the misunderstanding that consumer surplus could not be calculated when values of time were different on different modes Once this misunderstanding was corrected it was decided to adjust for productivity during the trip in the 2012 recommendations However the current Swedish recommendation of 15 productivity during train trips is rather arbitrary During the decision process two sources were used (Fickling et al 2008) and Lyons et al 2007) The 15 productivity figure does not directly relate to either of these studies
Current practice
33
34
The content of appraisal guidelines whilst interesting does not necessarily reflect the state of the art
in valuation methods This is because a pragmatic balance between data collection efforts and need
often has to be struck during development of the guidelines Issues of equity also influence the
methods adopted and the level of disaggregation in the values Furthermore guidelines also have to
be developed for the full spectrum of potential stakeholders and recognition therefore has to be
made in the guidelines for the practical realities of the modelling and evaluation methods that will
be employed There have therefore been a plethora of studies that have examined willingness to
pay by business travellers for travel time savings often with a demand forecasting perspective that
are more sophisticated in their valuation methodology than the cost saving method (Shires and de
Jong 2009 Abrantes and Wardman 2011 Hensher 2011) Patterns and trends in these empirical
studies of the value of business travel time savings are presented in Annex 2 of this study However
given that ultimately we are interested in amending national appraisal guidelines we briefly case
study Scandinavian practices where adjusted cost saving modelsrestricted Hensher models have
been implemented and recently altered (Sweden) and replaced by a cost saving approach in
Norway This is presented in Figure 1
A26 ImplementingtheCostSavingMethodinGreatBritain
With the cost saving method the value of the time saving is equal to the marginal gross cost of
labour including labour related overheads In essence the DfTrsquos approach has been to
Use NTS data to derive distance weighted annual incomes by mode of travellers As the NTS
only collects banded income data ndash the mid‐point of the income band is used
Calculate hourly incomes by dividing average annual incomes by 394 hours (which is the
average working week sourced from the New Earnings Survey)
Use the New Earnings Survey to estimate hourly wage rates for commercial vehicle drivers
and occupants
Use the Labour Cost Survey to estimate average non‐wage labour costs On average non‐
wage labour costs form 212 of the wage Uprate average hourly estimates by a factor of
1212 to give estimates of the gross cost of labour plus labour related overheads
Adjust estimates to correct unity of account and price and value base
The current values in webTAG unit 356 (DfT 2012a) were derived from survey data in 19992000
They have been updated to 2010 prices and values by reflecting changes in GDPcapita and inflation
Since these values have been derived the New Earnings Survey has been superseded by the Annual
Survey of Hours and Earnings (ASHE)
Effectively the approach is a two staged approach The first stage estimates the hourly wage of
travellers and the second estimates the nonwage labour costs We comment on these stages
separately
35
A261 DerivingtheHourlyWage
Over time the labour market alters and the way that different modes of transport are used by
different sections of the business community may also change Given that the current average
modal business time saving values were derived from 1999 to 2001 NTS data they are arguably
getting to the point of requiring an update Even if the existing approach is maintained there is a
need to update the current values using more recent travel survey data
Given that the cost saving method requires an estimate of the hourly wage ideally a dataset that is
robust in earned income data should be used The NTS is not such a dataset This is for three
reasons Firstly the personal gross annual income reported in the NTS is from all sources (earnings
benefits pensions savings self‐employment multiple jobs etc) Secondly the survey does not
record the number of hours worked by individuals thus one cannot obtain a robust estimate of an
hourly wage rate Finally the income data is only banded More appropriate datasets for deriving
hourly incomes would be the Annual Survey of Hours and Earnings (ASHE) and the Labour Force
Survey (LFS) These form the basis of ONS estimates of earnings The challenge of course is to link
these more robust estimates of hourly earnings to observed travel behaviour to derive distance
weighted estimates of the value of business travel time savings by say transport mode
The current approach could bias the values Firstly total annual income exceeds earned income The
Family Resources Survey (DWP 2012 Table 23) indicates that earned income comprises on average
about 85 of total income for households with a head of household aged between 25 and 59 That
is using total income as an approximation to earned income overestimates earned income by about
18 (on average across the workforce) Secondly hours worked vary significantly by occupation
Managers and senior officials work about 15 more hours than the average worker56 As these
occupations travel the most (see Section 2 of this report) then using average hours worked by the
average worker risks introducing an upward bias to the estimated hourly wage rate of those
travelling on employersrsquo business Furthermore as travellers will self‐select between modes any
upward bias will vary between modes and will be largest for modes used by those who work the
longest hours (ie modes preferred by managers senior officials and professionals) Ultimately how
significant any biases are is an empirical question that needs further analysis before conclusions can
be drawn
An alternative approach to estimate the distance weighted hourly wage by mode would be to use
each dataset to its full strength Therefore the NTS would be used to describe the types of business
travellers using each mode (in terms of distance weighted proportions by occupation and potentially
5 Census 2001 Table CAS040 6 Some of the additional hours worked by managers and senior officials will not be lsquoofficiallyrsquo contracted but
having an accurate understanding of their hours is essential to calculate their effective hourly wage
36
industrial sectors7) and the LFS or ASHE would be used to derive hourly wage rates for each of these
categories of business travellers ASHE is a survey of employers and responses are based on
documentary evidence whereas responses in LFS are based on individual recollection sometimes by
proxy respondents and sometimes without reference to payslips ASHE is therefore generally
considered more reliable (Ormerod and Ritchie 2007) The ASHE sample is also considerably larger
than LFS although is not as representative of low‐paid workers as LFS does not include unpaid
overtime hours and does not cover self‐employed which the LFS does we discuss the self‐
employed below The LFS is therefore arguably the better dataset from which to derive hours
worked whilst ASHE is considered the best dataset to describe earned income Such an enhanced
approach is similar to that used in New Zealand (BCHF 2002 Chapter 8)
Ultimately the question of whether the existing methodology for calculating distance weighted
average hourly earnings by mode is a good approximation to reality is an empirical question We
have raised a number of issues that would suggest that upward biases exist in the current
methodology (ie the current values of work travel time savings are too high) However how
significant those biases are is an empirical question that needs further analysis before any
conclusions can be drawn
A262 Non‐WageLabourCosts
Our discussions with the ONS indicate the Labour Cost Survey is the most comprehensive dataset for
non‐wage labour costs in the UK It is re‐compiled every four years by the ONS as part of ongoing
commitments to Eurostat Partial annual updates are also made The latest survey relates to 2008
A 2012 survey will also be undertaken which should become available in 2014 once Eurostat has
published it The Labour Cost Survey is not a survey in the strictest sense but is in fact an analysis of
existing datasets ndash the main ones of which are ASHE LFS and the Annual Business Inquiry (ABI) The
main sources of non‐wage labour costs are employersrsquo national insurance and employersrsquo pension
contributions Other non‐wage labour costs are also estimated including paid annual leave paid
maternitypaternity leave training costs sick pay benefits in kind etc Mark‐up factors from
employee wage costs to gross labour costs to the firm per hour of employment are available for the
economy as a whole and by industrial sector
7 The NTS contains National Statistics Socio‐economic Classification (NS‐SEC) data that gives broad occupational data It
also contains data on standard industrial sector (SIC) These are also contained in the LFS and ASHE If disaggregating by
mode NS‐SEC and SIC sample sizes are likely to be small giving imprecise estimates of both distance weighted proportions
(from the NTS) and possibly earned income from the LFS or ASHE Some aggregation of the NS‐SEC categories and SICs will
be necessary Additionally it may be necessary to pool several years of the NTS data to obtain reliable estimates of mileage
weighted proportions at whatever level of disaggregation NS‐SECSIC is chosen Another estimation issue that may arise is
that if business related travel is a function of income rather than job function than an incomemileage distribution may
arise within any specific NS‐SECSIC sample segment Arguably business travel should be a function of the job undertaken
by the worker and not income ndash however there may be whether there is sufficient data in the NTS to identify job functions
accurately enough and some correlations with incomewage may still be present
37
The current non‐wage labour costs are based on the 2000 Labour Cost Survey The existing business
values of time could therefore be updated to be consistent with the 2008 survey (the latest available
survey) The proportion of non‐wage costs varies by industry with skilled service sector industries
incurring higher non‐wage costs than agricultural construction manufacturing and low skilled
service sector employment As travel behaviour (distance travelled and mode choice) varies by
income and job type there is therefore an argument that the non‐wage mark‐up should also be
allowed to vary by mode This would require an analysis of the NTS to indicate the industrial
sectoral split by mode Such an enhanced approach is similar to that used in New Zealand (BCHF
2002 Chapter 8)
A263 ProfessionalDrivers
Employed professional drivers would be treated the same as other employees in this revised
methodology ndash in the sense that the ASHE or LFS would be used to derive their hourly wage
A264 Longrunmarginalcosts
From a cost benefit analysis perspective we are not strictly speaking interested in the marginal
product of labour per se This is because in response to changes in labour productivity the firm will
re‐balance factor inputs (other classic inputs being capital and land) to maximise profits What we
are primarily interested in therefore is how the long run marginal costs to the firm alter in response
to changes in labour productivity As far as we are aware there is no comprehensive evidence on
this For marginal changes in business travel time we would consider that short run responses that
is all inputs aside from labour being held constant would be a suitable approximation
A27 Summary
Business travel whilst forming only a small proportion of the trips made in the UK is a very important
in economic terms Business travel is also very heterogenous in terms of who makes the trips when
those trips are made and how they are made (mode) Importantly
40 of business travellers start their journeys outside of the core working day (9am to 5pm)
The number of and length of business trips increases with socio‐economic
statusoccupation and also by corollary with income and
Travel varies by industrial sector ndash albeit not as much as by occupation
In terms of international appraisal practice the cost saving method dominates valuation methods
used to derive values published in official guidance The adjusted cost saving approach is used in the
Netherlands and in Sweden
38
Currently business values of time used for appraisal in Britain have been derived from the 199901
National Travel Survey (for annual incomes by mode) and the 2000 Labour Cost Survey (for average
non‐wage costs) The New Earnings Survey was used to derive hours worked and the hourly wage of
commercial drivers For a number of reasons these values are considered questionable Firstly the
data upon which they are based are old and secondly the income data is based on the NTS rather
than a combination of the ASHE and the LFS The NTS does not give reliable hourly earned income
data A potentially more robust method to derive hourly wage plus non‐wage costs for travellers by
mode would be to use the NTS to describe who travels on which mode (in terms of occupation and
industry) and other datasets ndash the Labour Cost Survey the ASHE and the LFS ndash to give estimates of
the hourly wage and hourly non‐wage costs by occupationindustry Such an approach would be
similar to that adopted in New Zealand
Annex 2 References
Abrantes PAL and Wardman MR (2011) Meta‐analysis of UK values of travel time An update
Transportation Research Part A 45 1ndash17
Algers S Hugosson B Lindqvist Dilleacuten J (1995) 1994 aringrs tidsvaumlrdestudie Slutrapport Del 1
Resultat Transek AB Solna
Austroads (2011) Updating Austroads RUE Unit Values and Related Methodologies Austroads
Research Report AP‐R37311 Report dated February 2011 Sydney Australia AUSTROADS
Barrington A (1977) Valuing Time Savings in Developing Countries ndash A Comment Journal of
Transport Economics and Policy 11(2) pp195‐201
Beca Carter Hollings amp Ferner Ltd (2002) Review of Benefit Parameter Values for Economic
Evaluation Report to Transfund New Zealand Report dated April 2002
Belenky P (2011) The Value of Travel Time Savings Departmental Guidance for Conducting
Economic Evaluations Revision 2 Memo dated 28 Sept 2011 Available online at
Bickel P Burgess A Hunt A Laird J Lieb C Lindberg G Odgaard T (2005) State‐of‐the‐art in
project assessment HEATCO Deliverable 2 HEATCO ndash Developing Harmonised European
Approaches for Transport Costing and Project Assessment Funded by the 6th Framework RTD
Programme IER Stuttgart Germany Available online at httpheatcoieruni‐stuttgartde
Bickel P et al (2006) Proposals for harmonised guideliens HEATCO Deliverable 5 HEATCO ndash
Developing Harmonised European Approaches for Transport Costing and Project Assessment
Funded by the 6th Framework RTD Programme IER Stuttgart Germany Available online at
httpheatcoieruni‐stuttgartde
39
Coburn TM Beesley ME and Reynolds DJ (1960) The London‐Birmingham Motorway Road
Research Technical Paper 46 London HMSO
Department for Transport (DfT) (2012a) Values of time and operating costs TAG Unit 356 August
2012 London Department for Transport Available online at lthttpwwwdftgovukwebtaggt
(Accessed 23rd August 2012)
Department for Transport (DfT) (2012b) Economic Case for HS2 Updated appraisal of transport user
benefits and wider economic benefits A report to Government by HS2 Ltd January 2012 Available
online at lt httpwwwdftgovukpublicationshs2‐economic‐case‐appraisal‐updategt (Accessed
26th October 2012)
Dodgson JS (1973) External effects and secondary benefits in road investment appraisal Journal of
Transport Economics and Policy 7 (2) pp 169‐185
Dodgson JS (1974) Motorway Investment Industrial Transport Costs and Sub‐Regional Growth mdash
a case study of the M62 Regional Studies 8 (1) pp 75‐91
Eades D (2000 Unpublished) Creating new values of working time (HEN2) Internal note to the
Department for Transport Note dated April 2000
European Investment Bank (2005) RailPAG Rail Project Appraisal Guidelines Brussels EIB Available
online at httpwwweiborginfocentrepublicationsallrailpag‐railway‐project‐appraisal‐
guidelineshtm (Accessed 26th October 2012)
Fickling R Gunn H Kirby H Bradley M amp Heywood C (2008) The productive use of rail travel
time and value of travel time saving for travellers in the course of work ETC Proceedings Available
online at lthttpwwwetcproceedingsorgpaperthe‐productive‐use‐of‐rail‐travel‐time‐and‐value‐
of‐travel‐time‐saving‐for‐tra‐1gt (Accessed 26th October 2012)
Foster CD and Beesley ME (1963) Estimating the benefits of constructing an underground line in
London Journal of the Royal Statistical Society Series A 126 (1) pp 46‐58
Fowkes AS Marks P and Nash CA (1986) The value of business travel time savings Institute for
Transport Studies University of Leeds Working Paper 214
Hague Consulting Group (HCG) (1998) Value of Dutch Travel Time Savings in 1997 Final report A
report for Rijkswaterstaat ndash AVV by Hague Consulting Group The Hague Netherlands
Harrison AJ (1974) The economics of transport appraisal Croom Helm London
Hensher DA (1977) Value of Business Travel Time Pergamon Press Oxford
40
Hensher DA (2011) Valuation of travel time savings In de Palma A R Lindsey E Quinet and R
Vickerman(eds) A Handbook of Transport Economics Cheltenham Edward Elgar pp135‐159
Howe J (1976) Valuing time in developing countries Journal of Transport Economics and Policy
10(2) pp113‐125
Leitch G (1978) Report of the Advisory Committee on Trunk Road Assessment (ACTRA) London
HMSO
Lyons G Jain J amp Holley D (2007) The use of travel time by rail passengers in Great Britain
Transportation Research Part A Policy and Practice 41(1) 107‐120
httpdoi101016jtra200605012
Mackie PJ Nellthorp J and Laird JJ (2005) Toolkit for the Economic Evaluation of Transport
Projects Washington DC World Bank Available online at
httpwebworldbankorgWBSITEEXTERNALTOPICSEXTTRANSPORTEXTROADSHIGHWAYS0con
tentMDK20464962~pagePK148956~piPK216618~theSitePK33866100html (accessed 26th
September 2012)
Mackie PJ Jara‐Diaz S and Fowkes AS (2001) The value of travel time savings in evaluation
Transportation Research Part E 37 pp91‐106
Mackie PJ Wardman M Fowkes AS Whelan GA Nellthorp J and Bates J (2003) Value of
Travel Time Savings in the UK A report to the Department for Transport Institute for Transport
Studies University of Leeds UK
Melsom I (2003 Unpublished) Review of the Benefit Parameters Used in Transfund New Zealandrsquos
Project Evaluation Procedures Information Note Transfund New Zealand Note dated February
2003
Metz DA (2004) Travel time ndash variable or constant Journal of Transport Economics and Policy
38(3) pp333‐344
Odgaard T Kelly CE and Laird JJ (2005) Current practice in project appraisal in Europe ndash Analysis
of country reports HEATCO Deliverable 1 HEATCO ndash Developing Harmonised European Approaches
for Transport Costing and Project Assessment Funded by the 6th Framework RTD Programme IER
Stuttgart Germany Available online at httpheatcoieruni‐stuttgartde
Ormerod C and Ritchie (2007) Linking ASHE and LFS can the main earnings sources be reconciled
Economic amp Labour Market Review 1(3) Office for National Statistics
Ramjerdi F Rand L Inger‐Anne F Saeligtermo I‐AF and Saeliglensminde K (1997) The Norwegian
Value of Time Study Transportoslashkonomisk Institutt (TOI) Oslo Norway
41
Shires JD and de Jong GC (2009) An international meta‐analysis of values of travel time savings
Evaluation and Program Planning 32 pp 315ndash325
42
ANNEX3REVIEWOFEVIDENCEONBUSINESSTRAVELTIMESAVINGS
A31 Introduction
A311 Aims
This review is primarily concerned with the empirics rather than the theory of estimating values of
time for business travellers We are here concerned with existing evidence whether UK or
elsewhere regarding the value of business travel time savings (VBTTS) along with evidence on
parameters that can be used to deduce business time valuations and methodologies for estimation
This review of empirical evidence has three central themes
The first addresses the major national value of time studies insofar as they provide insights
into business time valuations and also other significant studies that we have identified It
focusses upon
Evidence on the p q and r parameters that input to the Hensher equation
Evidence obtained from RP and SP studies
Implications for appraisal and in particular challenges to the widely used cost saving
approach
Other insights and evidence
The second theme is to cover empirical evidence more generally with an emphasis on the
insights provided by our own data sets assembled for the UK and also Europe as a whole as
part of meta‐analyses of valuations of travel time savings
The final theme considers other evidence that provides insights into the VBTTS These
include who pays for the time savings and to whom the benefit accrues self‐employed
compared to employed business travellers high speed rail evidence and methodological
issues
A312 Scope
This review focusses solely on briefcase travellers This annex complements the material discussed in
section 31 of the main report in providing more detail about the original studies The key material
and discussion from the main report that is not repeated here is cross‐referenced We generally here
report values from studies in the original units they were estimated and have as far as is practical
reproduced the questions that underpin the evidence on the Hensher parameters
A313 Structure
The structure of this annex is as follows Section 2 sets outs some definitions of terms relevant to the
research findings reviewed in this annex Section 3 adds detail to our review of major national value
of time studies and other significant studies contained in section 312 of the main report with an
emphasis on those that have sought to compare different approaches or have investigated the
Hensher equation as a means of estimating the VBTTS Other willingness to pay evidence covered in
section 313 of the main report is here the focus of section 4 The remaining two sections point out
what is covered in the main report in terms of its coverage of specific issues that arise from the
review of many studies and its conclusions and recommendations
A32Definitions
The most common alternative to the Cost Savings Approach to the estimation of VBTTS is the
Hensher Equation This is gives a comprehensive conceptual framework for valuing VBTTS which has
found intuitive if not practical favour The equation is given by the following
rVLVWrMPFMPLpqrVBTTS )1()1( (1)
where
r is the proportion of travel time saved that is used for leisure
p is the proportion of travel time saved that is at the expense of work done while travelling
q is the relative productivity of work done while travelling relative to at the workplace
MPL is the marginal product of labour as in the cost savings approach
MPF is the extra output due to reduced (travel) fatigue
VW is the value to the employee of work time at the workplace relative to travel time
VL is the value to the employee of leisure time relative to travel time
[] is the portion of VBTTS that is associated with the employer
is the portion of VBTTS that is associated with the employee
Whilst the Hensher equation has conceptual appeal practical implementation of the complete
framework is difficult The MPF and VW terms are especially difficult to estimate and it is not
unusual to drop these from consideration we shall follow that convention here in what is often
termed the Modified Cost Saving Approach
rVLMPLpqrVBTTS )1( (2)
Another important definitional point first raised by Fowkes et al (1986) is what p and r cover
These two parameters were defined above but two related terms have been widely used These are
what Fowkes et al (1986) term
43
44
p which is the average amount of time spent working during a journey
r which is the proportion of total travel time which occurs in leisure time
A33 ReviewofNationalValueofTimeandOtherSignificantStudies
There have been a number of significant studies that have explored and estimated VBTTS This
review is not restricted to UK evidence but takes a broader perspective given that many of the issues
addressed even if not the absolute VBTTSs themselves are transferable across contexts
For the studies identified and reviewed below we summarise the key findings and where
appropriate and possible provide comments on those findings We have generally attempted to
record the precise questions asked since these are important in interpreting the results as well as
providing an account of each study
The main issues arising from each study are
the evidence on the p q and r parameters
how any estimated values relate to labour costs and how they vary by method and
methodological issues and particular insights into business valuations
Hensher (1977)
This is the pioneering piece of work that first empirically challenged the convention of valuing
business travel time savings at the gross wage rate Note however that it was first codified by
Fowkes et al (1986) based on the concepts elucidated by Hensher (1977)
With regard to the productive use of time Hensher asked
During this last domesticinternational business air journey what percentage of the travel
time do you estimate you devoted to work (ie writing reading thinking discussing work
matters) on each of the following stages of your journey
To the airport on your outward trip
During the flight in the aircraft on your outward trip
From the airport on your outward trip
To the airport on your return trip
During the flight in the aircraft on your return trip
From the airport on your return trip
If some time was devoted to work they were then asked
45
How effective do you think the time spent working during this journey was by comparison
with the equivalent time spent working in your office
with the response required as a percentage
The mean proportions of time spent working (p) for the various categories of trip stage and type of
flight are set out below in Table A31 The proportions are larger for domestic (Dom) than the very
much longer international (Int) journeys and tend to be larger for the outward journey They do
indicate quite modest amounts of travel time spent working with the least on access on the
outward leg and egress on the return leg where car is most likely to dominate
Table A31 Mean Proportions of Time Spent Working (Hensher 1977)
OUTWARD TRIP RETURN TRIP
Access Flight Egress Access Flight Egress
Dom Int Dom Int Dom Dom Dom Int Dom Int
174 96 448 231 481 329 270 145 270 82
The equivalent effectiveness of time spent working during a business air journey was 61 for
domestic travel and 51 for international travel Given that overall p and also q are relatively low
the impact of productivity on the valuations is relatively low
Time savings devoted to leisure are proxied by the amount of business travel time spent in own time
(r) The proportion of travel that was undertaken in the employeersquos own time is reported in Table
A32
Table A32 Mean Proportions of Travel Time in Own Time (Hensher 1977)
OUTWARD TRIP RETURN TRIP
Access Flight Egress Access Flight Egress
Dom Int Dom Int Dom Dom Dom Int Dom Int
62 16 46 8 45 31 64 55 72 54
In general a significant amount of travel is done in the employeersquos own time and perhaps
surprisingly it is greater for domestic than international trips
When the productivity and leisure time effects are both allowed for the value of business travel
times savings for domestic and international travellers are 68 and 30 of the average gross salary
cost respectively Removing the productivity effect would yield figures of 85 and 33 respectively8
8 Our understanding is that Hensher assumed VW to be the same as VL (Hensher 2011) whereas it is more likely that business travellers are indifferent between travelling (working or not) and working in the office which is VW of zero (Fowkes et al 1986)
46
As part of a survey of employers they were asked to imagine a situation where an employee could
save time by an unspecified new means at the egress end of a domestic air journey and what
monetary outlay ranging from $1 to $20 (12 different levels) would be permitted The implied value
in 1973 prices was $436 per hour implicitly for domestic trips The conventional marginal
productivity approach would imply a valuation of $510 per hour for domestic journeys
Hensher noted that individuals are likely to exaggerate the amount of time spent working and the
relative productivity of time spent working while travelling relative to at work so as not to appear
lazy
UK National Value of Time Study (MVA et al 1987)
This was the first of the so‐called national value of time studies Whilst its scope was broad the
remit was primarily private travel and the business travel element was largely left to a parallel
research council funded project that is discussed below Employersrsquo business trips were considered
but only using SP methods and with uncertainty as to what extent they reflected employer
sanctioned or personal willingness to pay Unfortunately the self‐employed sample was too small to
enable a distinction to be made Nonetheless the study made a number of useful comments on
business time valuations
It conceded in 1987 that the possible shortcomings of the assumptions underpinning the cost
saving approach have been ldquowell‐rehearsedrdquo It went on to state ldquoOn the other hand there are a
number of empirical questions which are in principle capable of resolution For instance what values
of time do individuals travelling in the course of work reveal on the basis of their travel choices And
what use is likely to be made of time savingsrdquo
The report distinguishes between those for whom travel is the nature of their job such as
professional drivers and briefcase travellers In the former case it is argued that in the short run
not all time savings can be converted into extra output due to scheduling inflexibilities and even in
the longer run some of the time saved might accrue to leisure as a result of collective bargaining In
such cases non‐work valuations would be applicable for the relevant proportion of time saved To
the extent that the time saving is converted into a wage increase in the longer run this would lead
to some reduction in the demand for labour and hence enforced leisure time and hence a leisure
value of time would be appropriate
Thus whilst the study recognises that even for professional drivers the wage rate related price can
overstate the benefits of the time savings ldquothe difficulty with this argument is the paucity of
empirical data on which to judge the extent of any such adjustment It is for that reason of
practicability rather than anything else that the implicit assumption is made that all working time
saving is converted into extra productive employmentrdquo
For briefcase travellers the vulnerability of the argument is accepted It is stated that ldquoWhere
neither the total job content or the required hours of work are clearly specified and where the
47
travel mode used may permit some work to be undertaken during the journey the convention
based on the marginal productivity theory might appear to break down completelyrdquo Some business
travel time particularly for longer distance trips is done in the employeersquos own time where the
opportunity cost to the employer is zero but there is a benefit to the employee of a time saving that
should be accounted for
The study suggests that an appropriate means of estimating their valuations is through the time‐cost
trade‐off choices they make when making business trips
UK Business Travel Study Fowkes et al (1986)
This SERC funded study into business travel time values paralleled the first UK national value of time
study where non‐business travel was predominant It did not examine commercial vehicles but was
confined to briefcase travellers
The study was both theoretical and empirical It appraises the traditional cost saving approach and
considers the implications for other estimation methods It made use of two surveys of long distance
business travellers and one survey of employers being novel in its use of SP methods in this market
to complement RP based approaches It was one of the first surveys of employers and remains one
of the few
It pointed out that Hensher (1977) departed from the conventional wage rate approach by
recognising that business travel might occur in what is leisure time work might be undertaken
during the journey and the employee might not be indifferent between working in the office and
travelling
The study also identified two studies conducted in the UK in the early 1970s that estimated business
valuations from RP data on the choices between air and rail that found values somewhat lower than
the wage rate It stated that ldquosince revealed preferences are the product of both the constraints on
choice imposed by company travel policy and the preferences of travellers themselves it is difficult
to interpret such resultsrdquo They may be the joint outcome of employersrsquo and employeesrsquo
preferences to save time As such they might be expected to drive behaviour and hence be
appropriate for forecasting but they do not necessarily reflect the sum of the employerrsquos and
employeersquos valuations to save time
As a result of these findings it was recognised that investigations of both the willingness to pay of
employers and of employees would be necessary but ldquoeven this is far from straightforwardrdquo
because there are difficulties in identifying within organisations those who can speak authoritatively
about company decision making whilst for employees it is necessary to create a situation where they
will incur the costs and receive the benefits of a faster journey
This study pointed out that Hensher ( 1977) had specified the productivity element in terms of the
proportion of the overall time spent working which they termed p rather than the proportion of
48
the time saved that would have been spent working which is p If the work can be done even with
the time savings which is possible where p is not equal to one it is likely that p will lie between
zero and p It also pointed out that instead of specifying r as the proportion of time saved that
would be devoted to leisure they used the proportion of total travel time which occurs in leisure
time termed r They state that ldquoSince for some people travel time savings will be replaced by extra
work on other days we would suggest that on average the appropriate value of r lies between zero
and r Whilst a recurring theme in the literature we do not feel that the failure to distinguish r and
r is a serious one but p and p could well be somewhat different
The study covered four methods of valuing business travel time
Wage rate approach
Employerrsquos Stated Preference
Revealed Preference
Synthetic Approach using p q r and employeesrsquo valuations and the Hensher equation
Three surveys were used as the basis for the value of time calculations all covering long distance
trips which were defined as those over 50 miles
Telephone survey of 311 organisations split between the South East and North East of
England and focussing on their travel policies
A self‐completion questionnaire distributed amongst employees of the employers contacted
who agreed to participate This collected RP and SP data for 442 travellers (and was termed
the ORGN sample)
A very similar self‐completion questionnaire of 411 rail travellers on the East Coast Main
Line (and was termed the ECML sample)
Employersrsquo Survey
Employers were asked how employees would make a day return trip between London and
Newcastle and then the following question
Now suppose a first class (only) premium accelerated rail service between London and
Newcastle was introduced saving one hours travel time Would senior staff be allowed to
use the service if the extra cost was pound5 helliphellip was pound20 helliphellip was pound50 And what about other
staff
In terms of current SP methodology this is a crude approach but it is nonetheless pioneering The
value of time was deduced from the cumulative frequency of responses by interpolation The results
showed that
Time savings of what were termed senior staff were valued around 2frac12 times more highly
than for other staff
49
The implied valuations varied by industry type size of organisation and the cost of the mode
used
The values were positively correlated with incomes
For senior staff the companies were on average prepared to pay more than the gross labour costs
but broadly similar to the wage rate for other staff The authors speculate that the former could
reflect the employerrsquos valuation of the disutility incurred by its staff in making business trips On
average the employerrsquos valuation was pound12 per hour
Employeesrsquo Stated Preference
Long distance business travellers were asked to consider a hypothetical 300 mile each way round
trip The available options were air first class rail standard class rail and car defined in terms of
return cost departure time from home and arrival time back at home A fixed lump sum of pound100
would be given by their employer for travel expenses with the respondent paying or keeping the
difference on the actual cost The four alternatives were ranked in order of preference and 12 such
rankings were presented
As far as we are aware this was the first study to aim to estimate employeesrsquo personal values for
time savings incurred during a business trip It was found that the values increased strongly with
income and that values of time savings for journeys starting very early in the morning were
somewhat larger The average values at around pound7 per hour are slightly over half the employersrsquo
average valuation of around pound12 per hour
Employeesrsquo Revealed Preference
The employeesrsquo survey also asked for RP information for their actual and best alternative mode This
allowed models to be developed explaining the choice between car and rail and between air and rail
Only around a third faced a time‐cost trade‐off essential for precise value of time estimation This
combined with the small sample sizes of 234 for the car and rail model and 130 for the air and rail
model meant the time and cost estimates are not precisely estimated Nonetheless the values of
time averaged around pound13 per hour not dissimilar to the employer based values It is clearly higher
than the SP values since the latter reflected a valuation based on personal rather than company
willingness to pay
Synthetic Approach
The study evaluated a modified Hensher approach with the marginal product of labour amended by
the (1‐r‐pq) term and the inclusion of VL Compared to the full Hensher approach VW was assumed
zero and MPF was also assumed zero or else is included within employeesrsquo SP valuations
50
Using the terminology set out above the business travellers were asked to record a log of their most
recent long distance business trip and to indicate how much time they spent working on the trip
(p) and their normal hours of work and salary from which r and MP were calculated
The figures in Table A33 below unsurprisingly indicate that rail is the most productive mode and car
the least Relative productivity is similar between work and travelling for all modes The larger r
values for rail and air might be because once access and egress are accounted for these journeys
take longer and hence incur more out of hours travel
Table A33 Hensher Parameter Estimates (Fowkes et al 1986)
Parameter Car Rail Air
p 003 020 014
q 101 095 099
r 032 042 042
Implications for Appraisal
Table A34 below sets out the values of time in pound per hour from the different methods considered
in this study Whilst the relationships apparent between mode and valuation for the employersrsquo
stated preference and the revealed preference conflict with each other the exploratory nature of
this pioneering study and the precision with which the values are estimated should be borne in
mind However the results do show a reasonably high degree of similarity across methods Fowkes
(2001) stated that ldquoNevertheless it is easy to see why Table 1 [of their report] was not thought to
give any great support to calls for a move away from the current approach towards use of the
Hensher formulardquo
Table A34 Fowkes et al (1986) UK Business VoT Study (poundhr 1985 prices)
Method Car Rail Air
Wage Rate Approach 103 98 119
Employersrsquo Stated Preference1 120 120 120
Revealed Preference 141 126 115
Synthetic (Hensher) r = r p = 0 r = r p = p
104 101
101 77
100 83
Note We have averaged over the ECML and ORGN samples 1 This is the overall SP figure reported
in the paper
The personal valuation of business travel time savings where a strong income effect was apparent
was between 611 and 621 times larger than the official equity values of time for non‐work
journeys The ratio is over 4 even for the lowest income group of business travellers
This was at least in the UK context a pioneering study and the conclusions are worth recounting
particularly since its findings influenced the Department for Transportrsquos retention of the cost saving
method
51
Whilst we find good reason to suppose that much of the time savings in our sample will be
devoted to leisure we still find that these time savings are valued highly by employers and
employees alike Perhaps this is not surprising the reason why we expect time savings to be
used for leisure is that they accrue on (often extremely) unsocial hours
For evaluation purposes the issue is less clear cut The value of time savings has been shown
for our samples to vary significantly according to the valuation methodology adopted
Although we do not possess sufficient evidence with which to decide unequivocally on the
most appropriate to use we believe that the lowest value that it would be reasonable to
contemplate are those which assume that all time savings would be devoted to leisure
activities but that any work undertaken en route would still be done and which use
employeesrsquo stated preference values adjusted for equity considerations This gives values in
the range of 40‐57 of the wage rate approach value Only a modest use of time savings for
work purposes is needed to obtain values close to the wage rate approach value for instance
assuming that the proportion of time savings devoted to work equals the proportion of travel
time in normal working hours will do this
In short although we find no empirical support for the assumptions upon which the present
valuation conventions are based our empirical work suggests these conventions yield values
which are approximately correct
This study did not claim to provide representative values of time What it did aim to do and achieve
was to compare different methods of estimating the values of time However the relationships
apparent do not necessarily apply to shorter distance trips whilst it is possible that the relationship
between the values might have varied over time either with methodological advances or more
significantly with changes in the characteristics of business travel
UK 1994 Study (Hague Consulting Group et al 1999)
Unlike the 1987 national value of time report an explicit objective of this national study was to
derive values of time for work as well as non‐work time Business travel is covered in four aspects
Explicit consideration of the application of the Hensher approach to business travellers
The main car usersrsquo value of time experiments which covered employerrsquos business trips
A repeat of the 1987 studyrsquos analysis of urban car usersrsquo route choices in Newcastle but
including business travel in the RP element
A study of the SP choices of freight operators9
9 Although this was not restricted to the value of time but will also cover operating costs and the value of the commodity
We do not cover this aspect of the study here
52
p q and r evidence
The value to the employer of changes in travel time for the employee (EVoT) was specified as
EVoT = W(a‐bc)
where W is the wage rate inclusive of overheads a is the fraction of the time variation that impacts
on time spent working often referred to as 1ndashr where r is the proportion of travel time saved that is
used for leisure b was specified as the fraction of travel time already spent doing some work which
is p and c is the productivity of work during travel relative to work done elsewhere which is
typically referred to as q
The questions specifically asked of business travellers relating to the formula above were
Suppose that the business trip that you were making when you received this questionnaire
had taken 15 minutes longer as a result of congestion on the roads Would that extra time
have been paid by your employer or would it have mostly come out of your own time
and
Did you use any of the time during that trip to do work which you otherwise would have done
elsewhere for example preparing for a meeting conversations on a portable telephone etc
If so about how much time
Approximately how long would that same work have taken you if you had done it at your
office or at home
The averages for a b and c across the entire business travel sample were 0537 0043 and 102 Not
surprisingly b (p) is low for car given the limited opportunities to work during a car journey
particularly in 1994 The value of r (1‐a) seems high given that many trips would have been made in
normal work hours
The variations in p q and r across a number of dimensions are given below P is higher for
motorways and lower for deliverypickup as expected but the effect is slight and there is hardly any
variation across categories Similarly q is closely centred around one
There is more variation in r with it higher for journeys made after 1600 as might be expected whilst
those attending a seminar which presumably takes up the whole day as well as those attending a
meeting would be more likely to incur the extra travel time in their own time The high figure for
self‐employed could be because there is little point paying themselves extra as a result of a delay
There is a slight but not convincing effect of the expected form from journey duration
53
Table A35 p q and r values (HCG et al 1999)
p q R
Before 10 003 108 042
1000 to 1600 005 101 044
After 1600 005 101 061
10‐30 mins 003 111 047
31‐60 mins 004 101 041
61‐120 Mins 005 100 043
gt 120 mins 005 101 054
Self Employed 003 096 081
Employed 004 102 036
Meeting 006 100 051
Visit Client 005 104 044
Visit Branch Office 004 100 040
Attend Seminar 003 078 066
Deliverypickup 001 098 045
Other Purpose 002 105 047
Motorway 006 098 046
Trunk 004 106 046
Urban 002 099 047
Time Save to Employer 005 105 000
Time Save to Self 003 097 100
Given a gross wage rate of around pound185 per hour the average employer value of time is just over
pound9 per hour However as was pointed out the various components of the Hensher formula are not
independent for example those with higher salaries are more likely to work while travelling
Adopting a sample enumeration approach based on each individualrsquos wage rate and their own a b
and c the average is a little lower at pound88 per hour
Employerrsquos Business Trips SP
There were two SP exercises relating to business (and indeed other) travel The first termed SP1
offered trade‐offs between time and cost and was intended to obtain a personal value of time for
journeys made on company business The respondents were told
If you did not actually pay for the journey yourself please assume that you would receive a
fixed amount of reimbursement equal to the current journey cost so that any additional or
saved costs would go to you10
10 Note that four of the twelve questionnaires (TA TC MB MD) deliberately did not include this text
54
The second SP exercise relating to business travel termed SP311 offered choices between an
untolled A road option and a tolled urban road trunk road and motorway Business travellers were
told
If you think that an employer would reimburse the toll cost then this should be taken into
account when making your choice
The statement about a fixed reimbursement had no significant effect on the cost coefficient in the
business model Those who were reimbursed had a lower cost coefficient but surprisingly it would
not be zero but rather only 20 to 30 less It was concluded that ldquoOverall the effect of cost
reimbursement is not as strong as one might expectrdquo Whilst it was claimed that ldquoall respondents
behaved to some extent as if the SP cost changes would come out of go into their own pocketrdquo
there is nonetheless an element of uncertainty as to what the valuations represent
In distinguishing additionally between whether it was the employerrsquos or the respondentrsquos time and
relative to a base of respondentrsquos time and money business travellers for whom it was their own
time and their employerrsquos money had a 26 higher value reflecting the slight effect above of
reimbursement When it was the employerrsquos time the value was 11 lower when it was the
respondentrsquos money and 11 larger when it was the employerrsquos money This indicates that the
respondent places slightly less importance the employerrsquos time than their own time which is to be
expected if the respondent is primarily taking their own preferences rather than the companyrsquos into
account The variations do seem slight and again raise concerns about the interpretation of the SP
results
Turning to the tolled road SP exercise (SP3) for business travellers the reimbursement was based on
the question ldquoif you were to travel on a tolled motorwaytrunk roadurban road who would pay the
toll costsrdquo It was found that the toll coefficient would not be zero even for those who had all the
toll reimbursed Tests were conducted for strategic bias against tolling but this had little effect on
the non route constant terms
The values from the SP1 and SP3 exercises are reported in Table A36 for all three purposes Despite
one exercise relating to tolls and the other to other car costs which might be seen as causing a
difference due protest against tolls we see little difference between the commuting and other
values for the two exercises We might then conclude that there are other factors causing a
difference between the two results Note that SP3 does not have car passengers and for business
travellers in SP1 these had higher values This would account for some of the difference
11 There was a second SP exercise but it did not relate to business travellers Hence the second SP exercise for
business travellers was the third SP exercise (SP3) offered
55
Table A36 SP1 and SP3 valuations from HCG et al (1999) ‐ pound per hour
Business Commute Other
SP1 73 32 26
SP3 48 32 35
Note Reproduced from Table 104
However it is a little concerning that the SP3 exercise which aims to provide business valuations
more in line with the employers yields lower business valuations than the SP1 valuations which are
intended to be personal values
Repeat Newcastle Study
Unlike the original study business travellers were here asked for RP information in addition to
conducting the SP exercise And two SP exercises were used one was an exact repeat of the
Newcastle route choice SP exercise (SP1) whilst the other was a simple time and toll trade‐off (SP2)
Business travellers were told to bear in mind company policy on cost reimbursement when
answering the SP exercises
The results for the three sets of data are presented below split by journey purpose As expected
the 95 confidence intervals expressed as a proportion of the central estimate are much tighter for
the SP data given their larger samples We observe the business SP values to be larger than the non‐
business values However this can hardly be taken to indicate that respondents have followed the
instructions on reimbursement since we would have reasonably expected much higher multiples
than apparent here The study mean labour cost is 309 pence per minute and is only a little lower
for shorter distance trips
Table A37 Valuations (pound per hour) from Repeat Newcastle Study (from HCG et al (1999)
Business Commute Other
RP Value 95 CI Obs
68 plusmn89 189
24 plusmn39 453
57 plusmn73 222
SP1 Value 95 CI Obs
36 plusmn20 1070
23 plusmn12 2834
22 plusmn20 1528
SP2 Value 95 CI Obs
26 plusmn12 1583
14 plusmn8 3721
20 plusmn9 1661
Note For reference we provide the cost saving value of time of pound185 per hour
Whilst the RP business values are somewhat larger than the corresponding SP values they are not
high and very much less than the wage rate In any event the RP values are also higher than the SP
values for other trips and thus there could well be reasons other than cost reimbursement and
company policy issues that are leading to a discrepancy We would have to conclude that neither
56
the RP nor SP values support the cost savings approach but equally admit that there are some
uncertainties as to what the SP values represent and recognise the imprecision of the RP estimates
Implications for Appraisal
The employer value was derived using the modified cost saving approach of 147 pence per minute
to which is added the employee value of 67 pence per minute The latter was based on SP1 for
those who used their own time and money Note however that the measure of p used (p) was the
average amount of time spent working rather than the amount of time spent working that would be
lost as a result of the time saving More importantly the value of 67 pence per minute should have
been weighted by r which on average is 0463 Thus the total value of time would have been 178
pence per minute of which 310 is the employeersquos value This is 58 of the average gross wage rate
in the sample obtained
Commercial vehicles were also covered SP methods were used to get employerrsquos value of time
saved The study concluded that ldquoas with the Hensher approach for working time we would
recommend adding the personal VOT of the driver and any accompanying staffrdquo
Netherlandsrsquo Experience
The Mott MacDonald (2009a) study identifies the Dutch National Model (LMS) as containing time
and cost effects estimated directly to mode and destination choices Apparently these models have
not been used in evaluation with the reason given being that due to the log‐cost specification the
value of time is not constant with journey duration Notably Mott Macdonald et al (2009a) state
that with respect to the business time valuation ldquothe results obtained may have been similar to the
wage rate at the timerdquo whilst recognising that ldquotrends in societal time use and technology could
change this in futurerdquo
The Dutch national value of time studies of the 1980s and 1990s (Hague Consulting Group 1990a
Hague Consulting Group 1998) indicate that business travellers work during their journey and
particularly for rail the amount of time spent working has increased over time The results of a more
recent Dutch national study are soon to be published and this will presumably provide more insights
into inter‐temporal variations in the Hensher parameters
The Dutch 1988 value of time study (Hague Consulting Group 1990a) used travel demand survey
data covering mode and destination choice including longer distance travel to develop Revealed
Preference models Whilst the business values for car driver were 76 higher than for commuting
and over 5 times leisure with respective figures of 64 and 33 times for train passengers the
standard errors for the business values exceeded the central estimates
Whilst imprecisely estimated the business values are in line with the wage rate The report states
that ldquohellip Revealed Preference values helliphellip should in principle reflect the valuation of the employer as
wellrdquo The SP results were claimed to relate to individualsrsquo personal valuations since business
57
travellers were instructed to consider the SP alternatives as if they were making the exact same
journey but in their own leisure time and at their own expense Noticeably the RP and SP values for
car and train and commuting and other were similar but the SP values were 42 and 39 lower for
car and train business travellers respectively
The business valuations were intended to reflect VL and can be compared with the private leisure
valuations The ratios were 191 to 244 for car depending on the type of time 175 for train and
183 for bustram These presumably reflect the larger incomes of business travellers
In further analysis of the SP experiments offered on public transport users (Hague Consulting Group
1990b) the cost coefficient for business travellers was found to be 37 smaller where the employer
reimbursed some or all of the cost This is surprising given respondents were told to assume that
they would pay for all costs directly so that the values reflect travellersrsquo personal valuations It is
concluded that ldquothe results above indicate that this approach has not been entirely successfulrdquo
The 1988 Dutch study was extended by making use of questions asked in the survey and relevant to
the Hensher approach (Bradley and Gunn 1991) This included the p q and r terms The relevant
questions (for car) asked were
Did you do some work during this car trip which you would otherwise have had to do in the
office If yes how long was it in total
How many minutes would the work in Q13a (above) have taken in the office
Suppose your travel time is 20 minutes less than your current one how would you allocate
this 20 minutes time saving
Table A38 1988 Dutch Study ndash Implications of Modified Hensher Equation
Mode MPL Employer Employee Total MPL
Car 4469 304 212 376 84
Train 3652 157 140 231 63
Bus 2846 118 113 172 60
Note Values in Dfl per hour in 1991 prices The employee value has here been weighted by r and
unlike the report is that which enters the total value reported here
For car train and bus business travellers r was on average 034 053 and 048 The corresponding
figures for p were 002 011 and 003 respectively and for q were 090 089 and 093 respectively
Note however p was not the amount of saved time that would have been spent working but the
amount of time spent working (p) The implied values using the modified cost savings approach are
set out in Table A38 For all modes the value of time is less than the wage rate (MPL) As would be
expected the reduction is larger for public transport modes where the opportunity to work is
greater
58
The repeat Dutch study conducted in 1997 (Hague Consulting Group 1998) followed the same
approach for business travel of using SP to estimate employee valuations and using a modified cost
saving approach to deduce employer valuations Summary statistics relating to the business value of
time are provided in Table A39
For car train and bus business travellers r was on average 045 063 and 065 The corresponding
figures for p were 004 016 and 003 respectively and for q were 090 089 and 093 respectively
The q values on average varied very little between 1988 and 1997 whilst it is only for rail that we see
sizeable increases in the amount of working while travelling
As a result of these changes to p and particularly r the employersrsquo value of time for all modes fell
quite appreciably between 1988 and 1997 The employersrsquo values for car train and bus were 262
117 and 122 in 1997 with the 1988 study providing values of 286 251 and 274 in 1997 prices
Increases in the productive use of time can creditably be related to the greater use of laptop and
mobile phones but it is unclear why the proportion of travel time saved converted into leisure
should increase Indeed given many journeys would be made in normal hours it is surprising the
the r values are so large In reality travellers might not be allowed to convert time savings into
leisure at the rate they perceive and report
Table A39 1997 Dutch Study ndash Implications of Modified Hensher Equation
Mode MPL Employer Employee Total MPL
Car 5097 262 239 370 73
Train 5141 117 192 238 46
Bus 3757 122 116 197 52
Note Values in Dfl per hour in 1997 prices The employee value has here been weighted by r and
unlike the report is that which enters the total value reported here
Swedish Experience
The Swedish 1995 study (Algers et al 1995) contained a section aiming at measuring the Hensher
parameters The relevant questions posed to business travellers were
Did you work during the trip
The proportions working during the trip were 48 for car 25 for air and 56 for train
Unsurprisingly the figure for rail is large but that for car is also high These respondents were asked
In that case how much (percent of total in‐vehicle time)
The proportion of the total in‐vehicle time spent working (p) was 30 for car 50 for air and 50
for train The relative productivity question took the form
How long time would these tasks have taken at your normal workplace
59
The mean for those working during the trip was that they were 93 as efficient as at the office
Travellers were next asked
If you hadnrsquot had the possibility to do these tasks during the trip how much of it (in ) would
you have done during a) normal working hours b) overtime c) leisure time d) not at all
50 would have done the work during normal hours and for 6 it would have been overtime It
would have been done in leisure time for 36 and not at all for 8 This was followed by
If the value of working time at your normal working place is 100 how high would you
value your working time on the train
The mean value was 65 with 17 stating between 0 and 33 31 stating between 33 and 66
and 52 stating between 67 and 100 Business travellers were then asked
If the travel time of this trip had been shorter how much of this time had you spent working
and how much would have been leisure time
This question was asked in two versions one where the travel time reduction meant that the
traveller would start later and one version where the traveller would arrive earlier On average 30
of the time would be used for work Table A310 summarises the results for the Hensher parameters
split by mode
As tends to be the case across studies the relative productivity of work done while travelling and at
the office (q) is close to one overall However as can be seen there are several cases where q is
somewhat over 1 and this is not plausible This is something the study wrestled with including
distinguishing between relative productivity whether the activities would have been undertaken
outside of travelling and the value of the activities being undertaken as addressed by two of the
questions above Whilst it did appear that the activities would have been undertaken it was
concluded that they had only two thirds of the value12
The p values are generally low with a greater tendency to work on public transport modes as
expected whilst the higher r values for rail and air and indeed long distance bus may well reflect the
longer duration of these journeys and hence a greater likelihood that travel is undertaken in
personal time or in unsocial hours Nonetheless concerns were raised about the high values of r
and it was concluded that the total amount of work should not fall after a time saving thereby
setting 1‐r to the maximum of 1‐r or pq)
12 The study therefore weighted q values by 065 It also assigned the same value to VW as VL In our calculations later we
have for consistency with other studies used the reported q values set VW to zero and weight VL by r
60
Table A310 Swedish Value of Time Study p q and r values (Algers et al 1995)
Mode p q R
Car 014 101 054
Car Self Employed 010 120 066
Air 013 097 084
Air Self Employed 011 102 085
Train Inter 028 103 078
Train Self Employed 023 108 075
X2000 028 104 079
Train Regional 018 115 082
Bus Inter Urban 013 093 085
Bus Regional 017 126 086
Comp Car 019 111 047
In order to estimate the private value of time VL travellers were subject to an SP experiment where
changes in travel costs were to be covered with the travellerrsquos own money A special study similar
to the main study was also carried out on self‐employed travellers Presumably for them the
lsquocompanyrsquosrsquo value of time would be completely internalized Nonetheless the results were not
markedly different from those in the main study
Finally an SP study where the respondents were told to choose ldquoaccording to company guidelines
and rulesrdquo was carried out This gave considerably higher valuations especially for air and train trips
Table A311 summarises four estimates of the business value of travel time savings the Hensher
equation with the original parameters and with VW set to VL the Hensher equation with the
original parameters and VW set to zero which are obviously lower and indeed somewhat so figures
which set revised values for q (q=065 (1‐r)gtpq for each individual) given concerns about the q and r
values which leads to higher than original values and the lsquocompany guidelinesrsquo WTP choice
experiment
Table A311 Swedish National Study Various Values of Business Travel Time (Algers et al 1995)
Original VW = 0 Revised WTP
Car 145 118 167 150
Air 122 107 141 223
Train 100 70 134 201
The original values are pretty much between the VW=0 and revised values but the WTP values for
rail and air are very much higher These values offset the higher p values for train that lead to its
otherwise relatively low values Whilst the WTP values for rail and air might be regarded to be too
high around twice as high as those of the Hensher equation with the original parameters we can
point out that the car WTP values are reasonably in line with the other Hensher figures and we
might expect air and train business travellers to have relatively high values because of more senior
positions longer journey length travel at inconvenient times and relatively high productivity at the
destination
61
Norwegian Experience
The Norwegian 1997 study (Ramjerdi et al 1997) was similar in many ways to the Swedish 1995
study A number of questions aimed to estimate the Hensher parameters and the survey also
contained a choice experiment where changes in travel costs were covered with the respondentrsquos
own money to capture VL The p q and r questions are reproduced below
How much of the travel time is within your normal working hours
Do you get any compensation for travel time outside normal working hours
Permissible responses were wage wage and overtime half wage can get time back through
rescheduling other work no and donrsquot know
Did you work during the trip (eg made a call read write)
If the traveller replied yes then they were asked
How much time did you work and
How long would the same task have taken at your normal workplace
Note that in Fowkes et al (1986) terminology these questions elicit p and r The table below
summarises results for inter‐urban and urban travel respectively It is not clear why the q values are
so low and out of line with values typically obtained of around 10 The r values tend to be large for
the inter‐urban modes presumably because of the prevalence of travel outside of normal working
hours due to the distances involved The figure falls noticeably for urban trips Productivity levels
also seem atypically low when compared with other studies but this might also be a function of
travelling in personal time The study offers little by way of explanation for some surprising values
particularly for q which are out of line with the evidence from other studies
Table A312 Norwegian Value of Time Study p q and r values (Ramjerdi et al 1997)
p q r
Inter‐Urban Car 003 032 057
Inter‐Urban Air 007 028 064
Inter‐Urban Train 018 039 072
Inter‐Urban Bus 006 020 074
Inter‐Urban Ferry 003 019 063
Urban Car 021 002 039
Urban Public Transport 030 007 043
The SP exercise clearly stated that the respondent would directly incur or benefit from any cost
variations but it did not state what the time savings would be spent on The authors segmented the
models according to the proportion of the time (r) that would be used for leisure For car bus train
62
and air the values of time were between 18 and 58 lower when r exceeded 90 than when it
was less than 10 This suggests that care needs to be taken in specifying what the time saved
would be used for
The implied values of time using the Hensher approach are set out in Table A313 In the lsquoFull
Hensherrsquo equation VW is set equal to VL This seems difficult to justify as argued by Fowkes (2001)
and the very much higher values are unwarranted The lsquoModified Hensherrsquo approach sets VW to
zero In both cases MPF is assumed zero The modified Hensher approach generally provides values
less than the cost savings approach although notably air users are assigned higher values
presumably due to their high values of VL
Table A313 Norwegian National Study Various Values of Business Time (Ramjerdi et al 1997)
MP Full Hensher
Modified Hensher
VLLeisure VoT
Inter‐Urban Car 185 259 (140) 181 (98) 215
Inter‐Urban Air 201 379 (189) 267 (133) 202
Inter‐Urban Train 153 148 (97) 116 (76) 219
Inter‐Urban Bus 132 90 (68) 75 (57) 123
Inter‐Urban Ferry 161 172 (106) 130 (81) 123
Urban Car 170 190 (112) 137 (81) 223
Urban Public Transport 131 152 (116) 106 (81) 276
New Zealand Study
A major New Zealand value of time study was reported by Beca Carter Hollings and Ferner et al
(2002) and a part of this covered the estimation of the p q and r values through telephone surveys
of 600 business travellers including professional drivers
p q and r evidence
The use of a telephone survey contrasts with intercept surveys (for instance on train or at service
stations) in two important respects Firstly we can be sure the questions are answered after the
journey has been completed Secondly the farther in the past was the actual trip then the greater
the potential problem of recall
The questions asks in investigating p q and r are set out below
I am now going to ask you about some activities that people do while travelling Please tell
me if you did any of these as part of your job (that is not for personal reasons) on that
specific trip
Permissible responses were use a phone reading use a computer dictation discuss workbusiness
with travelling companions or none of these This was followed by
63
Did you do anything else while you were travelling that was part of your job (not including
driving for professional drivers)
If the answer was yes then the respondent stated what the activity was
The interview then proceeded to determine how much time during the course of the journey was
spent on each activity separately
You said your trip took hellip hours hellip minutes How much of the travelling time did you spend
(talking on the phonereadingusing a computerdictatingtalking to travelling companions)
to do with your job
This p question was followed up with questions on relative productivity
If you hadnrsquot spent time (activity description) while travelling when would you have done it
Permissible responses were in other time at work while travelling tofrom work during personal
time (outside work hours but not while commuting) would not have done it at all and other This
was followed by
Would (activity description) have taken longer about the same time or less time if you had
done it (at work in own time etc)
The response categories were about the same more time and less time and the latter two were
followed up with questions on the amount of time more or less The next question related to what
they would do with any saved time
Now with the same trip in mind I want you to imagine that recent improvements to the
(road and traffic systembus servicerail service) meant that you knew you would save some
travelling time on this trip Do you think that you would have used that time for more time
working more personal time some of each)
Followed with
How much if each (frac14 work frac34 other frac12 work frac12 other frac34 work frac14 other)
The final question relating to the Hensher equation was
You said you spent (hours minutes) (activity) during your (hoursminutes) trip If the (road
and traffic systembus servicesrail service) improvements meant that your journey was
shorter would it have reduced the time you spent on any of these activities
If the answer was yes then they were asked
64
If your journey had been say 5 minutes shorter how much less time would you have spent
on (activity)
Hence questions on p and p were asked alongside q and r
Almost 60 of trips involved no work activity while travelling and p was on average 022 but with a
strong negative correlation with distance The relative productivity of activities in travel compared
to elsewhere slightly exceeds one with travel based activities around 7 more productive on
average However a cap of one was applied so that working while travelling could not be more
productive than elsewhere for any individual whereupon the central estimate for q was 093
The proportion of time saved that would be devoted to leisure is around 28 with relatively little
variation across occupations However the response categories were crude The mean reduction in
time spent on work activities for those working during the journey was only 7 implying a value of p
overall of 0028 This is not surprising given the dominance of car
VL was not estimated in this study and instead the behavioural value for all non‐work travel was
used instead The latter can be expected to understate VL not least because business travellers have
higher incomes
As a result of applying a modified Hensher correction that is ignoring MPF and setting VW to zero13
the car driver kilometre weighted business valuation falls by 18 The adjustments are small
because the scope for working during the course of a car journey is relatively limited and the time
savings would not be predominantly at the expense of working while travelling The reduction for PT
users is 24
Switzerland Value of Time Study
As part of this study which primarily addressed private travel a small sample of 62 answered
questions relating to the Hensher parameters 16 of these would not work during a business journey
and 19 stated that any time saved would not be used for work
The questions were
Do you work during your business trips (ie telephone read write discussion with
colleagues or clients etc)
Responses were never or normally If the answer was normally then the amount of time was
established This was followed with a question relating to q
13 Note that VL was correctly weighted by r
65
How long would this work take at your workplace
which could be the same time or X minutes on average shorter or longer As for r respondents were
asked
Imagine that improvements in travel conditions were to reduce the journey by 15 minutes
How would you use this time
Responses distinguished between work time (at workplace with clients etc) own time and a mixture
of the two A similar question was asked relating to p
Imagine that improvements in travel conditions were to reduce the journey by 15 minutes
How long would you then work during the journey
Permissible answers were the same time X minutes less or not at all
The mean level of working while travelling across the sample was 64 whilst relative productivity (q)
was 98 The proportion of saved time that would be used for work was 49
The study concluded that ldquoBased on these average figures we obtain a business VTTS of 2135CHFh
(compared to a wage rate of 6649 CHFh) This seems implausible in relation to other references
both in the level and in its relationship to other purposesrdquo It is because the employerrsquos value is
negative given that pq is large relative to 1‐r Essentially the time is being transferred from working
while travelling to leisure and hence is a loss to the employer We can note three things Firstly it is
not p but p which is measured and if the work is so important it may still be done after time
savings occur whereby p will be much small than p Secondly the figure of p is very large relative
to evidence from other studies Finally the sample is small
We have included this Swiss study for completeness but little emphasis should be placed upon it as
far as business travel is concerned given the small sample and strange results Nonetheless it does
point to some lsquounsavouryrsquo implications when pq is large relative to 1‐r
UK Rail Travel Time Productivity
This Study of the Productive Use of Rail Travel (SPURT) is reported in Mott MacDonald et al (2009a
2009b) It is one of the first and certainly the most comprehensive examinations in the UK of the
amount of time spent working on trains by business travellers and the activity consequences of time
savings
The study is useful for several purposes Firstly in estimating p q and r values and working through
the implications for business valuations of time savings in the rail market Secondly in inspecting
how these parameters might vary across a range of situations Thirdly in undertaking SP research to
66
obtain personal valuations of time savings for those undertaking business travel including crowding
and other benefits Finally it provided a review of some important studies
p q and r Evidence
A sample of 1660 valid and checked questionnaires were obtained from on‐train surveys conducted
in Spring 2008 Respondents were asked to complete the questionnaire ldquotowards the end of the
train journey you are makingrdquo to be returned by mail A very creditable response rate of 35 was
achieved
Respondents were asked
Could you please estimate the amount of time you spent on this train doing each of the
following activities
Permissible responses were settling down work activities related to employment personal
activities and preparing to disembark Responses could be in minutes or proportion of overall
journey This was followed by
Which if any of the following work activities related to your employment did you do on this
train
Response categories were none prepare for a meeting make or receive business callstexts talk to
colleagues use laptop use PDABlackberry and other work related to employment
Respondents were then asked to indicate on a lsquotimelinersquo when they undertook work related
activities during the course of the journey This seems to be a novel and well worthwhile feature of
the study
With regard to the relative productivity of working while travelling and in the usual work
environment the respondent was asked
Approximately how long would the work‐related activity have taken you if you had done it at
your normal place of work
Permissible responses were about the same time more time and less time In the latter two cases
the respondent was invited to state how many more or less minutes Whilst it is possible that some
things can be done more productively while travelling say because there are fewer disturbances
this is offset by the range and value of activities that can be done in the normal workplace being
higher
67
There were then a set of questions relating to how journey time variations which varied from 10
minutes for the shorter journeys through 15 minutes to 20 minutes for the longest would impact on
work undertaken Two questions related separately to a shorter and a longer journey
Suppose this rail journey was scheduled to last 101520 minutes longer (shorter) how long
would you have spent undertaking work‐related activity on train
The answers could be the same or more or less time with the amount specified Following on from
this was a question on the use of the time saved This was
If this train was scheduled to arrive at your destination station 10 minutes later (earlier)
would you have spent the additional time working on the train (do you think you would have
worked or not in the 10 minutes saved time)
For earlier arrivals permissible responses were not worked worked in usual workplace worked in
other workplace worked at home worked elsewhere (eg cafeacute hotel) and other For later arrivals
the responses were spend all of the additional time working on train spend some of the additional
time working on the train spend none of the additional time working on the train and donrsquot know
Other questions related to levels of crowding and its impact on productivity presence of facilities to
support working while travelling and detailed activities undertaken during the journey
Around 80 of rail business travellers in Spring 2008 are now working during a train journey with
82 working on the outward leg and 77 on the return journey This is contrasted with an estimate
of 52 from the National Passenger Survey (NPS) of 2004 and is facilitated by more power points on
trains and more Wi‐Fi connectivity This was over a period of only 3frac12 years and is therefore a large
increase The NPS did not reveal the actual amount of time spent working Although not
undertaken on a comparable basis it was estimated that 30 of journey time was spent working in
2004 increasing to reported levels of 57 in 2008
Across both directions of travel on average business travellers spent 46 of travel time working in
2008 which represents p and this contrasts with a value for p of 041 However the latter does
vary across time bands This value of p is high compared to other evidence and presumably a
contributory factor is that it is the most recent rail evidence and we would expect p to increase over
time
A key issue is how productive this is relative to work done in the office environment It was found
that there was little difference with train time having 97 of the productivity of work‐place time
This falls to 89 in crowded conditions where 90 or more of seats are occupied but hardly varies at
all with journey length The credibility of these results can be questioned
Of the time that is saved after an earlier arrival on average 48 of that time would be spent working
off‐train although this varies by factors such as journey length and direction of travel This r value of
68
052 is high However it would be difficult argue that the main reason is because of the long
distance involved since only 19 of journeys exceeded 90 minutes
Explaining travel behaviour14
There are quite a number of studies that provide estimates of p q and r but there has been little
research conducted into how the parameters vary across different circumstances
A novel feature of this study was that the questions set out above were subject to an extensive
amount of segmentation by relevant factors although without conducting the detailed empirical
analysis to systematically explain and quantify how these figures vary across individuals travel
conditions and journey characteristics so as to have predictive models of time use
Although the vast majority of the data covers trips of less than 90 minutes it is interesting to
observe how the various parameters vary with journey length These are reported in Table A314
below
Table A314 Hensher Parameter Variation by Journey Length
p p q r
lt 45m 060 041 098 048
45‐89m 035 049 097 051
90‐149m 028 049 098 056
150m+ 022 049 096 065
The relative productivity varies little with distance unsurprisingly whilst we might expect r to
increase with distance as more trips are then made out of normal office hours The average level of
productivity (p) varies little when we might have expected some downturn for longer distances
although it is not surprising that it is lowest for short distance journeys In contrast p quite clearly
decreases with journey duration This seems realistic there will be less pressure on working time
on longer journeys and hence the amount of productive effort foregone will be less
The type of activities and amount of productive time (p) undertaken during a train journey varied
generally in an expected manner with a range of factors such as direction of travel occupation
flow type crowding and on‐board facilities all having a bearing Interactions between variables were
apparent whilst there were variations in effect between the proportion working and the proportion
of time spent working The timing of work undertaken peaks earlier in the journey and this is a
possible explanation of why p is less than p Perhaps surprisingly there was little difference
between first and standard class in the propensity to work on the outward leg although a 10
percentage point difference was apparent on the return leg
14 The discussion below is based on our understanding of the significant amount of outputs from this
important study However the discussion is often detailed and in some cases not easy to follow or interpret
69
Less attention was paid to variations in p q and r with the distance segmentation reported above
being the most significant analysis and there being no clear effect from the amount of time saved on
p The exception to this was crowding levels where a number of segmentations were presented
Crowding is potentially a key issue and as far as we are aware this study provides the first insights
into how crowding impacts on the Hensher parameters although there is a considerable amount of
evidence on how crowding impacts on valuations (Wardman and Whelan 2011) Unfortunately
though and as also applies to the examination of distance effects the analysis of the crowding
issues was hindered by small samples in the more crowded categories
It was only at load factors over 90 with some standing that the relative productivity is impacted At
that level q falls from around 1 to around 09 We can but speculate that it will be somewhat lower
when standing is involved but further research is required on this issue not least because one could
imagine that crowding would have a larger impact than this study revealed
Even if we accept that q does not vary greatly with load factor providing if it is possible to be seated
we would expect the ability (or indeed willingness) to work during the journey to fall with the load
factor The results with regard to crowding and productivity are not conclusive but it appears that
at 75‐90 load factor 50 of the journey was spent working (ie p = 05) At load factors over
90 (without standing) it was 38 For passengers who are forced to stand the evidence denotes
that p might be halved
The level of crowding in terms of proportion of seats occupied did not greatly affect whether work
was undertaken during the course of a journey It was only when the conditions on the departing
train involved (a few) people standing that there was a significant drop‐off in the proportion working
during the journey When related to the proportion of the journey the respondent was seated the
results are limited by the ability of most to be able to sit for most of the journey The study states
ldquothe conclusion remains that work activity is affected by whether one can sit all the time or not but
further insights are desirablerdquo and ldquothe effect of crowding andor seating availability needs
therefore to be explored furtherrdquo
The dominance of short business journeys might be seen as something of a weakness since they can
be expected to be somewhat different in nature as we have to some extent seen In addition a very
useful addition to the literature would have been a model that explains how p q and r vary over
different travel and personal circumstances
SP Research
An SP exercise was used in which business travellers had the opportunity to trade‐off their own
money against time variations and also crowding levels and the quality of mobile phone reception
However the crowding variable denoted the proportion of seats taken (25 50 75 100) but
did not indicate whether the respondent would get a seat or not
70
The manner in which the personal payment was introduced was that the company would provide an
allowance of pound15 for the journey Any increase in the SP exercise on a pound15 fare would have to be
paid by the respondent but conversely if the fare was less than pound15 they could keep the difference
This is now the standard approach for estimating VL The value of time that emerged varied with
model specification
This study also provides estimates of how VL varies with crowding levels with a fairly strong effect
on VL from crowding above the 75 occupancy level This is consistent with other crowding
evidence that load factor seems to have an effect at this sort of level prior to standing occurring
(Wardman and Whelan 2011) However it only examined crowding up to a level of 100 of seats
taken Even then it is unclear at that level whether the respondent would have got a seat or had to
stand the difference in valuation between the two can be expected to be large
An effect related to clear mobile reception was also detected but presumably this is not a significant
issue going forward
Appraisal Consequences
The consequences for appraisal values of time under various scenarios for the sample obtained were
calculated (Mott Macdonald et al 2009b) Four scenarios are reproduced below
Scenario 1 The cost saving approach
Scenario 2 Consider working time lost on the train but assumes all time saved is converted
to work time (r=0)
Scenario 3 For home based trips this takes into account leisure time increases in addition to
working time lost but assumes all time saved is converted to work time for other trips
Scenario 4 This is the short run modified cost saving approach with levels of on‐train
working and proportions of time saved as in the SPURT survey
The train user business valuations in pound per hour 2008 prices and income under each scenario
reproduced in Table A315
Table A315 Train User Valuations (pound per Hour) from SPURT (Mott MacDonald et al 2009b)
Scenario Employer VoT Employee VoT Total VoT
1 3909 0 3909
2 2511 0 2511
3 1089 707 1796
4 469 1780 2249
Note Fowkes (2001) has pointed out that many studies incorrectly do not apply the r weight to VL
effectively treating VW as VL If r is applied to VL then the total value of time falls to 1376 in
scenario 4
71
Departing from the conventional wisdom leads to a large reduction in the business travel value of
time The main effect is from allowing for the time spent working on train that would be lost which
reduces the value of time by 36 When the transfer to leisure time is taken account for home
based trips and the employeersquos valuation included the reduction is 55 In scenario 4 which
represents the modified cost saving approach the business valuation would be reduced by 43
increasing to a massive 65 when r is applied to VL
The study made a number of useful recommendations for further work notably extending to other
modes on‐going monitoring more focus on what it termed inter‐metropolitan trips and
behavioural modelling to determine how the ability to work productively influences the demand for
rail travel
Summary of p q and r values
A detailed summary is provided in section 312 of the main report which is not repeated here In
particular it contains
Table A32 (Summary of p q and r evidence)
Table A33 (Impact of Modified Cost Savings on Cost Saving Value of Time)
Table A34 (Comparison of Valuations)
Table A35 (Within Study Comparison of WTP and Modified Cost Saving Methods)
Section 315 arrives at representative figures for p q and r based on the evidence reviewed
A34WillingnesstoPayEvidence
We have also examined a large amount of willingness to pay evidence and in particular the extent to
which it aligns with the values implied by the conventional Cost Saving Approach We cover three
separate sets of evidence
A data set covering UK and mainland European values of time assembled as part of a recent
meta‐analysis (Wardman et al 2012)15
Some evidence from a recent large scale study in Japan
Evidence from high speed rail studies as it relates to business travel
15 Whilst this data set covers out‐of‐vehicle time reliability terms and departure time shifts it does not cover crowding
values We therefore cover these in the next section
72
This data is in large part separate from the willingness to pay evidence discussed in section A33
Whilst the evidence in section A33 covers business values from UK and European studies it was
generally based around the estimation of vL whereas the evidence covered here contains much
more business travel evidence and it covers high speed rail
A341ReviewofEuropeanWTPEvidence
We have at our disposal some data sets that have been assembled for the purposes of meta‐
analysis These are
A data set covering 3109 monetary valuations from 389 studies across 26 European
countries from 1960 to 2011 The UK provides 1862 valuations (60) across 233 studies
These money values are largely made up of IVT (60) but walk and headway each provide
10 whilst the remaining cover reliability variables wait time departure time shift and
congested travel time
Related to this data we have time multipliers for 1389 observations from 244 studies Of
these 63 are for the UK These provide for a more controlled assessment of time
multipliers since they all reflect lsquowithin studyrsquo variations than comparing money valuations
of various attributes with money values of IVT
We must though bear in mind that these data sets contain a relatively small proportion of business
values the former contains 14 of business valuations whereas the latter contains 9 Nonetheless
there is sufficient data to be able to conduct meaningful analysis
Our UK data does not include SP studies as far as we are aware where the value of time on business
travel was explicitly a personal valuation (VL) that is where the respondent was told that they
would personally incur any cost increases in return for times savings or receive cost reductions after
a time loss when undertaking a business trip
In the other European studies where personal values have been estimated they have been used to
calculate Hensher type business values The latter are contained in our data set and can be
separately identified
Our SP values are certainly not explicitly personal values but are derived from SP exercises offered
to those making business trips We therefore contend that there is a degree of ambiguity as to what
they represent Our impression is that most studies have taken a quite lsquocavalier attitudersquo and do not
specify what the respondent should assume in terms of company policy and who pays It would have
been a large task to go back to each study and determine this information and in some cases the
studies do not report the questionnaire The values are therefore dependent upon how
respondents interpreted the SP exercises presented to them
73
The sorts of insights that analysis of our meta‐data sets can provide are
To what extent are the estimated WTP business values of time in line with labour costs
given the cost savings approach is an appropriate benchmark
Given that the modified cost saving approach would lead us to expect rail values of time to
be lower than car all else equal is there any WTP empirical support for this
A related point is the modified cost saving approach might lead us to expect a falling
valuation over time as the opportunities for productive use of travel time increase
We might expect RP valuations to exceed SP valuations on the grounds that the latter do
not fully represent company policy Is this apparent in the WTP evidence and if so how do
the latter compare with values obtained by other means
Given SP evidence now dominates but without the resource to investigate what each SP
exercise might have been valuing in terms of personal or company values is there evidence
to indicate that SP based valuations vary according to relevant indicators such as whether
the purpose of the study was forecasting or the choice context was a real one
To what extent are the relationships between estimated business valuations and distance
mode and other relevant variables consistent with the different approaches to business time
valuation
In the cost saving approach time is time Is there evidence to indicate that for business
travel different aspects of time such as walking waiting and in‐vehicle attract different
weights
Section 313 of the main report contains a detailed account of our analysis of the assembled value
of time evidence for the UK and mainland Europe We therefore do not repeat it here
A342 RecentJapaneseEvidence
A major three year value of time study has recently been completed in Japan covering RP analysis of
motoristsrsquo route choices SP analysis and a meta‐analysis of a large number of Japanese values of
time It did not major on business travel value of time but nonetheless it provides some insights
The RP analysis was based on the 2005 Road Traffic Census and examined motoristsrsquo choices
between ordinary roads and an alternative that included ordinary roads and a tolled expressway
(Kato et al 2013) Short distance intra‐zonal journeys were removed as were trips where the time
expressway option was more than 70 minutes quicker or greater than 20 minutes slower It was
observed that in such circumstances there was little variation in the choice rate whereas between
74
these points the expressway option was observed to increase its share as the journey time
difference increased
Separate models were estimated for business travel commuting and other and Table A315 reports
the values of time
As would be expected with such large sample sizes the coefficient estimates were precisely
estimated with t ratios over 25 The value of time per person for business travel is not far short of
the average wage rate which at the time was 372 yen per minute but note that the distance
elasticity was estimated to be 077 which is very large and would imply implausible variations in the
value of time for even relatively small changes in distance
Table A315 Japanese Values of Time (Yen per Minute)
Sample VoT
Commuting 82068 245
Business 12328 339
Other 51621 210
Kato and Tanishita (2013) report a meta‐analysis of 261 Japanese values of time obtained from 68
papers between 1979 and 2003 The business values average 158 yen per minute in 2000 prices
from 15 observations contrasting with 409 for home to work from 40 observations and 558 for
leisure from 30 observations Note that the business values are largely inter‐urban and hence a
distance effect may have influenced the results as implied by the elasticity of 077 above whilst all
15 values were from RP studies16 which might also lead to higher values Indeed removing the air
studies with average values of 177 yen per minute leaves an average value somewhat lower of 83
yen per minute but still larger than the then average wage of 30 yen per minute
The meta‐model itself obtained a very low income elasticity of 031 and therefore we do not regard
it to be a reliable means of predicting absolute values of time for business travel or indeed other
forms of travel Notably the meta‐model found that RP values were over 30 larger than SP values
in line with previous UK meta‐analysis evidence whilst inter‐urban trips were 50 larger backing up
the distance effect above These findings might partly explain why the business values reported in
this study were so large
SP surveys were conducted in 2010 and based upon motoristsrsquo route choices The results based on a
web survey obtained very high values for commuting (874) and very low for business (111) The
paper based questionnaire seems to have obtained more reliable evidence with a business value of
519 yen per minute falling to 455 when estimated to combined RP and SP data The official
business value of time in 2008 based on the wage rate was 440 yen per minute
16 5 are route choice 8 are mode choice and 1 is destination choice Air travel is the focus of 3 route choice and
all of the mode choice studies and these can be expected to be large values
75
This Japanese evidence would if anything support the valuation of business travel time savings in
the conventional manner in line with the wage rate
A343 HighSpeedRailEvidence
Whilst this scoping study is not primarily concerned with rail this aspect of it relates to briefcase
travellers and rail is an important mode for this market segment Given this and that high speed rail
projects are of interest because they offer large time savings we here cover the WTP evidence that
relates to high speed rail of which we are aware This evidence is summarised in Table A318
There is some evidence from Eurostar (Wardman and Murphy 1999) but it might be regarded to be
a different market to domestic UK travel and it certainly generated yields very much higher values
than the potential High Speed rail studies in Britain as is apparent in Table A318 below
At about the same time and for a similar market Halcrow Fox (1998) used SP methods to examine
preferences towards a high speed link between Heathrow and Paris For point‐to‐point business
travellers and in 2010 prices and income the value of time was estimated at pound68 per hour This is
45 higher than the official value for rail However the sample relates to air travellers for whom
income levels will be relatively high
Steer Davies Gleave (2009) undertook SP exercises in the context of a new high speed line between
London and Scotland One related to the choice between car air and rail whilst another examined
the choice of access mode The estimated values are reproduced in Table A316
The high speed values are lower presumably due to a comfort effect in that time spent in the
proposed high speed train incurs less disutility than time spent in a conventional train Having said
that we cannot be certain that this is not the result of strategic bias in favour of a new high speed
service although it is commendable that mode specific valuations have been explored rather than
imputing all the quality benefit of high speed as a fixed amount regardless of distance as would be
the case if the conventional approach of specifying alternative specific constants had been pursued
The estimated car usersrsquo values are somewhat less than the official values of pound34 per hour Similarly
the estimated air and rail usersrsquo values are somewhat less than the pound47 per hour for rail travellers in
Webtag
Table A316 In‐Vehicle Time Values (Steer Davies Gleave 2009)
Air and Rail Users Car Users
Business Leisure Business Leisure
Rail 396 252 240 200
High Speed Rail 302 233 190 150
Air 361 353
Car 230 110
Note Values in pound per hour January 2009 Prices and Incomes
76
These business values are low compared to official recommendations Note that the business
values are not much larger than the leisure values although they are themselves large relative to
official values It may be that the business values reflect personal rather than company willingness to
pay the ratios would not be out of line with the VL values relative to personal leisure values
reported above
The estimated access time values are reported in Table A317 These were obtained from a separate
SP exercise related to access mode choice
Table A317 Access Time Values (Steer Davies Gleave 2009)
Rail Users Car Users Air Users
Business Leisure Business Leisure Business Leisure
180 120 290 120 350 180
Note Values in pound per hour January 2009 Prices and Incomes
For car users the values of access time for business travellers are higher than the values of IVT
although not by the customary amount and a premium of around 30 might seem appropriate For
air users it would seem that access time is valued more or less in line with IVT In contrast rail usersrsquo
access time on business trips is valued somewhat less than the value of IVT Whilst access time
multipliers significantly in excess of one are not consistent with the cost savings approach this
evidence taken as a whole is not inconsistent with the cost saving approach
The Atkins (2002) high speed line study for SRA used SP mode choice exercises amongst rail air and
car users covering high speed rail journey times The values of time were pound370 per hour for air
travel and high speed rail and pound307 per hour for car and conventional rail These are broadly in line
with official values at the time of pound264 per hour for car and pound370 for rail
Burge et al (2010) undertook an SP mode choice exercise to complement the long distance model
(LDM) estimated to NTS data The SP exercise covered car air existing rail and a new high speed rail
service with the travel attributes being in‐vehicle time cost access and egress time service
frequency rail interchange airport waiting time rail crowding and percentage of trips on time
The form of the cost parameter means that the value of time increases with cost and is largest for
those modes with the highest costs This restricts the usefulness of the value of time results since
the value of time increases as costs increase However the model finds little variation in the time
coefficients across air rail and car Access and egress has a 40 premium on rail and air time whilst
waiting at the airport is values slightly less than in‐vehicle time
Recent reworking of the Long Distance Model SP data (Bates 2012) obtained a mean value of time
for business travel of pound5676 per hour although with considerable variation around this depending
upon model specification The LDM itself provides a value for rail at its mean cost of pound5520 These
contrast with webTAG values of pound3412 for all users being 65 larger However a more appropriate
77
denominator is some kind of average of pound3374 for car drivers and pound4718 for rail If we take a simple
average given that air users will also have large values then we have a value of pound405 per hour The
estimated value is therefore 40 larger than labour cost The Bates (2012) reworking provides a
value for leisure travel of pound2130 per hour and access and egress multipliers in the range 12 to 14
Gonzaacutelez‐Savignat (2004a) offered SP exercises to current air users between Madrid and Barcelona
to examine the propensity to switch to a high speed rail option The value of time for business
travellers was 55euro per hour although the value of access time was somewhat less at 22euro per hour
with the value of leisure time not much less than the business value at 37euro per hour Our estimate
of the labour costs at the time is 10euro per hour but this is not specific to air travellers who may well
have higher incomes
In a related study (Gonzaacutelez‐Savignat 2004b) but instead focussing on car users between Madrid
and Barcelona and their propensity to switch to high speed rail business travellers were estimated
to have a value of time of 124euro per hour for short journeys (Madrid or Barcelona to Zaragoza) and
115euro per hour for the longer distance trips Relative to our estimate of 10euro per hour for gross labour
costs the values here seem reasonable
Wardman et al (1992) used an SP choice exercise to examine business travellersrsquo choices between
air and rail for journeys between Edinburgh and London The SP exercise specifically reinforced the
point that the respondent was to bear in mind company travel policy when answering the SP
questions What emerged was a value of time of pound30 per hour This is high even given that 80 of
the sample were current air users
The study speculated that because the fares offered were less than the current air fares which all
the air users were authorised to purchase then there is no constraint from company policy for at
least 80 of the sample It is then hardly surprising if the sensitivity to cost is low and the value of
time is high
A large scale SP survey was undertaken in Australia in 1987 that examined the potential for a very
fast train alongside air coach car and the current train service (Gunn et al 1992) Updated to 2010
prices and incomes the values of time obtained for car were AUD956 per hour and AUD444 per
hour for business and non‐business respectively The corresponding figures for air were AUD1050
per hour and AUD408 per hour The official value based on the gross wage rate is AUD422 per
hour These values clearly exceed the official values It is not beyond belief that values have been
influenced by strategic bias to the extent that travellers would like to influence policy regarding a
new high speed rail service
In a study of high speed rail between Sydney and Canberra the so‐called Speedrail project our
understanding is that the SP based values in 2010 prices and income were
Sydney‐Canberra market business AUD785 per hours
Sydney‐Canberra market non‐business AUD162 per hour
78
Intermediate markets business AUD31 per hour
Intermediate markets non‐business AUD175 per hour
What is interesting here is not only that there are differences in WTP values by flow but that the
relativities between business and leisure are far different at 48 for the Sydney to Canberra market
but only 18 for the intermediate markets The values for the Sydney to Canberra market somewhat
exceed the wage rate
Table A318 Summary of High Speed Rail Evidence
Study MPL OVTIVT Business Leisure
SP Instruction Comment
Bates (2012) 14 12‐14 266 Removes log cost of Burge et al (2010) and easier to interpret
SDG (2009) 08 06 08 07 06 07
088 amp 045 116 amp 059 097 amp 050 121 153 126
157 129 103 120 127 209
No specific Air and Rail Users Rail Air and Rail Users HSR Air and Rail Users Air Car Users Rail Car Users HSR Car Users Car Rail MPL value used for air
Gonzaacutelez‐Savignat (2004a)
50 04 149 Unknown Air Users Wage rate figure expected to be too low for air users
Gonzaacutelez‐Savignat (2004b)
12 11
‐ ‐
175 174
Unknown Short Long Car Users
Wardman et al (1992)
14 ‐ ‐ Consider company policy
Rail user official value used for MPL
Atkins (2002)
14 amp 101
12 amp 081 12 amp 081 14 amp 101
108 130 130 108
180 202 202 180
No specific Air Car Rail HSR
Wardman and Murphy (1999)
158 318
073 081
239 182
Consider company policy
Rail Users Air Users Official value for rail users
Halcrow Fox (1998)
145 na ‐ No specific Air users Rail user valuation used as base
Gunn et al (1992)
249 227
‐ ‐
‐ ‐
No specific Air Car
Speedrail 186 074
‐ ‐
48 18
Unknown Sydney‐Canberra Intermediate
Yao and Morikawa (2005)
239 231
077 080
279 269
Unknown Rail and Air Car and Bus Japanese evidence
Note 1 First figure is Car MPL denominator and second is rail MPL denominator This is the same as
Table 313 in the main report
79
Outwater et al (2010) examined demand for high speed rail in California offering an SP choice
exercise that covered car air and rail and another exercise dealing with access and egress mode
choice The business model reported also contains commuters but given the distances involved
there will be few of the latter The implied value of time in the main mode choice model was $6364
per hour nearly 3frac12 times larger than the $1845 per hour for recreation and other trips In the
access mode choice model the values were $48 and $15 per hour respectively a ratio only slightly
less than for main mode choice
Yao and Morikawa (2005) examined high speed rail in Japan Their mode choice model covered rail
air bus and car and was estimated jointly to RP and SP data The business model estimated to nearly
19000 observations recovered very similar values of time for rail and air and for car and bus of 1070
and 1033 yen per minute in 2000 prices Access time was valued slightly less at 826 yen per
minute In contrast the value for non‐business trips was 384 yen per minute across all modes
The evidence from this raft of high speed rail studies is that the values implied by the cost saving
approach are broadly supported It would be difficult to make a case in favour of the Hensher
approach with its typically lower values for rail on the basis of these findings Having said that the
sort of business travellers involved are likely to be more senior and to be travelling long distances
and these would tend to inflate the values although not necessarily their relationship to MPL The
large time savings on offer might also have a bearing but the studies provide little insight into how
the unit value of time varies with the size of the time saving
A35SpecificIssuesandInsights
In reviewing studies that have addressed the valuation of business travel time savings we can draw
out some common threads over and above the p q and r parameters and relationships between
different valuation methods covered in the previous sections Other more specific insights have
been provided by these studies whilst it is useful to draw somewhat disparate insights together to
inform our review
The specific issues we here examine are
Who pays for the time saving and who benefits
Self‐Employed and Employees
SP and company policy
Distance Effects
Crowding Comfort and Soft Factors
RP and SP
These issues are discussed in detail in section 314 of the main report
80
A36 Conclusions
The evidence we have reviewed does not tell an entirely consistent story On the one hand the
Hensher equation would imply in some cases and particularly for rail significant reductions on the
value of time of the traditional cost savings approach On the other hand the WTP evidence is more
in line with the values of the costs savings approach whilst multiplier evidence would indicate that
some premium should be attached to out‐of‐vehicle time and crowding
Section 3 of the main report draws together the evidence and hence we do not repeat it here In
section 315 it provides
A summary of the Hensher equation evidence
A summary of the WTP evidence
A summary of the insights evidence
A summary of the empirical support for and challenges to valuation methodologies
It also sets out
Recommendations for further Hensher equation research
Recommendations for further WTP research
Annex 3 References
Accent Marketing and Research Hague Consulting Group and Steer Davies Gleave (1989) InterCity
Business Travel Price Elasticity Research Prepared for InterCity Marketing Planning Manager British
Railways Board
Algers S Dillen JL and Widlert S (1995) The National Swedish Value of Time Study Proceedings
of Seminar F PTRC Summer Annual Meeting
Atkins (2002) High Speed Line Study Stated Preference and Revealed Preference Surveys Prepared
for Strategic Rail Authority
Bates J (2012) A Short Analysis of the Long Distance Modelrsquos Stated Preference Data 14th August
2012
Beca Carter Hollings and Ferner Steer Davies Gleave Forsyte Research and Brown Copeland and Co
(2002) Project Evaluation Benefit Parameter Values Prepared for Transfund New Zealand
Bradley M and Gunn HF (1991) Further Application and Validation of the Netherlands Value of
Travel Time Study
81
Burge P Rohr C and Kim CW (2010) Modelling Choices for Long Distance Travellers in the UK An
SP Analysis of Mode Choice Paper presented at European Transport Conference Glasgow
Fowkes AS Marks P and Nash CA (1986) The Value of Business Travel Time Savings Working
Paper 214 Institute for Transport Studies University of Leeds
Fowkes AS (2001) Principles of Valuing Business Travel Time Savings Working Paper 562 Institute
for Transport Studies University of Leeds
Gonzaacutelez‐Savignat M (2004a) Competition in Air Transport The Case of the High Speed Train
Journal of Transport Economics and Policy 38 (1) pp77‐108
Gonzaacutelez‐Savignat M (2004b) Will the High Speed Train Compete Against the Private Vehicle
Transport Reviews 24 (3) pp293‐316
Gunn HF Bradley MA and Hensher DA (1992) High Speed Rail Market Projection Survey
Design and Analysis Transportation 19 pp117‐139
Hague Consulting Group Accent Marketing and Research and Department of Environment Transport
and Regions (1999) The Value of Travel Time on UK Roads The Hague
Hague Consulting Group (1990a) The Netherlandsrsquo Value of Time Study Final Report Prepared for
Dienst Verkeerskunde Rijkswaterstaat
Hague Consulting Group (1990b) Further Analyses of the Netherlands Value of Time Study Public
Transport Survey Data Final Report to Ministerie Van Verkeer en Waterstaat
Hague Consulting Group (1998) Value of Dutch Travel Time Savings in 1997 Final Report to
Rijkswaterstaat ndash AVV
Halcrow Fox (1998) Project Isambard Demand and Revenue Study Final Report to British Airways
Hensher DA (1977) Value of Business Travel Time Pergamon Press
Hensher D A (2011) Valuation of Travel Time Savings in Handbook in Transport Economics ed
Andre de Palma Robin Lindsey Emile Quinet Roger Vickerman Edward Elgar Publisher London
United Kingdom pp 135‐59
Kato H Oda T and Sakashita A (2013) Valuation of Travel Time Saving with Revealed Preference
Data in Japan Further Analysis Paper to be presented at 13th WCTR Conference Rio de Janeiro
82
Kato H and Tanishita M (2013) A Meta‐Analysis of the Value of Travel Time Savings Evidence from
Japanese Passenger Travel Paper to be presented at Annual Transportation Research Board
Conference Washington
Mott MacDonald Hugh Gunn Associates TRI Napier University Accent and Mark Bradley Research
and Consulting (2009a) Productive Use of Rail Travel Time and the Valuation of Travel Time Savings
for Rail Business Travellers Final Report to the Department for Transport
Mott MacDonald Hugh Gunn Associates TRI Napier University Accent and Mark Bradley Research
and Consulting (2009b) Value of Working Time and Travel Time Savings Long Run Implications
Report Prepared for the Department for Transport
MVA Consultancy Institute for Transport Studies University of Leeds Transport Studies Unit
University of Oxford (1987) The Value of Travel Time Savings Policy Journals Newbury Berks
Outwater M Tierney K Bradley M Sall E Kuppam A and Modugula V (2010) California
Statewide Model for High Speed Rail Journal of Choice Modelling 3(1) pp58‐83
Ramjerdi F Rand L Saeligtermo IA and Saeliglensminde K (1997) The Norwegian Value of time Study
Part 1 TOslashI Report 379 Report to Ministry of Transport and Communications The Norwegian
Railways the Norwegian Public Road Administration and the Norwegian civil Aviation
Administration
Steer Davies Gleave (2009) New Line Programme Demand and Revenue Modelling Report Prepared
for Network Rail London
Wardman M Holden D and Fowkes AS (1992) An Analysis of the Mode Choice Behaviour of
Business Travellers between Edinburgh and London Technical Note 304 Institute for Transport
Studies University of Leeds
Wardman M Chintakayala P de Jong G and Ferrer D (2012) European Wide Meta‐Analysis of
Values of Travel Time Report to European Investment Bank
Wardman M and Whelan GA (2011) 20 Years of Rail Crowding Valuation Studies Evidence and
Lessons from British Experience Transport Reviews 31 (3) pp379‐398
Wardman M and Murphy P (1999) Eurostar Demand Forecasting Research Technical Note 425
Institute for Transport Studies University of Leeds
Yao E and Morikawa T (2005) A Study of an Integrated Intercity Travel Demand Model
Transportation Research Part A 39 pp 367‐381
83
ANNEX4 TRAVELTIMEUSEndashANEXAMINATIONOFEXISTINGEVIDENCE
A41Context
This is a contribution to the Institute for Transport Studies (University of Leeds) 2012 study for the
Department for Transport (DfT) entitled ldquoValuation of Travel Time Savings for Business Travellersrdquo It
is based on the assembly of a set of 66 potentially relevant articles and close review of around a
third of these The full bibliography is attached The purpose was to identify and examine existing
evidence on how people use and interpret their travel time particularly in the context of business
travel Views expressed in interpreting the evidence are those of the author
A42 Introduction
The orthodox wage‐rate approach in economic appraisal has at its heart a key assumption regarding
business travel time ldquoTime spent travelling during the working day is a cost to the employerrsquos
business It is assumed that savings in travel time convert non‐productive time to productive use and
that in a free labour market the value of an individualrsquos working time to the economy is reflected in
the wage rate paidrdquo (DfT 2012a) This has been a source of academic provocation which has
contributed to a growing number of pieces of work in both transport studies and mobilities research
in the social sciences concerned with peoplersquos use of and opinions regarding their travel time use
The implication of the assumption is that all business travel time is wasted time Academic studies
have set about gaining empirical insights into how travel time is used with in part an aim to refute
this implication Of course the appraisal of travel time focuses on travel time saved not upon travel
time used It has been argued that productive use of a proportion travel time does not necessarily
compromise the validity of the assumption above unless the saved time would otherwise have been
used productively within the journey
In 2005 a conceptual paper by Lyons and Urry was published which examined travel time use in the
information age and potential implications for economic appraisal This has become a point of
reference for many subsequent articles with over 170 citations ndash reflective of the scale of interest in
the topic of travel time use in recent years Empirical studies of travel time use employing a range of
methodologies can be found for the UK Netherlands Sweden Norway USA Japan and New
Zealand These have variously considered specific modes or journey purposes Some have involved
observational methodologies while others have employed self‐reporting There are in‐depth
qualitative studies which seek to elicit greater insight into the meaning of travel time use for
individuals There are few studies which specifically concern themselves with trying to examine
notions of productivity in relation to travel time use and those which touch upon this have not done
84
so in a way that would align with the parameters in the Hensher equation17 However there are also
insights in the literature concerning the changing nature of work in the knowledge economy which
raise if not answer some wider questions about how travel time and travel time savings are treated
in relation to ownership of time and productivity of time
A43 EmpiricalInsightsintoTravelTimeUse
It is important to stress that especially for information workers the forms of communication and
ways of equipping oneself and undertaking work are changing over time It is therefore important to
be aware that cross sectional empirical insights at a point in time may not hold true over time
Not all studies in the literature have sought to focus (solely) upon business travel or have
predominantly considered what have been referred to as lsquobriefcasersquo travellers It is appropriate to
summarise empirical insights according to mode of travel The literature has predominantly
concerned itself with public transport and rail in particular but t here are also some helpful studies
addressing car travel
Time Use During Rail Travel
On two occasions in 2004 and 2010 questions on travel time use have been included in the National
(Rail) Passengers Survey for Great Britain This survey instrument has the advantage that it captures
passengersrsquo views about the specific train journey they were on when receiving the questionnaire It
also has a limitation in terms of the scope of questions able to be asked ndash all being closed questions
with pre‐defined response options The questions have addressed (i) what rail passengers do with
their time on the train (ii) how worthwhile they consider this time to be (iii) how they equip
themselves for using their time and (iv) the extent to which they plan in advance how to use the
time on the train The response sample sizes for the 2004 and 2010 surveys were 26221 and 27556
respectively (however the comparative analysis between the two surveys (see below) used sample
sizes of 22866 and 19715 respectively)
Key findings for 2004 were as follows (Lyons et al 2007) 55 of business travellers spend some of
their time on the train workingstudying on their outbound journey (for 35 it is the activity they
spend most time on) the figures are 48 and 27 respectively for the return journey They are
more likely to be reading for leisure on the return journey Meanwhile 13 of commuters indicate
workingstudying as the activity they spend most time on (around 28 spend some time
workingstudying) Journey duration has an effect on what people do with their time with window
17 See Section 24 and Annex 1 for a fuller discussion of the Hensher equation He proposed a formula for
calculating the value of business travel time savings which attempts to account for the following the
proportion of travel time saved at the expense of work done while travelling (p) the productivity of work done
while travelling relative to at the workplace (q) and the proportion of travel time saved used for leisure (r)
85
gazingpeople watching showing a marked increase for journeys of less than 15 minutes in duration
Only 2 of respondents indicated spending most of their time being bored and 1 spent most of
their time being anxious Business travellersrsquo aligned as follows with one of these three statements
ldquoI made very worthwhile use of my time on this train todayrdquo ndash 27 ldquoI made some use of my time on
this train todayrdquo ndash 58 and ldquoMy time spent on this train today is wasted timerdquo ndash 13 (2 not
answered) While not specific to business travellers travellers overall reflected on the role of mobile
technologies in their travel time experience ldquo[o]ver a fifth of rail passengers to whom the question
applied considered having electronic devices with them made the time on the train a lot better
However nearly half of all passengers 46 considered electronic devices had not made the travel
time any betterrdquo There was a marked difference in opinion by respondent age with a declining
proportion indicating lsquoa lot betterrsquo with increasing age The results of this survey underlined the
heterogeneity of travel time use and experience with for example distinct differences in lsquotime
worthrsquo assessments for given types of main time use Unfortunately questions relating to the effect
of mobile technologies on travel time experience were not included in the 2010 survey The 2004
survey predates the launch in the UK of the first iPhone in 2007 the Kindle in 2009 and the iPad in
2010
In 2010 a core subset of questions on time use were repeated enabling what appears to be the first
case of longitudinal comparison of travel time use (Lyons et al forthcoming Susilo et al 2012) The
comparative analysis reveals a broad consistency overall over the six years in terms of the most
popular activities ndash reading for leisure window gazingpeople watching and workingstudying There
are two key findings in terms of change There has been an overall upward move in terms of
positively viewing time lsquoworthrsquo ldquoThere has been a 37 reduction over six years in the proportion of
business travellers indicating that their time on the train was wastedrdquo 34 of business travellers in
2010 considered they had made very worthwhile use of their time on the train compared to 28 in
2004 The other key change relates to the increasing availability and use of mobile technologies ndash
here applying to all passengers ldquoTaking netbooks and laptops together then the proportion of people
with such a device has increased by 77 in six years from 7 in 2004 to 13 in 2010 The proportion
of travellers who have and use a laptop computer has increased by 60 The proportion of people
with a mobile phone has only increased modestly over the six years However a much higher
proportion of those who have a phone with them are now using it [for any purpose] during the
journey ndash 54 compared to 36 for 2004 The proportion of people who have a music player and the
proportion who have one and use it have doubled in six yearsrdquo The National (Rail) Passengers
Survey between 2004 and 2010 also revealed an overall increase in the proportion of travellers who
were veryfairly satisfied with the punctualityreliability of their train and who rated the train very
good or good in terms of there being sufficient room for all the passengers to sitstand Perceptions
of level of service and the uptake of mobile technologies then have increased in tandem with an
overall increase in the sense of travel time being worthwhile Advance planning of how an individual
is going to use their time on the train seems significant ndash for all rail travellers individuals who have
planned a lot in advance are three times more likely to consider their time use very worthwhile
compared to those who have not planned at all and seven times less likely to consider their time has
been wasted
86
Drawing upon the question design used in the National (Rail) Passengers Survey in Great Britain
Gripsrud and Hjorthol (2012) examined responses from 1196 rail travellers in Norway in 2008 The
study revealed that ldquoa high proportion of ordinary commuters and business people work on board
while travelling by train ie 35 of commuters and 43 of business peoplerdquo It is found that 27 of
commuters responding to the survey indicate having travel time approved of as working hours by
their employer The figure is 53 for business travellers In this Norwegian study it was found that
ldquo[a]bout 40 of commuters and business travellers take a laptop on board the train and in total
25 use itrdquo These figures are considerably higher than those for the 2004 GB study though noting
above the changes in the GB context revealed by later 2010 data In the Norwegian study ldquo[m]ore
than half of all commuters and 41 of business travellers state that use of an electronic device
during the journey makes the trip more worthwhile than it would otherwise berdquo It was also found
that the majority stated ldquothat the use of ICT while travelling by train made the time pass more
quickly and about one third of the commuters and business travellers are claiming that they made
good use of the time on boardrdquo Only 10 of respondents in this survey indicated that their travel
time was wasted ndash lower than the findings for the GB study 4 years earlier
A study called lsquoSurvey on the Productive Use of Rail Travel‐time lsquo (SPURT) has examined productive
use of rail travel time for business travellers and the value of time savings The findings were first
made available as Fickling et al (2008) and subsequently as a published report (Mott MacDonald et
al 2009) The study undertook its own empirical work but first reviewed other key studies This
included work based on the National Rail Passengersrsquo Survey data from 2004 by TRi Napier for Virgin
Trains which applied an analytical technique to estimate activity durations It was found that ldquofor
journeys in the 1‐3 hour range 30 of the journey time (across all business travellers) was spent
working (43 for those business travellers who did some work)rdquo SPURT secured responses to a
questionnaire including a revealed preference section a stated intentions section a set of stated
preference games and some socio‐economic questions The survey found that ldquoaround 80 of the
business rail travellers reported undertaking work during their journey The longer the journey the
higher the percentage of travellers workingrdquo The study team in drawing comparison between the
2008 data and the 2004 data from the National Rail Passengersrsquo Survey found that ldquothe proportion
of business travellers who spend some time workingstudying as 52 in Autumn 2004 79 in Spring
2008 Whilst a like‐for‐like comparison of the percentage of time they spend workingstudying has
not yet been undertaken the two surveys yield estimates of 43 in 2004 (for 1h‐3h journeys) and
57 in 2008 again suggestive of a strong upward trendrdquo (Fickling et al 2008) The study also
examined crowding and found that while there was some impact on productivity even in crowded
conditions productivity could remain high The lsquoAverage [weighted] minutes change in the amount of
working time needed if the work was done at the officersquo was ‐1 when 25 of the seats on the train
were occupied compared to ‐56 when lsquo90 of seats occupied a few people standingrsquo (Fickling et al
2008) 87 of the journeys in the survey response sample were 45 minutes or longer in duration
40 were 90 minutes or longer (DfT 2009)
The most recent UK data in relation to rail travel comes from the April 2012 omnibus survey
commissioned by the DfT (DfT 2012b) This study estimated from its results that just over a quarter
of the public had used a long distance train service (a journey of over 50 miles) in the previous
87
twelve months Those respondents who had undertaken a long distance train journey were asked
for their last such journey to recall how they had spent their time It was found that ldquo[t]he most
popular ways that users had passed time on their last long distance train journey included reading
books magazines and newspapers (69 per cent) looking at the view (47 per cent) sending texts
making calls or sending emails for personal reasons (38 per cent) eating or drinking (38 per cent)
and using electronic devices to watch films listen to music play games or use the internet (37 per
cent) A majority (40 per cent) of users said they had spent most time readingrdquo 11 spent most time
doing work for their job (including work textcallsemails) ndash 20 spent some time doing this These
figures are comparable to (though slightly lower than) those from the 2004 and 2010 National Rail
Passenger Surveysrsquo results
Work by Russell et al in New Zealand employed a structured observation approach (812 passengers)
to examine what people do on trains and buses (Russell et al 2011) It was found that ldquonearly two
thirds of passengers observed spent some of their travel time looking ahead or out of the window
(653)rdquo This study also reflected on methodological issues and drew comparison with other studies
including an observational survey of 161 Bay Area Rapid Transport System users in San Francisco
(Timmermans and Van der Waerden 2008) and an observational survey of 84 train users in the
Tokyo Metropolitan Region (Ohmori and Harata 2008) The San Francisco study observed few
people doing more than one thing during their journey and with doing nothing being the case for
64 of observed travellers The study in Japan focused on a short distance train which departed
from Machida at 630am and arrived at Shinjuku at 704am It found sleeping to be the most
observed activity (67 of observed passengers) followed by 62 observed reading 17 were
observed doing nothing Authors for all three studies note limitations in the observation approach to
studying travel time use Russell et al caution against the assumption that just because someone
appears to be doing nothing they are in fact doing so suggesting that in fact they could be lsquodoing
somethingrsquo ndash ldquothinking planning remembering praying daydreamingrdquo
A further observational study has concerned London Underground users (Gamberini et al 2012) It
confined itself to the observation of seated passengers with 1722 passengers and 1965 occurrences
of coded activities observed The authors note official data which indicates the average time spent in
a single underground car to be 127 minutes 26 of observed activities concerned technology use
22 talking with other passengers and 18 reading a book or paper Men were statistically more
likely than women to be using at least one technology device As with the national rail insights where
journeys of less than 15 minutes have a stronger likelihood of lsquopassiversquo activities such as window
gazing being dominant passive activities are also common on the Underground when people are
travelling for only two stops However ldquo[f]or people leaving at the fourth fifth or sixth stop after
they got on the train passive occupations were not the most common activityrdquo The study also drew
attention to findings from a recent Which report revealing that ldquothe majority of mobile phone
owners would welcome mobile coverage as they travelled on the London Undergroundrdquo with
ldquoapproximately one third of respondents stat[ing] that they would use it to do work during their
tripsrdquo
88
Time Use by Car Drivers
By comparison to public transport fewer studies have examined travel time use by car drivers yet
this is important given the assumptions in the absence of data that such time use would be less
worthwhile or productive than that by train in particular because of the constraints to multitasking
of the driving task itself
Eric Laurier has been noted as one of the pioneers of in‐depth work into the use of the car as a
mobile office or place for activity (Laurier et al 2008) However the study that perhaps has most
salience for considering business travel time and value of time savings is one by Hislop (2012) He
undertook a survey of business travellers at a motorway service station (149 responses) and a set of
15 follow‐up interviews The survey evidence concerned individuals for whom journeys ldquowere
intrinsic to their work and involved travelling between diverse locations during the working dayrdquo
Nearly a third of respondents regularly (2‐3 times per week) used their car for work‐related purposes
and over half used their phone while driving either lsquoquite a lotrsquo or lsquoa great dealrsquo Hislop suggests that
drivers use their phones extensively whilst being aware of the distraction they cause because ldquothey
felt under pressure both to make use of their driving time productively and to deal with calls
regarded as urgent or necessaryrdquo He also found that ldquoa number of interviewees argued that driving
time could be used for thinking about workrdquo The study also explored driversrsquo use of service stations
finding that ldquobusiness travellers often utilized much of their time spent in their cars when parked to
communicate with remote people such as clients or colleaguesrdquo Car environments were seen as
ldquorelatively private spaces over which drivers had a reasonable level of controlrdquo At the same time lack
of space could inhibit ability to work prompting advice to car manufacturers about how design could
improve in terms of facilitating use of a vehicle as a working environment
A second study merits brief review for the principal reason of highlighting how change has occurred
over time in relation to mobile technologies and forms of communication A 1994 study looked at a
sample of 90 business people ldquostopping at roadside restaurants and service areasrdquo (Eost and Flyte
1998) Implicit in the reporting was that activities undertaken in the car were referring to those done
while the car was stationary and the principal focus was on paperwork as the medium The following
extracts from the paper itself reflect how 18 years ago mobile technologies were different in their
nature availability and use ldquoOf the 70 people who used a telephone to keep in touch the most
commonly used type of telephone was a fixed car telephone (39) with analogue cell telephones the
next largest category (28) Two of the case study respondents were expected by their company to
keep in touch using public telephones as were 18 of those in the interview surveyrdquo ldquoFifteen
interview survey respondents had a computer in their car [d]ata were usually sent to or from the
office only once a day or lessrdquo ldquoThe number of people using an in‐car computer was small although
it is likely to rise as more and more companies utilise computers in their business dealingsrdquo
ldquoCompared with office environments the use of computers for word processing in the mobile
environment was hardly ever mentionedrdquo
89
Time use by pedestrians
A study by Middleton (2009) provides a reminder that while receiving less attention in the literature
walking too can be a mode where travel time use has positive connotations for work productivity
The study examined walking in London using a mixed method approach including a postal survey
walking diaries and in‐depth interviews The author observes that ldquofor many residents walking is a
significant part of their day‐to‐day working life ndash they work whilst they walkrdquo To illustrate this
observation the following quote from a participant is offered
ldquoThe next few minutes are lost to me I must have walked past the theatre but didnt notice
as my brain has switched to thinking about brochure spreads and advertisements Its
amazing how I suddenly start conceiving ideas about work whilst walking along even without
realizing it Since I get paid to think I wonder if I should be paid for my walking But then
again I also get paid to be in by 9rdquo
Multi‐Modal Studies
Two studies examine travel time use across public and private transport modes Ettema et al (2010)
secured 662 responses to an activity‐travel‐communication diary in the Netherlands with the sample
skewed towards highly‐educated professionals It was found that ldquowith increasing travel time the
share of travellers not engaging in any activity during travel becomes smaller both for car and for
train For train the share working during the trip increases from 56 for trips under 30 minutes to
423 for trips longer than 90 minutesrdquo Further it was noted that ldquotravel mode is the major
predictor of working while travelling Working on the move hardly happens for car drivers and
passengers although it happens to some extent (49) on trips longer than 60 minutesrdquo
OrsquoFallon and Wallis (2012) have surveyed 512 Auckland and Wellington metropolitan area residents
in terms of ldquothe lsquoutilityrsquo of travel time when commuting to work on tertiary studyrdquo The study
explored peoplersquos estimated commute times against their stipulated ideal commute times ldquoThe
median existing or estimated commute time (EC) for all commuters was 20 minutes The median
ideal commute time (IC) of 10 minutes identified by our sample meant that 68 of respondents spent
more time commuting each day than they would have liked tordquo In relation to the statement lsquoI enjoy
the time I spend commuting to workrsquo 35 of those driving a car most frequently for commuting
strongly agreed or agreed the figures were 68 for walkcycle and 35 for public transport
Considering estimated commuting time to workstudy in relation to the statement the proportions
agreeing or strongly agreeing were as follows 0‐9 mins ndash 58 10‐19 mins ndash 47 20‐29 mins ndash 39
30‐39 mins ndash 32 40+ mins ndash 24 In other words lsquoenjoymentrsquo of the commute diminishes with
commute duration It was also found that those who enjoyed their jobs were more likely to enjoy
their commute The study found that ldquo[a]bout one‐fifth reported doing work or study activity
namely readingwritingtypingthinking while commuting One‐third (33) of commuters were
contented with their time spent commuting enjoying it and finding it a useful transition between
home and workrdquo
90
Understanding Business Travel Time
Gustavson (2012) undertook 12 semi‐structured interviews with travel managers in Sweden followed
by interviews with 22 employees in relation to their business travel (across modes ‐ it was noted that
lsquo[r]elatively few travellers in the study made business trips by carrsquo) He found that employers do not
tend to have explicit expectations about work during travel time ndash however expectations were
instead about ldquogetting onersquos work done in a satisfactory wayrdquo The study revealed that ldquoalthough
travellers often appreciate having good working conditions while travelling the first priority for many
frequent travellers is to minimize time spent away from home and family rather than to make
productive use of their travel timerdquo In this regard there were strategies to replace physical meetings
with virtual equivalents or to combine meetings associated with a given journey The author
identified four different attitudes to travel time and working time
1 Travel as any other working time ndash mobile workers whose work goes with them and is done
wherever they are including travelling
2 Travel on long distance journeys as a special kind of working time ndash ldquoan opportunity to perform
work tasks that demand undisturbed and uninterrupted time and are therefore difficult to do at
onersquos regular workplacerdquo
3 Travel as inappropriate for or a poor second for undertaking work ndash leading to no work being
done or done with limited efficiency
4 Travel as valuable lsquotime outrsquo ndash ldquotime that travellers use for relaxation and restorationrdquo
Holley et al (2008) provide an examination of time for work which is specifically oriented towards
questioning the wage‐rate approach in economic appraisal This is a theoretical paper informed by
UK empirical evidence from a national rail passenger survey and from an in‐depth case study of a
knowledge worker The paper in reflecting on current approaches to economic appraisal of
transport schemes notes a further assumption beyond those often recognised namely ldquothat it is
possible to clearly distinguish between what constitutes productive or unproductive use of time and
in turn assign corresponding economic valuesrdquo It points out that Taylorism and Fordism18 provide
the roots to the current economic appraisal approach ndash with the notion that business travel time is
lsquoemployer ownedrsquo time and leisure and commute travel time is lsquoownedrsquo by the individual The
authors argue that the knowledge economy has brought a ldquoreduced (and reducing) dominance of the
18 ldquoIn 1911 Taylor first published The Principles of Scientific Management (19111972) which introduced the
idea of breaking manual labour into its component parts (or motions) in order to remove those which were not
necessary and rearrange the remaining components so that they were conducted in a more efficient manner
and achieved greater productivity It also resulted in a complete removal of workersrsquo autonomy A similar
approach was taken by Henry Ford for car production lines a few years later A dominance of these work
practices would aid in the justification of transport appraisalrsquos approachrdquo (Holley et al 2008)
91
clock‐controlled industrialized time and a resurgence of the pre‐industrial task‐oriented concept of
timerdquo They go on to suggest that ldquoa strict adherence to the task‐oriented concept of time would
imply that the lsquoownershiprsquo of the time is determined by the activity consuming that time Time spent
conducting non‐work activities while travelling is not automatically a cost to the employer that needs
to be reducedrdquo Over and above adding evidence concerning productive use of travel time this paper
puts forward further challenges ldquoto the current understanding of business travel time informing UK
transport appraisalrdquo
1 Why does the purpose of a journey define what constitutes time use within it and related
saved time In a task‐oriented knowledge economy ownership of time is more sophisticated
than this
2 ldquothe possibility that business travel time serves a similar function to traditional work breaks ndash
providing anti‐activity time which can assist productivity at other time periods and assist
creativity by providing lsquoincubationrsquo timerdquo
A44 AConceptualisationofTravelTimeProductivity
Reference was made at the start of this review to a paper by Lyons and Urry (2005) The literature
above has tended to be lsquoin search of positive utility of travel timersquo Lyons and Urry recognised that
not all travel experience is positive and put forward a conceptualisation of travel time productivity
This postulates that across all travellers and journeys for a given mode a distribution of levels of
productivity of time use must exist and that these distributions would vary across modes To be of
practical value this would require calibration with empirical data Nonetheless the conceptualisation
(reproduced below) illustrates what might be seen as the full array of productivity consequences of
time invested in travel This extends beyond the two apparent bounds of lsquounproductiversquo and lsquorsquofullyrsquo
productiversquo to include lsquocounter‐productiversquo (ldquotime use that not only achieves no benefit in itself but
also has an adverse effect on time use beyond the journey (eg a stressful commute journey affects
an individualrsquos level of productivity once they reach work)rdquo) and lsquorsquoultrarsquo productiversquo (ldquothe use of time
on the journey has been more beneficial than had that time been used otherwise (eg getting more
work done because of the lack of interruptions which tend to disrupt thinking in the office)rdquo)
Figure reproduced from Lyons and Urry (2005) ndash ldquoillustrative frequency [f] distributions of
lsquoproductivityrsquo of travel time by moderdquo
A45 ReflectionsontheLiteratureExamined
A number of key summarising points can be made from this examination of available literature on
travel time use
1 Methodological approaches to gaining insights into travel time use are varied and studies often
appear to face significant constraints in terms of balancing breadth and depth of coverage
Observing or recording what people do with their time falls short of understanding why they use
the time in the way that they do and how this time use finds its place in their overall time use
2 The evidence as gathered is limited in terms of attempts to distinguish between different types
of business travel and is likely to have an implicit focus upon or leaning of emphasis towards
lsquobriefcase travellersrsquo It is important to recognise this potential lsquoevidence gaprsquo It should certainly
not be assumed in the absence of evidence that productive travel time use is less prevalent
within business travel beyond the bounds of briefcase travellers
3 There are clear modal differences in relation to productive use of travel time While the
assumption that rail holds more prospect than car for productivity is likely to be robust the car
environment nevertheless has prospect for worthwhile time use and indeed this may be
increasing over time
4 Attempts to judge any sense of relative productivity of time use between travel and non‐travel
are especially scarce in studies of time use which are often not principally concerned with
consequences for economic appraisal
5 However there are qualitative insights to suggest that the full span of the conceptualised
distributions depicted by Lyons and Urry (2005) occur in practice In other words for some the
92
93
6 There is recognition of the permeability between work and non‐work time or indeed the drift
towards unbounded work and non‐work time such that individuals are incorporating their travel
time use into a wider blend of daily time use that is geared towards meeting work social and
personal goals There is clear evidence for example that some people use some of their
commute time for work activity and some people use some of their work‐related travel time for
personal activities
7 Evidence for rail suggests that change over time is occurring in terms of ways of working and
communicating in the knowledge economy and a reducing distinction between the key facilities
for work in lsquothe officersquo or lsquoon the moversquo For both rail and car (and likely all modes) technologies
are evolving that appear to increase the versatility of and support of work and personal activities
that can be undertaken during travel Evidence is now available that highlights change over a six‐
year period With scheme appraisal potentially covering ten times longer into the future change
could be dramatic and unpredictable and not necessarily in one direction
8 Observation or self‐completion questionnaires are likely to massively over‐simplify how activities
relate to an individualrsquos overall productivity in their employment role To fulfil for example a
knowledge workerrsquo role is likely to involve a blend of reflecting thinking planning reading
writing typing talking and so on There is evidence to suggest that with suitable advance
planning individuals are able to align the travel environment and time with appropriate
elements of this blend to good effect
9 While there are clearly some journeys for which the experience for the traveller does not offer
much if any positive utility the evidence points towards an appreciable existence of positive
utility within travel across modes It is contestable whether notions of proportions of a journey
which are either productive or not productive are too reductionist added to then by notions of
determining the relative productivity of productive time on the move compared to that outside
of travel
10 It seems clear that there is significant heterogeneity of travel time experience and utility across
people modes and specific journey contexts In some respects this heterogeneity is
accommodated within the wage rate approach which has its focus upon the average or
aggregate picture However the evidence on travel time use in particular highlights how time
use varies with journey duration which in turn will have consequences for the (subjective) utility
the time is judged to offer This may be difficult to accommodate in any approach to economic
appraisal unless some forms of disaggregation of travel circumstances are introduced and
treated separately Such disaggregations may relate for example to journey duration
There is evidence then to suggest a strong presence of travel time use activities that derive personal
or work benefits The extent to which this positive utility prevails is likely to vary by context At the
94
same time there is some evidence to support the view that mobile technologies and changing ways
and norms of working are contributing to increasing the propensity for travel time to be used in
ways that derive benefit to the individual in either their work or personal lives The emerging
evidence also underlines the sophistication of how society and the individuals within it choreograph
activity participation in time and space Such sophistication may defy any attempt to adequately
reflect it through metrication and measurement as is implied by the thinking embodied within the
Hensher formula Productivity eludes being commoditised in blocks of time where it can be judged
for different spatial contexts as being lsquomorersquo or lsquolessrsquo productive Such a reductionist way of thinking
may well be perilous and far from lsquofuture proofrsquo as we move ever further from the FordistTaylorist
approaches to work
Annex 4 References
DfT (2009) Productive Use of Rail Travel Time and the Valuation of Travel Time Savings for Rail
Business Travellers ‐ Final Report
DfT (2012a) Values of Time and Vehicle Operating Costs TAG Unit 356 Department for Transport
August
DfT (2012b) Public attitudes towards train services results from the April 2012 Opinions Survey
Department for Transport
Eost C and Galer Flyte M (1998) An investigation into the use of the car as a mobile office Applied
Ergonomics 29(5) 383‐388
Fickling R H Gunn et al (2008) The productive use of rail travel time and value of travel time
saving for travellers in the course of work Proc European Transport Conference Association for
European Transport Leeuwenhorst Conference Centre The Netherlands
Gamberini L Spagnolli A Miotto A Ferrari E Corradi N and Furlan S (2012) Passengersrsquo
activities during short trips on the London Underground Transportation
Gripsrud M and Hjorthol R (2012) Working on the train from lsquodead timersquo to productive and vital
time Transportation 39 941ndash956
Gustafson P (2012) Travel time and working time What business travellers do when they travel
and why Time amp Society 21(2) 203ndash222
Hislop D (2012) Driving Communicating and Working Understanding the Work‐related
Communication Behaviours of Business Travellers on Work‐related Car Journeys Mobilities
Holley D Jain J and Lyons G (2008) Understanding Business Travel Time Use and its Place in the
Working Day Time amp Society 17 (1) 27‐46
95
Laurier E Lorimer H Brown B Jones O Johlin O Noble A Perry M Pica D Sormani P
Strebel I Swan L Taylor AS Watts L and Weilenmann A (2008) Driving and lsquoPassengeringrsquo
Notes on the Ordinary Organization of Car Travel Mobilities 31 1‐23
Lyons G and Urry J (2005) Travel time use in the information age Transportation Research 39(A)
257‐276
Lyons G Jain J and Holley D (2007) The use of travel time by rail passengers in Great Britain
Transportation Research 41(A) 107‐120
Lyons G Jain J Susilo Y and Atkins S (nd) Comparing rail passengers travel time use in Great
Britain between 2004 and 2010 Forthcoming in Mobilities
Middleton J (2009) `Stepping in time walking time and space in the city Environment and
Planning A 41 1943‐1961
Mott MacDonald Hugh Gunn Associates TRI Napier University Accent and Mark Bradley Research
and Consulting (2009) Productive Use of Rail Travel Time and the Valuation of Travel Time Savings
for Rail Business Travellers Final Report to the Department for Transport
OrsquoFallon C and Wallis I (2012) A wider look at how travellers value the quality and quantity of
travel time NZ Transport Agency research report 469
Ohmori N and N Harata (2008) How different are activities while commuting by train A case in
Tokyo Tijdschrift voor economische en sociale geografie Royal Dutch Geographical Society 99(5)
547‐561
Russell M R Price et al (2011) What do passengers do during travel time Structured
observations on buses and trains Journal of Public Transportation 14(3) 123‐146
Susilo Y Lyons G Jain J and Atkins S (2012) Rail Passengersrsquo Time Use and Utility Assessment
2010 findings from Great Britain with multivariate analysis Proc 91st Annual Meeting of the
Transportation Research Board Washington DC January And forthcoming in Transportation
Research Record
Timmermans H and Van der Waerden P (2008) Synchronicity of Activity Engagement and Travel in
Time and Space ‐ Descriptors and Correlates of Field Observations Transportation Research Record
Journal of the Transportation Research Board No 2054 Transportation Research Board of the
National Academies Washington DC 1ndash9
96
ANNEX5 LABOURMARKETCONDITIONSANDIMPLICATIONSFORTHEVALUATIONOFBUSINESSTRAVELTIMESAVINGS
A51 Introduction
A511 Objectives
This note forms an annex to the main report to the Department for Transport on the valuation of
travel time savings to business travellers The purpose of the annex is to review UK labour market
conditions and their implications on the valuation of the business value of time for use in cost
benefit analysis The issue of the use of time whilst travelling (ie the productivity of travel time) is
discussed in a different working report (Annexes 3 and 4)
Such a review is necessary as the different valuation methods cost saving method adjusted cost
saving method Hensher model etc (see Chapter 2 of main report for brief descriptions of the
different methods) require competitive labour and product markets to give robust valuations By
assuming a competitive labour market the marginal product of labour can be taken to be the
observed wage rate plus non‐wage costs Historically this has been taken to be quite a reasonable
assumption in developed economies For developing or emerging economies this condition has long
been recognised as being inappropriate If markets are not competitive either the wage plus non‐
wage costs may differ from the marginal product of labour or the resource value of labour released
into the labour market will not equal its marginal product
Given this transport appraisals in developing countries use shadow prices for labour when it is clear
that markets are not competitive (Howe 1976 Barrington 1977 Mackie Nellthorp and Laird 2005
TRN‐15) The assumption that markets approximate competitive conditions in developed countries
is now also challenged when compared to the situation forty or fifty years ago when the cost saving
method was introduced They are challenged on a number of fronts Firstly the Department for
Transport as part of its wider impacts guidance has acknowledged that the product market is
sufficiently different from competitive conditions to warrant including product market surpluses in
the cost benefit analysis (DfT 2012b) Secondly the recent economic downturn has once again put
the spotlight on high unemployment levels as being indicative of structural unemployment and a
market failure in the labour market Furthermore the concept of competitive labour market
conditions for all sections of the workforce is being challenged (Manning 2003) The question that
this annex therefore aims to address is whether it is necessary to adjust the market wage (ie
shadow price labour in some form) when estimating the business value of travel time savings
97
A512StructureofAnnex
For completeness of discussion we present in this report all relevant market failures that affect or
potentially can affect the labour market and discuss their implications for valuing business travel
time savings Following this short introductory section the second section discusses the implications
of labour taxes (ie income tax) whilst the third section discusses the implications of structural
unemployment Imperfect competition in the goods market and in the labour market are discussed
in sections four and five respectively whilst section 6 contains a discussion regarding the impact of
increased flexible working on whether time savings are transferred to additional work or leisure
The final section summarises the main points and identifies areas of further research the
implications of the different labour market conditions for the different valuation methods and the
implications for appraisal
A52 IncomeTax
Income taxes distort the labour market by driving a wedge between the wage faced by employers
and that received by employees This restricts employment to levels below that associated with fully
competitive conditions This distortion generates welfare benefits (equivalent to the increased tax
take) additional to user benefits when employment expands or wages increase (eg through
agglomeration impacts) (DfT 2005 Venables 2007 DfT 2012b) Departmental guidance recognises
these additional welfare benefits
From a business VTTS perspective income tax in an otherwise competitive economy does not
prevent the gross of tax wage equalling the marginal product of labour In a competitive economy
the presence of an income tax therefore means that the gross of tax wage can be used as a basis to
derive the marginal product of labour for workers
A53 StructuralUnemploymentExcessLabourSupply
If there is an excess supply of labour that is some form of market failure is preventing the wage rate
falling and the labour market clearing then the wage will not be a good reflection of the social value
of reducing employment or increasing employment (Boardman et al 2011 Chapter 4 Haveman and
Farrow 2011) This is important if valuing the business travel time savings using the cost saving
approach the Hensher model or variants of them This is because an implicit assumption of these
models is that labour if released into the labour market will be able to find work at their existing
marginal product ndash which if there is structural unemployment will not occur In such situations the
shadow price of labour could be used instead of the wage rate to reflect the social value of business
time savings
The shadow pricing of labour due to unemployment is well established aspect of cost benefit
analysis Certain texts on the matter suggests that when unemployment levels are below 5
98
frictional unemployment dominates and the opportunity cost of labour is the wage (see eg
Boardman et al 2011 pp105‐108) When it is higher than 5 the opportunity cost is less than the
wage and some form of shadow pricing is needed As can be seen from Table A51 unemployment
levels exceed 5 in 84 of local authorities in Great Britain and exceed 10 in 17 of local
authorities
Table A51 Unemployment Levels in GB (2011‐12) at a Local Authority Level
Local authorities in GB
Unemployment rate
Number Percentage
Unemployment greater than 10 69 17
Unemployment greater than 75 and up to or equal to 10 94 23
Unemployment greater than 5 and up to or equal to 75 178 44
Unemployment greater than 3 and up to or equal to 5 65 16
Unemployment greater than 0 and up to or equal to 3 0 0
Total 406 100
Source ONS annual population survey [Apr 2011-Mar 2012] accessed via wwwnomiswebcouk (Oct 5th 2012) Note Numbers and are for those aged 16 and over is a proportion of economically active Figures and percentages are modelled based
Obviously the rate of unemployment varies geographically but it also varies systematically in other
ways for example by gender age and skill level Additionally it will vary temporally as ideally the
rate of unemployment will return to pre‐2008 levels at some point in the future
To understand whether shadow pricing labour for unemployment is empirically relevant to the
valuation of business travel time savings we need a comparison between the skill levels of the
unemployed and business travellers This comparison needs to relate to the area in which the
business travellers originatereside The market wage would only be adjusted to a shadow price if
the unemployed and business travellers are substitutable For this study such information is not
available We would however conjecture that for modes of travel that cater for mobile high skilled
workers (eg rail travel) that the skills of the unemployed cannot be substituted for such workers
Adjusting the business value of time for modes such as rail is not therefore likely to be empirically
relevant In contrast where a reasonable percentage of business travel is be undertaken by low and
medium skilled workers (eg those in administration or construction sectors in an urban area) then
the skills of the unemployed and some lsquobusinessrsquo travellers might be considered substitutable
Further research however would be needed to confirm this conjecture
Shadow pricing labour for unemployment may have implications in other aspects of appraisal that
include a labour component These are as follows
99
Capital costs
Operating costs both of public transport services and cars (non‐fuel element)
Wider impacts (agglomeration and move to more productive jobs)
At this point in time it is unclear how empirically relevant to a cost benefit analysis shadow pricing
labour for unemployment would be nor how onerous the task would be to shadow price labour for
unemployment effects Further research on this topic is required before such conclusions can be
drawn
A54ImperfectlyCompetitiveMarkets
A541 ImperfectGoodsProductMarket
A competitive goodsproduct market is a necessary condition for the cost saving method for the
Hensher model and its variants There are two relevant goodsproduct market failures indirect
taxation and imperfect competition arising through for example product differentiation or
geographic monopolies Appraisal methods account for both of these market failures in that any
surpluses additional to user benefits are estimated in the cost benefit analysis (DfT 2011 2012b)
The average rate of indirect taxation in the economy is 190 (DfT 2012a) whilst marginal costs are
taken to be 20 lower than shop prices (DfT 2005 p49) The evidence reviewed by DfT (2005)
however shows that this lsquoaveragersquo mark‐up disguises tremendous variability by industry with a range
in the mark‐up from 0 to mark‐ups in excess of 40 in some sectors
There is also ample evidence at an international level that perfect competition does not prevail For
example for 10 EU countries Badinger (2007) estimates markup factors of price above marginal costs
of approximately 13 for manufacturing and construction and 137 for services for the late 1990s
Christopoulou and Vermeulen (2008) also find evidence that rejects the perfect competition
hypothesis with price‐marginal cost factors of 137 in 8 Euro area countries and 131 in the US They
also find that the price‐marginal cost margins are not uniform with significant variation by industry
and country lying behind these headline numbers
In both situations the market failure reduces output below that which would occur under
competitive conditions Employment levels are therefore lower in the presence of either indirect
taxes or imperfect competition than they would be under perfect competition Whilst the firm is a
wage taker (and the labour supply curve it faces is perfectly elastic) these market failures can
operate at an economy wide level As the labour supply curve for the economy as a whole is elastic
there then exists a gap between the wage and the marginal product of labour (with a competitive
labour market) This is because the firm equates the wage to the marginal revenue product of
labour Therefore with an imperfectly competitive goods market and a competitive labour market
the value of marginal product of labour is greater than the wage The situation of an imperfectly
competitive labour market is discussed below
100
‐unionised elements of the workforce
A542ImperfectLabourMarkets
Whilst the pervasive view is that labour markets in developed economies are competitive19 this
view faces a number of challenges (Manning 2011) One of the central criticisms is that the
competitive labour market model regards firms as wage takers where if the wage rate was lowered
by 1 penny the firm would lose all its employees This is clearly a simplification Other
characteristics of labour markets that can be taken to be symptomatic of the presence of
imperfections include firms attitudes to general training (ie transferable between firms) and
recruitment costs job search costs of employees as well as differences in pay and conditions
between public and private sector union and non
From the perspective of transport policy cost benefit analysis the issue is not what causes the
imperfections but whether any market imperfection leads to the wage departing from the marginal
product of labour This is because we are interested in whether the market wage needs to be
adjusted (ie shadow priced) in some way to reflect the actual marginal product
In an imperfectly competitive labour market rents are derived from the employment relationship
either by the employer or worker or both If an employer gets rents the marginal product is above
the wage whilst if a worker gets the rents then the wage is a good indicator of the marginal product
of labour Manning (2011) in reviewing the evidence on the size of such rents in the labour market
concludes that rents in the region of 15 to 30 are plausible There is however a lot of variation
and enormous uncertainty in these estimates The limited evidence that does exist suggests that
most of the rents are being accrued by workers ndash implying wages are close to marginal product
Evidence that imperfect competition exists in the labour market can also be found through a joint
transport sector labour market analysis With imperfect competition in the labour market
commuting costs will not be fully compensated if firms have more market power than workers
Manning (2003) shows that this is the case for the UK whilst Rouwendal and Van Ommeren (2007)
demonstrate that it is the case for the Netherlands Whilst these averages suggest that on the whole
labour markets are imperfectly competitive arguably the level of competitiveness will vary with
labour market segment Mobile workers typically high skilled and the primary wage earner in a
household arguably would face a competitive labour market as the household may move or migrate
in response to their work Workers in lower skilled occupations women ethnic minorities arguably
face restricted geographic search areas and high mobilitymigration costs (Madden 1981 1985 Zax
1991 Ihlanfeldt 1992 McQuaid Greig and Adams 2001) and therefore are more likely to face an
imperfectly competitive labour market Laird (2008) finds evidence for varying degrees of imperfect
competition by labour market segment Following the work of Manning and Rouwendal and Van
Ommeren in a Scottish context Laird finds that the level of compensation for commuting costs
19 A labour market can be competitive even when the product market is not competitive
101
varies by labour market segment urbanrural gender and skill level The implication is that the
market wage is likely to be a good estimate of the marginal product for lsquomobilersquo workers
A543Synthesis
The lack of evidence in this field makes it difficult to give recommendations on the size of any gap
between the wage and the marginal product of labour for business travellers On the basis of what
evidence there is it would seem that the wage is a reasonable approximation for the marginal
product of labour for business travellers despite the prevalence of market imperfections This is
because firstly a lot of business travel is conducted by lsquomobilersquo workers and secondly that what
evidence there is suggests the rents accrue to workers That is there is no need to shadow price
labour as a consequence of market imperfections ‐ further research however may be needed to
confirm this
A544FlexibleWorking
The cost saving approach was devised at a time when it could be argued there was a degree of
rigidity in the labour market So the distinction between employerrsquos business time and non‐working
time was relatively clear cut The modern service economy is no longer characterised by the
formalised work contract The lsquowhite collarrsquo and lsquopink collarrsquo worker now dominate the lsquoblue collarrsquo
worker in the workforce20 Simultaneously there has been an increase in a more flexible working
environment flexi‐time job‐sharing flexible working Sunday working has also increased
particularly in retail and entertainment This is relevant to the context of business travel time
savings because the value of business travel time savings will vary depending amongst other reasons
upon the contractual arrangements the worker has with the employer (primarily whether they work
paid or unpaid overtime) ndash see section 2 of the main report and Annex 1 for further discussion The
discussion contained in this section is complementary in many ways to that in Annex 4 on the use of
travel time
There has been notable shift to more flexible working over the years The number of hours worked
in a lifetime has decreased from 124000 in 1856 to 69000 in 1981 (Ausubel and Gruumlbler 1995)
Average weekly hours of a manual worker have fallen from 53 hours in 1943 to 435 in 1987 (ONS
2003) This trend has continued with average hours worked having fallen by 47 since 1991 (ONS
2011) The ONS attribute this latest decrease to a ldquomixture of structural changes in the economy
and more flexibility in the hours chosen by employees or offered by employers (including more part‐
time working)rdquo Part‐time working21 is obviously a key component of flexible working with part‐
20 White collar workers work in offices typically at a desk blue collar workers undertake manual work whether it is skilled or unskilled whilst pink collar workers undertake work that involves customer interaction (eg entertainment and sales) 21 There is no formal definition of part‐time working in the UK Workers are asked to categorise themselves as either part‐time or full‐time
102
time workers form 27 of the UK workforce (ONS 2011) The structural shift in the economy from
manufacturing to service sector is one of the key reasons that more flexible working arrangements
have been adopted The service sector currently comprises 80 of employment in Britain compared
to 68 in 1992 and in 2011 part‐time workers comprised 31 of the service sector workforce
compared to only 8 of the manufacturing workforce (ONS 2011) There is no reason to expect a
shift to more part‐time work to halt For example 49 of workers in the Netherlands are part‐time
(ONS 2011)
Flexible working extends beyond working part‐time In 2003 some 6 million workers22 (27 of
women and 18 of men) it is estimated had working patterns that differed from the standard
pattern (Hibbet and Meager 2004)23 Such variability arises from flexitime term‐time working
annualised hours job sharing nine‐day fortnights and zero hour contracts (see Table A52)
Furthermore as can be seen from this table in the three years analysed there was a continuing trend
towards increased variability in working patterns In addition to these types of working patterns
some 5 of the workforce also engage in telework24 (White et al 2007) These workers typically
are the higher income workers holding senior positions who use computers and telephones as part
of their daily jobs Such workers are typically judged on the outcomes they produce rather than the
hours of work they give to the firm The nature of teleworking also means that manual workers
(blue collar) and customer focused workers (pink collar) typically do not telework
Table A52 Variations in Working Patterns in Great Britain
Percent
Women Men
Working patterns
2000 2003 2000 2003
Flexitime 11 12 8 9
Term-time working 7 8 1 1
annualised hours 4 5 4 5
Job sharing 1 2 ~ ~
Nine day fortnight 1 1 2 2
Zero hours 1 1 1 1
None of the above 75 73 84 82
Source Hibbet and Meager (2003)
22 Both part‐time and full‐time 23 This includes part‐time and full‐time workers ndash though being part‐time itself does not constitute flexible working 24 Telework is a work arrangement in which employees do not commute to a central place of work
103
The move away from the formalised working week in todayrsquos economy is also evident by the
importance of weekend working (some 29 of workers usually work on Saturdays whilst 21
usually work on Sundays) and by the fact that 35 of the workforce sometimes work either paid or
unpaid overtime25
The evidence clearly points towards a very different labour market today than that of forty or fifty
years ago The structure of the economy has altered and with it the need for flexibility and
variability in working patterns The labour market however remains very heterogeneous Whilst
flexible working employees (ie those that work non‐standard work patterns and part‐time) are now
a very significant component of the workforce the majority of the workforce still do not have any
flexibility in their work and furthermore the majority of workers do not work overtime Some
groups of workers are judged on outputs whilst others remain contracted to provide hours of work
(albeit those hours may be subject to some form of flexible working) The latter distinction is what is
most relevant to the valuation of business travel time savings From a business value of travel time
savings perspective different employment models are relevant to different workers and therefore
business trips
(i) Workers with fixed hours contracts with paid overtime Here travelling time will displace
time at the workplace no matter what time the trip occurs
(ii) Workers with flexi‐time contracts with ability to re‐coup overtime through days off Again
travelling time will displace time at the workplace no matter what time the trip occurs
(iii) Workers with contracts with unpaid overtime and the self‐employed
a Travelling during normal work hours Here business travel would be expected to
displace work
b Travelling outside normal working hours Here travelling for business may displace
leisure time as well as work time Employee would require compensation through
the wage at a rate depending on how onerous the travelling is compared to leisure
A reduction in travelling time would lead in the long run to a reduction in the level
of wage compensation required
For workers with paid overtime or flexitime (ie (i) and (ii) above) business travel will only displace
work activities That is the r term in the Hensher formula will be zero or close to zero ndash though this
should be tested empirically For workers working unpaid overtime but who travel during normal
work hours (ie (iii)a above) business travel displaces work and leads to an increase in unpaid
overtime Travel time savings would therefore lead to a reduction in unpaid overtime For workers
who are not paid overtime and travel outside of normal working hours (ie (iii)b above) business
travel could displace both work and leisure time For these workers (iii)a and (iii)b the r term in the
25 Source Quarterly Labour Force Survey (April ndash June 2012) Accessed via the Economic and Social Data
Service Nesstar Catalogue (accessed October 12 2012)
104
Hensher model will be greater than zero Whilst undoubtedly these travellers comprise a minority of
the workforce they are likely to be very relevant for certain policy interventions ndash particularly long
distance rail interventions This is because rail travellers are typically high skilled workers who are
not paid overtime and the long distance element of the rail market can involve early departures and
late returns home
A55SynthesisandFurtherResearch
A551 LabourMarketConditions
Drawing this evidence together the following points emerge
Income tax does not prevent the marginal product of labour elsewhere in the economy equalling the
wage plus non‐wage income
Unemployment levels in the UK are currently at levels typically associated with structural
unemployment which some suggest may justify some form of shadow pricing of labour This has
implications to other aspects of cost benefit analysis (eg treatment of capital costs in particular)
and also conflicts with current Treasury guidance The shadow price of labour will also vary with the
rate of unemployment ndash ie it will vary regionally
How the wage differs from the marginal product of labour varies with the type of market failure
Goods and labour market imperfections would suggest the wage is lower than the marginal product
Contrastingly an excess supply of labour would suggest that the resource cost of labour is below the
wage
There is a lot of variability in the labour market Some aspects of the labour market will be
competitive whilst at the same time others will be experiencing imperfect competition If these
imperfections vary systematically with income then because mode choice also varies systematically
with income then any adjustments to the wage rate to reflect market imperfections may need to
also vary by mode
There is a growing body of evidence that both the goods and labour markets are imperfectly
competitive in developed economies like the UK The degree of imperfection in both the goods and
labour markets appears to be empirically relevant With respect to the goods market this is already
recognised in DfT guidance The difference between the wage and the marginal product due to
imperfectly competitive markets is a function of market power and information asymmetries We
would therefore expect it to vary systematically by industry and occupation Evidence to date
suggests that workers seem to on average be exacting the majority of the rents Therefore despite
the markets being imperfectly competitive on average the wage may not differ too significantly from
105
the marginal product of labour ndash though to a certain extent this is conjecture as the evidence base is
small
With the shift to a more service based economy flexible working in all its different forms is much
more prevalent today than say forty years ago ndash when transport cost benefit analysis methods were
developed However standard working patterns still dominant Those working overtime are in a
minority (although a sizeable minority) but because such workers may self select to certain modes
of transport (eg rail) an explicit treatment of them in deriving business values of time is likely to be
necessary
A552 ValuationMethods
Aside from a direct elicitation of willingness to pay through either revealed or stated preferences
the other valuation methods typically build up a composite value of time from different components
of work plus the value of transferring travel time to non‐work activities As the discussion in this
report has solely concerned the adjustment to the wage to reflect the social value of transferring
more time to work only those aspects of the Hensher model (and its variants) would need to be
adjusted
The willingness to pay (by employers) approach circumvents much of the discussion regarding
imperfect goods and labour markets as well as the discussion regarding the transfer of time savings
to either work or leisure activities
A553FurtherResearch
In the short term (elapsed time less than 6 months) research could be conducted to examine the
influence of shadow pricing labour for high unemployment on a cost benefit analysis This would
require analysis of regional labour markets and a view on the longevity of the high unemployment
levels we are currently seeing A view on whether all parts of the labour market should be shadow
priced needs to be made as well A case may exist for shadow pricing low incomes and altering
transport appraisal guidance to disaggregate by income rather than by mode A key issue to note is
that current Treasury guidance in the form of the Green Book does not permit the shadow pricing of
labour
Similarly in the short term (within 6 months) given differing working conditions we would expect
that some elements of the labour market will transfer time savings to lsquonon‐workrsquo activities and
others to increased work This heterogeneity in the labour market needs to be taken account of in
future surveysresearch as it appears to vary systematically with occupation which is correlated
with travel behaviour (eg mode choice) and incomewages Key questions that need to be
addressed in future work would include
106
Which sections of the labour market have flexibility to transfer travel time savings to leisure
What are their characteristics
How does the proportion of such travellers vary by mode long and short distance
urbaninter‐urban and time of day
Is there evidence that employers are willing to pay to save such employees travel time early
in the morning or late at night (either revealed preference or stated preference)
In the longer term (elapsed time 12 months plus) the Department could commission research to
better identify the gap between the wage and the marginal product of labour which would help
implement the cost saving and Hensher methods (and their variants) Most of the problems related
to the Henshercost‐savings method arise because worker wages and costs are used as a proxy for
the increased output obtained from marginal increases in available working time but wages deviate
from marginal product for all the reasons discussed
An alternative potential approach which circumvents many of these problems is to obtain estimates
of the productivity of work time directly using firm micro‐data with information on firm outputs and
labour inputs Better still is to link these data to worker level data with detail on worker
characteristics wages and hours Recent research in labour economics has developed methods for
working with this type of linked employer‐employee data (Abowd and Kramarz 1999) and a
growing body of literature provides empirical applications Detailed firmplant level data and
individual worker data that can merged together by workplace identifiers is increasingly available
and the Annual Respondents Database (ARD) firm data and Annual Survey of Hours and Earnings
provides the potential for this analysis for the UK
Although not without its problems both in terms of data set up and analysis direct measurement of
the marginal product of working hours from firm level data provides an alternative strategy which
could be used to provide a point of comparison with wage‐based estimates of the value of business
travel time savings The size of these datasets also allows scope for analysis by occupational
industrial and geographical groups to provide greater insights into the heterogeneity both in
marginal product of work time and on the deviation between marginal product and wages Some
papers have already looked explicitly at the correspondence between wages and the marginal
product of labour using these kinds of data both in the US (Hellerstein Neumark and Troske 1999)
and for Britain (Galindo‐Rueda and Haskel 2005 Haskel et al 2005) and provide potential prototypes
A554 ImplicationsforAppraisal
The implications of the observed heterogeneity in the labour market are reasonably large if they
need to be taken account of fully It is clear the value of travel time savings will vary by time of day
(ie whether it is within or without the core business day) and by occupation of business traveller
The latter variation will lead to variations in values by (mode) and also most likely by short and long
107
distance trips or correspondingly between urban and inter‐urban trips The former (variations by
mode) are already reflected in appraisal practise but the latter (variations by shortlong distance)
are not Similarly variations by whether the trip occurs within or outside core business hours is not
reflected in current guidance
Annex 5 References
Abowd J M and F Kramarz (1999) Chapter 40 The analysis of labor markets using matched
employer‐employee data In Orley C Ashenfelter and David Card Editor(s) Handbook of Labor
Economics Elsevier Volume 3 Part B Pages 2629‐2710
Ausubel JH and Gruumlbler A (1995) Working Less and Living Longer Long‐Term Trends in Working
Time and Time Budgets Technological Forecasting and Social Change 50 pp195‐213
Badinger H (2007) Has the EUs Single Market Programme Fostered Competition Testing for a
Decrease in Mark‐up Ratios in EU Industries Oxford Bulletin of Economics and Statistics 69(4)
pp497‐519
Barrington A (1977) Valuing Time Savings in Developing Countries ndash A Comment Journal of
Transport Economics and Policy 11(2) pp195‐201
Boardman AE DH Greenberg AR Vining and DL Weimer (2011) Cost‐Benefit Analysis Concepts
and Practice Fourth Edition Upper Saddle River New Jersey
Christopoulou R and P Vermeulen 2008 Markups in the Euro Area and the US Over the Period
1981‐2004 A Comparison of 50 Sectors ECB Working Paper No 856 Report dated January 2008
Coburn TM Beesley ME and Reynolds DJ (1960) The London‐Birmingham Motorway Road
Research Technical Paper 46 London HMSO
Department for Transport (2005) Transport Wider Economic Benefits and Impacts on GDP
Discussion Paper July 2005
Department for Transport (DfT) (2011) Transport User Benefit Calculation TAG Unit 353 London
Department for Transport Available online at lthttpwwwdftgovukwebtaggt (Accessed 23rd
August 2012)
Department for Transport (DfT) (2012a) Values of time and operating costs TAG Unit 356 August
2012 London Department for Transport Available online at lthttpwwwdftgovukwebtaggt
(Accessed 23rd August 2012)
108
Department for Transport (DfT) (2012b) The Wider Impacts Sub‐Objective TAG Unit 3514 Draft
May 2012 London Department for Transport Available online at
lthttpwwwdftgovukwebtaggt (Accessed 23rd August 2012)
Galindo‐Rueda F and J Haskel (2005) Skills Workforce Characteristics and Firm‐Level Productivity
Evidence from the Matched ABIEmployer Skills Survey IZA discussion paper 1542 IZA Bonn
Haskel J Hawkes D and Pereira S (2005) How much do skills raise productivity UK evidence
from matched plant worker and workforce data CEPPR discussion paper 5334
Hellerstein JK D Neumark and KRTroske (1999) Wages Productivity and Worker Characteristics
Evidence from Plant‐Level Production Functions and Wage Equations Journal of Labor Economics
17(3) 409‐446
Hibbett A and Meager N (2003) Key indicators of womenrsquos position in Britain In Office for
National Statistics (ed) Labour Market Trends October 2003 pp503‐511
Howe J (1976) Valuing time in developing countries Journal of Transport Economics and Policy
10(2) pp113‐125
Fowkes AS Marks P and Nash CA (1986) The value of business travel time savings Institute for
Transport Studies University of Leeds Working Paper 214
Ihlanfeldt KR (1992) Intraurban wage gradients evidence by race gender occupational class and
sector Journal of Urban Economics 32 pp70‐91
Mackie PJ Nellthorp J and Laird JJ (2005) Toolkit for the Economic Evaluation of Transport
Projects Washington DC World Bank Available online at
httpwebworldbankorgWBSITEEXTERNALTOPICSEXTTRANSPORTEXTROADSHIGHWAYS0con
tentMDK20464962~pagePK148956~piPK216618~theSitePK33866100html (accessed 26th
September 2012)
Mackie PJ Jara‐Diaz S and Fowkes AS (2001) The value of travel time savings in evaluation
Transportation Research Part E 37 pp91‐106
Mackie PJ Wardman M Fowkes AS Whelan GA Nellthorp J and Bates J (2003) Value of
Travel Time Savings in the UK A report to the Department for Transport Institute for Transport
Studies University of Leeds UK
Madden JF (1981) Why women work closer to home Urban Studies 18 pp181‐194
Madden JF (1985) Urban wage gradients empirical evidence Journal of Urban Economics 18 pp
291‐301
109
Manning A (2003) Monopsony in Motion Imperfect competition in labour markets Princeton NJ
Princeton University Press
Manning A (2011) Imperfect Competition in Labour Markets In (eds) Ashenfelter O and Card D
Handbook of Labor Economics volume 4 Chapter 11 pp976‐1041North‐Holland Amsterdam
McQuaid RW M Greig and J Adams (2001) Unemployed job seeker attitudes towards potential
travel‐to‐work times Growth and Change 32(3) pp355‐368
Office for National Statistics (ONS) (2011) Hours worked in the labour market ndash 2011 Report dated
8th December 2011
Rouwendal J and J Van Ommeren (2007) Recruitment in a Monopsonistic Labour Market Will
Travel Costs be reimbursed Tinbergen Institute Discussion Paper TI 2007‐0443 Report dated 23
April 2007 Amsterdam Tinbergen Institute Amsterdam
Venables AJ (2007) Evaluating Urban Transport Improvements CostndashBenefit Analysis in the
Presence of Agglomeration and Income Taxation Journal of Transport Economics and Policy 41(2)
pp173ndash188
White P Christodoulou G Mackett R Titheridge H Thoreau R and Polak J (2007) The Role of
Teleworking in Britain Its Implications for the Transport System and Economic Evaluation European
Transport Conference Noordwijkerhout 17‐19 October 2007 London AET Transport
Zax JS (1991) Compensation for commutes in labour and housing markets Journal of Urban
Economics 30 pp192‐207
- ANNEX 1 TECHNICAL ANNEX ON THE HENSHER EQUATION
-
- A11 Introduction
- A12 Previous Literature
- A13 Defining the Objective Problem Behind the Hensher Equation
- A14 Solving the Objective Problem
- A15 Revealed Properties of the Hensher Equation
- A16 Special Cases of the Hensher Equation
- A17 Synthesis and Conclusions
-
- ANNEX 2 CURRENT APPRAISAL PRACTICE
-
- A21 Objectives
- A22 Structure of this annex
- A23 Business Travel in Great Britain
- A24 Measuring the Value of Business Travel Time Savings
-
- A241 GB practice and the Cost Saving Method
- A242 Alternative Valuation Approaches
-
- A25 International Appraisal Practice
- A26 Implementing the Cost Saving Method in Great Britain
-
- A261 Deriving the Hourly Wage
- A262 Non-Wage Labour Costs
- A263 Professional Drivers
- A264 Long run marginal costs
-
- A27 Summary
-
- ANNEX 3 REVIEW OF EVIDENCE ON BUSINESS TRAVEL TIME SAVINGS
-
- A31 Introduction
-
- A311 Aims
- A312 Scope
- A313 Structure
-
- A32 Definitions
- A33 Review of National Value of Time and Other Significant Studies
- A34 Willingness to Pay Evidence
-
- A341 Review of European WTP Evidence
- A342 Recent Japanese Evidence
- A343 High Speed Rail Evidence
-
- A35 Specific Issues and Insights
- A36 Conclusions
-
- ANNEX 4 TRAVEL TIME USE ndash AN EXAMINATION OF EXISTING EVIDENCE
-
- A41 Context
- A42 Introduction
- A43 Empirical Insights into Travel Time Use
- A44 A Conceptualisation of Travel Time Productivity
- A45 Reflections on the Literature Examined
-
- ANNEX 5 LABOUR MARKET CONDITIONS AND IMPLICATIONS FOR THE VALUATION OF BUSINESS TRAVEL TIME SAVINGS
-
- A51 Introduction
-
- A511 Objectives
- A512 Structure of Annex
-
- A52 Income Tax
- A53 Structural Unemployment Excess Labour Supply
- A54 Imperfectly Competitive Markets
-
- A541 Imperfect GoodsProduct Market
- A542 Imperfect Labour Markets
- A543 Synthesis
- A544 Flexible Working
-
- A55 Synthesis and Further Research
-
- A551 Labour Market Conditions
- A552 Valuation Methods
- A553 Further Research
- A554 Implications for Appraisal
-

3
A342 Recent Japanese Evidence73
A343 High Speed Rail Evidence75
A35 Specific Issues and Insights 79
A36 Conclusions 80
ANNEX 4 TRAVEL TIME USE ndash AN EXAMINATION OF EXISTING EVIDENCE83
A41 Context 83
A42 Introduction 83
A43 Empirical Insights into Travel Time Use 84
A44 A Conceptualisation of Travel Time Productivity 91
A45 Reflections on the Literature Examined 92
ANNEX 5 LABOUR MARKET CONDITIONS AND IMPLICATIONS FOR THE VALUATION OF BUSINESS
TRAVEL TIME SAVINGS96
A51 Introduction 96
A511 Objectives 96
A512 Structure of Annex97
A52 Income Tax 97
A53 Structural Unemployment Excess Labour Supply 97
A54 Imperfectly Competitive Markets 99
A541 Imperfect GoodsProduct Market 99
A542 Imperfect Labour Markets100
A543 Synthesis 101
A544 Flexible Working 101
A55 Synthesis and Further Research 104
A551 Labour Market Conditions104
A552 Valuation Methods 105
A553 Further Research 105
A554 Implications for Appraisal106
4
Acknowledgements
We would very much like to recognise the valuable assistance and advice provided to us by Jake
Cartmell and Dan Thomas of the Department for Transport in conducting this research
Disclaimer
Although this report was commissioned by the Department for Transport (DfT) the findings and
recommendations are those of the authors and do not necessarily represent the views of the DfT
DfT does not guarantee the accuracy completeness or usefulness of that information and it cannot
accept liability for any loss or damages of any kind resulting from reliance on the information or
guidance this document contains
ANNEX1 TECHNICALANNEXONTHEHENSHEREQUATION
A11Introduction
According to conventional theory savings in business travel time may derive benefits to the
employer and employee in the following ways
From the point of view of the employer
a) The time saving may be used to undertake more productive work at home or at the normal
place of work
From the point of view of the employee
b) The time saving may be devoted to additional leisure time at home
c) The time saving may be devoted to additional work time at the regular place of work
d) The time saving may permit a later departure for the business trip or an earlier arrival
home possibly leading to reduced fatigue
A number of approaches have been adopted for the estimating the potential benefits listed above
the predominant ones being the so‐called lsquocost savingrsquo and lsquoHensherrsquo approaches The cost saving
approach focuses upon the benefit source a) above and is underpinned by the following five
assumptions (Mackie et al 2003)
i Competitive conditions in the goods and labour markets
ii No indivisibilities in the use of time for production
iii All released time goes into work not leisure
iv Travel time is 0 productive in terms of work
v The employeersquos disutility of travel during work time is equal to their disutility of working
If these assumptions hold then cost savings arise from the direct compensationreward to the
employee plus any additional costs of employing staff On this basis the cost saving approach is
often referred to as lsquowage plusrsquo and the value of business travel time savings (VBTT ) is
formalised
S
VBTTS w c (1)
where
w is the gross wage
is the non‐wage cost of employing labour c
5
In contrast to the cost saving approach the Hensher approach considers benefit sources a) to d) and
thus combines the perspectives of the employer and the employee Whereas Hensher (1977) was
responsible for the intuition behind the approach Fowkes et al (1986) were responsible for its
lsquocodificationrsquo as follows
1 1VBTTS r pq MPL MPF r VW rVL (2)
where
r is the proportion of travel time saved that is used for leisure
p is the proportion of travel time saved that is at the expense of work done while travelling
q is the relative productivity of work done while travelling relative to at the workplace
MPL is the marginal product of labour1
MPF is the extra output due to reduced (travel) fatigue
is the value to the employee of work time at the workplace relative to travel time VWVL is the value to the employee of leisure time relative to travel time
is the portion of VBTT that is associated with the employer S
is the portion of VBTT that is associated with the employee S
Whilst the Hensher equation has found conceptual appeal practical implementation of the
complete framework has proved difficult Consensus seems to be that the and VW terms
are especially difficult to estimate (see the discussion in Mackie et al (2003) for example) and it is
not unusual to drop these from consideration Various authors have asserted that VL is simply the
non‐work VT and can thus be populated using standard values Of particular relevance to the
current discussion is the situation where the Hensher and traditional cost‐saving approaches arrive
at the same estimate of according to Mackie et al this is where and
In a similar vein a number of studies have implemented restricted
versions of the Hensher approach A notable example is the AHCG (1994) study which assumed
and (ie work and leisure are valued equally) thereby deriving the
identity
MPF
TS
PF M
VP
VBTTS
VL
0r p 0VW M PL
0MPF VW
1VBTTS r pq MPL VP
(3)
The identity (3) has also been implemented in several subsequent studies such as Algers et al
(1995) and the most recent Dutch study (not yet releasedpublished) In the subsequent discussion
we shall question the validity of (3)
1 To be more precise this term should be interpreted as the marginal revenue product of labour
6
A12PreviousLiterature
Despite the attention that it has received it is notable that Hensher never offered a formal
derivation of (2) from first principles Furthermore Fowkes et alrsquos (1986) codification of the Hensher
equation entailed a formal statement of (2) rather than derivation from first principles Working
Paper 3 from the 1987 UK national non‐work VTTS study (MVA ITS amp TSU 1987) contributed a
different piece of the jigsaw by defining an economic problem apparently underpinning the Hensher
equation (p72) but did not proceed to solve the problem This gap in the literature motivated the
recent contributions of Karlstroumlm et al (2007) and Kato (2012) Karlstroumlm et alrsquos derivation claims to
lsquocome closersquo to deriving the Hensher equation whilst Kato claims to derive it exactly
Karlstroumlm et al (2007) generalised Hensher by distinguishing between short distance and long
distance trips the latter were defined as trips where it would not be feasible to return to the office
at the end of the day after completion of the business trip They further distinguished between
private and social valuations of travel time savings where social valuations account for the incidence
of tax Kato (2012) adopted Karlstroumlm et alrsquos definition of short and long distance trips but
proposed a different definition of the objective function as the conflation of welfare accruing to the
employee and employer By contrast Karlstroumlm et alrsquos objective function was defined in terms of
the employeersquos welfare only with the employerrsquos interests represented only as a constraint
Despite being the more faithful to (2) Kato derivation is complicated and involves several
superfluous terms (for example the contribution to the employeersquos utility from leisure travel is
irrelevant to the derivation of VBTT ) Moreover the key transition (from his equation (26) to
(27)) and the interpretation of the resulting terms that give rise to the Hensher equation are
(arguably) not as clear as they might be The contribution of the subsequent discussion will be to
draw upon both Karlstroumlm et al and Kato but present a simpler derivation of the Hensher equation
(2) from first principles This will serve to clarify the interpretation of the terms within (2) and
expose several assumptions and properties
S
A13 DefiningtheObjectiveProblemBehindtheHensherEquation
In what follows we shall outline an optimisation problem wherein
The problem is defined in terms of the joint interests of the employer and employee
More specifically the objective statement is one of maximising welfare where welfare is
additive in profit generated by the employer (converted into utility units) and the utility of
the employee subject to a time resource constraint
7
More formally
Max
st
1
w l ww
T T X t
w w l
W PX wT U
T T r t r T
(4)
where
1 1w wX X T r p q r p q t
w w l w wU U T r t T r t t
and
W is social welfare
is the marginal utility of income
P is the sales revenue per unit of goods produced
X is the quantity of goods produced
X is the production function of the produceremployer
w is the wage rate
wT is the quantity of lsquocontractedrsquo work time
U is the utility function of the employee
T is the total time devoted to lsquocontractedrsquo work leisure and business travel (ie 24 in any one day)
wt is the quantity of business travel time which could straddle lsquocontractedrsquo work and leisure time
lT is the quantity of leisure time given the work contract
is the marginal utility of time (and the Lagrange multiplier in (4))
r is the proportion of business travel time that takes place in leisure time this should be
distinguished from the term in (2) which relates to travel time saving specifically rp
p
is the proportion of business travel time that is productive this should be distinguished from the
term in (2) which relates to travel time saving specifically
q
8
It is important to understand the salient features of the objective problem as follows
With reference to the profit function we assume that revenue is generated through the
sale of goods and that costs are incurred through the employment of labour For simplicity
we further assume that the non‐wage costs of employing labour are zero (ie with reference
to (1) we assume that c 0 ) and omit explicit consideration of tax (ie implicitly we
assume that the taxation regime is neutral between employer and employee) Both issues
can be introduced into the analysis but with a modest increase in complexity
is as defined in (2)
With reference to the X function production depends solely upon the time contributed by
the labour input adjusted for the productivity of the time Productive time could
conceivably include not only lsquocontractedrsquo work time but also a proportion of leisure time
hence the notion of lsquoeffectiversquo work (and leisure) time
With reference to the U function utility depends solely upon the quantities of lsquoeffectiversquo
work time lsquoeffectiversquo leisure time and business travel time (but not the consumption of
goods see subsequent comment on page 6)
With reference to the constraint the time resource constraint is ostensibly the sum of
lsquocontractedrsquo work and leisure time but entails three key propositions concerning business
travel time namely that
Business travel time may straddle lsquocontractedrsquo work and leisure time (hence the
term and the notion of lsquoeffectiversquo work time)
r
Business travel time may ‐ to some extent ‐ be unproductive (hence the p and q
terms)
Although business travel time may straddle lsquocontractedrsquo work and leisure time p
and q remain constant This gives rise to the implicit assumption that the
productivity of business travel is constant irrespective of whether it is undertaken
during lsquocontractedrsquo work or leisure time For a practical illustration of the objective
problem (4) see Figures 1 and 2
In contrast to conventional work‐leisure optimisation problems such as Becker (1965) and
Oort (1969) it is notable that (2) omits a budget constraint This reflects the following
considerations
It is assumed that the employer and employee face a common marginal utility of
income
It is assumed that the labour costs incurred by the employer in the course of
production straightforwardly transfer to the wage‐related income of the employee
It is assumed that non‐wage income to the employee is zero
Since labour costs already feature in the objective statement and we have assumed
zero non‐wage income there is no need to also include a budget constraint2
2 In the vein of Karlstroumlm et al (2007) an alternative (but equivalent) way of specifying the problem (4) is to
include a budget constraint but represent the objective statement entirely in terms of the employee as
9
Note furthermore that wage‐related income refers to contracted work time wT only
in effect no wages are paid or received for business travel that takes place during
leisure time wr t In section 4 we will relax this assumption
Given these features it is important to consider what forms of employment are compatible with the
objective problem (2) Our conclusion consistent with both Kato (2010) and Batesrsquo (2013)
assessment of Karlstroumlm et al (2007) is that the Hensher equation is most applicable to the case of
self‐employment That is to say self‐employment would justify
The notion of a joint welfare function combining the perspectives of the employer and
employee (who in this case would be one‐and‐the‐same)
The proposition that labour costs (income) should be represented in either the objective
statement or the cost (budget) constraint but not both
The Hensher equation might also be appropriate for representing some forms of co‐operative or
barter economy but is less appropriate for economies that embody some degree of competitive
behaviour between employer and employee
10
Max
st
1
w l wX T T t
w
w w l
W U
PX wT
T T r t r T
1w w w lL U PX wT T T r t r T
(f1)
This problem yields exactly the same Lagrangian function as (4) specifically
(f2)
Figure 1 Schematic diagram illustrating the workings of the Hensher
Leisure time given work contract
Contracted work time
Business trav l time
600 2100 2400
Effective work tim
000
Effective work amp leisure
Contracted work amp leisure
900 1800
Business travel
SCHEDULING OF ACTIVITIES
Business travel time
Effective leisure time
Leisure time given work contract
24 HOUR TIME PROFILE
Effective leisure time
1200
Example
Consider an employee whose contracted work time is 9 hours per day which is usually scheduled between 900 and 1800 For expositional simplicity we shall assume that no lunch break is taken (but such breaks could be admitted without substantive complication) Given the work contract of 9 hours leisure time accounts
for the residual time of 15 (ie 24-9) hours per day
On a particular working day the employee is required to travel to London to meet a client In practice this entails a 3 hour journey at each end of the day giving total business travel time of 6 hours Once in London however the employee is expected to perform the normal contracted work time (eg heshe is expected to undertake
a full schedule of meetings thereby maximising the benefit of the journey) such that effective work time is 15 hours and effective leisure time is 9 hours
I Since business travel is in this case undertaken outside of contracted work time the proportion of business travel time that takes place in leisure time is 1 (ie r=1)
11
12
Example
Now suppose that travel time to London is reduced by 1 hour in each direction
In terms of the Hensher equation we are interested in the allocation of the 2 hour saving in total business travel time which could be
1) Retained for work at home or at the normal workplace such that effective work time is the same as Figure 1 (possibly to the benefit of the employee if working at home or the normal workplace is preferred to travel and possibly to the benefit of the employer if productivity is enhanced) This is the outcome shown in
Figure 2 above 2) Returned to leisure such that effective leisure time increases by 2 hours as compared with Figure 1 (again to the benefit of the employee but to the loss of
the employer as productive output is reduced) 3) Split between work and leisure such that the final outcome is intermediate between 1) and 2)
Figure 2 Schematic diagram illustrating the workings of the Hensher equation
Leisure time given work contract
Contracted work time
Business trav l time
700 2000 2400
Effective work tim
000
Effective work amp leisure
Contracted work amp leisure
900 1800
Leisure time given work con rac
Effective leisure time
24 HOUR TIME PROFILE
Effective leisure time
1200
Business travel
SCHEDULING OF ACTIVITIES
Business tra el me
600 2100
A14 SolvingtheObjectiveProblem
Having outlined the objective problem of interest we will now proceed to solve it In solving (4) it is
appropriate to first solve for lsquocontractedrsquo work time since this will determine the productive
capacity of the firm as well as the leisure time available to the employee
wT
w w w
W X UP
T T Tw (5)
In practice will be determined by the employeersquos supply of hours (and thus the interaction
between work leisure and consumption) and the employerrsquos demand for hours (and thus the firmrsquos
planning decisions regarding the volume of production) as follows
wT
1
l l
W Ur
T T (6)
WP
X
(7)
The final first order condition relates to travel time specifically
w w w w w
W X U U UP
t t t t t r (8)
In principle the value of business travel time (VB ) is given by TT
w
WVBTT
t
(9)
As we shall demonstrate the Hensher equation arises from a distinct focus on the value of
transferring business travel time (which may be less than fully productive and potentially
overlaps into leisure time ie ) into lsquocontractedrsquo (and fully productive) work time Drawing
upon (5) and (8) in particular we can derive the Hensher equation as follows
wt
wr t wT
13
1
1
1
1
w w
w w
w w w
w
W WVBTTS
T t
XP w
T t
U
T t t
U
t
r
U
(10)
This derivation of VBTTS clarifies the interpretation of some of the terms in (2) which might be
re‐labelled as follows
1
1 1
1
1
w
w w
MPL
w w
VW VL
w w
Vot
w
VoT
W WVBTTS
T t
XP w
T t
U
T t t
U
t
r
w
U
VL is the value of lsquoeffectiversquo leisure time to the employee
w is the value of business travel time to the employee (this replaces the MPF term in (2) Vot
again we shall explain this subsequently)
VoT is the value of time as a resource
(11)
where
MPL is the marginal product of labour3
VW is the value of lsquoeffectiversquo work time to the employee (we shall explain the terminology used in
subsequent discussion)
3 In common with footnote 1 this term should more precisely be interpreted as the marginal revenue
product but we have used the notation MPL in order maintain consistency with (2)
14
Continuing with our derivation
1 1 1
11
1
1
w
XVBTTS P r p q r p q w
U Ur r
U
t
r
(12)
If as is commonly assumed MP then we can achieve further simplification L w
1
11
1
1
w
XVBTTS P p q r
U Ur r
U
t
r
(13)
where we would expect a priori 0U U and 0wU t
In this way we derive the identity (13) which basically reproduces (2) but calls for us to reinterpret
some of the terms of (2) as follows
With regards to work time we should distinguish between the value of lsquocontractedrsquo work
time wU T ) to the employee and the value of lsquoeffectiversquo work time U to
the employee where the latter includes business travel undertaken during leisure time (eg
Figure 1 entails lsquocontractedrsquo work time of 9 hours per day plus 6 hours of business travel
time) Given this distinction two clarifications are appropriate First the VW term in (2)
which Fowkes et al (1986) interpreted as lsquothe value to the employee of work time at the
workplace relative to travel timersquo is better interpreted as the value of lsquoeffectiversquo work time
Second the factor 1 r represents the proportion of business travel time that falls
within lsquocontractedrsquo work time Moreover the term 1VW r as a whole represents the
value to the employee of transferring business travel time to lsquocontractedrsquo work time (eg
outcome 1 in Figure 2)
15
With regards to leisure time and in a similar vein to the discussion above the VL term in
(2) is better interpreted as the value of lsquoeffectiversquo leisure time to the employee and not lsquothe
value to the employee of leisure time relative to travel timersquo (Fowkes et al 1986) The factor r represents the proportion of business travel time that given the work contract falls
within leisure time Moreover the term VL r as a whole represents the value to the
employee of transferring business travel time to leisure time (eg outcome 2 in Figure 2)
1VW r VL r
More importantly ‐ aside from the above clarifications ‐ Fowkes et al correctly interpreted
as the value of business travel time savings to the employee
accounting for the possibility that such savings could be allocated to work or leisure
Comparing against (2) (13) includes an additional term namely VoT The role of the VoT
term is to represent the benefit of relaxing the time constraint as travel time is saved
thereby permitting reassignment between work and leisure The omission of the VoT term
from (2) might thus give the impression that no account has been taken of the time
constraint However this would be to overlook the role of the r term in (2) as distinct from r in (13) which represents the proportion of travel time saved that is used for leisure That
is to say the VoT and r terms represent similar effects We shall discuss the VoT term
more fully in section 6 of this annex
Since (2) effectively represents the employer and employee as one‐and‐the‐same the
MPF term in (2) can be attributed to either party On this basis ‐ but in contrast to Fowkes
et al ‐ we reinterpret this term as the value of business travel time to the employee wVot
(arguably this is the more natural interpretation) Since we would expect 0w it
should be the case that wMP
U t
F Vot
A15RevealedPropertiesoftheHensherEquation
The above analysis has revealed a number of properties arising from (4) which can now be
summarised
The Hensher equation is no different to the cost saving method in assuming that the
marginal product of labour is equal to the wage rate ie MPL w
In perfect equilibrium we would expect the marginal value of lsquocontractedrsquo work and leisure
time to be equal to the wage rate ie w lU T U T w but if 0r this
precludes the possibility that VW VL Thus by assuming the latter AHCG (1994)
effectively imposed a position of labour market disequilibrium
16
As noted in section 3 above the Hensher equation implicitly assumes that business travel
which takes place during leisure time is equally as productive as business travel that takes
place during work time If business travel during leisure is in practice less productive then
VBTTS will be understated (ie (13) will understate the benefits of transferring
unproductive travel time to leisure) Taking the extreme case where business travel during
leisure time is entirely unproductive (13) becomes
1
11
1
1
w
XVBTTS P p q r r p q
U Ur r
U
t
r
(14)
The reality will perhaps fall somewhere between (13) and (14)
It has already been noted that the Hensher equation implies that no wages are paid or received for
business travel that takes place during leisure time If instead all lsquoeffectiversquo work time were
fully remunerated then VBTT should be revised upwards as follows
wr t
S
1
11
1
1
w
XVBTTS P p q
U Ur r
U
t
r
(15)
Last but not least a more fundamental issue is the nature of the production function since the
Hensher equation assumes that labour is the sole input to production and that (apart from
productivity issues) this input plays the same function whether at the regular place of work or
travelling If in practice the productive contribution of business travel is not simply one of labour
input but a broader one of generating andor facilitating production (eg by visiting clients or
suppliers) then there is a case for adjusting (13) along the lines
17
1
11
1
1
w
w
X XVBTTS P p q r
f t
U Ur r
U
t
r
(16)
where wX f t is the marginal product of business trips and wf t is some function to be
estimated That is to say savings in business travel time would allow more (or longer) business trips
to be carried out or allow more meetings to be conducted on a given business trip thereby realising
a potential benefit Indeed Kato (2010) formalises this proposition by specifying two productive
functions within the objective problem one where business travel has a negative impact on
productive output (in the spirit of the Hensher equation) and a second where business travel has a
positive impact on productive output
A16 SpecialCasesoftheHensherEquation
Having derived the Hensher equation from first principles let us now consider some special cases of
the equation We shall begin by considering the same four cases derived by Bates (2007) before
considering other cases
Case 1 Productive travel time is saved and transferred to productive time in the workplace
This case simply amounts to imposing 0r and 1p on (12) as follows
2
1
1
1
w
XVBTTS P q w
U
U
t
r
(17)
If we further assume MP then (17) simplifies to L w
18
1
1
1
1
w
XVBTTS P q
U
U
t
r
(18)
The above result replicates Batesrsquo result for Case 1 with the exception that (18) includes the VoT
term ‐ namely the resource value of time ‐ whilst Batesrsquo result omits this term from consideration
The same qualification applies to Case 2‐4 which follow We shall consider the resource value of time
in more detail in Case 6
Case 2 Unproductive travel time is saved and transferred to productive time in the workplace
This case simply amounts to imposing 0r and 0p on (12) thus
2
1
1
1
w
XVBTTS P w
U
U
t
r
(19)
If we further assume MP then (19) simplifies to L w
1
1
1
w
XVBTTS P
U
U
t
r
(20)
19
Case 3 Productive travel time is saved and transferred to leisure time
This case simply amounts to imposing 1r and 1p (and again MPL w ) on (12) and yields
the following
1
1
w
XVBTTS P q
U
U
t
(21)
Case 4 Unproductive travel time is saved and transferred to leisure time
This case simply amounts to assuming 1r and 0p (and MPL w ) on (12) and yields
1
1
w
UVBTTS
U
t
(22)
Case 5 Cost saving approach
Further to the comment in section 1 if we assume r 0 p 0 U 0 and U tw 0
(ie all business travel takes place during work time and is non‐productive and the marginal
valuations of both work time and business travel time are zero) and also assume MPL w then ‐
aside from the VoT term ‐ (12) collapses to the lsquocost savingrsquo approach
X
VBTTS P
(23)
Reflecting further however the five assumptions underpinning the cost saving approach detailed in
section 1 (notably competitive conditions and no indivisibilities) effectively render the time resource
constraint (and term) redundant Thus if these assumptions hold (23) will in practice be
equivalent to (1)
VoT
20
Case 6 Accounting for the resource value of time
In contrast to Case 5 the VoT term plays a substantive role in Cases 1 and 2 We shall therefore
complete our analysis by considering the term in more detail Employing (5) and (6) we can
derive the identity
VoT
w ww
X UP w
T TW T
W X P
(24)
Simplifying and rearranging
w w
w
UTX W
P wT W
T
X P (25)
Assuming MP (25) further simplifies to L w
ww
UW T
T
(26)
Finally if we substitute for in (12) then VBTTS can be re‐stated equivalently
1
11
1
1
w
ww
XVBTTS P p q r
U Ur r
U
t
UW T
Tr
(27)
Rationalising (26) intuition suggests that the value of lsquocontractedrsquo work time to society must be at
least as great as the value of lsquocontractedrsquo work time to the employee work would not otherwise
take place This implies that U T w w W T 0 In Cases 1 and 2 therefore the
VoT term potentially offers a positive contribution to VBTTS
21
A17 SynthesisandConclusions
Following a brief review of methods for estimating we have devoted particular attention
to the Hensher equation not least because it offers a general theoretical framework from which
most of the competing methods can be derived or conceptualised In particular we derived the
Hensher equation (2) from first principles considered various special cases of the equation and
reconciled these special cases with similar work by Bates (2007) This exercise has given us
reassurance that the Hensher equation can be rationalised in terms of the microeconomic theory of
consumption and production but has exposed a series of assumptions and properties the
appropriateness of which might be debated namely
VBTTS
i Production is assumed to be a function of a single input ‐ labour ‐ which could include not
only lsquocontractedrsquo work time but also a proportion of leisure time
ii The marginal product of labour is assumed to be equal to the wage rate but the employer
does not pay for business travel time that takes place during leisure time (ie nil overtime
payments are assumed)
iii Business travel time that takes place during leisure time is assumed to be equally as
productive as business travel time during lsquocontractedrsquo work time
iv Utility to the employee is assumed to be a function of lsquoeffectiversquo work and leisure time and
business travel time The MPF term in (2) can be otherwise interpreted as the value of
business travel time to the employee wVot in (13) That is to say it makes little practical
difference whether the (negative) utility of travel per se is a burden to the employer or
employee
v The VoT term in (13) is omitted from (2) but is instead proxied by the r term (as distinct
from r )
vi The Hensher equation takes no account of the potential for business travel to have a
broader function of generating and facilitating economic activity
Moreover it is important to consider what forms of employment are compatible with the notion of a
joint welfare function for the employer and employee and the proposition that labour costs
(income) should be represented in either the objective statement or the costs (budget) constraint
but not both Our conclusion is that the Hensher equation is most applicable to self‐employment or
economies that operate on a co‐operative basis
In principle the above assumptions and properties can be relaxed but this may have implications
for estimates of Table A11 illustrates this by comparing a lsquobasersquo specification of the
Hensher equation with five variants specifically
VBTTS
Model 1 this is taken to be the lsquobasersquo and restricts (13) to the case where the employeersquos
value of business travel time is zero and the time resource constraint is not binding ie we
assume 0wVot (or 0 ) and 0VoTMPF
22
Model 2 we adjust Model 1 such that business travel during leisure time is zero‐productive
ie we assume 0q during leisure This has the effect of increasing VBTTS relative to
the base but typically not to the extent that it will exceed w
Model 3 we adjust Model 1 such that overtime is paid ie we assume that labour costs
equal VBTTS increases relative to the base but typically will be less than
w
w ww T r t
Model 4 Model 1 is adjusted such that the value of business travel time savings to the
employee is admitted ie we assume 0wVot (or 0MPF ) VBTTS increases relative
to the base and could in some circumstances exceed w
Model 5 we adjust Model 1 such that the value of time as a resource is admitted ie we
assume 0VoT VBTTS increases relative to the base but typically will be less than w
Model 6 this is as Model 1 but admits the possibility that business trips have a productive
benefit beyond the basic labour input ie we assume 0wX f t Again VBTTS
increases relative to the base and could possibly exceed w
Although Models 2‐6 outline cases where VBTT increases relative to Model 1 it is important to
note that Models 2 3 and 5 would still be expect
Sed to yield a VBTT less than the wage rate By
contrast Models 4 and 6 could in some circumstances yield a VBTT above the wage rate
SS
23
Table A11 Variants of the Hensher equation and impacts on VBTTS
Model Description Formula for VBTTS VBTTS relative to Base
1 Assume
MPF
Votw
0 ) and
0 (equivalent
VoT 0
to VBTTS1 P
X1
p q r 1
U1
r U
r
Base VBTTS 1
2 Assume
p q 0
zero productivity
) during leisure time
(ie VBTTS2 P
X1
p q r r p q 1
U1
r U
r
VBTTS VBTTS1 2
typically less than w
but
3
Assume overtime
costs equal w Tw
is paid
r tw
ie wage VBTTS3 P
X1
p q 1
U1
r U
r
VBTTS VBTTS1 3
typically less than w
but
4 Assume Vot 0 (or MPF 0 ) w
implying that travel has a fatigue effect on the employee
VBTTS4 PX
1
p q r 1
U1
r U
r
U
VBTTS VBTTS 4 1
and possibly greater than w tw
5 Assume VoT 0 implying that time
savings allow reassignment of work and leisure time
VBTTS5 PX
1
p q r 1
U1
r U
r 1
r VBTTS VBTTS1 5
typically less than w
but
6 Assume business trips
business ie X f t w generate
0 VBTTS6 P
X1
p q r X
f tw
1
U1
r U
r
VBTTS VBTTS1 6
possibly greater than w
and
24
25
Annex 1 References
Accent amp Hague Consulting Group (AHCG) (1999) The Value of Travel Time on UK Roads Prepared
for Department for Transport
Bates J (2007) Business value of time and crowding ndash some thoughts Private communication
Bates J (2013) Assessment of lsquoTechnical Annex on the Hensher Equationrsquo Private communication
Becker GS (1965) lsquoA theory of the allocation of timersquo The Economic Journal 75 pp493‐517
DeSerpa A (1971) lsquoA theory of the economics of timersquo The Economic Journal 81 pp828‐846
Forsyth PJ (1980) The value of time in an economy with taxation Journal of Transport Economics
and Policy Vol XIV pp337‐361
Fowkes T (2001) Principles of valuing business travel time savings Institute for Transport Studies
University of Leeds Working Paper 562
Fowkes AS Marks P amp Nash CA (1986) The value of business travel time savings Institute for
Transport Studies University of Leeds Working Paper 214
Hensher DA (1977) Value of Business Travel Time Pergamon Press Oxford
Karlstroumlm A Eliasson J amp Levander A (2007) On the theoretical valuation of marginal business
travel time savings European Transport Conference
Kato H (2012) On the value of business travel time savings derivation of Hensherrsquos formula
Working paper
Mackie P Wardman M Fowkes AS Whelan G Nellthorp J amp Bates JJ (2003) Values of travel
time savings in the UK Report to Department of Transport Institute for Transport Studies
University of Leeds amp John Bates Services Leeds and Abingdon
MVA ITS amp TSU (1987) Working Paper 3 Theoretical considerations Report to the APM Division
Department of Transport
Oort O (1969) The evaluation of travelling time Journal of Transport Economics and Policy 3
pp279‐286
26
ANNEX2 CURRENTAPPRAISALPRACTICE
A21 Objectives
This note forms an annex to the main report to the Department for Transport on the valuation of
travel time savings to business travellers The purpose of this annex is to
Give some context to the current practice of valuing business travel time savings in the UK
Review international practices on valuing business travel time savings
Review the sources of wage data working hours etc the Department uses for the
calculation of business travel time savings
A22 Structureofthisannex
Following this short introductory section the second section of this annex gives some context to
business travel in GB in terms of its economic importance how these trips are made (timing and
mode) and who makes them (occupations and industries) The third section summarises the
approach used in Britain to value business travel time savings and briefly introduces alternative
approaches In the fourth section practice across Europe and other countries with developed
appraisal systems is compared whilst in the fifth section the methodology and data used to
implement the cost saving method to valuing business travel time savings in GB is critically reviewed
The final section presents a brief summary of the main points contained within this annex
A23 BusinessTravelinGreatBritain
For infrastructure projects with the objective of improving accessibility business travel time savings
are important ‐ travel time savings typically comprise the majority of the direct benefits of such
projects As business trips are valued on average at more than 4 times non‐working time savings
(DfT 2012a) the value of business time savings is critical to the economic appraisal of such projects
For example time savings form half of all user benefits for the proposed London to West Midlands
high speed rail line and business time savings are almost three times those for non‐work time
savings (DfT 2012b Table 10 p42)
Despite its economic importance business travel actually comprises a minority of trips made in Great
Britain (GB) 85 of all trips made per year within GB and 88 of all miles travelled per year4 are
4NTS 2010 Tables 0409 and 0410 Note that the National Travel Survey excludes professional driver mileage
the UK NTS specifically excludes the following types of motorised trips as they are commercial rather than
personal travel trips made specifically to delivercollect goods in the course of work trips made by
professional drivers or crew in the course of their work trips made by taxi drivers if they are paid or charge a
27
made on employersrsquo business We can also see that there is a great deal of heterogeneity in who
makes business related trips and when they are made Cars and vans dominate the mode of travel
for business travellers as is apparent in Table A21
Table A21 Proportion of Business Trips by Mode (by Distance Travelled and by Trips Made)
Walk Bicycle Car van driver
Car van pass
Motor-cycle
Other private1
Local bus
Rail2 Other public3
All modes
By distance 02 02 730 82 03 06 07 115 53 1000 By trip 61 14 716 79 08 05 40 65 13 1000
1 Mostly private hire bus (including school buses) 2 Surface rail and London underground 3 Non-local bus taximinicab and other public transport (air ferries light rail) Source NTS 2011 Tables 0409 and 0410
Most business trips (60) start within the core of the working day (9am to 5pm) as can be seen in
Table A22 though 21 start before 9am and 18 after 5pm A greater proportion of business trips
start outside the core working day when looking at rail as 33 of business trips start before 9am
and 20 after 5pm
There also exist differences between the types of workers who make business trips as is apparent in
Table A23 Managerial and professional staff not only make more trips per person (averaging at
more than 1 per week) but also travel the furthest Whilst there is no NTS table to show it we
would also hypothesise that such workers dominate travel by rail (for business purposes) ndash given the
high wages of such travellers (DfT 2012a) and their propensity to travel further (see Table A23)
We can also see in Table A24 that whilst travel is more evenly split between different industrial
sectors (compared to occupations) employees in certain industries appear to travel further than
others These are employees in the high value service sector (financial and real estate) and those in
construction and agriculturefishing
fare for making a trip and trips made by professional driving instructors whilst teaching or driving their
vehicles in the course of their work
28
Table A22 Start Time of Trips (All Modes and Rail Only)
Start time All modes
Rail
0000 - 0059 0 0 0100 - 0159 0 0 0200 - 0259 0 0 0300 - 0359 0 0 0400 - 0459 0 0 0500 - 0559 1 2 0600 - 0659 3 9 0700 - 0759 7 13
Before 9am
0800 - 0859 10 10
0900 - 0959 8 6 1000 - 1059 7 4 1100 - 1159 7 4 1200 - 1259 7 4 1300 - 1359 7 5 1400 - 1459 7 5 1500 - 1559 8 7 1600 - 1659 9 11
Between 9am and 5pm
1700 - 1759 8 10 1800 - 1859 4 5 1900 - 1959 2 2 2000 - 2059 1 1 2100 - 2159 1 1 2200 - 2259 1 1
After 5pm
2300 - 2359 1 0
All day 100 100
Source NTS 2011 Table 0503
29
Table A23 Business Travel by Socio‐Economic Classification (All Modes)
NS‐SEC 2010
Average number of trips (per person per year)
Managerial and professional occupations 58
Intermediate occupations 38
Routine and manual occupations 20
Never worked and long-term unemployed occupations 2
Not classified3 26
All people (aged 16+) 35
Average distance travelled (miles per person per year)
Managerial and professional occupations 1516
Intermediate occupations 596
Routine and manual occupations 258
Never worked and long-term unemployed occupations 15
Not classified3 463
All people (aged 16+) 7291 Business purpose trip personal trips in the course of work including a trip in the course of work back to work This includes all work trips by people with no usual place of work (eg site workers) and those who work at or from home 2 = not applicable 3 Most of the people in the not classified category are full-time students
Source NTS2010 Table 0708 (edited)
30
Table A24 Business Travel by Industry (All Modes)
Industry group 200809
Average number of trips (per person per year)
Agriculture and fishing 88
Energy water mining etc 34
Manufacturing 24
Construction 69
Distribution and hotels 16
Transport and communication 25
Financial and real estate 54
Public administration education and health 50
Other service 57
All people (aged 16+) 40
Average distance travelled (miles per person per year)
Agriculture and fishing 931
Energy water mining etc 786
Manufacturing 717
Construction 1586
Distribution and hotels 356
Transport and communication 836
Financial and real estate 1349
Public administration education and health 597
Other service 761
All people (aged 16+) 780
Note Business purpose trip personal trips in the course of work including a trip in the course of work back to work This includes all work trips by people with no usual place of work (eg site workers) and those who work at or from home
31
A24 MeasuringtheValueofBusinessTravelTimeSavings
A241GBpracticeandtheCostSavingMethod
The 1960s heralded the first UK applications of social cost benefit analysis to transport projects
(Coburn et al 1960 Foster and Beesley 1963) By the 1970s transport cost benefit analysis theory
had been developed to a satisfactory state of the art and was widely accepted (Dodgson 1973
1974 Harrison 1974 Mohring 1976 Leitch 1978) In these early studies business travel was valued
using what has now been termed the cost saving method Some fifty years later the cost saving
method is still in use in the UK and in fact in much of the rest of the world where transport
appraisal is actively practised Eades (2000) sets out the approach used by the Department for
Transport in deriving business values for travel time savings
The cost saving method says that in a competitive labour and product market firms hire labour to
the point at which the value of the marginal product is equal to the wage rate Thus the value of the
time saving is equal to the marginal gross cost of labour including labour related overheads To
arrive at this conclusion a number of well documented assumptions are implied regarding the labour
market and the allocation of time between work and leisure (Harrison 1974) Specifically travel time
is assumed to be unproductive reductions in travel time are assumed to go into work not leisure
the labour and product markets are assumed to be competitive and there are no indivisibilities in the
use of time for production
A242AlternativeValuationApproaches
Alternative approaches to valuing business travel time savings are discussed in detail in Annex 1 and
also in Section 2 of the main report They are the Hensher model the Modified Cost Saving
ApproachRestricted Hensher Model and Willingness to Pay
A25 InternationalAppraisalPractice
When looking at international appraisal practice it is important to recognise that in many countries
no firm guidelines are provided The requirement on the transport analyst is to use best practice
methods In a 2005 survey of appraisal practice in the EU plus Switzerland Odgaard Kelly and Laird
(2005) found that lsquonational guideline valuesrsquo which are used in almost all appraisal circumstances
only exist in 10 of the 27 countries surveyed Seven of the 27 countries have no guideline values
whatsoever and the remaining countries have guideline values but there is no requirement to use
them In fact for four of the latter group of countries the guideline values are only rarely used
(Odgaard Kelly and Laird 2005 Table 51)
32
Looking at the ten EU countries where guideline values are provided and used in almost all
circumstances we find that three different valuation methods for business travel time savings are in
use As shown in Table 25 the cost saving method for valuing business travel time savings is the
most popular method Adjusted cost savingrestricted Hensher models have been estimated in
Sweden (Algers Hugosson and Lindqvist Dillen 1995) and the Netherlands (HCG 1998) Norway
used to use an adjusted cost savingrestructed Hensher method (Ramjerdi et al 1997) but in 2010
reverted back to using a cost saving approach Switzerland is unique in that it marks up the non‐
working time savings value (Bickel et al 2005 p118) The European Investment Bank (EIB 2005) and
the EC (Bickel et al 2006) also advocate the cost saving method
Table A25 Approaches to Estimating Business Values of Travel Time Savings (for
CountriesOrganisations with Guidelines for Appraisal)
Method Countries
Cost saving method Europe Denmark Finland France Germany Ireland Norway UK European Investment Bank EC
Non-Europe Australia New Zealand USA World Bank
Adjusted cost savingRestricted Hensher Europe Sweden Netherlands
Non-Europe ---
Hensher model Europe ---
Non-Europe ---
Willingness to pay Europe ---
Non-Europe ---
Other Europe Switzerland
Non-Europe
Source Odgaard Kelly and Laird (2005) updated to 2012 and to include Australia New Zealand Norway USA World Bank and EIB with authorsrsquo own work
Outside of Europe we find that the cost saving method also dominates In the United States
business values of time are based on wage rates with no mark up for labour related overheads
(Belenky 2011) In Australia the cost saving approach is also used (Austroads 2011) as it is in New
Zealand (Melsom 2003) In New Zealand occupations and industries are taken into account when
calculating wage and non‐wage costs by mode (BCHF 2002 Chapter 8) The World Bank also
advocates the cost saving method though wage rates are adjusted for the shadow price of labour
(Mackie Nellthorp and Laird 2005 TRN‐15) No country that we have surveyed uses either a
Hensher model or values derived from direct elicitation of willingness to pay by employers
Figure A21 Valuation of Business Travel Time Savings in Scandinavian Appraisal Guidance
Sweden and Norway have used the Hensher formula (or variants of it) since the mid 1990s but have both recently changed to a (modified) cost savings approach Denmark has always used a cost savings approach Sweden changed to a pure cost savings approach in 2008 after using Hensher-type formulas since the early 1990s As of 2012 a modified cost savings approach is used Here the BVTTS for train is reduced by 15 to account for productive travel time Norway changed to a pure cost savings approach in 2010 after using a Hensher-type formula since (at least) 1997 Sweden and Denmark do not differentiate the BVTTS with respect to mode or trip distance whereas Norway has a higher BVTTS for air trips due to higher average wage rates for air travellers In Swedenrsquos case it is acknowledged that the BVTTS should in principle be differentiated with respect to mode and travel distance due to wage rate differences but the available data have been too unreliable for this
Principles for ldquocost savingsrdquo calculations
All three countries use the wage rate plus overhead costs as an indicator for marginal labour productivity (MPL) The question whether wages are a good enough approximation of MPL arises regularly but no specific alternative has been suggested
Another discussion is how to define overhead costs Sweden currently uses only indirect labour taxes (social security charges and the so-called ldquoemployer taxrdquo) but no other overhead costs such as costs for office rents administrative support etc The Danish and Norwegian practices seem to be the same although this is not absolutely clear
Motivations for adopting the modified cost saving method
In both Sweden and Norway the crucial argument for abandoning the Hensher-type formula was that in the long run it was expected that workers would not transfer saved time to leisure but would instead transfer it to increased work That is in the Hensher formula r was argued to be zero The motivation for this has been that spending some time travelling outside normal working hours is part of the agreement between employer and employee This argument has been supported by the observation that despite substantial increases in travel speeds over several decades there are no indications that business travellers nowadays spend less of their leisure time on business trips (Metz 2004) hence there seems to be no indication that some of the travel time savings have been converted to leisure time
The debates in both countries seem to acknowledge that it is not enough to try to measure how a travel time saving would be divided between the employer and employee in the very short-term such as focusing on a particular trip The attempts at doing this during the 1990s are hence now viewed as misdirected and that an understanding of the r parameter needs to be based on the long-run effects
Neither Denmark nor Norway adjusts the BVTTS for productivity during the trip although the Norwegian debate acknowledges that this should be done in principle During the period 2008-2012 Sweden likewise had no productivity adjustment although this was based on the misunderstanding that consumer surplus could not be calculated when values of time were different on different modes Once this misunderstanding was corrected it was decided to adjust for productivity during the trip in the 2012 recommendations However the current Swedish recommendation of 15 productivity during train trips is rather arbitrary During the decision process two sources were used (Fickling et al 2008) and Lyons et al 2007) The 15 productivity figure does not directly relate to either of these studies
Current practice
33
34
The content of appraisal guidelines whilst interesting does not necessarily reflect the state of the art
in valuation methods This is because a pragmatic balance between data collection efforts and need
often has to be struck during development of the guidelines Issues of equity also influence the
methods adopted and the level of disaggregation in the values Furthermore guidelines also have to
be developed for the full spectrum of potential stakeholders and recognition therefore has to be
made in the guidelines for the practical realities of the modelling and evaluation methods that will
be employed There have therefore been a plethora of studies that have examined willingness to
pay by business travellers for travel time savings often with a demand forecasting perspective that
are more sophisticated in their valuation methodology than the cost saving method (Shires and de
Jong 2009 Abrantes and Wardman 2011 Hensher 2011) Patterns and trends in these empirical
studies of the value of business travel time savings are presented in Annex 2 of this study However
given that ultimately we are interested in amending national appraisal guidelines we briefly case
study Scandinavian practices where adjusted cost saving modelsrestricted Hensher models have
been implemented and recently altered (Sweden) and replaced by a cost saving approach in
Norway This is presented in Figure 1
A26 ImplementingtheCostSavingMethodinGreatBritain
With the cost saving method the value of the time saving is equal to the marginal gross cost of
labour including labour related overheads In essence the DfTrsquos approach has been to
Use NTS data to derive distance weighted annual incomes by mode of travellers As the NTS
only collects banded income data ndash the mid‐point of the income band is used
Calculate hourly incomes by dividing average annual incomes by 394 hours (which is the
average working week sourced from the New Earnings Survey)
Use the New Earnings Survey to estimate hourly wage rates for commercial vehicle drivers
and occupants
Use the Labour Cost Survey to estimate average non‐wage labour costs On average non‐
wage labour costs form 212 of the wage Uprate average hourly estimates by a factor of
1212 to give estimates of the gross cost of labour plus labour related overheads
Adjust estimates to correct unity of account and price and value base
The current values in webTAG unit 356 (DfT 2012a) were derived from survey data in 19992000
They have been updated to 2010 prices and values by reflecting changes in GDPcapita and inflation
Since these values have been derived the New Earnings Survey has been superseded by the Annual
Survey of Hours and Earnings (ASHE)
Effectively the approach is a two staged approach The first stage estimates the hourly wage of
travellers and the second estimates the nonwage labour costs We comment on these stages
separately
35
A261 DerivingtheHourlyWage
Over time the labour market alters and the way that different modes of transport are used by
different sections of the business community may also change Given that the current average
modal business time saving values were derived from 1999 to 2001 NTS data they are arguably
getting to the point of requiring an update Even if the existing approach is maintained there is a
need to update the current values using more recent travel survey data
Given that the cost saving method requires an estimate of the hourly wage ideally a dataset that is
robust in earned income data should be used The NTS is not such a dataset This is for three
reasons Firstly the personal gross annual income reported in the NTS is from all sources (earnings
benefits pensions savings self‐employment multiple jobs etc) Secondly the survey does not
record the number of hours worked by individuals thus one cannot obtain a robust estimate of an
hourly wage rate Finally the income data is only banded More appropriate datasets for deriving
hourly incomes would be the Annual Survey of Hours and Earnings (ASHE) and the Labour Force
Survey (LFS) These form the basis of ONS estimates of earnings The challenge of course is to link
these more robust estimates of hourly earnings to observed travel behaviour to derive distance
weighted estimates of the value of business travel time savings by say transport mode
The current approach could bias the values Firstly total annual income exceeds earned income The
Family Resources Survey (DWP 2012 Table 23) indicates that earned income comprises on average
about 85 of total income for households with a head of household aged between 25 and 59 That
is using total income as an approximation to earned income overestimates earned income by about
18 (on average across the workforce) Secondly hours worked vary significantly by occupation
Managers and senior officials work about 15 more hours than the average worker56 As these
occupations travel the most (see Section 2 of this report) then using average hours worked by the
average worker risks introducing an upward bias to the estimated hourly wage rate of those
travelling on employersrsquo business Furthermore as travellers will self‐select between modes any
upward bias will vary between modes and will be largest for modes used by those who work the
longest hours (ie modes preferred by managers senior officials and professionals) Ultimately how
significant any biases are is an empirical question that needs further analysis before conclusions can
be drawn
An alternative approach to estimate the distance weighted hourly wage by mode would be to use
each dataset to its full strength Therefore the NTS would be used to describe the types of business
travellers using each mode (in terms of distance weighted proportions by occupation and potentially
5 Census 2001 Table CAS040 6 Some of the additional hours worked by managers and senior officials will not be lsquoofficiallyrsquo contracted but
having an accurate understanding of their hours is essential to calculate their effective hourly wage
36
industrial sectors7) and the LFS or ASHE would be used to derive hourly wage rates for each of these
categories of business travellers ASHE is a survey of employers and responses are based on
documentary evidence whereas responses in LFS are based on individual recollection sometimes by
proxy respondents and sometimes without reference to payslips ASHE is therefore generally
considered more reliable (Ormerod and Ritchie 2007) The ASHE sample is also considerably larger
than LFS although is not as representative of low‐paid workers as LFS does not include unpaid
overtime hours and does not cover self‐employed which the LFS does we discuss the self‐
employed below The LFS is therefore arguably the better dataset from which to derive hours
worked whilst ASHE is considered the best dataset to describe earned income Such an enhanced
approach is similar to that used in New Zealand (BCHF 2002 Chapter 8)
Ultimately the question of whether the existing methodology for calculating distance weighted
average hourly earnings by mode is a good approximation to reality is an empirical question We
have raised a number of issues that would suggest that upward biases exist in the current
methodology (ie the current values of work travel time savings are too high) However how
significant those biases are is an empirical question that needs further analysis before any
conclusions can be drawn
A262 Non‐WageLabourCosts
Our discussions with the ONS indicate the Labour Cost Survey is the most comprehensive dataset for
non‐wage labour costs in the UK It is re‐compiled every four years by the ONS as part of ongoing
commitments to Eurostat Partial annual updates are also made The latest survey relates to 2008
A 2012 survey will also be undertaken which should become available in 2014 once Eurostat has
published it The Labour Cost Survey is not a survey in the strictest sense but is in fact an analysis of
existing datasets ndash the main ones of which are ASHE LFS and the Annual Business Inquiry (ABI) The
main sources of non‐wage labour costs are employersrsquo national insurance and employersrsquo pension
contributions Other non‐wage labour costs are also estimated including paid annual leave paid
maternitypaternity leave training costs sick pay benefits in kind etc Mark‐up factors from
employee wage costs to gross labour costs to the firm per hour of employment are available for the
economy as a whole and by industrial sector
7 The NTS contains National Statistics Socio‐economic Classification (NS‐SEC) data that gives broad occupational data It
also contains data on standard industrial sector (SIC) These are also contained in the LFS and ASHE If disaggregating by
mode NS‐SEC and SIC sample sizes are likely to be small giving imprecise estimates of both distance weighted proportions
(from the NTS) and possibly earned income from the LFS or ASHE Some aggregation of the NS‐SEC categories and SICs will
be necessary Additionally it may be necessary to pool several years of the NTS data to obtain reliable estimates of mileage
weighted proportions at whatever level of disaggregation NS‐SECSIC is chosen Another estimation issue that may arise is
that if business related travel is a function of income rather than job function than an incomemileage distribution may
arise within any specific NS‐SECSIC sample segment Arguably business travel should be a function of the job undertaken
by the worker and not income ndash however there may be whether there is sufficient data in the NTS to identify job functions
accurately enough and some correlations with incomewage may still be present
37
The current non‐wage labour costs are based on the 2000 Labour Cost Survey The existing business
values of time could therefore be updated to be consistent with the 2008 survey (the latest available
survey) The proportion of non‐wage costs varies by industry with skilled service sector industries
incurring higher non‐wage costs than agricultural construction manufacturing and low skilled
service sector employment As travel behaviour (distance travelled and mode choice) varies by
income and job type there is therefore an argument that the non‐wage mark‐up should also be
allowed to vary by mode This would require an analysis of the NTS to indicate the industrial
sectoral split by mode Such an enhanced approach is similar to that used in New Zealand (BCHF
2002 Chapter 8)
A263 ProfessionalDrivers
Employed professional drivers would be treated the same as other employees in this revised
methodology ndash in the sense that the ASHE or LFS would be used to derive their hourly wage
A264 Longrunmarginalcosts
From a cost benefit analysis perspective we are not strictly speaking interested in the marginal
product of labour per se This is because in response to changes in labour productivity the firm will
re‐balance factor inputs (other classic inputs being capital and land) to maximise profits What we
are primarily interested in therefore is how the long run marginal costs to the firm alter in response
to changes in labour productivity As far as we are aware there is no comprehensive evidence on
this For marginal changes in business travel time we would consider that short run responses that
is all inputs aside from labour being held constant would be a suitable approximation
A27 Summary
Business travel whilst forming only a small proportion of the trips made in the UK is a very important
in economic terms Business travel is also very heterogenous in terms of who makes the trips when
those trips are made and how they are made (mode) Importantly
40 of business travellers start their journeys outside of the core working day (9am to 5pm)
The number of and length of business trips increases with socio‐economic
statusoccupation and also by corollary with income and
Travel varies by industrial sector ndash albeit not as much as by occupation
In terms of international appraisal practice the cost saving method dominates valuation methods
used to derive values published in official guidance The adjusted cost saving approach is used in the
Netherlands and in Sweden
38
Currently business values of time used for appraisal in Britain have been derived from the 199901
National Travel Survey (for annual incomes by mode) and the 2000 Labour Cost Survey (for average
non‐wage costs) The New Earnings Survey was used to derive hours worked and the hourly wage of
commercial drivers For a number of reasons these values are considered questionable Firstly the
data upon which they are based are old and secondly the income data is based on the NTS rather
than a combination of the ASHE and the LFS The NTS does not give reliable hourly earned income
data A potentially more robust method to derive hourly wage plus non‐wage costs for travellers by
mode would be to use the NTS to describe who travels on which mode (in terms of occupation and
industry) and other datasets ndash the Labour Cost Survey the ASHE and the LFS ndash to give estimates of
the hourly wage and hourly non‐wage costs by occupationindustry Such an approach would be
similar to that adopted in New Zealand
Annex 2 References
Abrantes PAL and Wardman MR (2011) Meta‐analysis of UK values of travel time An update
Transportation Research Part A 45 1ndash17
Algers S Hugosson B Lindqvist Dilleacuten J (1995) 1994 aringrs tidsvaumlrdestudie Slutrapport Del 1
Resultat Transek AB Solna
Austroads (2011) Updating Austroads RUE Unit Values and Related Methodologies Austroads
Research Report AP‐R37311 Report dated February 2011 Sydney Australia AUSTROADS
Barrington A (1977) Valuing Time Savings in Developing Countries ndash A Comment Journal of
Transport Economics and Policy 11(2) pp195‐201
Beca Carter Hollings amp Ferner Ltd (2002) Review of Benefit Parameter Values for Economic
Evaluation Report to Transfund New Zealand Report dated April 2002
Belenky P (2011) The Value of Travel Time Savings Departmental Guidance for Conducting
Economic Evaluations Revision 2 Memo dated 28 Sept 2011 Available online at
Bickel P Burgess A Hunt A Laird J Lieb C Lindberg G Odgaard T (2005) State‐of‐the‐art in
project assessment HEATCO Deliverable 2 HEATCO ndash Developing Harmonised European
Approaches for Transport Costing and Project Assessment Funded by the 6th Framework RTD
Programme IER Stuttgart Germany Available online at httpheatcoieruni‐stuttgartde
Bickel P et al (2006) Proposals for harmonised guideliens HEATCO Deliverable 5 HEATCO ndash
Developing Harmonised European Approaches for Transport Costing and Project Assessment
Funded by the 6th Framework RTD Programme IER Stuttgart Germany Available online at
httpheatcoieruni‐stuttgartde
39
Coburn TM Beesley ME and Reynolds DJ (1960) The London‐Birmingham Motorway Road
Research Technical Paper 46 London HMSO
Department for Transport (DfT) (2012a) Values of time and operating costs TAG Unit 356 August
2012 London Department for Transport Available online at lthttpwwwdftgovukwebtaggt
(Accessed 23rd August 2012)
Department for Transport (DfT) (2012b) Economic Case for HS2 Updated appraisal of transport user
benefits and wider economic benefits A report to Government by HS2 Ltd January 2012 Available
online at lt httpwwwdftgovukpublicationshs2‐economic‐case‐appraisal‐updategt (Accessed
26th October 2012)
Dodgson JS (1973) External effects and secondary benefits in road investment appraisal Journal of
Transport Economics and Policy 7 (2) pp 169‐185
Dodgson JS (1974) Motorway Investment Industrial Transport Costs and Sub‐Regional Growth mdash
a case study of the M62 Regional Studies 8 (1) pp 75‐91
Eades D (2000 Unpublished) Creating new values of working time (HEN2) Internal note to the
Department for Transport Note dated April 2000
European Investment Bank (2005) RailPAG Rail Project Appraisal Guidelines Brussels EIB Available
online at httpwwweiborginfocentrepublicationsallrailpag‐railway‐project‐appraisal‐
guidelineshtm (Accessed 26th October 2012)
Fickling R Gunn H Kirby H Bradley M amp Heywood C (2008) The productive use of rail travel
time and value of travel time saving for travellers in the course of work ETC Proceedings Available
online at lthttpwwwetcproceedingsorgpaperthe‐productive‐use‐of‐rail‐travel‐time‐and‐value‐
of‐travel‐time‐saving‐for‐tra‐1gt (Accessed 26th October 2012)
Foster CD and Beesley ME (1963) Estimating the benefits of constructing an underground line in
London Journal of the Royal Statistical Society Series A 126 (1) pp 46‐58
Fowkes AS Marks P and Nash CA (1986) The value of business travel time savings Institute for
Transport Studies University of Leeds Working Paper 214
Hague Consulting Group (HCG) (1998) Value of Dutch Travel Time Savings in 1997 Final report A
report for Rijkswaterstaat ndash AVV by Hague Consulting Group The Hague Netherlands
Harrison AJ (1974) The economics of transport appraisal Croom Helm London
Hensher DA (1977) Value of Business Travel Time Pergamon Press Oxford
40
Hensher DA (2011) Valuation of travel time savings In de Palma A R Lindsey E Quinet and R
Vickerman(eds) A Handbook of Transport Economics Cheltenham Edward Elgar pp135‐159
Howe J (1976) Valuing time in developing countries Journal of Transport Economics and Policy
10(2) pp113‐125
Leitch G (1978) Report of the Advisory Committee on Trunk Road Assessment (ACTRA) London
HMSO
Lyons G Jain J amp Holley D (2007) The use of travel time by rail passengers in Great Britain
Transportation Research Part A Policy and Practice 41(1) 107‐120
httpdoi101016jtra200605012
Mackie PJ Nellthorp J and Laird JJ (2005) Toolkit for the Economic Evaluation of Transport
Projects Washington DC World Bank Available online at
httpwebworldbankorgWBSITEEXTERNALTOPICSEXTTRANSPORTEXTROADSHIGHWAYS0con
tentMDK20464962~pagePK148956~piPK216618~theSitePK33866100html (accessed 26th
September 2012)
Mackie PJ Jara‐Diaz S and Fowkes AS (2001) The value of travel time savings in evaluation
Transportation Research Part E 37 pp91‐106
Mackie PJ Wardman M Fowkes AS Whelan GA Nellthorp J and Bates J (2003) Value of
Travel Time Savings in the UK A report to the Department for Transport Institute for Transport
Studies University of Leeds UK
Melsom I (2003 Unpublished) Review of the Benefit Parameters Used in Transfund New Zealandrsquos
Project Evaluation Procedures Information Note Transfund New Zealand Note dated February
2003
Metz DA (2004) Travel time ndash variable or constant Journal of Transport Economics and Policy
38(3) pp333‐344
Odgaard T Kelly CE and Laird JJ (2005) Current practice in project appraisal in Europe ndash Analysis
of country reports HEATCO Deliverable 1 HEATCO ndash Developing Harmonised European Approaches
for Transport Costing and Project Assessment Funded by the 6th Framework RTD Programme IER
Stuttgart Germany Available online at httpheatcoieruni‐stuttgartde
Ormerod C and Ritchie (2007) Linking ASHE and LFS can the main earnings sources be reconciled
Economic amp Labour Market Review 1(3) Office for National Statistics
Ramjerdi F Rand L Inger‐Anne F Saeligtermo I‐AF and Saeliglensminde K (1997) The Norwegian
Value of Time Study Transportoslashkonomisk Institutt (TOI) Oslo Norway
41
Shires JD and de Jong GC (2009) An international meta‐analysis of values of travel time savings
Evaluation and Program Planning 32 pp 315ndash325
42
ANNEX3REVIEWOFEVIDENCEONBUSINESSTRAVELTIMESAVINGS
A31 Introduction
A311 Aims
This review is primarily concerned with the empirics rather than the theory of estimating values of
time for business travellers We are here concerned with existing evidence whether UK or
elsewhere regarding the value of business travel time savings (VBTTS) along with evidence on
parameters that can be used to deduce business time valuations and methodologies for estimation
This review of empirical evidence has three central themes
The first addresses the major national value of time studies insofar as they provide insights
into business time valuations and also other significant studies that we have identified It
focusses upon
Evidence on the p q and r parameters that input to the Hensher equation
Evidence obtained from RP and SP studies
Implications for appraisal and in particular challenges to the widely used cost saving
approach
Other insights and evidence
The second theme is to cover empirical evidence more generally with an emphasis on the
insights provided by our own data sets assembled for the UK and also Europe as a whole as
part of meta‐analyses of valuations of travel time savings
The final theme considers other evidence that provides insights into the VBTTS These
include who pays for the time savings and to whom the benefit accrues self‐employed
compared to employed business travellers high speed rail evidence and methodological
issues
A312 Scope
This review focusses solely on briefcase travellers This annex complements the material discussed in
section 31 of the main report in providing more detail about the original studies The key material
and discussion from the main report that is not repeated here is cross‐referenced We generally here
report values from studies in the original units they were estimated and have as far as is practical
reproduced the questions that underpin the evidence on the Hensher parameters
A313 Structure
The structure of this annex is as follows Section 2 sets outs some definitions of terms relevant to the
research findings reviewed in this annex Section 3 adds detail to our review of major national value
of time studies and other significant studies contained in section 312 of the main report with an
emphasis on those that have sought to compare different approaches or have investigated the
Hensher equation as a means of estimating the VBTTS Other willingness to pay evidence covered in
section 313 of the main report is here the focus of section 4 The remaining two sections point out
what is covered in the main report in terms of its coverage of specific issues that arise from the
review of many studies and its conclusions and recommendations
A32Definitions
The most common alternative to the Cost Savings Approach to the estimation of VBTTS is the
Hensher Equation This is gives a comprehensive conceptual framework for valuing VBTTS which has
found intuitive if not practical favour The equation is given by the following
rVLVWrMPFMPLpqrVBTTS )1()1( (1)
where
r is the proportion of travel time saved that is used for leisure
p is the proportion of travel time saved that is at the expense of work done while travelling
q is the relative productivity of work done while travelling relative to at the workplace
MPL is the marginal product of labour as in the cost savings approach
MPF is the extra output due to reduced (travel) fatigue
VW is the value to the employee of work time at the workplace relative to travel time
VL is the value to the employee of leisure time relative to travel time
[] is the portion of VBTTS that is associated with the employer
is the portion of VBTTS that is associated with the employee
Whilst the Hensher equation has conceptual appeal practical implementation of the complete
framework is difficult The MPF and VW terms are especially difficult to estimate and it is not
unusual to drop these from consideration we shall follow that convention here in what is often
termed the Modified Cost Saving Approach
rVLMPLpqrVBTTS )1( (2)
Another important definitional point first raised by Fowkes et al (1986) is what p and r cover
These two parameters were defined above but two related terms have been widely used These are
what Fowkes et al (1986) term
43
44
p which is the average amount of time spent working during a journey
r which is the proportion of total travel time which occurs in leisure time
A33 ReviewofNationalValueofTimeandOtherSignificantStudies
There have been a number of significant studies that have explored and estimated VBTTS This
review is not restricted to UK evidence but takes a broader perspective given that many of the issues
addressed even if not the absolute VBTTSs themselves are transferable across contexts
For the studies identified and reviewed below we summarise the key findings and where
appropriate and possible provide comments on those findings We have generally attempted to
record the precise questions asked since these are important in interpreting the results as well as
providing an account of each study
The main issues arising from each study are
the evidence on the p q and r parameters
how any estimated values relate to labour costs and how they vary by method and
methodological issues and particular insights into business valuations
Hensher (1977)
This is the pioneering piece of work that first empirically challenged the convention of valuing
business travel time savings at the gross wage rate Note however that it was first codified by
Fowkes et al (1986) based on the concepts elucidated by Hensher (1977)
With regard to the productive use of time Hensher asked
During this last domesticinternational business air journey what percentage of the travel
time do you estimate you devoted to work (ie writing reading thinking discussing work
matters) on each of the following stages of your journey
To the airport on your outward trip
During the flight in the aircraft on your outward trip
From the airport on your outward trip
To the airport on your return trip
During the flight in the aircraft on your return trip
From the airport on your return trip
If some time was devoted to work they were then asked
45
How effective do you think the time spent working during this journey was by comparison
with the equivalent time spent working in your office
with the response required as a percentage
The mean proportions of time spent working (p) for the various categories of trip stage and type of
flight are set out below in Table A31 The proportions are larger for domestic (Dom) than the very
much longer international (Int) journeys and tend to be larger for the outward journey They do
indicate quite modest amounts of travel time spent working with the least on access on the
outward leg and egress on the return leg where car is most likely to dominate
Table A31 Mean Proportions of Time Spent Working (Hensher 1977)
OUTWARD TRIP RETURN TRIP
Access Flight Egress Access Flight Egress
Dom Int Dom Int Dom Dom Dom Int Dom Int
174 96 448 231 481 329 270 145 270 82
The equivalent effectiveness of time spent working during a business air journey was 61 for
domestic travel and 51 for international travel Given that overall p and also q are relatively low
the impact of productivity on the valuations is relatively low
Time savings devoted to leisure are proxied by the amount of business travel time spent in own time
(r) The proportion of travel that was undertaken in the employeersquos own time is reported in Table
A32
Table A32 Mean Proportions of Travel Time in Own Time (Hensher 1977)
OUTWARD TRIP RETURN TRIP
Access Flight Egress Access Flight Egress
Dom Int Dom Int Dom Dom Dom Int Dom Int
62 16 46 8 45 31 64 55 72 54
In general a significant amount of travel is done in the employeersquos own time and perhaps
surprisingly it is greater for domestic than international trips
When the productivity and leisure time effects are both allowed for the value of business travel
times savings for domestic and international travellers are 68 and 30 of the average gross salary
cost respectively Removing the productivity effect would yield figures of 85 and 33 respectively8
8 Our understanding is that Hensher assumed VW to be the same as VL (Hensher 2011) whereas it is more likely that business travellers are indifferent between travelling (working or not) and working in the office which is VW of zero (Fowkes et al 1986)
46
As part of a survey of employers they were asked to imagine a situation where an employee could
save time by an unspecified new means at the egress end of a domestic air journey and what
monetary outlay ranging from $1 to $20 (12 different levels) would be permitted The implied value
in 1973 prices was $436 per hour implicitly for domestic trips The conventional marginal
productivity approach would imply a valuation of $510 per hour for domestic journeys
Hensher noted that individuals are likely to exaggerate the amount of time spent working and the
relative productivity of time spent working while travelling relative to at work so as not to appear
lazy
UK National Value of Time Study (MVA et al 1987)
This was the first of the so‐called national value of time studies Whilst its scope was broad the
remit was primarily private travel and the business travel element was largely left to a parallel
research council funded project that is discussed below Employersrsquo business trips were considered
but only using SP methods and with uncertainty as to what extent they reflected employer
sanctioned or personal willingness to pay Unfortunately the self‐employed sample was too small to
enable a distinction to be made Nonetheless the study made a number of useful comments on
business time valuations
It conceded in 1987 that the possible shortcomings of the assumptions underpinning the cost
saving approach have been ldquowell‐rehearsedrdquo It went on to state ldquoOn the other hand there are a
number of empirical questions which are in principle capable of resolution For instance what values
of time do individuals travelling in the course of work reveal on the basis of their travel choices And
what use is likely to be made of time savingsrdquo
The report distinguishes between those for whom travel is the nature of their job such as
professional drivers and briefcase travellers In the former case it is argued that in the short run
not all time savings can be converted into extra output due to scheduling inflexibilities and even in
the longer run some of the time saved might accrue to leisure as a result of collective bargaining In
such cases non‐work valuations would be applicable for the relevant proportion of time saved To
the extent that the time saving is converted into a wage increase in the longer run this would lead
to some reduction in the demand for labour and hence enforced leisure time and hence a leisure
value of time would be appropriate
Thus whilst the study recognises that even for professional drivers the wage rate related price can
overstate the benefits of the time savings ldquothe difficulty with this argument is the paucity of
empirical data on which to judge the extent of any such adjustment It is for that reason of
practicability rather than anything else that the implicit assumption is made that all working time
saving is converted into extra productive employmentrdquo
For briefcase travellers the vulnerability of the argument is accepted It is stated that ldquoWhere
neither the total job content or the required hours of work are clearly specified and where the
47
travel mode used may permit some work to be undertaken during the journey the convention
based on the marginal productivity theory might appear to break down completelyrdquo Some business
travel time particularly for longer distance trips is done in the employeersquos own time where the
opportunity cost to the employer is zero but there is a benefit to the employee of a time saving that
should be accounted for
The study suggests that an appropriate means of estimating their valuations is through the time‐cost
trade‐off choices they make when making business trips
UK Business Travel Study Fowkes et al (1986)
This SERC funded study into business travel time values paralleled the first UK national value of time
study where non‐business travel was predominant It did not examine commercial vehicles but was
confined to briefcase travellers
The study was both theoretical and empirical It appraises the traditional cost saving approach and
considers the implications for other estimation methods It made use of two surveys of long distance
business travellers and one survey of employers being novel in its use of SP methods in this market
to complement RP based approaches It was one of the first surveys of employers and remains one
of the few
It pointed out that Hensher (1977) departed from the conventional wage rate approach by
recognising that business travel might occur in what is leisure time work might be undertaken
during the journey and the employee might not be indifferent between working in the office and
travelling
The study also identified two studies conducted in the UK in the early 1970s that estimated business
valuations from RP data on the choices between air and rail that found values somewhat lower than
the wage rate It stated that ldquosince revealed preferences are the product of both the constraints on
choice imposed by company travel policy and the preferences of travellers themselves it is difficult
to interpret such resultsrdquo They may be the joint outcome of employersrsquo and employeesrsquo
preferences to save time As such they might be expected to drive behaviour and hence be
appropriate for forecasting but they do not necessarily reflect the sum of the employerrsquos and
employeersquos valuations to save time
As a result of these findings it was recognised that investigations of both the willingness to pay of
employers and of employees would be necessary but ldquoeven this is far from straightforwardrdquo
because there are difficulties in identifying within organisations those who can speak authoritatively
about company decision making whilst for employees it is necessary to create a situation where they
will incur the costs and receive the benefits of a faster journey
This study pointed out that Hensher ( 1977) had specified the productivity element in terms of the
proportion of the overall time spent working which they termed p rather than the proportion of
48
the time saved that would have been spent working which is p If the work can be done even with
the time savings which is possible where p is not equal to one it is likely that p will lie between
zero and p It also pointed out that instead of specifying r as the proportion of time saved that
would be devoted to leisure they used the proportion of total travel time which occurs in leisure
time termed r They state that ldquoSince for some people travel time savings will be replaced by extra
work on other days we would suggest that on average the appropriate value of r lies between zero
and r Whilst a recurring theme in the literature we do not feel that the failure to distinguish r and
r is a serious one but p and p could well be somewhat different
The study covered four methods of valuing business travel time
Wage rate approach
Employerrsquos Stated Preference
Revealed Preference
Synthetic Approach using p q r and employeesrsquo valuations and the Hensher equation
Three surveys were used as the basis for the value of time calculations all covering long distance
trips which were defined as those over 50 miles
Telephone survey of 311 organisations split between the South East and North East of
England and focussing on their travel policies
A self‐completion questionnaire distributed amongst employees of the employers contacted
who agreed to participate This collected RP and SP data for 442 travellers (and was termed
the ORGN sample)
A very similar self‐completion questionnaire of 411 rail travellers on the East Coast Main
Line (and was termed the ECML sample)
Employersrsquo Survey
Employers were asked how employees would make a day return trip between London and
Newcastle and then the following question
Now suppose a first class (only) premium accelerated rail service between London and
Newcastle was introduced saving one hours travel time Would senior staff be allowed to
use the service if the extra cost was pound5 helliphellip was pound20 helliphellip was pound50 And what about other
staff
In terms of current SP methodology this is a crude approach but it is nonetheless pioneering The
value of time was deduced from the cumulative frequency of responses by interpolation The results
showed that
Time savings of what were termed senior staff were valued around 2frac12 times more highly
than for other staff
49
The implied valuations varied by industry type size of organisation and the cost of the mode
used
The values were positively correlated with incomes
For senior staff the companies were on average prepared to pay more than the gross labour costs
but broadly similar to the wage rate for other staff The authors speculate that the former could
reflect the employerrsquos valuation of the disutility incurred by its staff in making business trips On
average the employerrsquos valuation was pound12 per hour
Employeesrsquo Stated Preference
Long distance business travellers were asked to consider a hypothetical 300 mile each way round
trip The available options were air first class rail standard class rail and car defined in terms of
return cost departure time from home and arrival time back at home A fixed lump sum of pound100
would be given by their employer for travel expenses with the respondent paying or keeping the
difference on the actual cost The four alternatives were ranked in order of preference and 12 such
rankings were presented
As far as we are aware this was the first study to aim to estimate employeesrsquo personal values for
time savings incurred during a business trip It was found that the values increased strongly with
income and that values of time savings for journeys starting very early in the morning were
somewhat larger The average values at around pound7 per hour are slightly over half the employersrsquo
average valuation of around pound12 per hour
Employeesrsquo Revealed Preference
The employeesrsquo survey also asked for RP information for their actual and best alternative mode This
allowed models to be developed explaining the choice between car and rail and between air and rail
Only around a third faced a time‐cost trade‐off essential for precise value of time estimation This
combined with the small sample sizes of 234 for the car and rail model and 130 for the air and rail
model meant the time and cost estimates are not precisely estimated Nonetheless the values of
time averaged around pound13 per hour not dissimilar to the employer based values It is clearly higher
than the SP values since the latter reflected a valuation based on personal rather than company
willingness to pay
Synthetic Approach
The study evaluated a modified Hensher approach with the marginal product of labour amended by
the (1‐r‐pq) term and the inclusion of VL Compared to the full Hensher approach VW was assumed
zero and MPF was also assumed zero or else is included within employeesrsquo SP valuations
50
Using the terminology set out above the business travellers were asked to record a log of their most
recent long distance business trip and to indicate how much time they spent working on the trip
(p) and their normal hours of work and salary from which r and MP were calculated
The figures in Table A33 below unsurprisingly indicate that rail is the most productive mode and car
the least Relative productivity is similar between work and travelling for all modes The larger r
values for rail and air might be because once access and egress are accounted for these journeys
take longer and hence incur more out of hours travel
Table A33 Hensher Parameter Estimates (Fowkes et al 1986)
Parameter Car Rail Air
p 003 020 014
q 101 095 099
r 032 042 042
Implications for Appraisal
Table A34 below sets out the values of time in pound per hour from the different methods considered
in this study Whilst the relationships apparent between mode and valuation for the employersrsquo
stated preference and the revealed preference conflict with each other the exploratory nature of
this pioneering study and the precision with which the values are estimated should be borne in
mind However the results do show a reasonably high degree of similarity across methods Fowkes
(2001) stated that ldquoNevertheless it is easy to see why Table 1 [of their report] was not thought to
give any great support to calls for a move away from the current approach towards use of the
Hensher formulardquo
Table A34 Fowkes et al (1986) UK Business VoT Study (poundhr 1985 prices)
Method Car Rail Air
Wage Rate Approach 103 98 119
Employersrsquo Stated Preference1 120 120 120
Revealed Preference 141 126 115
Synthetic (Hensher) r = r p = 0 r = r p = p
104 101
101 77
100 83
Note We have averaged over the ECML and ORGN samples 1 This is the overall SP figure reported
in the paper
The personal valuation of business travel time savings where a strong income effect was apparent
was between 611 and 621 times larger than the official equity values of time for non‐work
journeys The ratio is over 4 even for the lowest income group of business travellers
This was at least in the UK context a pioneering study and the conclusions are worth recounting
particularly since its findings influenced the Department for Transportrsquos retention of the cost saving
method
51
Whilst we find good reason to suppose that much of the time savings in our sample will be
devoted to leisure we still find that these time savings are valued highly by employers and
employees alike Perhaps this is not surprising the reason why we expect time savings to be
used for leisure is that they accrue on (often extremely) unsocial hours
For evaluation purposes the issue is less clear cut The value of time savings has been shown
for our samples to vary significantly according to the valuation methodology adopted
Although we do not possess sufficient evidence with which to decide unequivocally on the
most appropriate to use we believe that the lowest value that it would be reasonable to
contemplate are those which assume that all time savings would be devoted to leisure
activities but that any work undertaken en route would still be done and which use
employeesrsquo stated preference values adjusted for equity considerations This gives values in
the range of 40‐57 of the wage rate approach value Only a modest use of time savings for
work purposes is needed to obtain values close to the wage rate approach value for instance
assuming that the proportion of time savings devoted to work equals the proportion of travel
time in normal working hours will do this
In short although we find no empirical support for the assumptions upon which the present
valuation conventions are based our empirical work suggests these conventions yield values
which are approximately correct
This study did not claim to provide representative values of time What it did aim to do and achieve
was to compare different methods of estimating the values of time However the relationships
apparent do not necessarily apply to shorter distance trips whilst it is possible that the relationship
between the values might have varied over time either with methodological advances or more
significantly with changes in the characteristics of business travel
UK 1994 Study (Hague Consulting Group et al 1999)
Unlike the 1987 national value of time report an explicit objective of this national study was to
derive values of time for work as well as non‐work time Business travel is covered in four aspects
Explicit consideration of the application of the Hensher approach to business travellers
The main car usersrsquo value of time experiments which covered employerrsquos business trips
A repeat of the 1987 studyrsquos analysis of urban car usersrsquo route choices in Newcastle but
including business travel in the RP element
A study of the SP choices of freight operators9
9 Although this was not restricted to the value of time but will also cover operating costs and the value of the commodity
We do not cover this aspect of the study here
52
p q and r evidence
The value to the employer of changes in travel time for the employee (EVoT) was specified as
EVoT = W(a‐bc)
where W is the wage rate inclusive of overheads a is the fraction of the time variation that impacts
on time spent working often referred to as 1ndashr where r is the proportion of travel time saved that is
used for leisure b was specified as the fraction of travel time already spent doing some work which
is p and c is the productivity of work during travel relative to work done elsewhere which is
typically referred to as q
The questions specifically asked of business travellers relating to the formula above were
Suppose that the business trip that you were making when you received this questionnaire
had taken 15 minutes longer as a result of congestion on the roads Would that extra time
have been paid by your employer or would it have mostly come out of your own time
and
Did you use any of the time during that trip to do work which you otherwise would have done
elsewhere for example preparing for a meeting conversations on a portable telephone etc
If so about how much time
Approximately how long would that same work have taken you if you had done it at your
office or at home
The averages for a b and c across the entire business travel sample were 0537 0043 and 102 Not
surprisingly b (p) is low for car given the limited opportunities to work during a car journey
particularly in 1994 The value of r (1‐a) seems high given that many trips would have been made in
normal work hours
The variations in p q and r across a number of dimensions are given below P is higher for
motorways and lower for deliverypickup as expected but the effect is slight and there is hardly any
variation across categories Similarly q is closely centred around one
There is more variation in r with it higher for journeys made after 1600 as might be expected whilst
those attending a seminar which presumably takes up the whole day as well as those attending a
meeting would be more likely to incur the extra travel time in their own time The high figure for
self‐employed could be because there is little point paying themselves extra as a result of a delay
There is a slight but not convincing effect of the expected form from journey duration
53
Table A35 p q and r values (HCG et al 1999)
p q R
Before 10 003 108 042
1000 to 1600 005 101 044
After 1600 005 101 061
10‐30 mins 003 111 047
31‐60 mins 004 101 041
61‐120 Mins 005 100 043
gt 120 mins 005 101 054
Self Employed 003 096 081
Employed 004 102 036
Meeting 006 100 051
Visit Client 005 104 044
Visit Branch Office 004 100 040
Attend Seminar 003 078 066
Deliverypickup 001 098 045
Other Purpose 002 105 047
Motorway 006 098 046
Trunk 004 106 046
Urban 002 099 047
Time Save to Employer 005 105 000
Time Save to Self 003 097 100
Given a gross wage rate of around pound185 per hour the average employer value of time is just over
pound9 per hour However as was pointed out the various components of the Hensher formula are not
independent for example those with higher salaries are more likely to work while travelling
Adopting a sample enumeration approach based on each individualrsquos wage rate and their own a b
and c the average is a little lower at pound88 per hour
Employerrsquos Business Trips SP
There were two SP exercises relating to business (and indeed other) travel The first termed SP1
offered trade‐offs between time and cost and was intended to obtain a personal value of time for
journeys made on company business The respondents were told
If you did not actually pay for the journey yourself please assume that you would receive a
fixed amount of reimbursement equal to the current journey cost so that any additional or
saved costs would go to you10
10 Note that four of the twelve questionnaires (TA TC MB MD) deliberately did not include this text
54
The second SP exercise relating to business travel termed SP311 offered choices between an
untolled A road option and a tolled urban road trunk road and motorway Business travellers were
told
If you think that an employer would reimburse the toll cost then this should be taken into
account when making your choice
The statement about a fixed reimbursement had no significant effect on the cost coefficient in the
business model Those who were reimbursed had a lower cost coefficient but surprisingly it would
not be zero but rather only 20 to 30 less It was concluded that ldquoOverall the effect of cost
reimbursement is not as strong as one might expectrdquo Whilst it was claimed that ldquoall respondents
behaved to some extent as if the SP cost changes would come out of go into their own pocketrdquo
there is nonetheless an element of uncertainty as to what the valuations represent
In distinguishing additionally between whether it was the employerrsquos or the respondentrsquos time and
relative to a base of respondentrsquos time and money business travellers for whom it was their own
time and their employerrsquos money had a 26 higher value reflecting the slight effect above of
reimbursement When it was the employerrsquos time the value was 11 lower when it was the
respondentrsquos money and 11 larger when it was the employerrsquos money This indicates that the
respondent places slightly less importance the employerrsquos time than their own time which is to be
expected if the respondent is primarily taking their own preferences rather than the companyrsquos into
account The variations do seem slight and again raise concerns about the interpretation of the SP
results
Turning to the tolled road SP exercise (SP3) for business travellers the reimbursement was based on
the question ldquoif you were to travel on a tolled motorwaytrunk roadurban road who would pay the
toll costsrdquo It was found that the toll coefficient would not be zero even for those who had all the
toll reimbursed Tests were conducted for strategic bias against tolling but this had little effect on
the non route constant terms
The values from the SP1 and SP3 exercises are reported in Table A36 for all three purposes Despite
one exercise relating to tolls and the other to other car costs which might be seen as causing a
difference due protest against tolls we see little difference between the commuting and other
values for the two exercises We might then conclude that there are other factors causing a
difference between the two results Note that SP3 does not have car passengers and for business
travellers in SP1 these had higher values This would account for some of the difference
11 There was a second SP exercise but it did not relate to business travellers Hence the second SP exercise for
business travellers was the third SP exercise (SP3) offered
55
Table A36 SP1 and SP3 valuations from HCG et al (1999) ‐ pound per hour
Business Commute Other
SP1 73 32 26
SP3 48 32 35
Note Reproduced from Table 104
However it is a little concerning that the SP3 exercise which aims to provide business valuations
more in line with the employers yields lower business valuations than the SP1 valuations which are
intended to be personal values
Repeat Newcastle Study
Unlike the original study business travellers were here asked for RP information in addition to
conducting the SP exercise And two SP exercises were used one was an exact repeat of the
Newcastle route choice SP exercise (SP1) whilst the other was a simple time and toll trade‐off (SP2)
Business travellers were told to bear in mind company policy on cost reimbursement when
answering the SP exercises
The results for the three sets of data are presented below split by journey purpose As expected
the 95 confidence intervals expressed as a proportion of the central estimate are much tighter for
the SP data given their larger samples We observe the business SP values to be larger than the non‐
business values However this can hardly be taken to indicate that respondents have followed the
instructions on reimbursement since we would have reasonably expected much higher multiples
than apparent here The study mean labour cost is 309 pence per minute and is only a little lower
for shorter distance trips
Table A37 Valuations (pound per hour) from Repeat Newcastle Study (from HCG et al (1999)
Business Commute Other
RP Value 95 CI Obs
68 plusmn89 189
24 plusmn39 453
57 plusmn73 222
SP1 Value 95 CI Obs
36 plusmn20 1070
23 plusmn12 2834
22 plusmn20 1528
SP2 Value 95 CI Obs
26 plusmn12 1583
14 plusmn8 3721
20 plusmn9 1661
Note For reference we provide the cost saving value of time of pound185 per hour
Whilst the RP business values are somewhat larger than the corresponding SP values they are not
high and very much less than the wage rate In any event the RP values are also higher than the SP
values for other trips and thus there could well be reasons other than cost reimbursement and
company policy issues that are leading to a discrepancy We would have to conclude that neither
56
the RP nor SP values support the cost savings approach but equally admit that there are some
uncertainties as to what the SP values represent and recognise the imprecision of the RP estimates
Implications for Appraisal
The employer value was derived using the modified cost saving approach of 147 pence per minute
to which is added the employee value of 67 pence per minute The latter was based on SP1 for
those who used their own time and money Note however that the measure of p used (p) was the
average amount of time spent working rather than the amount of time spent working that would be
lost as a result of the time saving More importantly the value of 67 pence per minute should have
been weighted by r which on average is 0463 Thus the total value of time would have been 178
pence per minute of which 310 is the employeersquos value This is 58 of the average gross wage rate
in the sample obtained
Commercial vehicles were also covered SP methods were used to get employerrsquos value of time
saved The study concluded that ldquoas with the Hensher approach for working time we would
recommend adding the personal VOT of the driver and any accompanying staffrdquo
Netherlandsrsquo Experience
The Mott MacDonald (2009a) study identifies the Dutch National Model (LMS) as containing time
and cost effects estimated directly to mode and destination choices Apparently these models have
not been used in evaluation with the reason given being that due to the log‐cost specification the
value of time is not constant with journey duration Notably Mott Macdonald et al (2009a) state
that with respect to the business time valuation ldquothe results obtained may have been similar to the
wage rate at the timerdquo whilst recognising that ldquotrends in societal time use and technology could
change this in futurerdquo
The Dutch national value of time studies of the 1980s and 1990s (Hague Consulting Group 1990a
Hague Consulting Group 1998) indicate that business travellers work during their journey and
particularly for rail the amount of time spent working has increased over time The results of a more
recent Dutch national study are soon to be published and this will presumably provide more insights
into inter‐temporal variations in the Hensher parameters
The Dutch 1988 value of time study (Hague Consulting Group 1990a) used travel demand survey
data covering mode and destination choice including longer distance travel to develop Revealed
Preference models Whilst the business values for car driver were 76 higher than for commuting
and over 5 times leisure with respective figures of 64 and 33 times for train passengers the
standard errors for the business values exceeded the central estimates
Whilst imprecisely estimated the business values are in line with the wage rate The report states
that ldquohellip Revealed Preference values helliphellip should in principle reflect the valuation of the employer as
wellrdquo The SP results were claimed to relate to individualsrsquo personal valuations since business
57
travellers were instructed to consider the SP alternatives as if they were making the exact same
journey but in their own leisure time and at their own expense Noticeably the RP and SP values for
car and train and commuting and other were similar but the SP values were 42 and 39 lower for
car and train business travellers respectively
The business valuations were intended to reflect VL and can be compared with the private leisure
valuations The ratios were 191 to 244 for car depending on the type of time 175 for train and
183 for bustram These presumably reflect the larger incomes of business travellers
In further analysis of the SP experiments offered on public transport users (Hague Consulting Group
1990b) the cost coefficient for business travellers was found to be 37 smaller where the employer
reimbursed some or all of the cost This is surprising given respondents were told to assume that
they would pay for all costs directly so that the values reflect travellersrsquo personal valuations It is
concluded that ldquothe results above indicate that this approach has not been entirely successfulrdquo
The 1988 Dutch study was extended by making use of questions asked in the survey and relevant to
the Hensher approach (Bradley and Gunn 1991) This included the p q and r terms The relevant
questions (for car) asked were
Did you do some work during this car trip which you would otherwise have had to do in the
office If yes how long was it in total
How many minutes would the work in Q13a (above) have taken in the office
Suppose your travel time is 20 minutes less than your current one how would you allocate
this 20 minutes time saving
Table A38 1988 Dutch Study ndash Implications of Modified Hensher Equation
Mode MPL Employer Employee Total MPL
Car 4469 304 212 376 84
Train 3652 157 140 231 63
Bus 2846 118 113 172 60
Note Values in Dfl per hour in 1991 prices The employee value has here been weighted by r and
unlike the report is that which enters the total value reported here
For car train and bus business travellers r was on average 034 053 and 048 The corresponding
figures for p were 002 011 and 003 respectively and for q were 090 089 and 093 respectively
Note however p was not the amount of saved time that would have been spent working but the
amount of time spent working (p) The implied values using the modified cost savings approach are
set out in Table A38 For all modes the value of time is less than the wage rate (MPL) As would be
expected the reduction is larger for public transport modes where the opportunity to work is
greater
58
The repeat Dutch study conducted in 1997 (Hague Consulting Group 1998) followed the same
approach for business travel of using SP to estimate employee valuations and using a modified cost
saving approach to deduce employer valuations Summary statistics relating to the business value of
time are provided in Table A39
For car train and bus business travellers r was on average 045 063 and 065 The corresponding
figures for p were 004 016 and 003 respectively and for q were 090 089 and 093 respectively
The q values on average varied very little between 1988 and 1997 whilst it is only for rail that we see
sizeable increases in the amount of working while travelling
As a result of these changes to p and particularly r the employersrsquo value of time for all modes fell
quite appreciably between 1988 and 1997 The employersrsquo values for car train and bus were 262
117 and 122 in 1997 with the 1988 study providing values of 286 251 and 274 in 1997 prices
Increases in the productive use of time can creditably be related to the greater use of laptop and
mobile phones but it is unclear why the proportion of travel time saved converted into leisure
should increase Indeed given many journeys would be made in normal hours it is surprising the
the r values are so large In reality travellers might not be allowed to convert time savings into
leisure at the rate they perceive and report
Table A39 1997 Dutch Study ndash Implications of Modified Hensher Equation
Mode MPL Employer Employee Total MPL
Car 5097 262 239 370 73
Train 5141 117 192 238 46
Bus 3757 122 116 197 52
Note Values in Dfl per hour in 1997 prices The employee value has here been weighted by r and
unlike the report is that which enters the total value reported here
Swedish Experience
The Swedish 1995 study (Algers et al 1995) contained a section aiming at measuring the Hensher
parameters The relevant questions posed to business travellers were
Did you work during the trip
The proportions working during the trip were 48 for car 25 for air and 56 for train
Unsurprisingly the figure for rail is large but that for car is also high These respondents were asked
In that case how much (percent of total in‐vehicle time)
The proportion of the total in‐vehicle time spent working (p) was 30 for car 50 for air and 50
for train The relative productivity question took the form
How long time would these tasks have taken at your normal workplace
59
The mean for those working during the trip was that they were 93 as efficient as at the office
Travellers were next asked
If you hadnrsquot had the possibility to do these tasks during the trip how much of it (in ) would
you have done during a) normal working hours b) overtime c) leisure time d) not at all
50 would have done the work during normal hours and for 6 it would have been overtime It
would have been done in leisure time for 36 and not at all for 8 This was followed by
If the value of working time at your normal working place is 100 how high would you
value your working time on the train
The mean value was 65 with 17 stating between 0 and 33 31 stating between 33 and 66
and 52 stating between 67 and 100 Business travellers were then asked
If the travel time of this trip had been shorter how much of this time had you spent working
and how much would have been leisure time
This question was asked in two versions one where the travel time reduction meant that the
traveller would start later and one version where the traveller would arrive earlier On average 30
of the time would be used for work Table A310 summarises the results for the Hensher parameters
split by mode
As tends to be the case across studies the relative productivity of work done while travelling and at
the office (q) is close to one overall However as can be seen there are several cases where q is
somewhat over 1 and this is not plausible This is something the study wrestled with including
distinguishing between relative productivity whether the activities would have been undertaken
outside of travelling and the value of the activities being undertaken as addressed by two of the
questions above Whilst it did appear that the activities would have been undertaken it was
concluded that they had only two thirds of the value12
The p values are generally low with a greater tendency to work on public transport modes as
expected whilst the higher r values for rail and air and indeed long distance bus may well reflect the
longer duration of these journeys and hence a greater likelihood that travel is undertaken in
personal time or in unsocial hours Nonetheless concerns were raised about the high values of r
and it was concluded that the total amount of work should not fall after a time saving thereby
setting 1‐r to the maximum of 1‐r or pq)
12 The study therefore weighted q values by 065 It also assigned the same value to VW as VL In our calculations later we
have for consistency with other studies used the reported q values set VW to zero and weight VL by r
60
Table A310 Swedish Value of Time Study p q and r values (Algers et al 1995)
Mode p q R
Car 014 101 054
Car Self Employed 010 120 066
Air 013 097 084
Air Self Employed 011 102 085
Train Inter 028 103 078
Train Self Employed 023 108 075
X2000 028 104 079
Train Regional 018 115 082
Bus Inter Urban 013 093 085
Bus Regional 017 126 086
Comp Car 019 111 047
In order to estimate the private value of time VL travellers were subject to an SP experiment where
changes in travel costs were to be covered with the travellerrsquos own money A special study similar
to the main study was also carried out on self‐employed travellers Presumably for them the
lsquocompanyrsquosrsquo value of time would be completely internalized Nonetheless the results were not
markedly different from those in the main study
Finally an SP study where the respondents were told to choose ldquoaccording to company guidelines
and rulesrdquo was carried out This gave considerably higher valuations especially for air and train trips
Table A311 summarises four estimates of the business value of travel time savings the Hensher
equation with the original parameters and with VW set to VL the Hensher equation with the
original parameters and VW set to zero which are obviously lower and indeed somewhat so figures
which set revised values for q (q=065 (1‐r)gtpq for each individual) given concerns about the q and r
values which leads to higher than original values and the lsquocompany guidelinesrsquo WTP choice
experiment
Table A311 Swedish National Study Various Values of Business Travel Time (Algers et al 1995)
Original VW = 0 Revised WTP
Car 145 118 167 150
Air 122 107 141 223
Train 100 70 134 201
The original values are pretty much between the VW=0 and revised values but the WTP values for
rail and air are very much higher These values offset the higher p values for train that lead to its
otherwise relatively low values Whilst the WTP values for rail and air might be regarded to be too
high around twice as high as those of the Hensher equation with the original parameters we can
point out that the car WTP values are reasonably in line with the other Hensher figures and we
might expect air and train business travellers to have relatively high values because of more senior
positions longer journey length travel at inconvenient times and relatively high productivity at the
destination
61
Norwegian Experience
The Norwegian 1997 study (Ramjerdi et al 1997) was similar in many ways to the Swedish 1995
study A number of questions aimed to estimate the Hensher parameters and the survey also
contained a choice experiment where changes in travel costs were covered with the respondentrsquos
own money to capture VL The p q and r questions are reproduced below
How much of the travel time is within your normal working hours
Do you get any compensation for travel time outside normal working hours
Permissible responses were wage wage and overtime half wage can get time back through
rescheduling other work no and donrsquot know
Did you work during the trip (eg made a call read write)
If the traveller replied yes then they were asked
How much time did you work and
How long would the same task have taken at your normal workplace
Note that in Fowkes et al (1986) terminology these questions elicit p and r The table below
summarises results for inter‐urban and urban travel respectively It is not clear why the q values are
so low and out of line with values typically obtained of around 10 The r values tend to be large for
the inter‐urban modes presumably because of the prevalence of travel outside of normal working
hours due to the distances involved The figure falls noticeably for urban trips Productivity levels
also seem atypically low when compared with other studies but this might also be a function of
travelling in personal time The study offers little by way of explanation for some surprising values
particularly for q which are out of line with the evidence from other studies
Table A312 Norwegian Value of Time Study p q and r values (Ramjerdi et al 1997)
p q r
Inter‐Urban Car 003 032 057
Inter‐Urban Air 007 028 064
Inter‐Urban Train 018 039 072
Inter‐Urban Bus 006 020 074
Inter‐Urban Ferry 003 019 063
Urban Car 021 002 039
Urban Public Transport 030 007 043
The SP exercise clearly stated that the respondent would directly incur or benefit from any cost
variations but it did not state what the time savings would be spent on The authors segmented the
models according to the proportion of the time (r) that would be used for leisure For car bus train
62
and air the values of time were between 18 and 58 lower when r exceeded 90 than when it
was less than 10 This suggests that care needs to be taken in specifying what the time saved
would be used for
The implied values of time using the Hensher approach are set out in Table A313 In the lsquoFull
Hensherrsquo equation VW is set equal to VL This seems difficult to justify as argued by Fowkes (2001)
and the very much higher values are unwarranted The lsquoModified Hensherrsquo approach sets VW to
zero In both cases MPF is assumed zero The modified Hensher approach generally provides values
less than the cost savings approach although notably air users are assigned higher values
presumably due to their high values of VL
Table A313 Norwegian National Study Various Values of Business Time (Ramjerdi et al 1997)
MP Full Hensher
Modified Hensher
VLLeisure VoT
Inter‐Urban Car 185 259 (140) 181 (98) 215
Inter‐Urban Air 201 379 (189) 267 (133) 202
Inter‐Urban Train 153 148 (97) 116 (76) 219
Inter‐Urban Bus 132 90 (68) 75 (57) 123
Inter‐Urban Ferry 161 172 (106) 130 (81) 123
Urban Car 170 190 (112) 137 (81) 223
Urban Public Transport 131 152 (116) 106 (81) 276
New Zealand Study
A major New Zealand value of time study was reported by Beca Carter Hollings and Ferner et al
(2002) and a part of this covered the estimation of the p q and r values through telephone surveys
of 600 business travellers including professional drivers
p q and r evidence
The use of a telephone survey contrasts with intercept surveys (for instance on train or at service
stations) in two important respects Firstly we can be sure the questions are answered after the
journey has been completed Secondly the farther in the past was the actual trip then the greater
the potential problem of recall
The questions asks in investigating p q and r are set out below
I am now going to ask you about some activities that people do while travelling Please tell
me if you did any of these as part of your job (that is not for personal reasons) on that
specific trip
Permissible responses were use a phone reading use a computer dictation discuss workbusiness
with travelling companions or none of these This was followed by
63
Did you do anything else while you were travelling that was part of your job (not including
driving for professional drivers)
If the answer was yes then the respondent stated what the activity was
The interview then proceeded to determine how much time during the course of the journey was
spent on each activity separately
You said your trip took hellip hours hellip minutes How much of the travelling time did you spend
(talking on the phonereadingusing a computerdictatingtalking to travelling companions)
to do with your job
This p question was followed up with questions on relative productivity
If you hadnrsquot spent time (activity description) while travelling when would you have done it
Permissible responses were in other time at work while travelling tofrom work during personal
time (outside work hours but not while commuting) would not have done it at all and other This
was followed by
Would (activity description) have taken longer about the same time or less time if you had
done it (at work in own time etc)
The response categories were about the same more time and less time and the latter two were
followed up with questions on the amount of time more or less The next question related to what
they would do with any saved time
Now with the same trip in mind I want you to imagine that recent improvements to the
(road and traffic systembus servicerail service) meant that you knew you would save some
travelling time on this trip Do you think that you would have used that time for more time
working more personal time some of each)
Followed with
How much if each (frac14 work frac34 other frac12 work frac12 other frac34 work frac14 other)
The final question relating to the Hensher equation was
You said you spent (hours minutes) (activity) during your (hoursminutes) trip If the (road
and traffic systembus servicesrail service) improvements meant that your journey was
shorter would it have reduced the time you spent on any of these activities
If the answer was yes then they were asked
64
If your journey had been say 5 minutes shorter how much less time would you have spent
on (activity)
Hence questions on p and p were asked alongside q and r
Almost 60 of trips involved no work activity while travelling and p was on average 022 but with a
strong negative correlation with distance The relative productivity of activities in travel compared
to elsewhere slightly exceeds one with travel based activities around 7 more productive on
average However a cap of one was applied so that working while travelling could not be more
productive than elsewhere for any individual whereupon the central estimate for q was 093
The proportion of time saved that would be devoted to leisure is around 28 with relatively little
variation across occupations However the response categories were crude The mean reduction in
time spent on work activities for those working during the journey was only 7 implying a value of p
overall of 0028 This is not surprising given the dominance of car
VL was not estimated in this study and instead the behavioural value for all non‐work travel was
used instead The latter can be expected to understate VL not least because business travellers have
higher incomes
As a result of applying a modified Hensher correction that is ignoring MPF and setting VW to zero13
the car driver kilometre weighted business valuation falls by 18 The adjustments are small
because the scope for working during the course of a car journey is relatively limited and the time
savings would not be predominantly at the expense of working while travelling The reduction for PT
users is 24
Switzerland Value of Time Study
As part of this study which primarily addressed private travel a small sample of 62 answered
questions relating to the Hensher parameters 16 of these would not work during a business journey
and 19 stated that any time saved would not be used for work
The questions were
Do you work during your business trips (ie telephone read write discussion with
colleagues or clients etc)
Responses were never or normally If the answer was normally then the amount of time was
established This was followed with a question relating to q
13 Note that VL was correctly weighted by r
65
How long would this work take at your workplace
which could be the same time or X minutes on average shorter or longer As for r respondents were
asked
Imagine that improvements in travel conditions were to reduce the journey by 15 minutes
How would you use this time
Responses distinguished between work time (at workplace with clients etc) own time and a mixture
of the two A similar question was asked relating to p
Imagine that improvements in travel conditions were to reduce the journey by 15 minutes
How long would you then work during the journey
Permissible answers were the same time X minutes less or not at all
The mean level of working while travelling across the sample was 64 whilst relative productivity (q)
was 98 The proportion of saved time that would be used for work was 49
The study concluded that ldquoBased on these average figures we obtain a business VTTS of 2135CHFh
(compared to a wage rate of 6649 CHFh) This seems implausible in relation to other references
both in the level and in its relationship to other purposesrdquo It is because the employerrsquos value is
negative given that pq is large relative to 1‐r Essentially the time is being transferred from working
while travelling to leisure and hence is a loss to the employer We can note three things Firstly it is
not p but p which is measured and if the work is so important it may still be done after time
savings occur whereby p will be much small than p Secondly the figure of p is very large relative
to evidence from other studies Finally the sample is small
We have included this Swiss study for completeness but little emphasis should be placed upon it as
far as business travel is concerned given the small sample and strange results Nonetheless it does
point to some lsquounsavouryrsquo implications when pq is large relative to 1‐r
UK Rail Travel Time Productivity
This Study of the Productive Use of Rail Travel (SPURT) is reported in Mott MacDonald et al (2009a
2009b) It is one of the first and certainly the most comprehensive examinations in the UK of the
amount of time spent working on trains by business travellers and the activity consequences of time
savings
The study is useful for several purposes Firstly in estimating p q and r values and working through
the implications for business valuations of time savings in the rail market Secondly in inspecting
how these parameters might vary across a range of situations Thirdly in undertaking SP research to
66
obtain personal valuations of time savings for those undertaking business travel including crowding
and other benefits Finally it provided a review of some important studies
p q and r Evidence
A sample of 1660 valid and checked questionnaires were obtained from on‐train surveys conducted
in Spring 2008 Respondents were asked to complete the questionnaire ldquotowards the end of the
train journey you are makingrdquo to be returned by mail A very creditable response rate of 35 was
achieved
Respondents were asked
Could you please estimate the amount of time you spent on this train doing each of the
following activities
Permissible responses were settling down work activities related to employment personal
activities and preparing to disembark Responses could be in minutes or proportion of overall
journey This was followed by
Which if any of the following work activities related to your employment did you do on this
train
Response categories were none prepare for a meeting make or receive business callstexts talk to
colleagues use laptop use PDABlackberry and other work related to employment
Respondents were then asked to indicate on a lsquotimelinersquo when they undertook work related
activities during the course of the journey This seems to be a novel and well worthwhile feature of
the study
With regard to the relative productivity of working while travelling and in the usual work
environment the respondent was asked
Approximately how long would the work‐related activity have taken you if you had done it at
your normal place of work
Permissible responses were about the same time more time and less time In the latter two cases
the respondent was invited to state how many more or less minutes Whilst it is possible that some
things can be done more productively while travelling say because there are fewer disturbances
this is offset by the range and value of activities that can be done in the normal workplace being
higher
67
There were then a set of questions relating to how journey time variations which varied from 10
minutes for the shorter journeys through 15 minutes to 20 minutes for the longest would impact on
work undertaken Two questions related separately to a shorter and a longer journey
Suppose this rail journey was scheduled to last 101520 minutes longer (shorter) how long
would you have spent undertaking work‐related activity on train
The answers could be the same or more or less time with the amount specified Following on from
this was a question on the use of the time saved This was
If this train was scheduled to arrive at your destination station 10 minutes later (earlier)
would you have spent the additional time working on the train (do you think you would have
worked or not in the 10 minutes saved time)
For earlier arrivals permissible responses were not worked worked in usual workplace worked in
other workplace worked at home worked elsewhere (eg cafeacute hotel) and other For later arrivals
the responses were spend all of the additional time working on train spend some of the additional
time working on the train spend none of the additional time working on the train and donrsquot know
Other questions related to levels of crowding and its impact on productivity presence of facilities to
support working while travelling and detailed activities undertaken during the journey
Around 80 of rail business travellers in Spring 2008 are now working during a train journey with
82 working on the outward leg and 77 on the return journey This is contrasted with an estimate
of 52 from the National Passenger Survey (NPS) of 2004 and is facilitated by more power points on
trains and more Wi‐Fi connectivity This was over a period of only 3frac12 years and is therefore a large
increase The NPS did not reveal the actual amount of time spent working Although not
undertaken on a comparable basis it was estimated that 30 of journey time was spent working in
2004 increasing to reported levels of 57 in 2008
Across both directions of travel on average business travellers spent 46 of travel time working in
2008 which represents p and this contrasts with a value for p of 041 However the latter does
vary across time bands This value of p is high compared to other evidence and presumably a
contributory factor is that it is the most recent rail evidence and we would expect p to increase over
time
A key issue is how productive this is relative to work done in the office environment It was found
that there was little difference with train time having 97 of the productivity of work‐place time
This falls to 89 in crowded conditions where 90 or more of seats are occupied but hardly varies at
all with journey length The credibility of these results can be questioned
Of the time that is saved after an earlier arrival on average 48 of that time would be spent working
off‐train although this varies by factors such as journey length and direction of travel This r value of
68
052 is high However it would be difficult argue that the main reason is because of the long
distance involved since only 19 of journeys exceeded 90 minutes
Explaining travel behaviour14
There are quite a number of studies that provide estimates of p q and r but there has been little
research conducted into how the parameters vary across different circumstances
A novel feature of this study was that the questions set out above were subject to an extensive
amount of segmentation by relevant factors although without conducting the detailed empirical
analysis to systematically explain and quantify how these figures vary across individuals travel
conditions and journey characteristics so as to have predictive models of time use
Although the vast majority of the data covers trips of less than 90 minutes it is interesting to
observe how the various parameters vary with journey length These are reported in Table A314
below
Table A314 Hensher Parameter Variation by Journey Length
p p q r
lt 45m 060 041 098 048
45‐89m 035 049 097 051
90‐149m 028 049 098 056
150m+ 022 049 096 065
The relative productivity varies little with distance unsurprisingly whilst we might expect r to
increase with distance as more trips are then made out of normal office hours The average level of
productivity (p) varies little when we might have expected some downturn for longer distances
although it is not surprising that it is lowest for short distance journeys In contrast p quite clearly
decreases with journey duration This seems realistic there will be less pressure on working time
on longer journeys and hence the amount of productive effort foregone will be less
The type of activities and amount of productive time (p) undertaken during a train journey varied
generally in an expected manner with a range of factors such as direction of travel occupation
flow type crowding and on‐board facilities all having a bearing Interactions between variables were
apparent whilst there were variations in effect between the proportion working and the proportion
of time spent working The timing of work undertaken peaks earlier in the journey and this is a
possible explanation of why p is less than p Perhaps surprisingly there was little difference
between first and standard class in the propensity to work on the outward leg although a 10
percentage point difference was apparent on the return leg
14 The discussion below is based on our understanding of the significant amount of outputs from this
important study However the discussion is often detailed and in some cases not easy to follow or interpret
69
Less attention was paid to variations in p q and r with the distance segmentation reported above
being the most significant analysis and there being no clear effect from the amount of time saved on
p The exception to this was crowding levels where a number of segmentations were presented
Crowding is potentially a key issue and as far as we are aware this study provides the first insights
into how crowding impacts on the Hensher parameters although there is a considerable amount of
evidence on how crowding impacts on valuations (Wardman and Whelan 2011) Unfortunately
though and as also applies to the examination of distance effects the analysis of the crowding
issues was hindered by small samples in the more crowded categories
It was only at load factors over 90 with some standing that the relative productivity is impacted At
that level q falls from around 1 to around 09 We can but speculate that it will be somewhat lower
when standing is involved but further research is required on this issue not least because one could
imagine that crowding would have a larger impact than this study revealed
Even if we accept that q does not vary greatly with load factor providing if it is possible to be seated
we would expect the ability (or indeed willingness) to work during the journey to fall with the load
factor The results with regard to crowding and productivity are not conclusive but it appears that
at 75‐90 load factor 50 of the journey was spent working (ie p = 05) At load factors over
90 (without standing) it was 38 For passengers who are forced to stand the evidence denotes
that p might be halved
The level of crowding in terms of proportion of seats occupied did not greatly affect whether work
was undertaken during the course of a journey It was only when the conditions on the departing
train involved (a few) people standing that there was a significant drop‐off in the proportion working
during the journey When related to the proportion of the journey the respondent was seated the
results are limited by the ability of most to be able to sit for most of the journey The study states
ldquothe conclusion remains that work activity is affected by whether one can sit all the time or not but
further insights are desirablerdquo and ldquothe effect of crowding andor seating availability needs
therefore to be explored furtherrdquo
The dominance of short business journeys might be seen as something of a weakness since they can
be expected to be somewhat different in nature as we have to some extent seen In addition a very
useful addition to the literature would have been a model that explains how p q and r vary over
different travel and personal circumstances
SP Research
An SP exercise was used in which business travellers had the opportunity to trade‐off their own
money against time variations and also crowding levels and the quality of mobile phone reception
However the crowding variable denoted the proportion of seats taken (25 50 75 100) but
did not indicate whether the respondent would get a seat or not
70
The manner in which the personal payment was introduced was that the company would provide an
allowance of pound15 for the journey Any increase in the SP exercise on a pound15 fare would have to be
paid by the respondent but conversely if the fare was less than pound15 they could keep the difference
This is now the standard approach for estimating VL The value of time that emerged varied with
model specification
This study also provides estimates of how VL varies with crowding levels with a fairly strong effect
on VL from crowding above the 75 occupancy level This is consistent with other crowding
evidence that load factor seems to have an effect at this sort of level prior to standing occurring
(Wardman and Whelan 2011) However it only examined crowding up to a level of 100 of seats
taken Even then it is unclear at that level whether the respondent would have got a seat or had to
stand the difference in valuation between the two can be expected to be large
An effect related to clear mobile reception was also detected but presumably this is not a significant
issue going forward
Appraisal Consequences
The consequences for appraisal values of time under various scenarios for the sample obtained were
calculated (Mott Macdonald et al 2009b) Four scenarios are reproduced below
Scenario 1 The cost saving approach
Scenario 2 Consider working time lost on the train but assumes all time saved is converted
to work time (r=0)
Scenario 3 For home based trips this takes into account leisure time increases in addition to
working time lost but assumes all time saved is converted to work time for other trips
Scenario 4 This is the short run modified cost saving approach with levels of on‐train
working and proportions of time saved as in the SPURT survey
The train user business valuations in pound per hour 2008 prices and income under each scenario
reproduced in Table A315
Table A315 Train User Valuations (pound per Hour) from SPURT (Mott MacDonald et al 2009b)
Scenario Employer VoT Employee VoT Total VoT
1 3909 0 3909
2 2511 0 2511
3 1089 707 1796
4 469 1780 2249
Note Fowkes (2001) has pointed out that many studies incorrectly do not apply the r weight to VL
effectively treating VW as VL If r is applied to VL then the total value of time falls to 1376 in
scenario 4
71
Departing from the conventional wisdom leads to a large reduction in the business travel value of
time The main effect is from allowing for the time spent working on train that would be lost which
reduces the value of time by 36 When the transfer to leisure time is taken account for home
based trips and the employeersquos valuation included the reduction is 55 In scenario 4 which
represents the modified cost saving approach the business valuation would be reduced by 43
increasing to a massive 65 when r is applied to VL
The study made a number of useful recommendations for further work notably extending to other
modes on‐going monitoring more focus on what it termed inter‐metropolitan trips and
behavioural modelling to determine how the ability to work productively influences the demand for
rail travel
Summary of p q and r values
A detailed summary is provided in section 312 of the main report which is not repeated here In
particular it contains
Table A32 (Summary of p q and r evidence)
Table A33 (Impact of Modified Cost Savings on Cost Saving Value of Time)
Table A34 (Comparison of Valuations)
Table A35 (Within Study Comparison of WTP and Modified Cost Saving Methods)
Section 315 arrives at representative figures for p q and r based on the evidence reviewed
A34WillingnesstoPayEvidence
We have also examined a large amount of willingness to pay evidence and in particular the extent to
which it aligns with the values implied by the conventional Cost Saving Approach We cover three
separate sets of evidence
A data set covering UK and mainland European values of time assembled as part of a recent
meta‐analysis (Wardman et al 2012)15
Some evidence from a recent large scale study in Japan
Evidence from high speed rail studies as it relates to business travel
15 Whilst this data set covers out‐of‐vehicle time reliability terms and departure time shifts it does not cover crowding
values We therefore cover these in the next section
72
This data is in large part separate from the willingness to pay evidence discussed in section A33
Whilst the evidence in section A33 covers business values from UK and European studies it was
generally based around the estimation of vL whereas the evidence covered here contains much
more business travel evidence and it covers high speed rail
A341ReviewofEuropeanWTPEvidence
We have at our disposal some data sets that have been assembled for the purposes of meta‐
analysis These are
A data set covering 3109 monetary valuations from 389 studies across 26 European
countries from 1960 to 2011 The UK provides 1862 valuations (60) across 233 studies
These money values are largely made up of IVT (60) but walk and headway each provide
10 whilst the remaining cover reliability variables wait time departure time shift and
congested travel time
Related to this data we have time multipliers for 1389 observations from 244 studies Of
these 63 are for the UK These provide for a more controlled assessment of time
multipliers since they all reflect lsquowithin studyrsquo variations than comparing money valuations
of various attributes with money values of IVT
We must though bear in mind that these data sets contain a relatively small proportion of business
values the former contains 14 of business valuations whereas the latter contains 9 Nonetheless
there is sufficient data to be able to conduct meaningful analysis
Our UK data does not include SP studies as far as we are aware where the value of time on business
travel was explicitly a personal valuation (VL) that is where the respondent was told that they
would personally incur any cost increases in return for times savings or receive cost reductions after
a time loss when undertaking a business trip
In the other European studies where personal values have been estimated they have been used to
calculate Hensher type business values The latter are contained in our data set and can be
separately identified
Our SP values are certainly not explicitly personal values but are derived from SP exercises offered
to those making business trips We therefore contend that there is a degree of ambiguity as to what
they represent Our impression is that most studies have taken a quite lsquocavalier attitudersquo and do not
specify what the respondent should assume in terms of company policy and who pays It would have
been a large task to go back to each study and determine this information and in some cases the
studies do not report the questionnaire The values are therefore dependent upon how
respondents interpreted the SP exercises presented to them
73
The sorts of insights that analysis of our meta‐data sets can provide are
To what extent are the estimated WTP business values of time in line with labour costs
given the cost savings approach is an appropriate benchmark
Given that the modified cost saving approach would lead us to expect rail values of time to
be lower than car all else equal is there any WTP empirical support for this
A related point is the modified cost saving approach might lead us to expect a falling
valuation over time as the opportunities for productive use of travel time increase
We might expect RP valuations to exceed SP valuations on the grounds that the latter do
not fully represent company policy Is this apparent in the WTP evidence and if so how do
the latter compare with values obtained by other means
Given SP evidence now dominates but without the resource to investigate what each SP
exercise might have been valuing in terms of personal or company values is there evidence
to indicate that SP based valuations vary according to relevant indicators such as whether
the purpose of the study was forecasting or the choice context was a real one
To what extent are the relationships between estimated business valuations and distance
mode and other relevant variables consistent with the different approaches to business time
valuation
In the cost saving approach time is time Is there evidence to indicate that for business
travel different aspects of time such as walking waiting and in‐vehicle attract different
weights
Section 313 of the main report contains a detailed account of our analysis of the assembled value
of time evidence for the UK and mainland Europe We therefore do not repeat it here
A342 RecentJapaneseEvidence
A major three year value of time study has recently been completed in Japan covering RP analysis of
motoristsrsquo route choices SP analysis and a meta‐analysis of a large number of Japanese values of
time It did not major on business travel value of time but nonetheless it provides some insights
The RP analysis was based on the 2005 Road Traffic Census and examined motoristsrsquo choices
between ordinary roads and an alternative that included ordinary roads and a tolled expressway
(Kato et al 2013) Short distance intra‐zonal journeys were removed as were trips where the time
expressway option was more than 70 minutes quicker or greater than 20 minutes slower It was
observed that in such circumstances there was little variation in the choice rate whereas between
74
these points the expressway option was observed to increase its share as the journey time
difference increased
Separate models were estimated for business travel commuting and other and Table A315 reports
the values of time
As would be expected with such large sample sizes the coefficient estimates were precisely
estimated with t ratios over 25 The value of time per person for business travel is not far short of
the average wage rate which at the time was 372 yen per minute but note that the distance
elasticity was estimated to be 077 which is very large and would imply implausible variations in the
value of time for even relatively small changes in distance
Table A315 Japanese Values of Time (Yen per Minute)
Sample VoT
Commuting 82068 245
Business 12328 339
Other 51621 210
Kato and Tanishita (2013) report a meta‐analysis of 261 Japanese values of time obtained from 68
papers between 1979 and 2003 The business values average 158 yen per minute in 2000 prices
from 15 observations contrasting with 409 for home to work from 40 observations and 558 for
leisure from 30 observations Note that the business values are largely inter‐urban and hence a
distance effect may have influenced the results as implied by the elasticity of 077 above whilst all
15 values were from RP studies16 which might also lead to higher values Indeed removing the air
studies with average values of 177 yen per minute leaves an average value somewhat lower of 83
yen per minute but still larger than the then average wage of 30 yen per minute
The meta‐model itself obtained a very low income elasticity of 031 and therefore we do not regard
it to be a reliable means of predicting absolute values of time for business travel or indeed other
forms of travel Notably the meta‐model found that RP values were over 30 larger than SP values
in line with previous UK meta‐analysis evidence whilst inter‐urban trips were 50 larger backing up
the distance effect above These findings might partly explain why the business values reported in
this study were so large
SP surveys were conducted in 2010 and based upon motoristsrsquo route choices The results based on a
web survey obtained very high values for commuting (874) and very low for business (111) The
paper based questionnaire seems to have obtained more reliable evidence with a business value of
519 yen per minute falling to 455 when estimated to combined RP and SP data The official
business value of time in 2008 based on the wage rate was 440 yen per minute
16 5 are route choice 8 are mode choice and 1 is destination choice Air travel is the focus of 3 route choice and
all of the mode choice studies and these can be expected to be large values
75
This Japanese evidence would if anything support the valuation of business travel time savings in
the conventional manner in line with the wage rate
A343 HighSpeedRailEvidence
Whilst this scoping study is not primarily concerned with rail this aspect of it relates to briefcase
travellers and rail is an important mode for this market segment Given this and that high speed rail
projects are of interest because they offer large time savings we here cover the WTP evidence that
relates to high speed rail of which we are aware This evidence is summarised in Table A318
There is some evidence from Eurostar (Wardman and Murphy 1999) but it might be regarded to be
a different market to domestic UK travel and it certainly generated yields very much higher values
than the potential High Speed rail studies in Britain as is apparent in Table A318 below
At about the same time and for a similar market Halcrow Fox (1998) used SP methods to examine
preferences towards a high speed link between Heathrow and Paris For point‐to‐point business
travellers and in 2010 prices and income the value of time was estimated at pound68 per hour This is
45 higher than the official value for rail However the sample relates to air travellers for whom
income levels will be relatively high
Steer Davies Gleave (2009) undertook SP exercises in the context of a new high speed line between
London and Scotland One related to the choice between car air and rail whilst another examined
the choice of access mode The estimated values are reproduced in Table A316
The high speed values are lower presumably due to a comfort effect in that time spent in the
proposed high speed train incurs less disutility than time spent in a conventional train Having said
that we cannot be certain that this is not the result of strategic bias in favour of a new high speed
service although it is commendable that mode specific valuations have been explored rather than
imputing all the quality benefit of high speed as a fixed amount regardless of distance as would be
the case if the conventional approach of specifying alternative specific constants had been pursued
The estimated car usersrsquo values are somewhat less than the official values of pound34 per hour Similarly
the estimated air and rail usersrsquo values are somewhat less than the pound47 per hour for rail travellers in
Webtag
Table A316 In‐Vehicle Time Values (Steer Davies Gleave 2009)
Air and Rail Users Car Users
Business Leisure Business Leisure
Rail 396 252 240 200
High Speed Rail 302 233 190 150
Air 361 353
Car 230 110
Note Values in pound per hour January 2009 Prices and Incomes
76
These business values are low compared to official recommendations Note that the business
values are not much larger than the leisure values although they are themselves large relative to
official values It may be that the business values reflect personal rather than company willingness to
pay the ratios would not be out of line with the VL values relative to personal leisure values
reported above
The estimated access time values are reported in Table A317 These were obtained from a separate
SP exercise related to access mode choice
Table A317 Access Time Values (Steer Davies Gleave 2009)
Rail Users Car Users Air Users
Business Leisure Business Leisure Business Leisure
180 120 290 120 350 180
Note Values in pound per hour January 2009 Prices and Incomes
For car users the values of access time for business travellers are higher than the values of IVT
although not by the customary amount and a premium of around 30 might seem appropriate For
air users it would seem that access time is valued more or less in line with IVT In contrast rail usersrsquo
access time on business trips is valued somewhat less than the value of IVT Whilst access time
multipliers significantly in excess of one are not consistent with the cost savings approach this
evidence taken as a whole is not inconsistent with the cost saving approach
The Atkins (2002) high speed line study for SRA used SP mode choice exercises amongst rail air and
car users covering high speed rail journey times The values of time were pound370 per hour for air
travel and high speed rail and pound307 per hour for car and conventional rail These are broadly in line
with official values at the time of pound264 per hour for car and pound370 for rail
Burge et al (2010) undertook an SP mode choice exercise to complement the long distance model
(LDM) estimated to NTS data The SP exercise covered car air existing rail and a new high speed rail
service with the travel attributes being in‐vehicle time cost access and egress time service
frequency rail interchange airport waiting time rail crowding and percentage of trips on time
The form of the cost parameter means that the value of time increases with cost and is largest for
those modes with the highest costs This restricts the usefulness of the value of time results since
the value of time increases as costs increase However the model finds little variation in the time
coefficients across air rail and car Access and egress has a 40 premium on rail and air time whilst
waiting at the airport is values slightly less than in‐vehicle time
Recent reworking of the Long Distance Model SP data (Bates 2012) obtained a mean value of time
for business travel of pound5676 per hour although with considerable variation around this depending
upon model specification The LDM itself provides a value for rail at its mean cost of pound5520 These
contrast with webTAG values of pound3412 for all users being 65 larger However a more appropriate
77
denominator is some kind of average of pound3374 for car drivers and pound4718 for rail If we take a simple
average given that air users will also have large values then we have a value of pound405 per hour The
estimated value is therefore 40 larger than labour cost The Bates (2012) reworking provides a
value for leisure travel of pound2130 per hour and access and egress multipliers in the range 12 to 14
Gonzaacutelez‐Savignat (2004a) offered SP exercises to current air users between Madrid and Barcelona
to examine the propensity to switch to a high speed rail option The value of time for business
travellers was 55euro per hour although the value of access time was somewhat less at 22euro per hour
with the value of leisure time not much less than the business value at 37euro per hour Our estimate
of the labour costs at the time is 10euro per hour but this is not specific to air travellers who may well
have higher incomes
In a related study (Gonzaacutelez‐Savignat 2004b) but instead focussing on car users between Madrid
and Barcelona and their propensity to switch to high speed rail business travellers were estimated
to have a value of time of 124euro per hour for short journeys (Madrid or Barcelona to Zaragoza) and
115euro per hour for the longer distance trips Relative to our estimate of 10euro per hour for gross labour
costs the values here seem reasonable
Wardman et al (1992) used an SP choice exercise to examine business travellersrsquo choices between
air and rail for journeys between Edinburgh and London The SP exercise specifically reinforced the
point that the respondent was to bear in mind company travel policy when answering the SP
questions What emerged was a value of time of pound30 per hour This is high even given that 80 of
the sample were current air users
The study speculated that because the fares offered were less than the current air fares which all
the air users were authorised to purchase then there is no constraint from company policy for at
least 80 of the sample It is then hardly surprising if the sensitivity to cost is low and the value of
time is high
A large scale SP survey was undertaken in Australia in 1987 that examined the potential for a very
fast train alongside air coach car and the current train service (Gunn et al 1992) Updated to 2010
prices and incomes the values of time obtained for car were AUD956 per hour and AUD444 per
hour for business and non‐business respectively The corresponding figures for air were AUD1050
per hour and AUD408 per hour The official value based on the gross wage rate is AUD422 per
hour These values clearly exceed the official values It is not beyond belief that values have been
influenced by strategic bias to the extent that travellers would like to influence policy regarding a
new high speed rail service
In a study of high speed rail between Sydney and Canberra the so‐called Speedrail project our
understanding is that the SP based values in 2010 prices and income were
Sydney‐Canberra market business AUD785 per hours
Sydney‐Canberra market non‐business AUD162 per hour
78
Intermediate markets business AUD31 per hour
Intermediate markets non‐business AUD175 per hour
What is interesting here is not only that there are differences in WTP values by flow but that the
relativities between business and leisure are far different at 48 for the Sydney to Canberra market
but only 18 for the intermediate markets The values for the Sydney to Canberra market somewhat
exceed the wage rate
Table A318 Summary of High Speed Rail Evidence
Study MPL OVTIVT Business Leisure
SP Instruction Comment
Bates (2012) 14 12‐14 266 Removes log cost of Burge et al (2010) and easier to interpret
SDG (2009) 08 06 08 07 06 07
088 amp 045 116 amp 059 097 amp 050 121 153 126
157 129 103 120 127 209
No specific Air and Rail Users Rail Air and Rail Users HSR Air and Rail Users Air Car Users Rail Car Users HSR Car Users Car Rail MPL value used for air
Gonzaacutelez‐Savignat (2004a)
50 04 149 Unknown Air Users Wage rate figure expected to be too low for air users
Gonzaacutelez‐Savignat (2004b)
12 11
‐ ‐
175 174
Unknown Short Long Car Users
Wardman et al (1992)
14 ‐ ‐ Consider company policy
Rail user official value used for MPL
Atkins (2002)
14 amp 101
12 amp 081 12 amp 081 14 amp 101
108 130 130 108
180 202 202 180
No specific Air Car Rail HSR
Wardman and Murphy (1999)
158 318
073 081
239 182
Consider company policy
Rail Users Air Users Official value for rail users
Halcrow Fox (1998)
145 na ‐ No specific Air users Rail user valuation used as base
Gunn et al (1992)
249 227
‐ ‐
‐ ‐
No specific Air Car
Speedrail 186 074
‐ ‐
48 18
Unknown Sydney‐Canberra Intermediate
Yao and Morikawa (2005)
239 231
077 080
279 269
Unknown Rail and Air Car and Bus Japanese evidence
Note 1 First figure is Car MPL denominator and second is rail MPL denominator This is the same as
Table 313 in the main report
79
Outwater et al (2010) examined demand for high speed rail in California offering an SP choice
exercise that covered car air and rail and another exercise dealing with access and egress mode
choice The business model reported also contains commuters but given the distances involved
there will be few of the latter The implied value of time in the main mode choice model was $6364
per hour nearly 3frac12 times larger than the $1845 per hour for recreation and other trips In the
access mode choice model the values were $48 and $15 per hour respectively a ratio only slightly
less than for main mode choice
Yao and Morikawa (2005) examined high speed rail in Japan Their mode choice model covered rail
air bus and car and was estimated jointly to RP and SP data The business model estimated to nearly
19000 observations recovered very similar values of time for rail and air and for car and bus of 1070
and 1033 yen per minute in 2000 prices Access time was valued slightly less at 826 yen per
minute In contrast the value for non‐business trips was 384 yen per minute across all modes
The evidence from this raft of high speed rail studies is that the values implied by the cost saving
approach are broadly supported It would be difficult to make a case in favour of the Hensher
approach with its typically lower values for rail on the basis of these findings Having said that the
sort of business travellers involved are likely to be more senior and to be travelling long distances
and these would tend to inflate the values although not necessarily their relationship to MPL The
large time savings on offer might also have a bearing but the studies provide little insight into how
the unit value of time varies with the size of the time saving
A35SpecificIssuesandInsights
In reviewing studies that have addressed the valuation of business travel time savings we can draw
out some common threads over and above the p q and r parameters and relationships between
different valuation methods covered in the previous sections Other more specific insights have
been provided by these studies whilst it is useful to draw somewhat disparate insights together to
inform our review
The specific issues we here examine are
Who pays for the time saving and who benefits
Self‐Employed and Employees
SP and company policy
Distance Effects
Crowding Comfort and Soft Factors
RP and SP
These issues are discussed in detail in section 314 of the main report
80
A36 Conclusions
The evidence we have reviewed does not tell an entirely consistent story On the one hand the
Hensher equation would imply in some cases and particularly for rail significant reductions on the
value of time of the traditional cost savings approach On the other hand the WTP evidence is more
in line with the values of the costs savings approach whilst multiplier evidence would indicate that
some premium should be attached to out‐of‐vehicle time and crowding
Section 3 of the main report draws together the evidence and hence we do not repeat it here In
section 315 it provides
A summary of the Hensher equation evidence
A summary of the WTP evidence
A summary of the insights evidence
A summary of the empirical support for and challenges to valuation methodologies
It also sets out
Recommendations for further Hensher equation research
Recommendations for further WTP research
Annex 3 References
Accent Marketing and Research Hague Consulting Group and Steer Davies Gleave (1989) InterCity
Business Travel Price Elasticity Research Prepared for InterCity Marketing Planning Manager British
Railways Board
Algers S Dillen JL and Widlert S (1995) The National Swedish Value of Time Study Proceedings
of Seminar F PTRC Summer Annual Meeting
Atkins (2002) High Speed Line Study Stated Preference and Revealed Preference Surveys Prepared
for Strategic Rail Authority
Bates J (2012) A Short Analysis of the Long Distance Modelrsquos Stated Preference Data 14th August
2012
Beca Carter Hollings and Ferner Steer Davies Gleave Forsyte Research and Brown Copeland and Co
(2002) Project Evaluation Benefit Parameter Values Prepared for Transfund New Zealand
Bradley M and Gunn HF (1991) Further Application and Validation of the Netherlands Value of
Travel Time Study
81
Burge P Rohr C and Kim CW (2010) Modelling Choices for Long Distance Travellers in the UK An
SP Analysis of Mode Choice Paper presented at European Transport Conference Glasgow
Fowkes AS Marks P and Nash CA (1986) The Value of Business Travel Time Savings Working
Paper 214 Institute for Transport Studies University of Leeds
Fowkes AS (2001) Principles of Valuing Business Travel Time Savings Working Paper 562 Institute
for Transport Studies University of Leeds
Gonzaacutelez‐Savignat M (2004a) Competition in Air Transport The Case of the High Speed Train
Journal of Transport Economics and Policy 38 (1) pp77‐108
Gonzaacutelez‐Savignat M (2004b) Will the High Speed Train Compete Against the Private Vehicle
Transport Reviews 24 (3) pp293‐316
Gunn HF Bradley MA and Hensher DA (1992) High Speed Rail Market Projection Survey
Design and Analysis Transportation 19 pp117‐139
Hague Consulting Group Accent Marketing and Research and Department of Environment Transport
and Regions (1999) The Value of Travel Time on UK Roads The Hague
Hague Consulting Group (1990a) The Netherlandsrsquo Value of Time Study Final Report Prepared for
Dienst Verkeerskunde Rijkswaterstaat
Hague Consulting Group (1990b) Further Analyses of the Netherlands Value of Time Study Public
Transport Survey Data Final Report to Ministerie Van Verkeer en Waterstaat
Hague Consulting Group (1998) Value of Dutch Travel Time Savings in 1997 Final Report to
Rijkswaterstaat ndash AVV
Halcrow Fox (1998) Project Isambard Demand and Revenue Study Final Report to British Airways
Hensher DA (1977) Value of Business Travel Time Pergamon Press
Hensher D A (2011) Valuation of Travel Time Savings in Handbook in Transport Economics ed
Andre de Palma Robin Lindsey Emile Quinet Roger Vickerman Edward Elgar Publisher London
United Kingdom pp 135‐59
Kato H Oda T and Sakashita A (2013) Valuation of Travel Time Saving with Revealed Preference
Data in Japan Further Analysis Paper to be presented at 13th WCTR Conference Rio de Janeiro
82
Kato H and Tanishita M (2013) A Meta‐Analysis of the Value of Travel Time Savings Evidence from
Japanese Passenger Travel Paper to be presented at Annual Transportation Research Board
Conference Washington
Mott MacDonald Hugh Gunn Associates TRI Napier University Accent and Mark Bradley Research
and Consulting (2009a) Productive Use of Rail Travel Time and the Valuation of Travel Time Savings
for Rail Business Travellers Final Report to the Department for Transport
Mott MacDonald Hugh Gunn Associates TRI Napier University Accent and Mark Bradley Research
and Consulting (2009b) Value of Working Time and Travel Time Savings Long Run Implications
Report Prepared for the Department for Transport
MVA Consultancy Institute for Transport Studies University of Leeds Transport Studies Unit
University of Oxford (1987) The Value of Travel Time Savings Policy Journals Newbury Berks
Outwater M Tierney K Bradley M Sall E Kuppam A and Modugula V (2010) California
Statewide Model for High Speed Rail Journal of Choice Modelling 3(1) pp58‐83
Ramjerdi F Rand L Saeligtermo IA and Saeliglensminde K (1997) The Norwegian Value of time Study
Part 1 TOslashI Report 379 Report to Ministry of Transport and Communications The Norwegian
Railways the Norwegian Public Road Administration and the Norwegian civil Aviation
Administration
Steer Davies Gleave (2009) New Line Programme Demand and Revenue Modelling Report Prepared
for Network Rail London
Wardman M Holden D and Fowkes AS (1992) An Analysis of the Mode Choice Behaviour of
Business Travellers between Edinburgh and London Technical Note 304 Institute for Transport
Studies University of Leeds
Wardman M Chintakayala P de Jong G and Ferrer D (2012) European Wide Meta‐Analysis of
Values of Travel Time Report to European Investment Bank
Wardman M and Whelan GA (2011) 20 Years of Rail Crowding Valuation Studies Evidence and
Lessons from British Experience Transport Reviews 31 (3) pp379‐398
Wardman M and Murphy P (1999) Eurostar Demand Forecasting Research Technical Note 425
Institute for Transport Studies University of Leeds
Yao E and Morikawa T (2005) A Study of an Integrated Intercity Travel Demand Model
Transportation Research Part A 39 pp 367‐381
83
ANNEX4 TRAVELTIMEUSEndashANEXAMINATIONOFEXISTINGEVIDENCE
A41Context
This is a contribution to the Institute for Transport Studies (University of Leeds) 2012 study for the
Department for Transport (DfT) entitled ldquoValuation of Travel Time Savings for Business Travellersrdquo It
is based on the assembly of a set of 66 potentially relevant articles and close review of around a
third of these The full bibliography is attached The purpose was to identify and examine existing
evidence on how people use and interpret their travel time particularly in the context of business
travel Views expressed in interpreting the evidence are those of the author
A42 Introduction
The orthodox wage‐rate approach in economic appraisal has at its heart a key assumption regarding
business travel time ldquoTime spent travelling during the working day is a cost to the employerrsquos
business It is assumed that savings in travel time convert non‐productive time to productive use and
that in a free labour market the value of an individualrsquos working time to the economy is reflected in
the wage rate paidrdquo (DfT 2012a) This has been a source of academic provocation which has
contributed to a growing number of pieces of work in both transport studies and mobilities research
in the social sciences concerned with peoplersquos use of and opinions regarding their travel time use
The implication of the assumption is that all business travel time is wasted time Academic studies
have set about gaining empirical insights into how travel time is used with in part an aim to refute
this implication Of course the appraisal of travel time focuses on travel time saved not upon travel
time used It has been argued that productive use of a proportion travel time does not necessarily
compromise the validity of the assumption above unless the saved time would otherwise have been
used productively within the journey
In 2005 a conceptual paper by Lyons and Urry was published which examined travel time use in the
information age and potential implications for economic appraisal This has become a point of
reference for many subsequent articles with over 170 citations ndash reflective of the scale of interest in
the topic of travel time use in recent years Empirical studies of travel time use employing a range of
methodologies can be found for the UK Netherlands Sweden Norway USA Japan and New
Zealand These have variously considered specific modes or journey purposes Some have involved
observational methodologies while others have employed self‐reporting There are in‐depth
qualitative studies which seek to elicit greater insight into the meaning of travel time use for
individuals There are few studies which specifically concern themselves with trying to examine
notions of productivity in relation to travel time use and those which touch upon this have not done
84
so in a way that would align with the parameters in the Hensher equation17 However there are also
insights in the literature concerning the changing nature of work in the knowledge economy which
raise if not answer some wider questions about how travel time and travel time savings are treated
in relation to ownership of time and productivity of time
A43 EmpiricalInsightsintoTravelTimeUse
It is important to stress that especially for information workers the forms of communication and
ways of equipping oneself and undertaking work are changing over time It is therefore important to
be aware that cross sectional empirical insights at a point in time may not hold true over time
Not all studies in the literature have sought to focus (solely) upon business travel or have
predominantly considered what have been referred to as lsquobriefcasersquo travellers It is appropriate to
summarise empirical insights according to mode of travel The literature has predominantly
concerned itself with public transport and rail in particular but t here are also some helpful studies
addressing car travel
Time Use During Rail Travel
On two occasions in 2004 and 2010 questions on travel time use have been included in the National
(Rail) Passengers Survey for Great Britain This survey instrument has the advantage that it captures
passengersrsquo views about the specific train journey they were on when receiving the questionnaire It
also has a limitation in terms of the scope of questions able to be asked ndash all being closed questions
with pre‐defined response options The questions have addressed (i) what rail passengers do with
their time on the train (ii) how worthwhile they consider this time to be (iii) how they equip
themselves for using their time and (iv) the extent to which they plan in advance how to use the
time on the train The response sample sizes for the 2004 and 2010 surveys were 26221 and 27556
respectively (however the comparative analysis between the two surveys (see below) used sample
sizes of 22866 and 19715 respectively)
Key findings for 2004 were as follows (Lyons et al 2007) 55 of business travellers spend some of
their time on the train workingstudying on their outbound journey (for 35 it is the activity they
spend most time on) the figures are 48 and 27 respectively for the return journey They are
more likely to be reading for leisure on the return journey Meanwhile 13 of commuters indicate
workingstudying as the activity they spend most time on (around 28 spend some time
workingstudying) Journey duration has an effect on what people do with their time with window
17 See Section 24 and Annex 1 for a fuller discussion of the Hensher equation He proposed a formula for
calculating the value of business travel time savings which attempts to account for the following the
proportion of travel time saved at the expense of work done while travelling (p) the productivity of work done
while travelling relative to at the workplace (q) and the proportion of travel time saved used for leisure (r)
85
gazingpeople watching showing a marked increase for journeys of less than 15 minutes in duration
Only 2 of respondents indicated spending most of their time being bored and 1 spent most of
their time being anxious Business travellersrsquo aligned as follows with one of these three statements
ldquoI made very worthwhile use of my time on this train todayrdquo ndash 27 ldquoI made some use of my time on
this train todayrdquo ndash 58 and ldquoMy time spent on this train today is wasted timerdquo ndash 13 (2 not
answered) While not specific to business travellers travellers overall reflected on the role of mobile
technologies in their travel time experience ldquo[o]ver a fifth of rail passengers to whom the question
applied considered having electronic devices with them made the time on the train a lot better
However nearly half of all passengers 46 considered electronic devices had not made the travel
time any betterrdquo There was a marked difference in opinion by respondent age with a declining
proportion indicating lsquoa lot betterrsquo with increasing age The results of this survey underlined the
heterogeneity of travel time use and experience with for example distinct differences in lsquotime
worthrsquo assessments for given types of main time use Unfortunately questions relating to the effect
of mobile technologies on travel time experience were not included in the 2010 survey The 2004
survey predates the launch in the UK of the first iPhone in 2007 the Kindle in 2009 and the iPad in
2010
In 2010 a core subset of questions on time use were repeated enabling what appears to be the first
case of longitudinal comparison of travel time use (Lyons et al forthcoming Susilo et al 2012) The
comparative analysis reveals a broad consistency overall over the six years in terms of the most
popular activities ndash reading for leisure window gazingpeople watching and workingstudying There
are two key findings in terms of change There has been an overall upward move in terms of
positively viewing time lsquoworthrsquo ldquoThere has been a 37 reduction over six years in the proportion of
business travellers indicating that their time on the train was wastedrdquo 34 of business travellers in
2010 considered they had made very worthwhile use of their time on the train compared to 28 in
2004 The other key change relates to the increasing availability and use of mobile technologies ndash
here applying to all passengers ldquoTaking netbooks and laptops together then the proportion of people
with such a device has increased by 77 in six years from 7 in 2004 to 13 in 2010 The proportion
of travellers who have and use a laptop computer has increased by 60 The proportion of people
with a mobile phone has only increased modestly over the six years However a much higher
proportion of those who have a phone with them are now using it [for any purpose] during the
journey ndash 54 compared to 36 for 2004 The proportion of people who have a music player and the
proportion who have one and use it have doubled in six yearsrdquo The National (Rail) Passengers
Survey between 2004 and 2010 also revealed an overall increase in the proportion of travellers who
were veryfairly satisfied with the punctualityreliability of their train and who rated the train very
good or good in terms of there being sufficient room for all the passengers to sitstand Perceptions
of level of service and the uptake of mobile technologies then have increased in tandem with an
overall increase in the sense of travel time being worthwhile Advance planning of how an individual
is going to use their time on the train seems significant ndash for all rail travellers individuals who have
planned a lot in advance are three times more likely to consider their time use very worthwhile
compared to those who have not planned at all and seven times less likely to consider their time has
been wasted
86
Drawing upon the question design used in the National (Rail) Passengers Survey in Great Britain
Gripsrud and Hjorthol (2012) examined responses from 1196 rail travellers in Norway in 2008 The
study revealed that ldquoa high proportion of ordinary commuters and business people work on board
while travelling by train ie 35 of commuters and 43 of business peoplerdquo It is found that 27 of
commuters responding to the survey indicate having travel time approved of as working hours by
their employer The figure is 53 for business travellers In this Norwegian study it was found that
ldquo[a]bout 40 of commuters and business travellers take a laptop on board the train and in total
25 use itrdquo These figures are considerably higher than those for the 2004 GB study though noting
above the changes in the GB context revealed by later 2010 data In the Norwegian study ldquo[m]ore
than half of all commuters and 41 of business travellers state that use of an electronic device
during the journey makes the trip more worthwhile than it would otherwise berdquo It was also found
that the majority stated ldquothat the use of ICT while travelling by train made the time pass more
quickly and about one third of the commuters and business travellers are claiming that they made
good use of the time on boardrdquo Only 10 of respondents in this survey indicated that their travel
time was wasted ndash lower than the findings for the GB study 4 years earlier
A study called lsquoSurvey on the Productive Use of Rail Travel‐time lsquo (SPURT) has examined productive
use of rail travel time for business travellers and the value of time savings The findings were first
made available as Fickling et al (2008) and subsequently as a published report (Mott MacDonald et
al 2009) The study undertook its own empirical work but first reviewed other key studies This
included work based on the National Rail Passengersrsquo Survey data from 2004 by TRi Napier for Virgin
Trains which applied an analytical technique to estimate activity durations It was found that ldquofor
journeys in the 1‐3 hour range 30 of the journey time (across all business travellers) was spent
working (43 for those business travellers who did some work)rdquo SPURT secured responses to a
questionnaire including a revealed preference section a stated intentions section a set of stated
preference games and some socio‐economic questions The survey found that ldquoaround 80 of the
business rail travellers reported undertaking work during their journey The longer the journey the
higher the percentage of travellers workingrdquo The study team in drawing comparison between the
2008 data and the 2004 data from the National Rail Passengersrsquo Survey found that ldquothe proportion
of business travellers who spend some time workingstudying as 52 in Autumn 2004 79 in Spring
2008 Whilst a like‐for‐like comparison of the percentage of time they spend workingstudying has
not yet been undertaken the two surveys yield estimates of 43 in 2004 (for 1h‐3h journeys) and
57 in 2008 again suggestive of a strong upward trendrdquo (Fickling et al 2008) The study also
examined crowding and found that while there was some impact on productivity even in crowded
conditions productivity could remain high The lsquoAverage [weighted] minutes change in the amount of
working time needed if the work was done at the officersquo was ‐1 when 25 of the seats on the train
were occupied compared to ‐56 when lsquo90 of seats occupied a few people standingrsquo (Fickling et al
2008) 87 of the journeys in the survey response sample were 45 minutes or longer in duration
40 were 90 minutes or longer (DfT 2009)
The most recent UK data in relation to rail travel comes from the April 2012 omnibus survey
commissioned by the DfT (DfT 2012b) This study estimated from its results that just over a quarter
of the public had used a long distance train service (a journey of over 50 miles) in the previous
87
twelve months Those respondents who had undertaken a long distance train journey were asked
for their last such journey to recall how they had spent their time It was found that ldquo[t]he most
popular ways that users had passed time on their last long distance train journey included reading
books magazines and newspapers (69 per cent) looking at the view (47 per cent) sending texts
making calls or sending emails for personal reasons (38 per cent) eating or drinking (38 per cent)
and using electronic devices to watch films listen to music play games or use the internet (37 per
cent) A majority (40 per cent) of users said they had spent most time readingrdquo 11 spent most time
doing work for their job (including work textcallsemails) ndash 20 spent some time doing this These
figures are comparable to (though slightly lower than) those from the 2004 and 2010 National Rail
Passenger Surveysrsquo results
Work by Russell et al in New Zealand employed a structured observation approach (812 passengers)
to examine what people do on trains and buses (Russell et al 2011) It was found that ldquonearly two
thirds of passengers observed spent some of their travel time looking ahead or out of the window
(653)rdquo This study also reflected on methodological issues and drew comparison with other studies
including an observational survey of 161 Bay Area Rapid Transport System users in San Francisco
(Timmermans and Van der Waerden 2008) and an observational survey of 84 train users in the
Tokyo Metropolitan Region (Ohmori and Harata 2008) The San Francisco study observed few
people doing more than one thing during their journey and with doing nothing being the case for
64 of observed travellers The study in Japan focused on a short distance train which departed
from Machida at 630am and arrived at Shinjuku at 704am It found sleeping to be the most
observed activity (67 of observed passengers) followed by 62 observed reading 17 were
observed doing nothing Authors for all three studies note limitations in the observation approach to
studying travel time use Russell et al caution against the assumption that just because someone
appears to be doing nothing they are in fact doing so suggesting that in fact they could be lsquodoing
somethingrsquo ndash ldquothinking planning remembering praying daydreamingrdquo
A further observational study has concerned London Underground users (Gamberini et al 2012) It
confined itself to the observation of seated passengers with 1722 passengers and 1965 occurrences
of coded activities observed The authors note official data which indicates the average time spent in
a single underground car to be 127 minutes 26 of observed activities concerned technology use
22 talking with other passengers and 18 reading a book or paper Men were statistically more
likely than women to be using at least one technology device As with the national rail insights where
journeys of less than 15 minutes have a stronger likelihood of lsquopassiversquo activities such as window
gazing being dominant passive activities are also common on the Underground when people are
travelling for only two stops However ldquo[f]or people leaving at the fourth fifth or sixth stop after
they got on the train passive occupations were not the most common activityrdquo The study also drew
attention to findings from a recent Which report revealing that ldquothe majority of mobile phone
owners would welcome mobile coverage as they travelled on the London Undergroundrdquo with
ldquoapproximately one third of respondents stat[ing] that they would use it to do work during their
tripsrdquo
88
Time Use by Car Drivers
By comparison to public transport fewer studies have examined travel time use by car drivers yet
this is important given the assumptions in the absence of data that such time use would be less
worthwhile or productive than that by train in particular because of the constraints to multitasking
of the driving task itself
Eric Laurier has been noted as one of the pioneers of in‐depth work into the use of the car as a
mobile office or place for activity (Laurier et al 2008) However the study that perhaps has most
salience for considering business travel time and value of time savings is one by Hislop (2012) He
undertook a survey of business travellers at a motorway service station (149 responses) and a set of
15 follow‐up interviews The survey evidence concerned individuals for whom journeys ldquowere
intrinsic to their work and involved travelling between diverse locations during the working dayrdquo
Nearly a third of respondents regularly (2‐3 times per week) used their car for work‐related purposes
and over half used their phone while driving either lsquoquite a lotrsquo or lsquoa great dealrsquo Hislop suggests that
drivers use their phones extensively whilst being aware of the distraction they cause because ldquothey
felt under pressure both to make use of their driving time productively and to deal with calls
regarded as urgent or necessaryrdquo He also found that ldquoa number of interviewees argued that driving
time could be used for thinking about workrdquo The study also explored driversrsquo use of service stations
finding that ldquobusiness travellers often utilized much of their time spent in their cars when parked to
communicate with remote people such as clients or colleaguesrdquo Car environments were seen as
ldquorelatively private spaces over which drivers had a reasonable level of controlrdquo At the same time lack
of space could inhibit ability to work prompting advice to car manufacturers about how design could
improve in terms of facilitating use of a vehicle as a working environment
A second study merits brief review for the principal reason of highlighting how change has occurred
over time in relation to mobile technologies and forms of communication A 1994 study looked at a
sample of 90 business people ldquostopping at roadside restaurants and service areasrdquo (Eost and Flyte
1998) Implicit in the reporting was that activities undertaken in the car were referring to those done
while the car was stationary and the principal focus was on paperwork as the medium The following
extracts from the paper itself reflect how 18 years ago mobile technologies were different in their
nature availability and use ldquoOf the 70 people who used a telephone to keep in touch the most
commonly used type of telephone was a fixed car telephone (39) with analogue cell telephones the
next largest category (28) Two of the case study respondents were expected by their company to
keep in touch using public telephones as were 18 of those in the interview surveyrdquo ldquoFifteen
interview survey respondents had a computer in their car [d]ata were usually sent to or from the
office only once a day or lessrdquo ldquoThe number of people using an in‐car computer was small although
it is likely to rise as more and more companies utilise computers in their business dealingsrdquo
ldquoCompared with office environments the use of computers for word processing in the mobile
environment was hardly ever mentionedrdquo
89
Time use by pedestrians
A study by Middleton (2009) provides a reminder that while receiving less attention in the literature
walking too can be a mode where travel time use has positive connotations for work productivity
The study examined walking in London using a mixed method approach including a postal survey
walking diaries and in‐depth interviews The author observes that ldquofor many residents walking is a
significant part of their day‐to‐day working life ndash they work whilst they walkrdquo To illustrate this
observation the following quote from a participant is offered
ldquoThe next few minutes are lost to me I must have walked past the theatre but didnt notice
as my brain has switched to thinking about brochure spreads and advertisements Its
amazing how I suddenly start conceiving ideas about work whilst walking along even without
realizing it Since I get paid to think I wonder if I should be paid for my walking But then
again I also get paid to be in by 9rdquo
Multi‐Modal Studies
Two studies examine travel time use across public and private transport modes Ettema et al (2010)
secured 662 responses to an activity‐travel‐communication diary in the Netherlands with the sample
skewed towards highly‐educated professionals It was found that ldquowith increasing travel time the
share of travellers not engaging in any activity during travel becomes smaller both for car and for
train For train the share working during the trip increases from 56 for trips under 30 minutes to
423 for trips longer than 90 minutesrdquo Further it was noted that ldquotravel mode is the major
predictor of working while travelling Working on the move hardly happens for car drivers and
passengers although it happens to some extent (49) on trips longer than 60 minutesrdquo
OrsquoFallon and Wallis (2012) have surveyed 512 Auckland and Wellington metropolitan area residents
in terms of ldquothe lsquoutilityrsquo of travel time when commuting to work on tertiary studyrdquo The study
explored peoplersquos estimated commute times against their stipulated ideal commute times ldquoThe
median existing or estimated commute time (EC) for all commuters was 20 minutes The median
ideal commute time (IC) of 10 minutes identified by our sample meant that 68 of respondents spent
more time commuting each day than they would have liked tordquo In relation to the statement lsquoI enjoy
the time I spend commuting to workrsquo 35 of those driving a car most frequently for commuting
strongly agreed or agreed the figures were 68 for walkcycle and 35 for public transport
Considering estimated commuting time to workstudy in relation to the statement the proportions
agreeing or strongly agreeing were as follows 0‐9 mins ndash 58 10‐19 mins ndash 47 20‐29 mins ndash 39
30‐39 mins ndash 32 40+ mins ndash 24 In other words lsquoenjoymentrsquo of the commute diminishes with
commute duration It was also found that those who enjoyed their jobs were more likely to enjoy
their commute The study found that ldquo[a]bout one‐fifth reported doing work or study activity
namely readingwritingtypingthinking while commuting One‐third (33) of commuters were
contented with their time spent commuting enjoying it and finding it a useful transition between
home and workrdquo
90
Understanding Business Travel Time
Gustavson (2012) undertook 12 semi‐structured interviews with travel managers in Sweden followed
by interviews with 22 employees in relation to their business travel (across modes ‐ it was noted that
lsquo[r]elatively few travellers in the study made business trips by carrsquo) He found that employers do not
tend to have explicit expectations about work during travel time ndash however expectations were
instead about ldquogetting onersquos work done in a satisfactory wayrdquo The study revealed that ldquoalthough
travellers often appreciate having good working conditions while travelling the first priority for many
frequent travellers is to minimize time spent away from home and family rather than to make
productive use of their travel timerdquo In this regard there were strategies to replace physical meetings
with virtual equivalents or to combine meetings associated with a given journey The author
identified four different attitudes to travel time and working time
1 Travel as any other working time ndash mobile workers whose work goes with them and is done
wherever they are including travelling
2 Travel on long distance journeys as a special kind of working time ndash ldquoan opportunity to perform
work tasks that demand undisturbed and uninterrupted time and are therefore difficult to do at
onersquos regular workplacerdquo
3 Travel as inappropriate for or a poor second for undertaking work ndash leading to no work being
done or done with limited efficiency
4 Travel as valuable lsquotime outrsquo ndash ldquotime that travellers use for relaxation and restorationrdquo
Holley et al (2008) provide an examination of time for work which is specifically oriented towards
questioning the wage‐rate approach in economic appraisal This is a theoretical paper informed by
UK empirical evidence from a national rail passenger survey and from an in‐depth case study of a
knowledge worker The paper in reflecting on current approaches to economic appraisal of
transport schemes notes a further assumption beyond those often recognised namely ldquothat it is
possible to clearly distinguish between what constitutes productive or unproductive use of time and
in turn assign corresponding economic valuesrdquo It points out that Taylorism and Fordism18 provide
the roots to the current economic appraisal approach ndash with the notion that business travel time is
lsquoemployer ownedrsquo time and leisure and commute travel time is lsquoownedrsquo by the individual The
authors argue that the knowledge economy has brought a ldquoreduced (and reducing) dominance of the
18 ldquoIn 1911 Taylor first published The Principles of Scientific Management (19111972) which introduced the
idea of breaking manual labour into its component parts (or motions) in order to remove those which were not
necessary and rearrange the remaining components so that they were conducted in a more efficient manner
and achieved greater productivity It also resulted in a complete removal of workersrsquo autonomy A similar
approach was taken by Henry Ford for car production lines a few years later A dominance of these work
practices would aid in the justification of transport appraisalrsquos approachrdquo (Holley et al 2008)
91
clock‐controlled industrialized time and a resurgence of the pre‐industrial task‐oriented concept of
timerdquo They go on to suggest that ldquoa strict adherence to the task‐oriented concept of time would
imply that the lsquoownershiprsquo of the time is determined by the activity consuming that time Time spent
conducting non‐work activities while travelling is not automatically a cost to the employer that needs
to be reducedrdquo Over and above adding evidence concerning productive use of travel time this paper
puts forward further challenges ldquoto the current understanding of business travel time informing UK
transport appraisalrdquo
1 Why does the purpose of a journey define what constitutes time use within it and related
saved time In a task‐oriented knowledge economy ownership of time is more sophisticated
than this
2 ldquothe possibility that business travel time serves a similar function to traditional work breaks ndash
providing anti‐activity time which can assist productivity at other time periods and assist
creativity by providing lsquoincubationrsquo timerdquo
A44 AConceptualisationofTravelTimeProductivity
Reference was made at the start of this review to a paper by Lyons and Urry (2005) The literature
above has tended to be lsquoin search of positive utility of travel timersquo Lyons and Urry recognised that
not all travel experience is positive and put forward a conceptualisation of travel time productivity
This postulates that across all travellers and journeys for a given mode a distribution of levels of
productivity of time use must exist and that these distributions would vary across modes To be of
practical value this would require calibration with empirical data Nonetheless the conceptualisation
(reproduced below) illustrates what might be seen as the full array of productivity consequences of
time invested in travel This extends beyond the two apparent bounds of lsquounproductiversquo and lsquorsquofullyrsquo
productiversquo to include lsquocounter‐productiversquo (ldquotime use that not only achieves no benefit in itself but
also has an adverse effect on time use beyond the journey (eg a stressful commute journey affects
an individualrsquos level of productivity once they reach work)rdquo) and lsquorsquoultrarsquo productiversquo (ldquothe use of time
on the journey has been more beneficial than had that time been used otherwise (eg getting more
work done because of the lack of interruptions which tend to disrupt thinking in the office)rdquo)
Figure reproduced from Lyons and Urry (2005) ndash ldquoillustrative frequency [f] distributions of
lsquoproductivityrsquo of travel time by moderdquo
A45 ReflectionsontheLiteratureExamined
A number of key summarising points can be made from this examination of available literature on
travel time use
1 Methodological approaches to gaining insights into travel time use are varied and studies often
appear to face significant constraints in terms of balancing breadth and depth of coverage
Observing or recording what people do with their time falls short of understanding why they use
the time in the way that they do and how this time use finds its place in their overall time use
2 The evidence as gathered is limited in terms of attempts to distinguish between different types
of business travel and is likely to have an implicit focus upon or leaning of emphasis towards
lsquobriefcase travellersrsquo It is important to recognise this potential lsquoevidence gaprsquo It should certainly
not be assumed in the absence of evidence that productive travel time use is less prevalent
within business travel beyond the bounds of briefcase travellers
3 There are clear modal differences in relation to productive use of travel time While the
assumption that rail holds more prospect than car for productivity is likely to be robust the car
environment nevertheless has prospect for worthwhile time use and indeed this may be
increasing over time
4 Attempts to judge any sense of relative productivity of time use between travel and non‐travel
are especially scarce in studies of time use which are often not principally concerned with
consequences for economic appraisal
5 However there are qualitative insights to suggest that the full span of the conceptualised
distributions depicted by Lyons and Urry (2005) occur in practice In other words for some the
92
93
6 There is recognition of the permeability between work and non‐work time or indeed the drift
towards unbounded work and non‐work time such that individuals are incorporating their travel
time use into a wider blend of daily time use that is geared towards meeting work social and
personal goals There is clear evidence for example that some people use some of their
commute time for work activity and some people use some of their work‐related travel time for
personal activities
7 Evidence for rail suggests that change over time is occurring in terms of ways of working and
communicating in the knowledge economy and a reducing distinction between the key facilities
for work in lsquothe officersquo or lsquoon the moversquo For both rail and car (and likely all modes) technologies
are evolving that appear to increase the versatility of and support of work and personal activities
that can be undertaken during travel Evidence is now available that highlights change over a six‐
year period With scheme appraisal potentially covering ten times longer into the future change
could be dramatic and unpredictable and not necessarily in one direction
8 Observation or self‐completion questionnaires are likely to massively over‐simplify how activities
relate to an individualrsquos overall productivity in their employment role To fulfil for example a
knowledge workerrsquo role is likely to involve a blend of reflecting thinking planning reading
writing typing talking and so on There is evidence to suggest that with suitable advance
planning individuals are able to align the travel environment and time with appropriate
elements of this blend to good effect
9 While there are clearly some journeys for which the experience for the traveller does not offer
much if any positive utility the evidence points towards an appreciable existence of positive
utility within travel across modes It is contestable whether notions of proportions of a journey
which are either productive or not productive are too reductionist added to then by notions of
determining the relative productivity of productive time on the move compared to that outside
of travel
10 It seems clear that there is significant heterogeneity of travel time experience and utility across
people modes and specific journey contexts In some respects this heterogeneity is
accommodated within the wage rate approach which has its focus upon the average or
aggregate picture However the evidence on travel time use in particular highlights how time
use varies with journey duration which in turn will have consequences for the (subjective) utility
the time is judged to offer This may be difficult to accommodate in any approach to economic
appraisal unless some forms of disaggregation of travel circumstances are introduced and
treated separately Such disaggregations may relate for example to journey duration
There is evidence then to suggest a strong presence of travel time use activities that derive personal
or work benefits The extent to which this positive utility prevails is likely to vary by context At the
94
same time there is some evidence to support the view that mobile technologies and changing ways
and norms of working are contributing to increasing the propensity for travel time to be used in
ways that derive benefit to the individual in either their work or personal lives The emerging
evidence also underlines the sophistication of how society and the individuals within it choreograph
activity participation in time and space Such sophistication may defy any attempt to adequately
reflect it through metrication and measurement as is implied by the thinking embodied within the
Hensher formula Productivity eludes being commoditised in blocks of time where it can be judged
for different spatial contexts as being lsquomorersquo or lsquolessrsquo productive Such a reductionist way of thinking
may well be perilous and far from lsquofuture proofrsquo as we move ever further from the FordistTaylorist
approaches to work
Annex 4 References
DfT (2009) Productive Use of Rail Travel Time and the Valuation of Travel Time Savings for Rail
Business Travellers ‐ Final Report
DfT (2012a) Values of Time and Vehicle Operating Costs TAG Unit 356 Department for Transport
August
DfT (2012b) Public attitudes towards train services results from the April 2012 Opinions Survey
Department for Transport
Eost C and Galer Flyte M (1998) An investigation into the use of the car as a mobile office Applied
Ergonomics 29(5) 383‐388
Fickling R H Gunn et al (2008) The productive use of rail travel time and value of travel time
saving for travellers in the course of work Proc European Transport Conference Association for
European Transport Leeuwenhorst Conference Centre The Netherlands
Gamberini L Spagnolli A Miotto A Ferrari E Corradi N and Furlan S (2012) Passengersrsquo
activities during short trips on the London Underground Transportation
Gripsrud M and Hjorthol R (2012) Working on the train from lsquodead timersquo to productive and vital
time Transportation 39 941ndash956
Gustafson P (2012) Travel time and working time What business travellers do when they travel
and why Time amp Society 21(2) 203ndash222
Hislop D (2012) Driving Communicating and Working Understanding the Work‐related
Communication Behaviours of Business Travellers on Work‐related Car Journeys Mobilities
Holley D Jain J and Lyons G (2008) Understanding Business Travel Time Use and its Place in the
Working Day Time amp Society 17 (1) 27‐46
95
Laurier E Lorimer H Brown B Jones O Johlin O Noble A Perry M Pica D Sormani P
Strebel I Swan L Taylor AS Watts L and Weilenmann A (2008) Driving and lsquoPassengeringrsquo
Notes on the Ordinary Organization of Car Travel Mobilities 31 1‐23
Lyons G and Urry J (2005) Travel time use in the information age Transportation Research 39(A)
257‐276
Lyons G Jain J and Holley D (2007) The use of travel time by rail passengers in Great Britain
Transportation Research 41(A) 107‐120
Lyons G Jain J Susilo Y and Atkins S (nd) Comparing rail passengers travel time use in Great
Britain between 2004 and 2010 Forthcoming in Mobilities
Middleton J (2009) `Stepping in time walking time and space in the city Environment and
Planning A 41 1943‐1961
Mott MacDonald Hugh Gunn Associates TRI Napier University Accent and Mark Bradley Research
and Consulting (2009) Productive Use of Rail Travel Time and the Valuation of Travel Time Savings
for Rail Business Travellers Final Report to the Department for Transport
OrsquoFallon C and Wallis I (2012) A wider look at how travellers value the quality and quantity of
travel time NZ Transport Agency research report 469
Ohmori N and N Harata (2008) How different are activities while commuting by train A case in
Tokyo Tijdschrift voor economische en sociale geografie Royal Dutch Geographical Society 99(5)
547‐561
Russell M R Price et al (2011) What do passengers do during travel time Structured
observations on buses and trains Journal of Public Transportation 14(3) 123‐146
Susilo Y Lyons G Jain J and Atkins S (2012) Rail Passengersrsquo Time Use and Utility Assessment
2010 findings from Great Britain with multivariate analysis Proc 91st Annual Meeting of the
Transportation Research Board Washington DC January And forthcoming in Transportation
Research Record
Timmermans H and Van der Waerden P (2008) Synchronicity of Activity Engagement and Travel in
Time and Space ‐ Descriptors and Correlates of Field Observations Transportation Research Record
Journal of the Transportation Research Board No 2054 Transportation Research Board of the
National Academies Washington DC 1ndash9
96
ANNEX5 LABOURMARKETCONDITIONSANDIMPLICATIONSFORTHEVALUATIONOFBUSINESSTRAVELTIMESAVINGS
A51 Introduction
A511 Objectives
This note forms an annex to the main report to the Department for Transport on the valuation of
travel time savings to business travellers The purpose of the annex is to review UK labour market
conditions and their implications on the valuation of the business value of time for use in cost
benefit analysis The issue of the use of time whilst travelling (ie the productivity of travel time) is
discussed in a different working report (Annexes 3 and 4)
Such a review is necessary as the different valuation methods cost saving method adjusted cost
saving method Hensher model etc (see Chapter 2 of main report for brief descriptions of the
different methods) require competitive labour and product markets to give robust valuations By
assuming a competitive labour market the marginal product of labour can be taken to be the
observed wage rate plus non‐wage costs Historically this has been taken to be quite a reasonable
assumption in developed economies For developing or emerging economies this condition has long
been recognised as being inappropriate If markets are not competitive either the wage plus non‐
wage costs may differ from the marginal product of labour or the resource value of labour released
into the labour market will not equal its marginal product
Given this transport appraisals in developing countries use shadow prices for labour when it is clear
that markets are not competitive (Howe 1976 Barrington 1977 Mackie Nellthorp and Laird 2005
TRN‐15) The assumption that markets approximate competitive conditions in developed countries
is now also challenged when compared to the situation forty or fifty years ago when the cost saving
method was introduced They are challenged on a number of fronts Firstly the Department for
Transport as part of its wider impacts guidance has acknowledged that the product market is
sufficiently different from competitive conditions to warrant including product market surpluses in
the cost benefit analysis (DfT 2012b) Secondly the recent economic downturn has once again put
the spotlight on high unemployment levels as being indicative of structural unemployment and a
market failure in the labour market Furthermore the concept of competitive labour market
conditions for all sections of the workforce is being challenged (Manning 2003) The question that
this annex therefore aims to address is whether it is necessary to adjust the market wage (ie
shadow price labour in some form) when estimating the business value of travel time savings
97
A512StructureofAnnex
For completeness of discussion we present in this report all relevant market failures that affect or
potentially can affect the labour market and discuss their implications for valuing business travel
time savings Following this short introductory section the second section discusses the implications
of labour taxes (ie income tax) whilst the third section discusses the implications of structural
unemployment Imperfect competition in the goods market and in the labour market are discussed
in sections four and five respectively whilst section 6 contains a discussion regarding the impact of
increased flexible working on whether time savings are transferred to additional work or leisure
The final section summarises the main points and identifies areas of further research the
implications of the different labour market conditions for the different valuation methods and the
implications for appraisal
A52 IncomeTax
Income taxes distort the labour market by driving a wedge between the wage faced by employers
and that received by employees This restricts employment to levels below that associated with fully
competitive conditions This distortion generates welfare benefits (equivalent to the increased tax
take) additional to user benefits when employment expands or wages increase (eg through
agglomeration impacts) (DfT 2005 Venables 2007 DfT 2012b) Departmental guidance recognises
these additional welfare benefits
From a business VTTS perspective income tax in an otherwise competitive economy does not
prevent the gross of tax wage equalling the marginal product of labour In a competitive economy
the presence of an income tax therefore means that the gross of tax wage can be used as a basis to
derive the marginal product of labour for workers
A53 StructuralUnemploymentExcessLabourSupply
If there is an excess supply of labour that is some form of market failure is preventing the wage rate
falling and the labour market clearing then the wage will not be a good reflection of the social value
of reducing employment or increasing employment (Boardman et al 2011 Chapter 4 Haveman and
Farrow 2011) This is important if valuing the business travel time savings using the cost saving
approach the Hensher model or variants of them This is because an implicit assumption of these
models is that labour if released into the labour market will be able to find work at their existing
marginal product ndash which if there is structural unemployment will not occur In such situations the
shadow price of labour could be used instead of the wage rate to reflect the social value of business
time savings
The shadow pricing of labour due to unemployment is well established aspect of cost benefit
analysis Certain texts on the matter suggests that when unemployment levels are below 5
98
frictional unemployment dominates and the opportunity cost of labour is the wage (see eg
Boardman et al 2011 pp105‐108) When it is higher than 5 the opportunity cost is less than the
wage and some form of shadow pricing is needed As can be seen from Table A51 unemployment
levels exceed 5 in 84 of local authorities in Great Britain and exceed 10 in 17 of local
authorities
Table A51 Unemployment Levels in GB (2011‐12) at a Local Authority Level
Local authorities in GB
Unemployment rate
Number Percentage
Unemployment greater than 10 69 17
Unemployment greater than 75 and up to or equal to 10 94 23
Unemployment greater than 5 and up to or equal to 75 178 44
Unemployment greater than 3 and up to or equal to 5 65 16
Unemployment greater than 0 and up to or equal to 3 0 0
Total 406 100
Source ONS annual population survey [Apr 2011-Mar 2012] accessed via wwwnomiswebcouk (Oct 5th 2012) Note Numbers and are for those aged 16 and over is a proportion of economically active Figures and percentages are modelled based
Obviously the rate of unemployment varies geographically but it also varies systematically in other
ways for example by gender age and skill level Additionally it will vary temporally as ideally the
rate of unemployment will return to pre‐2008 levels at some point in the future
To understand whether shadow pricing labour for unemployment is empirically relevant to the
valuation of business travel time savings we need a comparison between the skill levels of the
unemployed and business travellers This comparison needs to relate to the area in which the
business travellers originatereside The market wage would only be adjusted to a shadow price if
the unemployed and business travellers are substitutable For this study such information is not
available We would however conjecture that for modes of travel that cater for mobile high skilled
workers (eg rail travel) that the skills of the unemployed cannot be substituted for such workers
Adjusting the business value of time for modes such as rail is not therefore likely to be empirically
relevant In contrast where a reasonable percentage of business travel is be undertaken by low and
medium skilled workers (eg those in administration or construction sectors in an urban area) then
the skills of the unemployed and some lsquobusinessrsquo travellers might be considered substitutable
Further research however would be needed to confirm this conjecture
Shadow pricing labour for unemployment may have implications in other aspects of appraisal that
include a labour component These are as follows
99
Capital costs
Operating costs both of public transport services and cars (non‐fuel element)
Wider impacts (agglomeration and move to more productive jobs)
At this point in time it is unclear how empirically relevant to a cost benefit analysis shadow pricing
labour for unemployment would be nor how onerous the task would be to shadow price labour for
unemployment effects Further research on this topic is required before such conclusions can be
drawn
A54ImperfectlyCompetitiveMarkets
A541 ImperfectGoodsProductMarket
A competitive goodsproduct market is a necessary condition for the cost saving method for the
Hensher model and its variants There are two relevant goodsproduct market failures indirect
taxation and imperfect competition arising through for example product differentiation or
geographic monopolies Appraisal methods account for both of these market failures in that any
surpluses additional to user benefits are estimated in the cost benefit analysis (DfT 2011 2012b)
The average rate of indirect taxation in the economy is 190 (DfT 2012a) whilst marginal costs are
taken to be 20 lower than shop prices (DfT 2005 p49) The evidence reviewed by DfT (2005)
however shows that this lsquoaveragersquo mark‐up disguises tremendous variability by industry with a range
in the mark‐up from 0 to mark‐ups in excess of 40 in some sectors
There is also ample evidence at an international level that perfect competition does not prevail For
example for 10 EU countries Badinger (2007) estimates markup factors of price above marginal costs
of approximately 13 for manufacturing and construction and 137 for services for the late 1990s
Christopoulou and Vermeulen (2008) also find evidence that rejects the perfect competition
hypothesis with price‐marginal cost factors of 137 in 8 Euro area countries and 131 in the US They
also find that the price‐marginal cost margins are not uniform with significant variation by industry
and country lying behind these headline numbers
In both situations the market failure reduces output below that which would occur under
competitive conditions Employment levels are therefore lower in the presence of either indirect
taxes or imperfect competition than they would be under perfect competition Whilst the firm is a
wage taker (and the labour supply curve it faces is perfectly elastic) these market failures can
operate at an economy wide level As the labour supply curve for the economy as a whole is elastic
there then exists a gap between the wage and the marginal product of labour (with a competitive
labour market) This is because the firm equates the wage to the marginal revenue product of
labour Therefore with an imperfectly competitive goods market and a competitive labour market
the value of marginal product of labour is greater than the wage The situation of an imperfectly
competitive labour market is discussed below
100
‐unionised elements of the workforce
A542ImperfectLabourMarkets
Whilst the pervasive view is that labour markets in developed economies are competitive19 this
view faces a number of challenges (Manning 2011) One of the central criticisms is that the
competitive labour market model regards firms as wage takers where if the wage rate was lowered
by 1 penny the firm would lose all its employees This is clearly a simplification Other
characteristics of labour markets that can be taken to be symptomatic of the presence of
imperfections include firms attitudes to general training (ie transferable between firms) and
recruitment costs job search costs of employees as well as differences in pay and conditions
between public and private sector union and non
From the perspective of transport policy cost benefit analysis the issue is not what causes the
imperfections but whether any market imperfection leads to the wage departing from the marginal
product of labour This is because we are interested in whether the market wage needs to be
adjusted (ie shadow priced) in some way to reflect the actual marginal product
In an imperfectly competitive labour market rents are derived from the employment relationship
either by the employer or worker or both If an employer gets rents the marginal product is above
the wage whilst if a worker gets the rents then the wage is a good indicator of the marginal product
of labour Manning (2011) in reviewing the evidence on the size of such rents in the labour market
concludes that rents in the region of 15 to 30 are plausible There is however a lot of variation
and enormous uncertainty in these estimates The limited evidence that does exist suggests that
most of the rents are being accrued by workers ndash implying wages are close to marginal product
Evidence that imperfect competition exists in the labour market can also be found through a joint
transport sector labour market analysis With imperfect competition in the labour market
commuting costs will not be fully compensated if firms have more market power than workers
Manning (2003) shows that this is the case for the UK whilst Rouwendal and Van Ommeren (2007)
demonstrate that it is the case for the Netherlands Whilst these averages suggest that on the whole
labour markets are imperfectly competitive arguably the level of competitiveness will vary with
labour market segment Mobile workers typically high skilled and the primary wage earner in a
household arguably would face a competitive labour market as the household may move or migrate
in response to their work Workers in lower skilled occupations women ethnic minorities arguably
face restricted geographic search areas and high mobilitymigration costs (Madden 1981 1985 Zax
1991 Ihlanfeldt 1992 McQuaid Greig and Adams 2001) and therefore are more likely to face an
imperfectly competitive labour market Laird (2008) finds evidence for varying degrees of imperfect
competition by labour market segment Following the work of Manning and Rouwendal and Van
Ommeren in a Scottish context Laird finds that the level of compensation for commuting costs
19 A labour market can be competitive even when the product market is not competitive
101
varies by labour market segment urbanrural gender and skill level The implication is that the
market wage is likely to be a good estimate of the marginal product for lsquomobilersquo workers
A543Synthesis
The lack of evidence in this field makes it difficult to give recommendations on the size of any gap
between the wage and the marginal product of labour for business travellers On the basis of what
evidence there is it would seem that the wage is a reasonable approximation for the marginal
product of labour for business travellers despite the prevalence of market imperfections This is
because firstly a lot of business travel is conducted by lsquomobilersquo workers and secondly that what
evidence there is suggests the rents accrue to workers That is there is no need to shadow price
labour as a consequence of market imperfections ‐ further research however may be needed to
confirm this
A544FlexibleWorking
The cost saving approach was devised at a time when it could be argued there was a degree of
rigidity in the labour market So the distinction between employerrsquos business time and non‐working
time was relatively clear cut The modern service economy is no longer characterised by the
formalised work contract The lsquowhite collarrsquo and lsquopink collarrsquo worker now dominate the lsquoblue collarrsquo
worker in the workforce20 Simultaneously there has been an increase in a more flexible working
environment flexi‐time job‐sharing flexible working Sunday working has also increased
particularly in retail and entertainment This is relevant to the context of business travel time
savings because the value of business travel time savings will vary depending amongst other reasons
upon the contractual arrangements the worker has with the employer (primarily whether they work
paid or unpaid overtime) ndash see section 2 of the main report and Annex 1 for further discussion The
discussion contained in this section is complementary in many ways to that in Annex 4 on the use of
travel time
There has been notable shift to more flexible working over the years The number of hours worked
in a lifetime has decreased from 124000 in 1856 to 69000 in 1981 (Ausubel and Gruumlbler 1995)
Average weekly hours of a manual worker have fallen from 53 hours in 1943 to 435 in 1987 (ONS
2003) This trend has continued with average hours worked having fallen by 47 since 1991 (ONS
2011) The ONS attribute this latest decrease to a ldquomixture of structural changes in the economy
and more flexibility in the hours chosen by employees or offered by employers (including more part‐
time working)rdquo Part‐time working21 is obviously a key component of flexible working with part‐
20 White collar workers work in offices typically at a desk blue collar workers undertake manual work whether it is skilled or unskilled whilst pink collar workers undertake work that involves customer interaction (eg entertainment and sales) 21 There is no formal definition of part‐time working in the UK Workers are asked to categorise themselves as either part‐time or full‐time
102
time workers form 27 of the UK workforce (ONS 2011) The structural shift in the economy from
manufacturing to service sector is one of the key reasons that more flexible working arrangements
have been adopted The service sector currently comprises 80 of employment in Britain compared
to 68 in 1992 and in 2011 part‐time workers comprised 31 of the service sector workforce
compared to only 8 of the manufacturing workforce (ONS 2011) There is no reason to expect a
shift to more part‐time work to halt For example 49 of workers in the Netherlands are part‐time
(ONS 2011)
Flexible working extends beyond working part‐time In 2003 some 6 million workers22 (27 of
women and 18 of men) it is estimated had working patterns that differed from the standard
pattern (Hibbet and Meager 2004)23 Such variability arises from flexitime term‐time working
annualised hours job sharing nine‐day fortnights and zero hour contracts (see Table A52)
Furthermore as can be seen from this table in the three years analysed there was a continuing trend
towards increased variability in working patterns In addition to these types of working patterns
some 5 of the workforce also engage in telework24 (White et al 2007) These workers typically
are the higher income workers holding senior positions who use computers and telephones as part
of their daily jobs Such workers are typically judged on the outcomes they produce rather than the
hours of work they give to the firm The nature of teleworking also means that manual workers
(blue collar) and customer focused workers (pink collar) typically do not telework
Table A52 Variations in Working Patterns in Great Britain
Percent
Women Men
Working patterns
2000 2003 2000 2003
Flexitime 11 12 8 9
Term-time working 7 8 1 1
annualised hours 4 5 4 5
Job sharing 1 2 ~ ~
Nine day fortnight 1 1 2 2
Zero hours 1 1 1 1
None of the above 75 73 84 82
Source Hibbet and Meager (2003)
22 Both part‐time and full‐time 23 This includes part‐time and full‐time workers ndash though being part‐time itself does not constitute flexible working 24 Telework is a work arrangement in which employees do not commute to a central place of work
103
The move away from the formalised working week in todayrsquos economy is also evident by the
importance of weekend working (some 29 of workers usually work on Saturdays whilst 21
usually work on Sundays) and by the fact that 35 of the workforce sometimes work either paid or
unpaid overtime25
The evidence clearly points towards a very different labour market today than that of forty or fifty
years ago The structure of the economy has altered and with it the need for flexibility and
variability in working patterns The labour market however remains very heterogeneous Whilst
flexible working employees (ie those that work non‐standard work patterns and part‐time) are now
a very significant component of the workforce the majority of the workforce still do not have any
flexibility in their work and furthermore the majority of workers do not work overtime Some
groups of workers are judged on outputs whilst others remain contracted to provide hours of work
(albeit those hours may be subject to some form of flexible working) The latter distinction is what is
most relevant to the valuation of business travel time savings From a business value of travel time
savings perspective different employment models are relevant to different workers and therefore
business trips
(i) Workers with fixed hours contracts with paid overtime Here travelling time will displace
time at the workplace no matter what time the trip occurs
(ii) Workers with flexi‐time contracts with ability to re‐coup overtime through days off Again
travelling time will displace time at the workplace no matter what time the trip occurs
(iii) Workers with contracts with unpaid overtime and the self‐employed
a Travelling during normal work hours Here business travel would be expected to
displace work
b Travelling outside normal working hours Here travelling for business may displace
leisure time as well as work time Employee would require compensation through
the wage at a rate depending on how onerous the travelling is compared to leisure
A reduction in travelling time would lead in the long run to a reduction in the level
of wage compensation required
For workers with paid overtime or flexitime (ie (i) and (ii) above) business travel will only displace
work activities That is the r term in the Hensher formula will be zero or close to zero ndash though this
should be tested empirically For workers working unpaid overtime but who travel during normal
work hours (ie (iii)a above) business travel displaces work and leads to an increase in unpaid
overtime Travel time savings would therefore lead to a reduction in unpaid overtime For workers
who are not paid overtime and travel outside of normal working hours (ie (iii)b above) business
travel could displace both work and leisure time For these workers (iii)a and (iii)b the r term in the
25 Source Quarterly Labour Force Survey (April ndash June 2012) Accessed via the Economic and Social Data
Service Nesstar Catalogue (accessed October 12 2012)
104
Hensher model will be greater than zero Whilst undoubtedly these travellers comprise a minority of
the workforce they are likely to be very relevant for certain policy interventions ndash particularly long
distance rail interventions This is because rail travellers are typically high skilled workers who are
not paid overtime and the long distance element of the rail market can involve early departures and
late returns home
A55SynthesisandFurtherResearch
A551 LabourMarketConditions
Drawing this evidence together the following points emerge
Income tax does not prevent the marginal product of labour elsewhere in the economy equalling the
wage plus non‐wage income
Unemployment levels in the UK are currently at levels typically associated with structural
unemployment which some suggest may justify some form of shadow pricing of labour This has
implications to other aspects of cost benefit analysis (eg treatment of capital costs in particular)
and also conflicts with current Treasury guidance The shadow price of labour will also vary with the
rate of unemployment ndash ie it will vary regionally
How the wage differs from the marginal product of labour varies with the type of market failure
Goods and labour market imperfections would suggest the wage is lower than the marginal product
Contrastingly an excess supply of labour would suggest that the resource cost of labour is below the
wage
There is a lot of variability in the labour market Some aspects of the labour market will be
competitive whilst at the same time others will be experiencing imperfect competition If these
imperfections vary systematically with income then because mode choice also varies systematically
with income then any adjustments to the wage rate to reflect market imperfections may need to
also vary by mode
There is a growing body of evidence that both the goods and labour markets are imperfectly
competitive in developed economies like the UK The degree of imperfection in both the goods and
labour markets appears to be empirically relevant With respect to the goods market this is already
recognised in DfT guidance The difference between the wage and the marginal product due to
imperfectly competitive markets is a function of market power and information asymmetries We
would therefore expect it to vary systematically by industry and occupation Evidence to date
suggests that workers seem to on average be exacting the majority of the rents Therefore despite
the markets being imperfectly competitive on average the wage may not differ too significantly from
105
the marginal product of labour ndash though to a certain extent this is conjecture as the evidence base is
small
With the shift to a more service based economy flexible working in all its different forms is much
more prevalent today than say forty years ago ndash when transport cost benefit analysis methods were
developed However standard working patterns still dominant Those working overtime are in a
minority (although a sizeable minority) but because such workers may self select to certain modes
of transport (eg rail) an explicit treatment of them in deriving business values of time is likely to be
necessary
A552 ValuationMethods
Aside from a direct elicitation of willingness to pay through either revealed or stated preferences
the other valuation methods typically build up a composite value of time from different components
of work plus the value of transferring travel time to non‐work activities As the discussion in this
report has solely concerned the adjustment to the wage to reflect the social value of transferring
more time to work only those aspects of the Hensher model (and its variants) would need to be
adjusted
The willingness to pay (by employers) approach circumvents much of the discussion regarding
imperfect goods and labour markets as well as the discussion regarding the transfer of time savings
to either work or leisure activities
A553FurtherResearch
In the short term (elapsed time less than 6 months) research could be conducted to examine the
influence of shadow pricing labour for high unemployment on a cost benefit analysis This would
require analysis of regional labour markets and a view on the longevity of the high unemployment
levels we are currently seeing A view on whether all parts of the labour market should be shadow
priced needs to be made as well A case may exist for shadow pricing low incomes and altering
transport appraisal guidance to disaggregate by income rather than by mode A key issue to note is
that current Treasury guidance in the form of the Green Book does not permit the shadow pricing of
labour
Similarly in the short term (within 6 months) given differing working conditions we would expect
that some elements of the labour market will transfer time savings to lsquonon‐workrsquo activities and
others to increased work This heterogeneity in the labour market needs to be taken account of in
future surveysresearch as it appears to vary systematically with occupation which is correlated
with travel behaviour (eg mode choice) and incomewages Key questions that need to be
addressed in future work would include
106
Which sections of the labour market have flexibility to transfer travel time savings to leisure
What are their characteristics
How does the proportion of such travellers vary by mode long and short distance
urbaninter‐urban and time of day
Is there evidence that employers are willing to pay to save such employees travel time early
in the morning or late at night (either revealed preference or stated preference)
In the longer term (elapsed time 12 months plus) the Department could commission research to
better identify the gap between the wage and the marginal product of labour which would help
implement the cost saving and Hensher methods (and their variants) Most of the problems related
to the Henshercost‐savings method arise because worker wages and costs are used as a proxy for
the increased output obtained from marginal increases in available working time but wages deviate
from marginal product for all the reasons discussed
An alternative potential approach which circumvents many of these problems is to obtain estimates
of the productivity of work time directly using firm micro‐data with information on firm outputs and
labour inputs Better still is to link these data to worker level data with detail on worker
characteristics wages and hours Recent research in labour economics has developed methods for
working with this type of linked employer‐employee data (Abowd and Kramarz 1999) and a
growing body of literature provides empirical applications Detailed firmplant level data and
individual worker data that can merged together by workplace identifiers is increasingly available
and the Annual Respondents Database (ARD) firm data and Annual Survey of Hours and Earnings
provides the potential for this analysis for the UK
Although not without its problems both in terms of data set up and analysis direct measurement of
the marginal product of working hours from firm level data provides an alternative strategy which
could be used to provide a point of comparison with wage‐based estimates of the value of business
travel time savings The size of these datasets also allows scope for analysis by occupational
industrial and geographical groups to provide greater insights into the heterogeneity both in
marginal product of work time and on the deviation between marginal product and wages Some
papers have already looked explicitly at the correspondence between wages and the marginal
product of labour using these kinds of data both in the US (Hellerstein Neumark and Troske 1999)
and for Britain (Galindo‐Rueda and Haskel 2005 Haskel et al 2005) and provide potential prototypes
A554 ImplicationsforAppraisal
The implications of the observed heterogeneity in the labour market are reasonably large if they
need to be taken account of fully It is clear the value of travel time savings will vary by time of day
(ie whether it is within or without the core business day) and by occupation of business traveller
The latter variation will lead to variations in values by (mode) and also most likely by short and long
107
distance trips or correspondingly between urban and inter‐urban trips The former (variations by
mode) are already reflected in appraisal practise but the latter (variations by shortlong distance)
are not Similarly variations by whether the trip occurs within or outside core business hours is not
reflected in current guidance
Annex 5 References
Abowd J M and F Kramarz (1999) Chapter 40 The analysis of labor markets using matched
employer‐employee data In Orley C Ashenfelter and David Card Editor(s) Handbook of Labor
Economics Elsevier Volume 3 Part B Pages 2629‐2710
Ausubel JH and Gruumlbler A (1995) Working Less and Living Longer Long‐Term Trends in Working
Time and Time Budgets Technological Forecasting and Social Change 50 pp195‐213
Badinger H (2007) Has the EUs Single Market Programme Fostered Competition Testing for a
Decrease in Mark‐up Ratios in EU Industries Oxford Bulletin of Economics and Statistics 69(4)
pp497‐519
Barrington A (1977) Valuing Time Savings in Developing Countries ndash A Comment Journal of
Transport Economics and Policy 11(2) pp195‐201
Boardman AE DH Greenberg AR Vining and DL Weimer (2011) Cost‐Benefit Analysis Concepts
and Practice Fourth Edition Upper Saddle River New Jersey
Christopoulou R and P Vermeulen 2008 Markups in the Euro Area and the US Over the Period
1981‐2004 A Comparison of 50 Sectors ECB Working Paper No 856 Report dated January 2008
Coburn TM Beesley ME and Reynolds DJ (1960) The London‐Birmingham Motorway Road
Research Technical Paper 46 London HMSO
Department for Transport (2005) Transport Wider Economic Benefits and Impacts on GDP
Discussion Paper July 2005
Department for Transport (DfT) (2011) Transport User Benefit Calculation TAG Unit 353 London
Department for Transport Available online at lthttpwwwdftgovukwebtaggt (Accessed 23rd
August 2012)
Department for Transport (DfT) (2012a) Values of time and operating costs TAG Unit 356 August
2012 London Department for Transport Available online at lthttpwwwdftgovukwebtaggt
(Accessed 23rd August 2012)
108
Department for Transport (DfT) (2012b) The Wider Impacts Sub‐Objective TAG Unit 3514 Draft
May 2012 London Department for Transport Available online at
lthttpwwwdftgovukwebtaggt (Accessed 23rd August 2012)
Galindo‐Rueda F and J Haskel (2005) Skills Workforce Characteristics and Firm‐Level Productivity
Evidence from the Matched ABIEmployer Skills Survey IZA discussion paper 1542 IZA Bonn
Haskel J Hawkes D and Pereira S (2005) How much do skills raise productivity UK evidence
from matched plant worker and workforce data CEPPR discussion paper 5334
Hellerstein JK D Neumark and KRTroske (1999) Wages Productivity and Worker Characteristics
Evidence from Plant‐Level Production Functions and Wage Equations Journal of Labor Economics
17(3) 409‐446
Hibbett A and Meager N (2003) Key indicators of womenrsquos position in Britain In Office for
National Statistics (ed) Labour Market Trends October 2003 pp503‐511
Howe J (1976) Valuing time in developing countries Journal of Transport Economics and Policy
10(2) pp113‐125
Fowkes AS Marks P and Nash CA (1986) The value of business travel time savings Institute for
Transport Studies University of Leeds Working Paper 214
Ihlanfeldt KR (1992) Intraurban wage gradients evidence by race gender occupational class and
sector Journal of Urban Economics 32 pp70‐91
Mackie PJ Nellthorp J and Laird JJ (2005) Toolkit for the Economic Evaluation of Transport
Projects Washington DC World Bank Available online at
httpwebworldbankorgWBSITEEXTERNALTOPICSEXTTRANSPORTEXTROADSHIGHWAYS0con
tentMDK20464962~pagePK148956~piPK216618~theSitePK33866100html (accessed 26th
September 2012)
Mackie PJ Jara‐Diaz S and Fowkes AS (2001) The value of travel time savings in evaluation
Transportation Research Part E 37 pp91‐106
Mackie PJ Wardman M Fowkes AS Whelan GA Nellthorp J and Bates J (2003) Value of
Travel Time Savings in the UK A report to the Department for Transport Institute for Transport
Studies University of Leeds UK
Madden JF (1981) Why women work closer to home Urban Studies 18 pp181‐194
Madden JF (1985) Urban wage gradients empirical evidence Journal of Urban Economics 18 pp
291‐301
109
Manning A (2003) Monopsony in Motion Imperfect competition in labour markets Princeton NJ
Princeton University Press
Manning A (2011) Imperfect Competition in Labour Markets In (eds) Ashenfelter O and Card D
Handbook of Labor Economics volume 4 Chapter 11 pp976‐1041North‐Holland Amsterdam
McQuaid RW M Greig and J Adams (2001) Unemployed job seeker attitudes towards potential
travel‐to‐work times Growth and Change 32(3) pp355‐368
Office for National Statistics (ONS) (2011) Hours worked in the labour market ndash 2011 Report dated
8th December 2011
Rouwendal J and J Van Ommeren (2007) Recruitment in a Monopsonistic Labour Market Will
Travel Costs be reimbursed Tinbergen Institute Discussion Paper TI 2007‐0443 Report dated 23
April 2007 Amsterdam Tinbergen Institute Amsterdam
Venables AJ (2007) Evaluating Urban Transport Improvements CostndashBenefit Analysis in the
Presence of Agglomeration and Income Taxation Journal of Transport Economics and Policy 41(2)
pp173ndash188
White P Christodoulou G Mackett R Titheridge H Thoreau R and Polak J (2007) The Role of
Teleworking in Britain Its Implications for the Transport System and Economic Evaluation European
Transport Conference Noordwijkerhout 17‐19 October 2007 London AET Transport
Zax JS (1991) Compensation for commutes in labour and housing markets Journal of Urban
Economics 30 pp192‐207
- ANNEX 1 TECHNICAL ANNEX ON THE HENSHER EQUATION
-
- A11 Introduction
- A12 Previous Literature
- A13 Defining the Objective Problem Behind the Hensher Equation
- A14 Solving the Objective Problem
- A15 Revealed Properties of the Hensher Equation
- A16 Special Cases of the Hensher Equation
- A17 Synthesis and Conclusions
-
- ANNEX 2 CURRENT APPRAISAL PRACTICE
-
- A21 Objectives
- A22 Structure of this annex
- A23 Business Travel in Great Britain
- A24 Measuring the Value of Business Travel Time Savings
-
- A241 GB practice and the Cost Saving Method
- A242 Alternative Valuation Approaches
-
- A25 International Appraisal Practice
- A26 Implementing the Cost Saving Method in Great Britain
-
- A261 Deriving the Hourly Wage
- A262 Non-Wage Labour Costs
- A263 Professional Drivers
- A264 Long run marginal costs
-
- A27 Summary
-
- ANNEX 3 REVIEW OF EVIDENCE ON BUSINESS TRAVEL TIME SAVINGS
-
- A31 Introduction
-
- A311 Aims
- A312 Scope
- A313 Structure
-
- A32 Definitions
- A33 Review of National Value of Time and Other Significant Studies
- A34 Willingness to Pay Evidence
-
- A341 Review of European WTP Evidence
- A342 Recent Japanese Evidence
- A343 High Speed Rail Evidence
-
- A35 Specific Issues and Insights
- A36 Conclusions
-
- ANNEX 4 TRAVEL TIME USE ndash AN EXAMINATION OF EXISTING EVIDENCE
-
- A41 Context
- A42 Introduction
- A43 Empirical Insights into Travel Time Use
- A44 A Conceptualisation of Travel Time Productivity
- A45 Reflections on the Literature Examined
-
- ANNEX 5 LABOUR MARKET CONDITIONS AND IMPLICATIONS FOR THE VALUATION OF BUSINESS TRAVEL TIME SAVINGS
-
- A51 Introduction
-
- A511 Objectives
- A512 Structure of Annex
-
- A52 Income Tax
- A53 Structural Unemployment Excess Labour Supply
- A54 Imperfectly Competitive Markets
-
- A541 Imperfect GoodsProduct Market
- A542 Imperfect Labour Markets
- A543 Synthesis
- A544 Flexible Working
-
- A55 Synthesis and Further Research
-
- A551 Labour Market Conditions
- A552 Valuation Methods
- A553 Further Research
- A554 Implications for Appraisal
-