valuation - new york university stern school of businessadamodar/pdfiles/country/indiaval0… ·...
TRANSCRIPT

Aswath Damodaran 1
ValuationAswath Damodaran
http://www.damodaran.com

Aswath Damodaran 2
Some Initial Thoughts
" One hundred thousand lemmings cannot be wrong"Graffiti

Aswath Damodaran 3
Misconceptions about Valuation
Myth 1: A valuation is an objective search for “true” value• Truth 1.1: All valuations are biased. The only questions are how much and in
which direction.• Truth 1.2: The direction and magnitude of the bias in your valuation is directly
proportional to who pays you and how much you are paid. Myth 2.: A good valuation provides a precise estimate of value
• Truth 2.1: There are no precise valuations• Truth 2.2: The payoff to valuation is greatest when valuation is least precise.
Myth 3: . The more quantitative a model, the better the valuation• Truth 3.1: One’s understanding of a valuation model is inversely proportional to
the number of inputs required for the model.• Truth 3.2: Simpler valuation models do much better than complex ones.

Aswath Damodaran 4
Approaches to Valuation
Discounted cashflow valuation, relates the value of an asset to the presentvalue of expected future cashflows on that asset.
Relative valuation, estimates the value of an asset by looking at the pricingof 'comparable' assets relative to a common variable like earnings, cashflows,book value or sales.
Contingent claim valuation, uses option pricing models to measure the valueof assets that share option characteristics.
Aswath Damodaran 5
Discounted Cash Flow Valuation
What is it: In discounted cash flow valuation, the value of an asset is thepresent value of the expected cash flows on the asset.
Philosophical Basis: Every asset has an intrinsic value that can be estimated,based upon its characteristics in terms of cash flows, growth and risk.
Information Needed: To use discounted cash flow valuation, you need• to estimate the life of the asset• to estimate the cash flows during the life of the asset• to estimate the discount rate to apply to these cash flows to get present value
Market Inefficiency: Markets are assumed to make mistakes in pricing assetsacross time, and are assumed to correct themselves over time, as newinformation comes out about assets.

Aswath Damodaran 6
Equity Valuation
Assets Liabilities
Assets in Place Debt
Equity
Discount rate reflects only the cost of raising equity financing
Growth Assets
Figure 5.5: Equity Valuation
Cash flows considered are cashflows from assets, after debt payments and after making reinvestments needed for future growth
Present value is value of just the equity claims on the firm

Aswath Damodaran 7
Firm Valuation
Assets Liabilities
Assets in Place Debt
Equity
Discount rate reflects the cost of raising both debt and equity financing, in proportion to their use
Growth Assets
Figure 5.6: Firm Valuation
Cash flows considered are cashflows from assets, prior to any debt paymentsbut after firm has reinvested to create growth assets
Present value is value of the entire firm, and reflects the value of all claims on the firm.

Aswath Damodaran 8
Valuation with Infinite Life
Cash flowsFirm: Pre-debt cash flowEquity: After debt cash flows
Expected GrowthFirm: Growth in Operating EarningsEquity: Growth in Net Income/EPS
CF1 CF2 CF3 CF4 CF5
Forever
Firm is in stable growth:Grows at constant rateforever
Terminal Value
CFn.........
Discount RateFirm:Cost of Capital
Equity: Cost of Equity
ValueFirm: Value of Firm
Equity: Value of Equity
DISCOUNTED CASHFLOW VALUATION
Length of Period of High Growth

Aswath Damodaran 9
Cashflow to FirmEBIT (1-t)- (Cap Ex - Depr)- Change in WC= FCFF
Expected GrowthReinvestment Rate* Return on Capital
FCFF1 FCFF2 FCFF3 FCFF4 FCFF5
Forever
Firm is in stable growth:Grows at constant rateforever
Terminal Value= FCFF n+1/(r-gn)
FCFFn.........
Cost of Equity Cost of Debt(Riskfree Rate+ Default Spread) (1-t)
WeightsBased on Market Value
Discount at WACC= Cost of Equity (Equity/(Debt + Equity)) + Cost of Debt (Debt/(Debt+ Equity))
Value of Operating Assets+ Cash & Non-op Assets= Value of Firm- Value of Debt= Value of Equity
Riskfree Rate :- No default risk- No reinvestment risk- In same currency andin same terms (real or nominal as cash flows
+Beta- Measures market risk X
Risk Premium- Premium for averagerisk investment
Type of Business
Operating Leverage
FinancialLeverage
Base EquityPremium
Country RiskPremium
DISCOUNTED CASHFLOW VALUATION

Aswath Damodaran 10
Current Cashflow to FirmEBIT(1-t) : 2210- Nt CpX 366 - Chg WC 155= FCFF 1689Reinvestment Rate = 521/1689= 23.58%
Expected Growth in EBIT (1-t).41*.0901=.03693.69%
Stable Growthg = 3%; Beta = 0.9;Country Premium= 1.3%Debt Ratio = 23.7%Cost of capital = 9.19% ROC= 9.19%; Tax rate=30%Reinvestment Rate=g/ROC =3/9.19 = 32.63%
Terminal Value5= 1826/(.0919-.03) = 29,676
Cost of Equity12.25%
Cost of Debt(5.50%+0.85%)(1-.30)= 4.45%
WeightsE = 76.3% D = 23.7%
Discount at $ Cost of Capital (WACC) = 12.25% (.763) + 4.45% (0.237) = 10.39%
Op. Assets 23,524+ Cash: 2,904- Debt 7,660=Equity 18,768-Options 0Equity 18,768Value/Sh Rs 104/sh
Riskfree Rate:Rs Riskfree Rate= 5.50%
+Beta 0.90 X
Mature market premium 4 %
Unlevered Beta for Sectors: 0.74
Firm’s D/ERatio: 31.13%
Tata Chemicals: StatusQuo
Reinvestment Rate 41%
Return on Capital9.01%
Term Yr 2,728 - 890=1838
+ Lambda1.21
XCountry Equity RiskPremium2.60%
Country Default Spread1.30%
X
Rel Equity Mkt Vol
2.00
On June 15, 2004Tata Chem= Rs 136.2
Average Reinvestment Rate(1999-2003) = 41%
Year 1 2 3 4 5EBIT (1-t) 2291 2376 2464 2555 2649 - Reinvestment 939 974 1010 1047 1086FCFF 1352 1402 1454 1507 1563
Current Cashflow to FirmEBIT(1-t) : 2210- Nt CpX 366 - Chg WC 155= FCFF 1689Reinvestment Rate = 521/1689= 23.58%
Expected Growth in EBIT (1-t).41*.0901=.03693.69%
Stable Growthg = 3%; Beta = 0.9;Country Premium= 1.3%Debt Ratio = 23.7%Cost of capital = 9.19% ROC= 9.19%; Tax rate=30%Reinvestment Rate=g/ROC =3/9.19 = 32.63%
Terminal Value5= 1826/(.0919-.03) = 29,676
Cost of Equity12.25%
Cost of Debt(5.50%+0.85%)(1-.30)= 4.45%
WeightsE = 76.3% D = 23.7%
Discount at Cost of Capital (WACC) = 12.25% (.763) + 4.45% (0.237) = 10.39%
Op. Assets 23,524+ Cash: 2,904- Debt 7,660=Equity 18,768-Options 0Equity 18,768Value/Sh Rs 104/sh
Riskfree Rate:Rs Riskfree Rate= 5.50%
+Beta 0.90 X
Mature market premium 4 %
Unlevered Beta for Sectors: 0.74
Firm’s D/ERatio: 31.13%
Tata Chemicals: StatusQuo
Reinvestment Rate 41%
Return on Capital9.01%
Term Yr 2,728 - 890=1838
+ Lambda1.21
XCountry Equity RiskPremium2.60%
Country Default Spread1.30%
X
Rel Equity Mkt Vol
2.00
On June 15, 2004Tata Chem= Rs 136.2
Average Reinvestment Rate(1999-2003) = 41%
Year 1 2 3 4 5EBIT (1-t) 2291 2376 2464 2555 2649 - Reinvestment 939 974 1010 1047 1086FCFF 1352 1402 1454 1507 1563

Aswath Damodaran 11
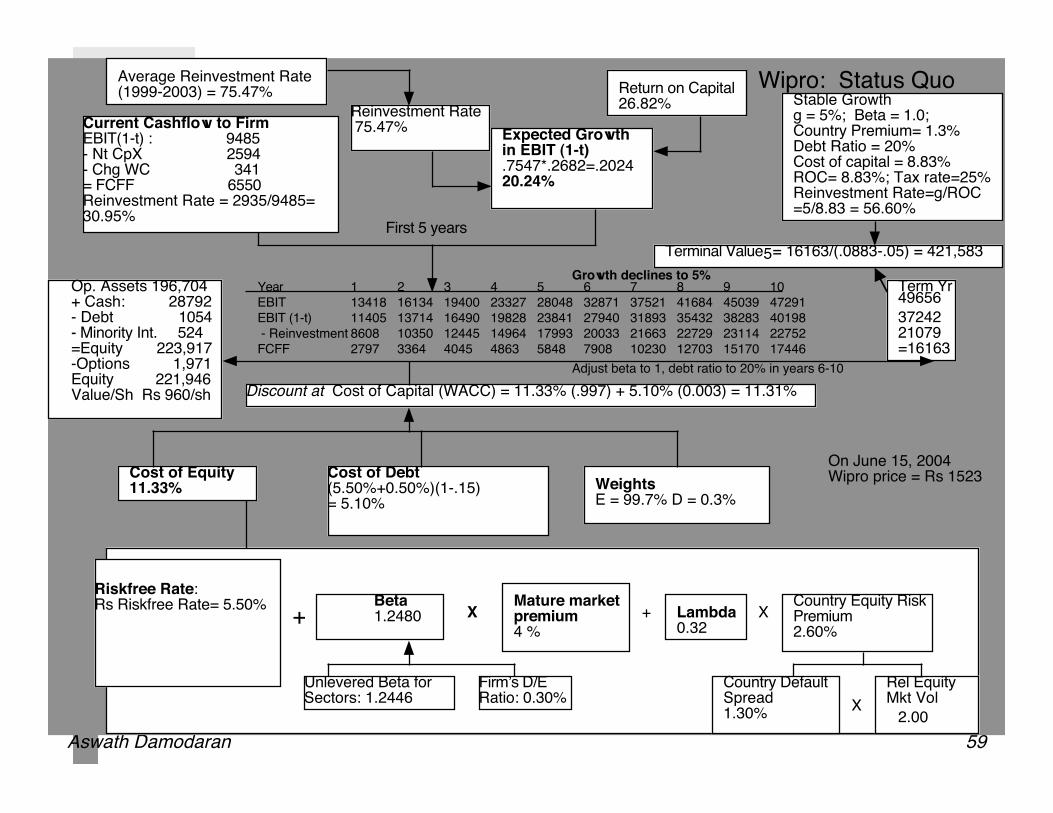
Current Cashflow to FirmEBIT(1-t) : 9485- Nt CpX 2594 - Chg WC 341= FCFF 6550Reinvestment Rate = 2935/9485= 30.95%
Expected Growth in EBIT (1-t).7547*.2682=.202420.24%
Stable Growthg = 5%; Beta = 1.0;Country Premium= 1.3%Debt Ratio = 20%Cost of capital = 8.83% ROC= 8.83%; Tax rate=25%Reinvestment Rate=g/ROC =5/8.83 = 56.60%
Terminal Value5= 16163/(.0883-.05) = 421,583
Cost of Equity11.33%
Cost of Debt(5.50%+0.50%)(1-.15)= 5.10%
WeightsE = 99.7% D = 0.3%
Discount at Cost of Capital (WACC) = 11.33% (.997) + 5.10% (0.003) = 11.31%
Op. Assets 196,704+ Cash: 28792- Debt 1054- Minority Int. 524=Equity 223,917-Options 1,971Equity 221,946Value/Sh Rs 960/sh
Riskfree Rate:Rs Riskfree Rate= 5.50%
+Beta 1.2480 X
Mature market premium 4 %
Unlevered Beta for Sectors: 1.2446
Firm’s D/ERatio: 0.30%
Wipro: Status Quo
Reinvestment Rate 75.47%
Return on Capital26.82%
Term Yr 3724221079=16163
+ Lambda0.32
XCountry Equity RiskPremium2.60%
Country Default Spread1.30%
X
Rel Equity Mkt Vol
2.00
On June 15, 2004Wipro price = Rs 1523
Average Reinvestment Rate(1999-2003) = 75.47%
Year 1 2 3 4 5 6 7 8 9 10
EBIT 13418 16134 19400 23327 28048 32871 37521 41684 45039 47291
EBIT (1-t) 11405 13714 16490 19828 23841 27940 31893 35432 38283 40198
- Reinvestment 8608 10350 12445 14964 17993 20033 21663 22729 23114 22752
FCFF 2797 3364 4045 4863 5848 7908 10230 12703 15170 17446
Adjust beta to 1, debt ratio to 20% in years 6-10
49656
First 5 years
Growth declines to 5%
Aswath Damodaran 12
I. Discount Rates:Cost of Equity
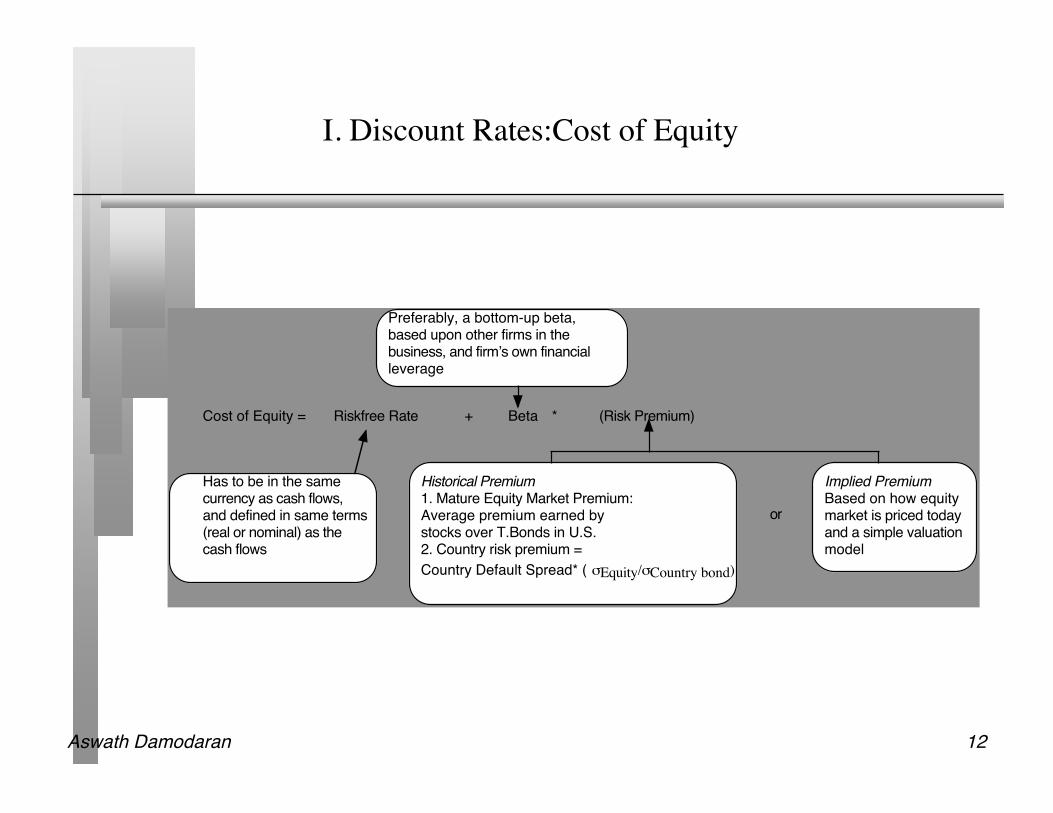
Cost of Equity = Riskfree Rate + Beta * (Risk Premium)
Has to be in the samecurrency as cash flows, and defined in same terms(real or nominal) as thecash flows
Preferably, a bottom-up beta,based upon other firms in thebusiness, and firm’s own financialleverage
Historical Premium1. Mature Equity Market Premium:Average premium earned bystocks over T.Bonds in U.S.2. Country risk premium =
Country Default Spread* ( !Equity/!Country bond)
Implied PremiumBased on how equitymarket is priced todayand a simple valuationmodel
or

Aswath Damodaran 13
Riskfree Rates: Some Perspective

Aswath Damodaran 14
Equity Risk Premium
The equity risk premium is the premium you (as an investor) would demandto invest in equity as a class (or in the average risk stock) instead of a risklessinvestment. It will depend upon your risk aversion as an investor and shouldbe different for different investors.
There are three ways to estimate the equity risk premium.• The Survey approach: Survey investors to find out what they would demand as a
premium for investing in stocks.• Look at the past: Estimate what you would have made investing in stocks as
opposed to the riskless investment over a long period of history.• Back it out of market prices: Using the current level of the equity index and
expected dividends on the index to back out an implied equity risk premium.

Aswath Damodaran 15
Everyone uses historical premiums, but..
The historical risk premium is easiest to estimate in the United States, becausethere is unbroken market data going back to 1870.
Arithmetic average Geometric AverageStocks - Stocks - Stocks - Stocks -
Historical Period T.Bills T.Bonds T.Bills T.Bonds1928-2003 7.92% 6.54% 5.99% 4.82%1963-2003 6.09% 4.70% 4.85% 3.82%1993-2003 8.43% 4.87% 6.68% 3.57%
Can you estimate a “reliable” historical risk premium for India?
Aswath Damodaran 16
Assessing Country Risk Using Country Ratings
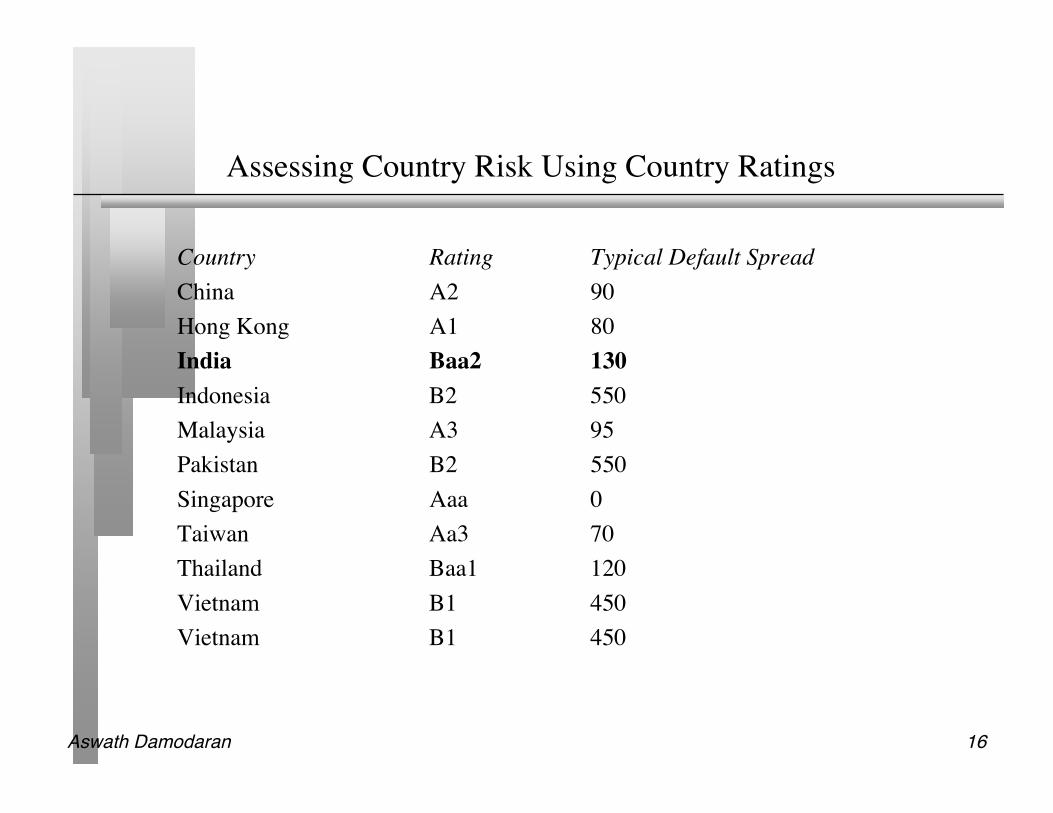
Country Rating Typical Default SpreadChina A2 90Hong Kong A1 80India Baa2 130Indonesia B2 550Malaysia A3 95Pakistan B2 550Singapore Aaa 0Taiwan Aa3 70Thailand Baa1 120Vietnam B1 450Vietnam B1 450

Aswath Damodaran 17
Using Country Ratings to Estimate Equity Spreads
Country ratings measure default risk. While default risk premiums and equityrisk premiums are highly correlated, one would expect equity spreads to behigher than debt spreads.
• One way to adjust the country spread upwards is to use information from the USmarket. In the US, the equity risk premium has been roughly twice the defaultspread on junk bonds.
• Another is to multiply the bond spread by the relative volatility of stock and bondprices in that market. For example,
– Standard Deviation in BSE = 32%– Standard Deviation in Indian Government Bond = 16%– Adjusted Equity Spread = 1.30% (32/16) = 2.60%

Aswath Damodaran 18
Country Risk and Company Risk: Three points of view
Approach 1: Assume that every company in the country is equally exposed tocountry risk. In this case,
E(Return) = Riskfree Rate + Country premium + Beta (Mature market premium) Approach 2: Assume that a company’s exposure to country risk is similar to
its exposure to other market risk.E(Return) = Riskfree Rate + Beta (Mature market premium + Country premium) Approach 3: Treat country risk as a separate risk factor and allow firms to
have different exposures to country risk (perhaps based upon the proportionof their revenues come from non-domestic sales)
E(Return)=Riskfree Rate+ β (Mature market premium) + λ (Country premium)

Aswath Damodaran 19
Estimating Company Exposure to Country Risk:Determinants
Source of revenues: Other things remaining equal, a company should be moreexposed to risk in a country if it generates more of its revenues from thatcountry. An Indian firm that generates the bulk of its revenues in India shouldbe more exposed to country risk than one that generates a smaller percent ofits business within India.
Manufacturing facilities: Other things remaining equal, a firm that has all ofits production facilities in India should be more exposed to country risk thanone which has production facilities spread over multiple countries. Theproblem will be accented for companies that cannot move their productionfacilities (mining and petroleum companies, for instance).
Use of risk management products: Companies can use both options/futuresmarkets and insurance to hedge some or a significant portion of country risk.

Aswath Damodaran 20
Estimating Lambdas: The Revenue Approach
The easiest and most accessible data is on revenues. Most companies break theirrevenues down by region. One simplistic solution would be to do the following:λ = % of revenues domesticallyfirm/ % of revenues domesticallyavg firm
Consider, for instance, Tata Chemicals and Wipro. Tata Chemicas gets 98% of itsrevenues in India whereas Wipro gets only 26% of its revenues in India. The averageIndian company gets about 81% of its revenues in India:
• LambdaWipro = 26%/ 81% = .32• LambdaTata Chemicals= 98%/81% = 1.21
There are two implications• A company’s risk exposure is determined by where it does business and not by where it is
located• Firms might be able to actively manage their country risk exposures

Aswath Damodaran 21
Implied Equity Premium for the S&P 500: January 1, 2004
We can use the information in stock prices to back out how risk averse the market is and how much of a risk premium itis demanding.
If you pay the current level of the index, you can expect to make a return of 7.94% on stocks (which is obtained bysolving for r in the following equation)
Implied Equity risk premium = Expected return on stocks - Treasury bond rate = 7.94% - 4.25% = 3.69%
January 1, 2004S&P 500 is at 1111.91
In 2003, dividends & stock buybacks were 2.81% of the index, generating 31.29 in cashflows
Analysts expect earnings to grow 9.5% a year for the next 5 years as the economy comes out of a recession.
After year 5, we will assume that earnings on the index will grow at 4.25%, the same rate as the entire economy
34.26 37.52 41.08 44.98 49.26
!
1111.91=34.26
(1+ r)+37.52
(1+ r)2
+41.08
(1+ r)3
+44.98
(1+ r)4
+49.26
(1+ r)5
+49.26(1.0425)
(r " .0425)(1+ r)5

Aswath Damodaran 22
U.S. Equity Risk Premiums - 1960 - 2003

Aswath Damodaran 23
Monthly Premiums: 2000 - 2002

Aswath Damodaran 24
An Intermediate Solution
The historical risk premium of 4.82% for the United States is too high apremium to use in valuation. It is much higher than the actual implied equityrisk premium in the market
The current implied equity risk premium requires us to assume that themarket is correctly priced today. (If I were required to be market neutral, thisis the premium I would use)
The average implied equity risk premium between 1960-2003 in the UnitedStates is about 4%. We will use this as the premium for a mature equitymarket.

Aswath Damodaran 25
Implied Premium for the Indian Market: June 15, 2004
Level of the Index (S&P CNX Index) = 1219• This is a market cap weighted index of the 500 largest companies in India and
represents 90% of the market value of Indian companies Dividends on the Index = 3.51% of 1219 (Simple average is 2.75%) Other parameters
• Riskfree Rate = 5.50%• Expected Growth (in Rs)
– Next 5 years = 18% (Used expected growth rate in Earnings)– After year 5 = 5.5%
Solving for the expected return:• Expected return on Equity = 11.76%• Implied Equity premium = 11.76-5.5% = 6.16%
A Comparison to historical premiums• Adjusted historical risk premium = 4% + 2.6% = 6.6%

Aswath Damodaran 26
Estimating Beta
The standard procedure for estimating betas is to regress stock returns (Rj)against market returns (Rm) -
Rj = a + b Rm• where a is the intercept and b is the slope of the regression.
The slope of the regression corresponds to the beta of the stock, and measuresthe riskiness of the stock.
This beta has three problems:• It has high standard error• It reflects the firm’s business mix over the period of the regression, not the current
mix• It reflects the firm’s average financial leverage over the period rather than the
current leverage.

Aswath Damodaran 27
Beta Estimation: Wipro

Aswath Damodaran 28
Beta Estimation for Tata Chemicals

Aswath Damodaran 29
Determinants of Betas
Product or Service: The beta value for a firm depends upon the sensitivity of thedemand for its products and services and of its costs to macroeconomic factors thataffect the overall market.
• Cyclical companies have higher betas than non-cyclical firms• Firms which sell more discretionary products will have higher betas than firms that sell less
discretionary products Operating Leverage: The greater the proportion of fixed costs in the cost structure of a
business, the higher the beta will be of that business. Higher fixed costs increase yourexposure to all risk, including market risk.
Financial Leverage: The more debt a firm takes on, the higher the beta will be of theequity in that business. Debt creates a fixed cost, interest expenses, that increasesexposure to market risk. The beta of equity alone can be written as a function of theunlevered beta and the debt-equity ratio
βL = βu (1+ ((1-t)D/E)βL = Levered or Equity Beta βu = Unlevered Betat = Corporate marginal tax rate D = Market Value of DebtE = Market Value of Equity

Aswath Damodaran 30
The Solution: Bottom-up Betas
Step 1: Find the business or businesses that your firm operates in.
Step 2: Find publicly traded firms in each of these businesses and obtain their regression betas. Compute the simple average across these regression betas to arrive at an average beta for these publicly traded firms. Unlever this average beta using the average debt to equity ratio across the publicly traded firms in the sample.Unlevered beta for business = Average beta across publicly traded firms/ (1 + (1- t) (Average D/E ratio across firms))
If you can, adjust this beta for differencesbetween your firm and the comparablefirms on operating leverage and product characteristics.
Step 3: Estimate how much value your firm derives from each of the different businesses it is in.
While revenues or operating income are often used as weights, it is better to try to estimate the value of each business.
Step 4: Compute a weighted average of the unlevered betas of the different businesses (from step 2) using the weights from step 3.Bottom-up Unlevered beta for your firm = Weighted average of the unlevered betas of the individual business
Step 5: Compute a levered beta (equity beta) for your firm, using the market debt to equity ratio for your firm. Levered bottom-up beta = Unlevered beta (1+ (1-t) (Debt/Equity))
If you expect the business mix of your firm to change over time, you can change the weights on a year-to-year basis.
If you expect your debt to equity ratio to change over time, the levered beta will change over time.
Possible Refinements

Aswath Damodaran 31
Estimating Bottom-up Betas
Tata Chemicals is in only one business chemicals. To estimate its beta, weused the unlevered beta for chemical companies in emerging markets (0.74),Tata Chemical’s debt to equity ratio (31.13%) and a tax rate of 30%.
• Levered beta = 0.74 (1 + (1- .30) (.3113)) = 0.90 Wipro is in multiple businesses and has paid only 15% of its income in taxes
in recent years.
Business Mix Revenues Operating Income Weights Unlevered beta Debt/Equity Levered Beta
Consulting and Service 36803 7128 63.88% 0.98 0.30% 0.98
Software 16534 3203 28.70% 1.97 0.30% 1.98
Consumer products 5475 828 7.42% 0.72 0.30% 0.72
11159 1.24 0.30% 1.25

Aswath Damodaran 32
From Cost of Equity to Cost of Capital
Cost of Capital = Cost of Equity (Equity/(Debt + Equity)) + Cost of Borrowing (1-t) (Debt/(Debt + Equity))
Cost of borrowing should be based upon(1) synthetic or actual bond rating(2) default spreadCost of Borrowing = Riskfree rate + Default spread
Marginal tax rate, reflectingtax benefits of debt
Weights should be market value weightsCost of equitybased upon bottom-upbeta

Aswath Damodaran 33
Estimating Synthetic Ratings
The rating for a firm can be estimated using the financial characteristics of thefirm. In its simplest form, the rating can be estimated from the interestcoverage ratio
Interest Coverage Ratio = EBIT / Interest Expenses For Tata Chemicals, the interest coverage ratio is computed using operating
income and interest expenses from 2003:Interest coverage ratio = 3,156.5/509.1 = 6.20
For Wipro, the interest coverage ratio is computed using operating incomeand interest expenses from 2003:
Interest coverage ratio = 11,159/35.1 = 317.92

Aswath Damodaran 34
Interest Coverage Ratios, Ratings and Default Spreads
If Interest Coverage Ratio is Estimated Bond Rating Default Spread(2004)>12.50 AAA 0.35% Wipro: 317.929.5-12.5 AA 0.50%7.5-9.5 A+ 0.70%6-7.5 A 0.85% Tata Chemicals: 6.204.5-6 A– 1.00%4-4.5 BBB 1.50%3.5-4 BB+ 2.00%3-3.5 BB 2.50%2.5-3 B+ 3.25%2-2.5 B 4.00%1.5-2 B – 6.00%1.25-1.5 CCC 8.00%0.8-1.25 CC 10.00%0.5-0.8 C 12.00%<0.5 D 20.00%

Aswath Damodaran 35
Estimating the cost of debt for a firm
The synthetic rating for Tata Chemicals is A. Using the 2004 default spread of 0.85%,we estimate a cost of debt of 6.35% (using a riskfree rate of 5.50%):
Cost of debt = Riskfree rate + Company default spread= 5.50% + 0.85% = 6.35%
The synthetic rating for Wipro is AAA. The default spread for AAA rated bond of0.35% is added to the riskfree rate of 5.50%.
Pre-tax cost of debt = Riskfree Rate + Default spread= 5.50% + 0.35% = 5.85%

Aswath Damodaran 36
Estimating Cost of Capital: Tata Chemicals
Equity• Cost of Equity = Riskfree Rate + Beta * ERP + Lambda* CRP
=5.50% + 0.90 (4.00%) + 1.21 (2.60%) = 12.25%• Market Value of Equity = Rs 136.2*180.64 = Rs. 24,603 lakhs (76.3%)
Debt• Cost of debt = 5.50% + 0.85 = 6.35%• Tax rate used = 30%• Market Value of Debt = Rs 7,660 lakhs (23.7%)
Cost of CapitalCost of Capital = 12.25 % (.763) + 6.35% (1- .30) (.237) = 10.39%

Aswath Damodaran 37
Estimating Cost of Capital: Wipro
Equity• Cost of Equity = Riskfree Rate + Beta * ERP + Lambda* CRP
=5.50% + 1.25 (4.00%) + 0.32 (2.60%) = 11.33 %• Market Value of Equity = Rs 1532*231.29 = Rs. 352,312 lakhs (99.7%)
Debt• Cost of debt = 5.50% + 0.35% = 5.85%• Tax rate used = 15%• Market Value of Debt = Rs 1,054 lakhs (0.3%)
Cost of CapitalCost of Capital = 11.33 % (.997) + 5.85% (1- .15) (0.003)) = 11.31 %

Aswath Damodaran 38
II. Estimating Cash Flows to Firm
Earnings before interest and taxes
- Tax rate * EBIT
= EBIT ( 1- tax rate)
- (Capital Expenditures - Depreciation)
- Change in non-cash working capital
= Free Cash flow to the firm (FCFF)
Update- Trailing Earnings- Unofficial numbers
Normalize- History- Industry
Cleanse operating items of- Financial Expenses- Capital Expenses- Non-recurring expenses
Operating leases- Convert into debt- Adjust operating income
R&D Expenses- Convert into asset- Adjust operating income
Tax rate- can be effective for near future, but move to marginal- reflect net operating losses
Include- R&D- Acquisitions
Defined asNon-cash CA- Non-debt CL

Aswath Damodaran 39
The Importance of Updating
The operating income and revenue that we use in valuation should be updatednumbers. One of the problems with using annual reports is that they canbecome dated the further away one gets from the end of the fiscal year.
As a general rule, it is better to use 12-month trailing estimates for earningsand revenues than numbers for the most recent financial year. This rulebecomes even more critical when valuing companies that are evolving andgrowing rapidly.
For Wipro, the annual report for 2003-04 is available and was used for theinformation. It is the most updated information on the company. TataChemicals provides partial information for 2003-04 but not a full annualreport. We took the information we could find (revenues, operating income,depreciation) and estimated those that we could not.

Aswath Damodaran 40
Wipro’s History

Aswath Damodaran 41
Operating Leases and other Commitments
Accounting rules treat leases differently from conventional debt. A firm thatleases assets is often allowed to treat the lease expense as an operatingexpense and show no debt on it’s books even when the lease is a long termcommitment.
We should be consistent in the way we deal with leases and debt. Acommitment to make lease payments in the future is the equivalent of takingout a loan.
The simplest way to convert lease commitments into debt is to take thepresent value of lease commitments at the pre-tax cost of debt and show thispresent value as debt where ever we use debt in valuation.

Aswath Damodaran 42
Capitalizing R&D Expenses
According to basic accounting principles, expenses designed to generate benefits overmany years are capital expenditures. Hence, investment in land or buildings orequipment is capital expenditures. Using the same rationale, investments made bypharmaceutical or technology firms in R&D should also be capital expenditures.
To capitalize R&D,• Specify an amortizable life for R&D (2 - 10 years)• Collect past R&D expenses for as long as the amortizable life• Sum up the unamortized R&D over the period. (Thus, if the amortizable life is 5 years, the
research asset can be obtained by adding up 1/5th of the R&D expense from five years ago,2/5th of the R&D expense from four years ago...:
We considered capitalizing Wipro’s R&D expenses but decided not to simply becausethe amortizable life of R&D in this sector is so short (1-2 years) that it does not makemuch of a difference.

Aswath Damodaran 43
Estimating Actual FCFF: Tata Chemicals and Wipro in 2003

Aswath Damodaran 44
IV. Expected Growth in EBIT and Fundamentals
The Determinants of Growth• Reinvestment Rate = (Net Capital Expenditures + Change in WC)/ EBIT (1-t)• Return on Capital = EBIT (1-t)/ (BV of Debt + BV of Equity)End of previous year
Expected Growth Rate is a product of these two numbersgEBIT = Reinvestment Rate * ROC
The “No pain, no growth” Proposition: No firm can expect its operatingincome to grow over the llong term without reinvesting some of the operatingincome in net capital expenditures and/or working capital.
The “Quality of Growth” Proposition: The net capital expenditure needs ofa firm, for a given growth rate, should be inversely proportional to the qualityof its investments.

Aswath Damodaran 45
Measuring the Quality of Growth at Tata Chemicals andWipro
Tata Chemicals WiproEBIT (1-tax rate) 2210 9485 From 03-04 reports
Book Capital CalculationBook Debt 8162 591 From end of 02-03Book Equity 16359 34774Book Capital 24521 35365
Return on capital 9.01% 26.82% EBIT(1-t)/ Bk CapCost of capital 10.39% 11.31%Excess Return -1.38% 15.51%

Aswath Damodaran 46
Measuring Reinvestment
Tata Chemicals WiproNet Capital Expenditures 366 2594+ Change in WC 155 341= Reinvestment 521 2935/ EBIT (1-t) 2210 9485= Reinvestment Rate in latest year 23.57% 30.94%

Aswath Damodaran 47
Normalizing Reinvestment: Tata Chemicals and Wipro

Aswath Damodaran 48
Expected Growth Estimate
Expected Growth in EBIT (1-t).41*.0901=.03693.69%
Reinvestment Rate 41%
Return on Capital9.01%
Expected Growth in EBIT (1-t).7547*.2682=.202420.24%
Reinvestment Rate 75.47%
Return on Capital26.82%
Tata Chemicals Wipro

Aswath Damodaran 49
V. Growth Patterns
A key assumption in all discounted cash flow models is the period of highgrowth, and the pattern of growth during that period. In general, we can makeone of three assumptions:
• there is no high growth, in which case the firm is already in stable growth• there will be high growth for a period, at the end of which the growth rate will
drop to the stable growth rate (2-stage)• there will be high growth for a period, at the end of which the growth rate will
decline gradually to a stable growth rate(3-stage)
Stable Growth 2-Stage GrowthWipro
3-Stage Growth

Aswath Damodaran 50
Determinants of Growth Patterns
Size of the firm• Success usually makes a firm larger. As firms become larger, it becomes much
more difficult for them to maintain high growth rates Current growth rate
• While past growth is not always a reliable indicator of future growth, there is acorrelation between current growth and future growth. Thus, a firm growing at30% currently probably has higher growth and a longer expected growth periodthan one growing 10% a year now.
Barriers to entry and differential advantages• Ultimately, high growth comes from high project returns, which, in turn, comes
from barriers to entry and differential advantages.• The question of how long growth will last and how high it will be can therefore be
framed as a question about what the barriers to entry are, how long they will stayup and how strong they will remain.

Aswath Damodaran 51
Moving to Stable Growth: Tata Chemicals versus Wipro

Aswath Damodaran 52
Stable Growth Characteristics
In stable growth, firms should have the characteristics of other stable growthfirms. In particular,
• The risk of the firm, as measured by beta and ratings, should reflect that of a stablegrowth firm.
– Beta should move towards one– The cost of debt should reflect the safety of stable firms (BBB or higher)
• The debt ratio of the firm might increase to reflect the larger and more stableearnings of these firms.
– The debt ratio of the firm might moved to the optimal or an industry average– If the managers of the firm are deeply averse to debt, this may never happen
• The reinvestment rate of the firm should reflect the expected growth rate and thefirm’s return on capital
– Reinvestment Rate = Expected Growth Rate / Return on Capital

Aswath Damodaran 53
Transitioning to Stable Growth: Beyond the growth rate
High Growth Stable Growth Tata Chemicals
• Beta 0.90 0.90• Debt Ratio 23.74% 23.74%• Lambda` 1.211 1.21• Return on Capital 9.01% 9.19%• Cost of Capital 7.10% 9.19%• Expected Growth Rate 3.69% 3.00%• Reinvestment Rate 41.00% 3/9.19 = 32.63%
Wipro• Beta 1.25 1.00• Debt Ratio 0.30% 20%• Lambda 0.32 0.32• Return on Capital 26.82% 8.83%• Cost of Capital 11.31% 8.83%• Expected Growth Rate 20.24% 5%• Reinvestment Rate 75.47% 5/8.83 = 56.60%

Aswath Damodaran 54
Dealing with Cash and Marketable Securities
The simplest and most direct way of dealing with cash and marketablesecurities is to keep them out of the valuation - the cash flows should bebefore interest income from cash and securities, and the discount rate shouldnot be contaminated by the inclusion of cash. (Use betas of the operatingassets alone to estimate the cost of equity).
Once the firm has been valued, add back the value of cash and marketablesecurities.
• If you have a particularly incompetent management, with a history of overpayingon acquisitions, markets may discount the value of this cash.

Aswath Damodaran 55
Dealing with Cross Holdings
When the holding is a majority, active stake, the value that we obtain from thecash flows includes the share held by outsiders. While their holding ismeasured in the balance sheet as a minority interest, it is at book value. To getthe correct value, we need to subtract out the estimated market value of theminority interests from the firm value.
When the holding is a minority, passive interest, the problem is a differentone. The firm shows on its income statement only the share of dividends itreceives on the holding. Using only this income will understate the value ofthe holdings. In fact, we have to value the subsidiary as a separate entity toget a measure of the market value of this holding.
Proposition 1: It is almost impossible to correctly value firms with minority,passive interests in a large number of private subsidiaries.

Aswath Damodaran 56
Valuing Minority Interests, Cross Holdings and Cash
Tata Chemicals• Has no significant cross holdings. Nor does it show minority interests on its
balance sheet.• It does have a cash balance of Rs 2,904 lakhs.
Wipro• Wipro shows minority interests in other firms that are consolidated (100%) into
their firms. The book value of these minority interests is Rs 163.80 lakhs and theaverage price to book ratio in this sector is 3.20. The estimated market value of theminority interests is as follows:
– Estimated market value of minority interests = 163.80 * 3.20 = Rs 524.16lakhs
• Wipro also shows investments in other companies but does not provide enoughinformation to value these holdings. The book value of these holdings which is Rs7,032 lakhs is assumed to be the market value of these holdings. Adding this to thecash and marketable securities which amounted to Rs 21,760 lakhs in March 2004yields a value for cash and non-operating assets of Rs 28,792 lakhs (21,760 + 7032)

Aswath Damodaran 57
Wipro: Estimating the Value of Equity Options
Details of options outstanding• Average strike price of options outstanding = Rs 1540• Current Stock Price = Rs 1523• Average maturity of options outstanding = 2.87 years• Standard deviation in ln(stock price) = 40.20%• Annualized dividend yield on stock = 0.26%• Riskfree rate = 5.50%• Number of options outstanding = 4.8 lakhs• Number of shares outstanding = 231.29 lakhs
Value of options outstanding (using dilution-adjusted Black-Scholes model)• Value of equity options = Rs 1,971 Lakhs

Aswath Damodaran 58
Current Cashflow to FirmEBIT(1-t) : 2210- Nt CpX 366 - Chg WC 155= FCFF 1689Reinvestment Rate = 521/1689= 23.58%
Expected Growth in EBIT (1-t).41*.0901=.03693.69%
Stable Growthg = 3%; Beta = 0.9;Country Premium= 1.3%Debt Ratio = 23.7%Cost of capital = 9.19% ROC= 9.19%; Tax rate=30%Reinvestment Rate=g/ROC =3/9.19 = 32.63%
Terminal Value5= 1826/(.0919-.03) = 29,676
Cost of Equity12.25%
Cost of Debt(5.50%+0.85%)(1-.30)= 4.45%
WeightsE = 76.3% D = 23.7%
Discount at Cost of Capital (WACC) = 12.25% (.763) + 4.45% (0.237) = 10.39%
Op. Assets 23,524+ Cash: 2,904- Debt 7,660=Equity 18,768-Options 0Equity 18,768Value/Sh Rs 104/sh
Riskfree Rate:Rs Riskfree Rate= 5.50%
+Beta 0.90 X
Mature market premium 4 %
Unlevered Beta for Sectors: 0.74
Firm’s D/ERatio: 31.13%
Tata Chemicals: StatusQuo
Reinvestment Rate 41%
Return on Capital9.01%
Term Yr 2,728 - 890=1838
+ Lambda1.21
XCountry Equity RiskPremium2.60%
Country Default Spread1.30%
X
Rel Equity Mkt Vol
2.00
On June 15, 2004Tata Chem= Rs 136.2
Average Reinvestment Rate(1999-2003) = 41%
Year 1 2 3 4 5EBIT (1-t) 2291 2376 2464 2555 2649 - Reinvestment 939 974 1010 1047 1086FCFF 1352 1402 1454 1507 1563
Aswath Damodaran 59
Current Cashflow to FirmEBIT(1-t) : 9485- Nt CpX 2594 - Chg WC 341= FCFF 6550Reinvestment Rate = 2935/9485= 30.95%
Expected Growth in EBIT (1-t).7547*.2682=.202420.24%
Stable Growthg = 5%; Beta = 1.0;Country Premium= 1.3%Debt Ratio = 20%Cost of capital = 8.83% ROC= 8.83%; Tax rate=25%Reinvestment Rate=g/ROC =5/8.83 = 56.60%
Terminal Value5= 16163/(.0883-.05) = 421,583
Cost of Equity11.33%
Cost of Debt(5.50%+0.50%)(1-.15)= 5.10%
WeightsE = 99.7% D = 0.3%
Discount at Cost of Capital (WACC) = 11.33% (.997) + 5.10% (0.003) = 11.31%
Op. Assets 196,704+ Cash: 28792- Debt 1054- Minority Int. 524=Equity 223,917-Options 1,971Equity 221,946Value/Sh Rs 960/sh
Riskfree Rate:Rs Riskfree Rate= 5.50%
+Beta 1.2480 X
Mature market premium 4 %
Unlevered Beta for Sectors: 1.2446
Firm’s D/ERatio: 0.30%
Wipro: Status Quo
Reinvestment Rate 75.47%
Return on Capital26.82%
Term Yr 3724221079=16163
+ Lambda0.32
XCountry Equity RiskPremium2.60%
Country Default Spread1.30%
X
Rel Equity Mkt Vol
2.00
On June 15, 2004Wipro price = Rs 1523
Average Reinvestment Rate(1999-2003) = 75.47%
Year 1 2 3 4 5 6 7 8 9 10
EBIT 13418 16134 19400 23327 28048 32871 37521 41684 45039 47291
EBIT (1-t) 11405 13714 16490 19828 23841 27940 31893 35432 38283 40198
- Reinvestment 8608 10350 12445 14964 17993 20033 21663 22729 23114 22752
FCFF 2797 3364 4045 4863 5848 7908 10230 12703 15170 17446
Adjust beta to 1, debt ratio to 20% in years 6-10
49656
First 5 years
Growth declines to 5%

Aswath Damodaran 60
Value Enhancement: Back to Basics
Aswath Damodaranhttp://www.damodaran.com

Aswath Damodaran 61
Price Enhancement versus Value Enhancement

Aswath Damodaran 62
The Paths to Value Creation
Using the DCF framework, there are four basic ways in which the value of afirm can be enhanced:
• The cash flows from existing assets to the firm can be increased, by either– increasing after-tax earnings from assets in place or– reducing reinvestment needs (net capital expenditures or working capital)
• The expected growth rate in these cash flows can be increased by either– Increasing the rate of reinvestment in the firm– Improving the return on capital on those reinvestments
• The length of the high growth period can be extended to allow for more years ofhigh growth.
• The cost of capital can be reduced by– Reducing the operating risk in investments/assets– Changing the financial mix– Changing the financing composition

Aswath Damodaran 63
I. Ways of Increasing Cash Flows from Assets in Place
Revenues
* Operating Margin
= EBIT
- Tax Rate * EBIT
= EBIT (1-t)
+ Depreciation- Capital Expenditures- Chg in Working Capital= FCFF
Divest assets thathave negative EBIT
More efficient operations and cost cuttting: Higher Margins
Reduce tax rate- moving income to lower tax locales- transfer pricing- risk management
Live off past over- investment
Better inventory management and tighter credit policies

Aswath Damodaran 64
Room for improvement?

Aswath Damodaran 65
II. Value Enhancement through Growth
Reinvestment Rate
* Return on Capital
= Expected Growth Rate
Reinvest more inprojects
Do acquisitions
Increase operatingmargins
Increase capital turnover ratio
Expected Growth in EBIT (1-t).41*.0901=.03693.69%
Reinvestment Rate 41%
Return on Capital9.01%
Expected Growth in EBIT (1-t).7547*.2682=.202420.24%
Reinvestment Rate 75.47%
Return on Capital26.82%
Tata Chemicals Wipro

Aswath Damodaran 66
Growth Potential?

Aswath Damodaran 67
III. Building Competitive Advantages: Increase length of thegrowth period
Increase length of growth period
Build on existing competitive advantages
Find new competitive advantages
Brand name
Legal Protection
Switching Costs
Cost advantages

Aswath Damodaran 68
Illustration: Valuing a brand name: Coca Cola
Coca Cola Generic Cola CompanyAT Operating Margin 18.56% 7.50%Sales/BV of Capital 1.67 1.67ROC 31.02% 12.53%Reinvestment Rate 65.00% (19.35%) 65.00% (47.90%)Expected Growth 20.16% 8.15%Length 10 years 10 yeaCost of Equity 12.33% 12.33%E/(D+E) 97.65% 97.65%AT Cost of Debt 4.16% 4.16%D/(D+E) 2.35% 2.35%Cost of Capital 12.13% 12.13%Value $115 $13

Aswath Damodaran 69
IV. Reducing Cost of Capital
Cost of Equity (E/(D+E) + Pre-tax Cost of Debt (D./(D+E)) = Cost of Capital
Change financing mix
Make product or service less discretionary to customers
Reduce operating leverage
Match debt to assets, reducing default risk
Changing product characteristics
More effective advertising
Outsourcing Flexible wage contracts &cost structure
Swaps Derivatives Hybrids

Aswath Damodaran 70
Tata Chemicals: Optimal Debt Ratio
Debt Ratio Beta Cost of Equity Bond Rating Interest rate on debt Tax Rate Cost of Debt (after-tax) WACC Firm Value (G)
0% 0.74 11.60% AAA 6.00% 30.00% 4.20% 11.60% $26,591
10% 0.80 11.83% AA 6.00% 30.00% 4.20% 11.07% $28,841
20% 0.87 12.12% A+ 6.20% 30.00% 4.34% 10.56% $31,333
30% 0.96 12.49% A- 6.50% 30.00% 4.55% 10.11% $33,964
40% 1.08 12.98% BB 8.00% 30.00% 5.60% 10.03% $34,459
50% 1.26 13.67% B- 11.50% 30.00% 8.05% 10.86% $29,819
60% 1.51 14.71% CC 15.50% 30.00% 10.85% 12.39% $23,810
70% 2.00 16.63% CC 15.50% 27.05% 11.31% 12.90% $22,284
80% 3.08 20.95% C 17.50% 20.96% 13.83% 15.25% $17,139
90% 6.54 34.80% D 25.50% 12.79% 22.24% 23.50% $9,115
Tata Chemical’s Existing Debt RatioEquity = 76.3% Debt = 23.7%Cost of Capital = 10.39%

Aswath Damodaran 71
Wipro : Optimal Capital Structure
Debt Ratio Beta Cost of Equity Bond Rating Interest rate on debt Tax Rate Cost of Debt (after-tax) WACC Firm Value (G)
0% 1.24 11.31% AAA 6.00% 15.00% 5.10% 11.31% $352,963
10% 1.36 11.78% A- 6.50% 15.00% 5.53% 11.16% $363,207
20% 1.51 12.37% CC 15.50% 15.00% 13.18% 12.53% $288,429
30% 1.73 13.26% C 17.50% 9.02% 15.92% 14.06% $233,642
40% 2.04 14.48% D 25.50% 4.64% 24.32% 18.41% $148,221
50% 2.44 16.11% D 25.50% 3.72% 24.55% 20.33% $126,554
60% 3.05 18.55% D 25.50% 3.10% 24.71% 22.25% $109,847
70% 4.07 22.62% D 25.50% 2.65% 24.82% 24.16% $96,571
80% 6.11 30.77% D 25.50% 2.32% 24.91% 26.08% $85,768
90% 12.22 55.20% D 25.50% 2.06% 24.97% 28.00% $76,805
Wipro’s Existing Debt RatioEquity = 99.7% Debt = 0.3%Cost of capital = 11.31%

Aswath Damodaran 72
Current Cashflow to FirmEBIT(1-t) : 2210- Nt CpX 366 - Chg WC 155= FCFF 1689Reinvestment Rate = 521/1689= 23.58%
Expected Growth in EBIT (1-t).40*.12=.0484.80%
Stable Growthg = 3%; Beta = 1.0Country Premium= 1.3%Debt Ratio = 40%Cost of capital = 8.30% ROC= 8.30%; Tax rate=30%Reinvestment Rate=g/ROC =3/8.30 = 36.14%
Terminal Value5= 1837/(.083-.03) = 34,663
Cost of Equity12.42%
Cost of Debt(5.50%+2.50%)(1-.30)= 5.60%
WeightsE = 60% D = 40%
Discount at Cost of Capital (WACC) = 12.42% (.763) + 5.60% (0.237) = 10.03%
Op. Assets 27,620+ Cash: 2,904- Debt 7,660=Equity 22,864-Options 0Equity 22,864Value/Sh Rs 127/sh
Riskfree Rate:Rs Riskfree Rate= 5.50%
+Beta 1.08 X
Mature market premium 4 %
Unlevered Beta for Sectors: 0.74
Firm’s D/ERatio: 31.13%
Tata Chemicals: RestructuredReinvestment Rate 40%
Return on Capital12%
Term Yr 2,877 1,040=1837
+ Lambda1.00
XCountry Equity RiskPremium2.60%
Country Default Spread1.30%
X
Rel Equity Mkt Vol
2.00
On June 15, 2004Tata Chem= Rs 136.2
Year 1 2 3 4 5EBIT (1-t) 2316 2427 2543 2665 2793 - Reinvestment 926 971 1017 1066 1117FCFF 1389 1456 1526 1599 1676
Aswath Damodaran 73
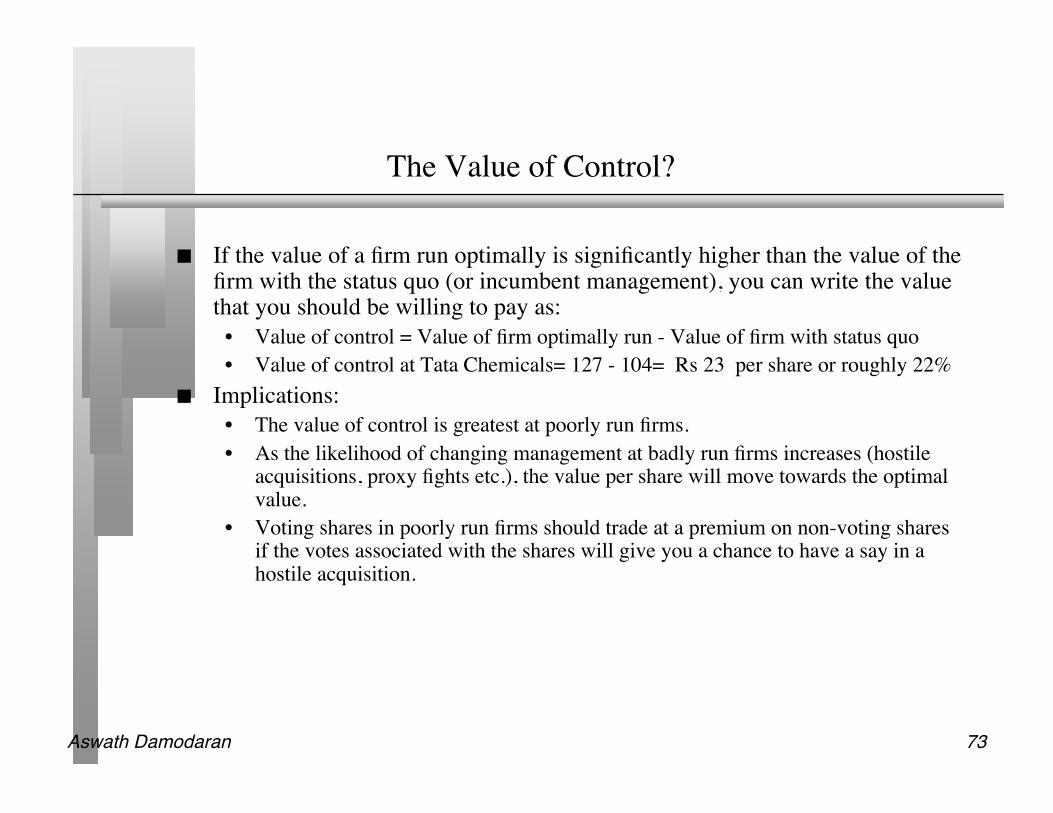
The Value of Control?
If the value of a firm run optimally is significantly higher than the value of thefirm with the status quo (or incumbent management), you can write the valuethat you should be willing to pay as:
• Value of control = Value of firm optimally run - Value of firm with status quo• Value of control at Tata Chemicals= 127 - 104= Rs 23 per share or roughly 22%
Implications:• The value of control is greatest at poorly run firms.• As the likelihood of changing management at badly run firms increases (hostile
acquisitions, proxy fights etc.), the value per share will move towards the optimalvalue.
• Voting shares in poorly run firms should trade at a premium on non-voting sharesif the votes associated with the shares will give you a chance to have a say in ahostile acquisition.

Aswath Damodaran 74
Relative Valuation
Aswath Damodaran

Aswath Damodaran 75
The Essence of relative valuation?
In relative valuation, the value of an asset is compared to the values assessedby the market for similar or comparable assets.
To do relative valuation then,• we need to identify comparable assets and obtain market values for these assets• convert these market values into standardized values, since the absolute prices
cannot be compared This process of standardizing creates price multiples.• compare the standardized value or multiple for the asset being analyzed to the
standardized values for comparable asset, controlling for any differences betweenthe firms that might affect the multiple, to judge whether the asset is under or overvalued

Aswath Damodaran 76
Assessing Tata Chemicals and Wipro on a RelativeValuation Basis: Pick a story….
Tata Chemicals Sector Wipro Sector
PE 10.92 13.99 34.95 29.21
P/BV 1.31 1.29 9.66 6.01
EV/Sales 1.16 1.06 6.17 5.06
EV/EBITDA 7.07 8.04 28.37 20.95

Aswath Damodaran 77
The Reasons for the allure…
“You can always look good if you compare yourself to the right person”
“ A little inaccuracy sometimes saves tons of explanation”H.H. Munro
“ If you are going to screw up, make sure that you have lots of company”Ex-portfolio manager

Aswath Damodaran 78
The Four Steps to Deconstructing Multiples
Define the multiple• In use, the same multiple can be defined in different ways by different users. When
comparing and using multiples, estimated by someone else, it is critical that weunderstand how the multiples have been estimated
Describe the multiple• Too many people who use a multiple have no idea what its cross sectional
distribution is. If you do not know what the cross sectional distribution of amultiple is, it is difficult to look at a number and pass judgment on whether it is toohigh or low.
Analyze the multiple• It is critical that we understand the fundamentals that drive each multiple, and the
nature of the relationship between the multiple and each variable. Apply the multiple
• Defining the comparable universe and controlling for differences is far moredifficult in practice than it is in theory.

Aswath Damodaran 79
Definitional Tests
Is the multiple consistently defined?• Proposition 1: Both the value (the numerator) and the standardizing variable
( the denominator) should be to the same claimholders in the firm. In otherwords, the value of equity should be divided by equity earnings or equity bookvalue, and firm value should be divided by firm earnings or book value.
Is the multiple uniformly estimated?• The variables used in defining the multiple should be estimated uniformly across
assets in the “comparable firm” list.• If earnings-based multiples are used, the accounting rules to measure earnings
should be applied consistently across assets. The same rule applies with book-value based multiples.

Aswath Damodaran 80
An Example: Price Earnings Ratio: Definition
PE = Market Price per Share / Earnings per Share There are a number of variants on the basic PE ratio in use. They are based
upon how the price and the earnings are defined. Price: is usually the current price
is sometimes the average price for the year EPS: earnings per share in most recent financial year
earnings per share in trailing 12 months (Trailing PE)forecasted earnings per share next year (Forward PE)forecasted earnings per share in future year

Aswath Damodaran 81
Descriptive Tests
What is the average and standard deviation for this multiple, across theuniverse (market)?
What is the median for this multiple?• The median for this multiple is often a more reliable comparison point.
How large are the outliers to the distribution, and how do we deal with theoutliers?
• Throwing out the outliers may seem like an obvious solution, but if the outliers alllie on one side of the distribution (they usually are large positive numbers), thiscan lead to a biased estimate.
Are there cases where the multiple cannot be estimated? Will ignoring thesecases lead to a biased estimate of the multiple?
How has this multiple changed over time?

Aswath Damodaran 82
PE Ratio: Descriptive Statistics for India versus OtherEmerging Markets

Aswath Damodaran 83
Analytical Tests
What are the fundamentals that determine and drive these multiples?• Proposition 2: Embedded in every multiple are all of the variables that drive every
discounted cash flow valuation - growth, risk and cash flow patterns.• In fact, using a simple discounted cash flow model and basic algebra should yield
the fundamentals that drive a multiple How do changes in these fundamentals change the multiple?
• The relationship between a fundamental (like growth) and a multiple (such as PE)is seldom linear. For example, if firm A has twice the growth rate of firm B, it willgenerally not trade at twice its PE ratio
• Proposition 3: It is impossible to properly compare firms on a multiple, if wedo not know the nature of the relationship between fundamentals and themultiple.

Aswath Damodaran 84
Relative Value and Fundamentals: Equity Multiples
Gordon Growth Model: Dividing both sides by the earnings,
Dividing both sides by the book value of equity,
If the return on equity is written in terms of the retention ratio and theexpected growth rate
Dividing by the Sales per share,
P0 =DPS1
r ! gn
P0
EPS0
= PE = Payout Ratio * (1 + gn )
r-gn
P 0
BV 0
= PBV = ROE - gn
r-gn
P 0
BV 0
= PBV = ROE * Payout Ratio * (1 + gn )
r-gn
P 0
Sales0
= PS = Profit Margin * Payout Ratio * (1 + gn )
r-gn

Aswath Damodaran 85
The Determinants of Multiples…
Value of Stock = DPS 1/(ke - g)
PE=Payout Ratio (1+g)/(r-g)
PEG=Payout ratio (1+g)/g(r-g)
PBV=ROE (Payout ratio) (1+g)/(r-g)
PS= Net Margin (Payout ratio)(1+g)/(r-g)
Value of Firm = FCFF 1/(WACC -g)
Value/FCFF=(1+g)/(WACC-g)
Value/EBIT(1-t) = (1+g) (1- RIR)/(WACC-g)
Value/EBIT=(1+g)(1-RiR)/(1-t)(WACC-g)
VS= Oper Margin (1-RIR) (1+g)/(WACC-g)
Equity Multiples
Firm Multiples
PE=f(g, payout, risk) PEG=f(g, payout, risk) PBV=f(ROE,payout, g, risk) PS=f(Net Mgn, payout, g, risk)
V/FCFF=f(g, WACC) V/EBIT(1-t)=f(g, RIR, WACC) V/EBIT=f(g, RIR, WACC, t) VS=f(Oper Mgn, RIR, g, WACC)

Aswath Damodaran 86
Extending to a High Growth Scenario…. Determinants ofPE Ratios
The price-earnings ratio for a high growth firm can also be related tofundamentals. In the special case of the two-stage dividend discount model,this relationship can be made explicit fairly simply:
• For a firm that does not pay what it can afford to in dividends, substituteFCFE/Earnings for the payout ratio.
Dividing both sides by the earnings per share:
P0 =
EPS0 * Payout Ratio *(1+ g)* 1 !(1+ g)
n
(1+ r)n
"
# $ %
&
r - g+
EPS0 * Payout Ration *(1+ g)n *(1+ gn )
(r -gn )(1+ r)n
P0
EPS0
=
Payout Ratio * (1 + g) * 1 !(1 + g)n
(1+ r)n
"
# $ %
& '
r - g+
Payout Ratio n *(1+ g)n * (1 + gn )
(r - gn )(1+ r)n
Aswath Damodaran 87
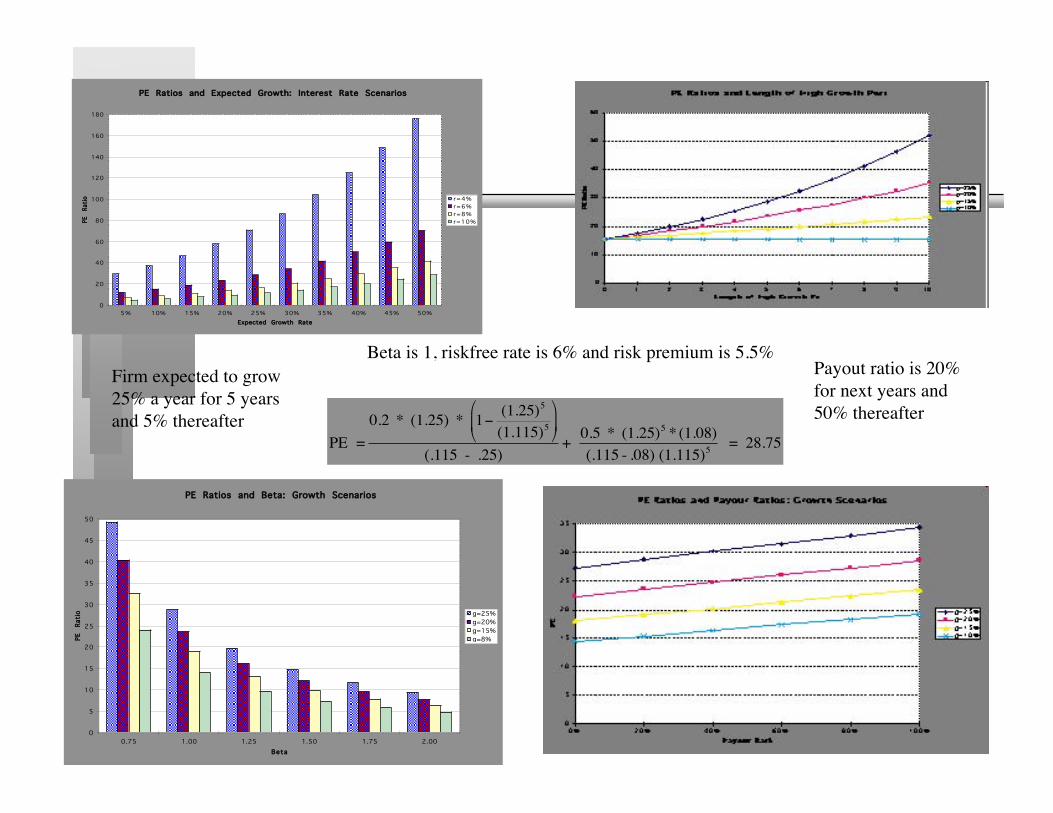
PE Ratios and Expected Growth: Interest Rate Scenarios
0
20
40
60
80
100
120
140
160
180
5% 10% 15% 20% 25% 30% 35% 40% 45% 50%
Expected Growth Rate
PE
Rati
o r=4%
r=6%
r=8%
r=10%
PE Ratios and Beta: Growth Scenarios
0
5
10
15
20
25
30
35
40
45
50
0.75 1.00 1.25 1.50 1.75 2.00
Beta
PE
Rati
o g=25%
g=20%
g=15%
g=8%
!
PE =
0.2 * (1.25) * 1"(1.25)
5
(1.115)5
#
$ %
&
' (
(.115 - .25)+
0.5 * (1.25)5* (1.08)
(.115 - .08) (1.115)5
= 28.75
Firm expected to grow25% a year for 5 yearsand 5% thereafter
Payout ratio is 20%for next years and50% thereafter
Beta is 1, riskfree rate is 6% and risk premium is 5.5%

Aswath Damodaran 88
Application Tests
Given the firm that we are valuing, what is a “comparable” firm?• While traditional analysis is built on the premise that firms in the same sector are
comparable firms, valuation theory would suggest that a comparable firm is onewhich is similar to the one being analyzed in terms of fundamentals.
• Proposition 4: There is no reason why a firm cannot be compared withanother firm in a very different business, if the two firms have the same risk,growth and cash flow characteristics.
Given the comparable firms, how do we adjust for differences across firms onthe fundamentals?
• Proposition 5: It is impossible to find an exactly identical firm to the one youare valuing.

Aswath Damodaran 89
Comparing PE Ratios : Wipro versus Infosys
Market Cap PE Ratio Payout Ratio Std Deviation Expected Growth Ratein EPS - Next 5 years
Infosys 358171.6 28.80 17.43% 41.64% 28.50%Wipro 362554.9 34.95 2.53% 52.98% 25.00%
Based upon these numbers, which company would you pick? What might you be missing inthis comparison?

Aswath Damodaran 90
Comparing PBV Ratios: Indian Chemical Companies
Short Name Market Cap PBV Ratio ROE Std Deviation
ASHOK ORGANIC 27 0.03 -7.67% 90.15%
INDIA GELATINE 105 0.12 0.99% 86.48%
STANDARD INDS 248 0.31 8.85% 110.76%
ATUL LTD 896 0.32 18.11% 63.06%
TAMILNADU PETRO 1682 0.37 4.45% 48.52%
AEGIS LOGISTICS 260 0.41 11.17% 82.65%
DEEPAK NITRITE 299 0.43 11.80% 49.24%
TRANSPEK INDUS 158 0.51 -7.00% 69.79%
NARMADA GELATINE 178 0.51 -1.16% 112.96%
EXCEL INDS LTD 523 0.54 4.26% 76.26%
JAYANT AGRO-ORG 233 0.63 2.30% 50.91%
VANAVIL DYES 190 0.66 7.96% 54.81%
KANORIA CHEMICAL 916 0.67 9.37% 62.29%
GUJARAT ALKALIES 2148 0.67 8.80% 69.12%
VASHISTI DETERGE 458 0.68 3.99% 57.86%
DAI-ICHI KARKARI 346 0.72 -4.47% 82.86%
PHILLIPS CARBON 717 0.73 18.80% 66.53%
THIRUMALAI CHEMS 607 0.74 15.97% 47.81%
GODREJ INDUSTRIE 2332 0.84 14.89% 46.50%
SAVITA CHEMICALS 962 0.86 17.77% 59.21%
GHCL LTD 2006 0.92 20.91% 38.67%
TATA CHEMICALS 21469 1.31 12.02% 52.25%
ULTRAMARINE & PG 518 1.39 7.96% 55.98%
ICI INDIA LTD 7038 1.41 8.21% 36.13%
INDIA GLYCOLS 2062 1.66 31.17% 62.45%
SCHENECTADY HERD 764 1.92 30.39% 61.64%
FOSECO INDIA LTD 1144 2.89 33.04% 47.73%
Sector 60661 1.29 9.19% 64.54%

Aswath Damodaran 91
A Different Look: PBV versus ROE
ROE
403020100-10
PB
V R
atio
3.0
2.5
2.0
1.5
1.0
.5
0.0 Rsq = 0.4962
FSC
HDCH
IGLY
ICIUMPTTC H
GHCLSVCHGDS P
TMCPHCBDIK TV GALKKCVDCJAOEXLSWGTPI
DNAGISTNP PATLPSTD
IGCAOI

Aswath Damodaran 92
Considering Risk as well…
STD
IGLY
PBV Ratio
12040
SWG
HDCH
0.0
AGIS.5
PHCB
ATLP
1.0
1.5
IGC
SVCH
FSC
10030
2.0
GALKEXL
2.5
KC
AOI
3.0
TMCGHCL
3.5
DN
GDS PDIK
8020
VDC
TTC H
TV
Std DeviationROE
UMP
TNPPTP I
JAO
6010
ICI
400
PBV = 0.82 + 3.57 ROE - 0.55 Std Dev

Aswath Damodaran 93
Back to Lemmings...