valuation: discounted cash flow (dcf)...
TRANSCRIPT

This document was developed and written by Ian Lee. All information is meant for public use and purposed for the free transfer of knowledge to interested parties. Send questions and comments to [email protected]
Valuation: Discounted Cash Flow (DCF) ModelMay 20, 2004
Table of Contents
I. Overview of the Discounted Cash Flow (DCF) Model
II. Discounted Cash Flow (DCF) Model
III. Sample DCF
IV. Additional Resources
2

I. Overview of the Discounted Cash Flow (DCF) Model
3

What is the DCFOverview
♦ The Discounted Cash Flow (DCF) Model is used to calculate the present value of a company or business
♦ Why would you want to calculate the value of company?
• If you want to take your company public through an IPO (initial public offering) of stock, you would need to know your company’svalue to determine how many shares of stock you should sell, and at what price you should sell it at
• If you want to sell your company to a potential buyer, you would want to calculate how much your firm is presently worth to structure the price of the transaction
• If you wanted to buy a company through acquisition, you would want to calculate the present value of that company to structure the pricing of the deal
4

♦ The DCF takes in available financial data (both historical and projected), makes its own assumptions, and then through a series of calculations, yields the present value of the company in $ dollars
♦ As an example, the yielded result (measured in terms of $ dollars) can then be used to calculate what the Company’s stock price should be, given a number of shares the Company wishes to sell, by this equation
How the Model FlowsOverview
Financial Data
Financial Projections
Financial Data
Financial Projections
32%
DCF INPUTS
Value of Company X(in $ dollars)
Value of Company X(in $ dollars)DCF
DCF OUTPUT
Company Value
Shares of Stock= Per Share Stock Price
5

Fundamental Understanding of the DCFOverview
♦ The theoretical bases of the DCF
• “A dollar today is worth more than a dollar ten years from now.” The real purchasing power of a dollar is discounted each year by a specific factor depending on economic and inflationary pressures. How much would a million dollars ten years from now be worth today? That is a function of the discount rate
• The present value of a company (what it is currently worth) is equal to all of the company’s future cash flows (all of the money it expects to generate in the future), discounted to present day $ dollars
♦ Very literally, this is why it is known as the “Discounted Cash Flow” model – it is projecting the future cash flows of a company and discounting it to present day $ dollar amounts
6
How the DCF WorksOverview
♦ Based off any available financial data (both historical and projected), the DCF,
• First, projects the Company’s expected cash flow each year for a finite number of years
• Second, sums all the projected cash flows from the first step
• And lastly, discounts the result from the second step by some rate to yield the value in terms of present day $ dollars
♦ That, in a nutshell, is the core understanding of the DCF model
7

Evaluating the DCF as a Method of ValuationOverview
♦ Advantages
• Flexible analysis – adaptable to many different situations and companies, and therefore can almost always be used
• Nicely accounts for changes in estimates/projections about the future
♦ Disadvantages
• Because the calculation is primarily based off future projections, it is sensitive to bias and subjectivity, and can therefore be easily manipulated
♦ How the DCF should be used
• It should be used to present a RANGE of values, not a single estimate
♦ Alternatives to the DCF method of valuation
• Comparable Company Analysis, Comparable Transaction Analysis
8
II. Discounted Cash Flow (DCF) Model
9
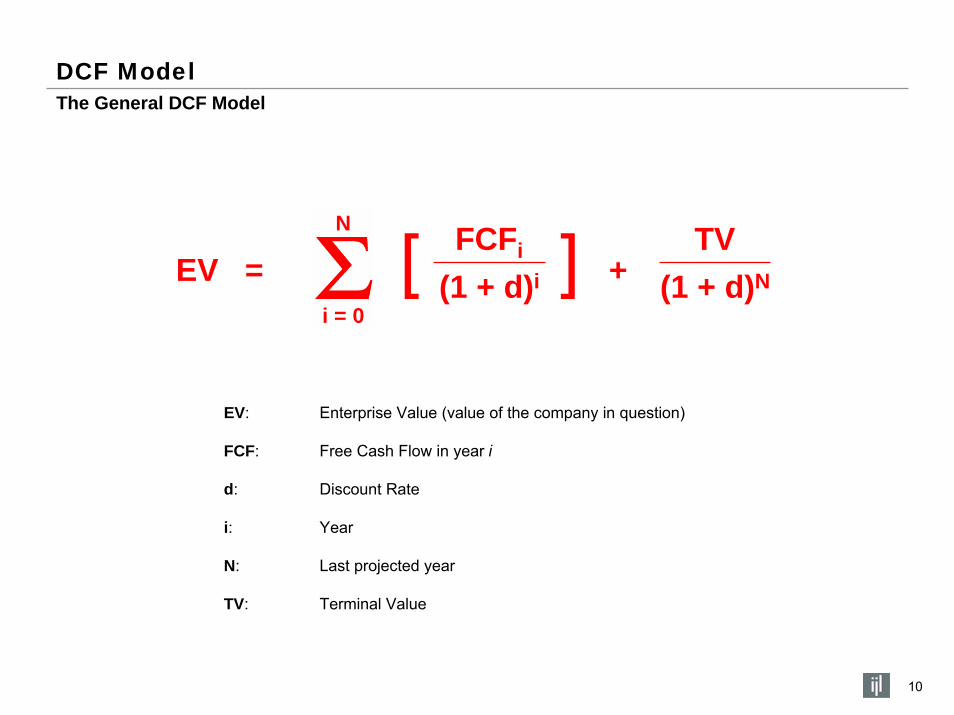
DCF ModelThe General DCF Model
N
i = 0
10
(1 + d)i
FCFi TVEV = + (1 + d)N[ ]
EV: Enterprise Value (value of the company in question)
FCF: Free Cash Flow in year i
d: Discount Rate
i: Year
N: Last projected year
TV: Terminal Value

Steps for Doing a DCF AnalysisDCF Model
1) Estimate the Weighted Average Cost of Capital (Cost of Equity & Cost of Debt)
2) Project the Free Cash Flows (FCFs)
3) Estimate the Terminal Value
4) Derive the Enterprise Valuation and EPS
11

Weighted Average Cost of CapitalEstimate the Cost of Capital (step one of four)
♦ The Weighted Average Cost of Capital (WACC) measures the minimum rate of return required to make an investment decision. This is also the discount rate used in the general DCF model (previous page)
E Dd = WACC = Ke * + Kd * (1 – T) *
E + DE + D
WACC: Weighted Average Cost of Capital = discount rate (d) for DCF
Ke: Cost of Equity (from CAPM on next page)
Kd: Cost of Debt (current cost of borrowing through debt, average yield to maturity)
E: Market Value of Equity
D: Market Value of Debt
T: Marginal Tax Rate
12

Cost of Equity – The Capital Asset Pricing Model (CAPM)Estimate the Cost of Capital (step one of four)
♦ The Capital Asset Pricing Model (CAPM) calculates the company’s cost of equity – the total return expected by equity investors including dividends and capital appreciation.
Ke = rf + B * (rm – rf)
Ke: Cost of Equity (into WACC on previous page)
B: Company Beta, its volatility relative to the rest of the marketIf B = 1, it is as risky as the overall market.If B < 1, it is less risky than the market.If B > 1, it is more risky than the market.
rf: Risk Free Rate
rm: Equity Market Average Return
rm - rf: Excess Market Return
13
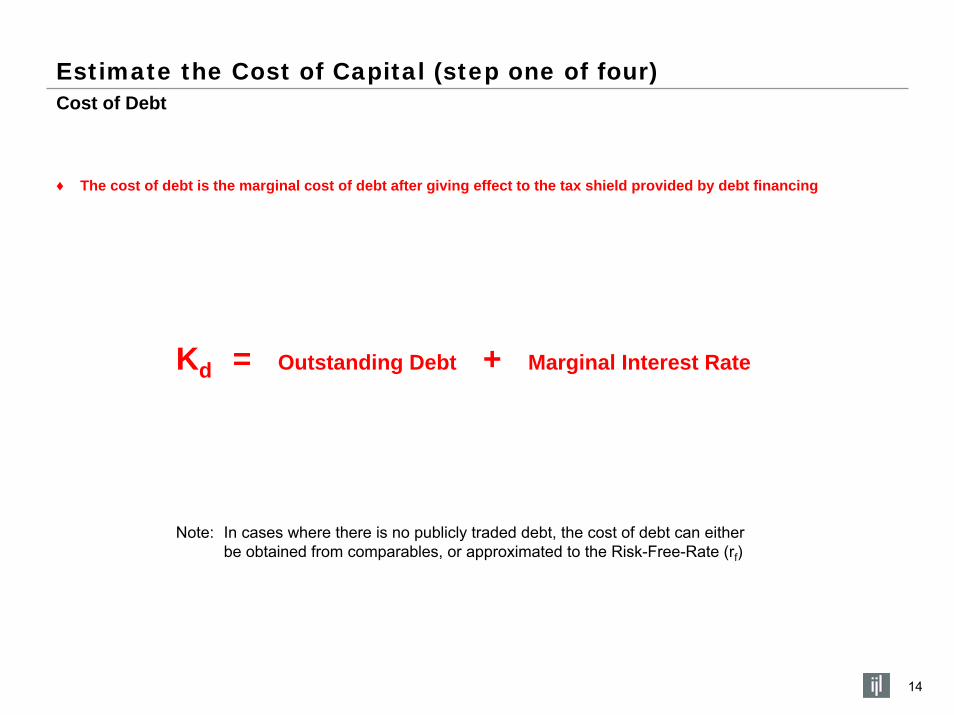
Cost of DebtEstimate the Cost of Capital (step one of four)
♦ The cost of debt is the marginal cost of debt after giving effect to the tax shield provided by debt financing
Kd = Outstanding Debt + Marginal Interest Rate
Note: In cases where there is no publicly traded debt, the cost of debt can either be obtained from comparables, or approximated to the Risk-Free-Rate (rf)
14
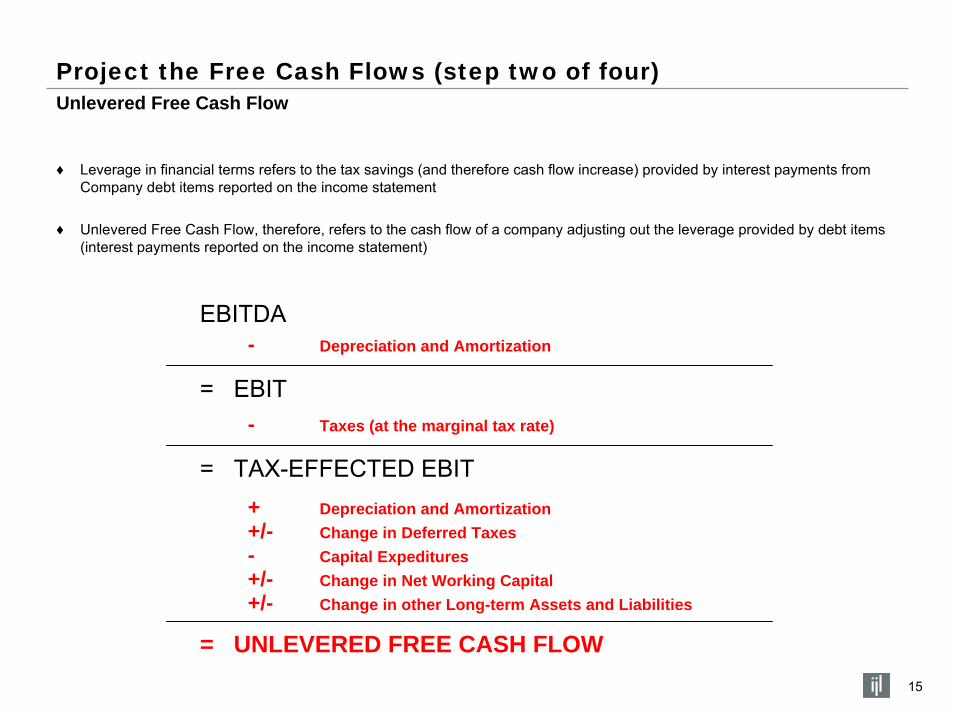
Unlevered Free Cash FlowProject the Free Cash Flows (step two of four)
♦ Leverage in financial terms refers to the tax savings (and therefore cash flow increase) provided by interest payments from Company debt items reported on the income statement
♦ Unlevered Free Cash Flow, therefore, refers to the cash flow of a company adjusting out the leverage provided by debt items (interest payments reported on the income statement)
EBITDA- Depreciation and Amortization
= EBIT- Taxes (at the marginal tax rate)
= TAX-EFFECTED EBIT+ Depreciation and Amortization+/- Change in Deferred Taxes- Capital Expeditures+/- Change in Net Working Capital+/- Change in other Long-term Assets and Liabilities
= UNLEVERED FREE CASH FLOW15

Two Methods of CalculationEstimate the Terminal Value (step three of four)
♦ The Terminal Value is the value of the business beyond the specified forecast period (e.g. the projected value of the company for 30 years into the future)
1) Exit Multiple Method
2) Perpetuity Growth Method
Terminal Value = what the business would be worth or sold for at the end of the last projected year
Example: Terminal Value = 8.0x EBITDA at the end of year N
Terminal Value = Free Cash Flows that grow at a constant rate in perpetuity
(r + g)Terminal Value =
FCFN x (1+g) g = nominal perpetual growth rate
r = discount rate
16
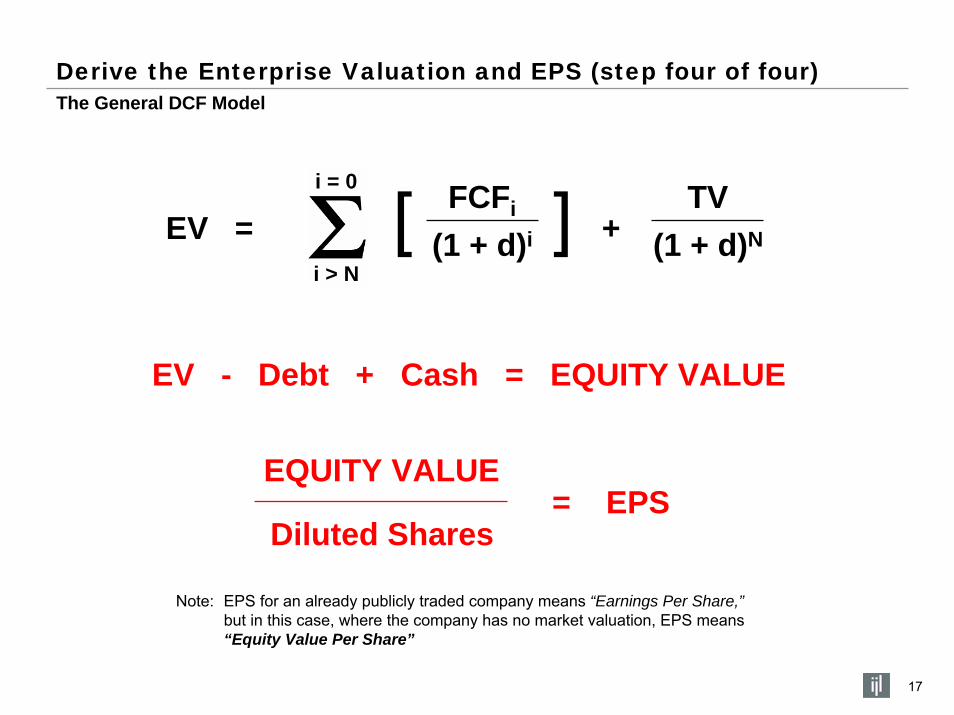
Derive the Enterprise Valuation and EPS (step four of four)The General DCF Model
i = 0
i > N
17
(1 + d)i
FCFi TVEV = + (1 + d)N[ ]
EV - Debt + Cash = EQUITY VALUE
EQUITY VALUE= EPS
Diluted Shares
Note: EPS for an already publicly traded company means “Earnings Per Share,”but in this case, where the company has no market valuation, EPS means “Equity Value Per Share”

III. Sample DCF
18
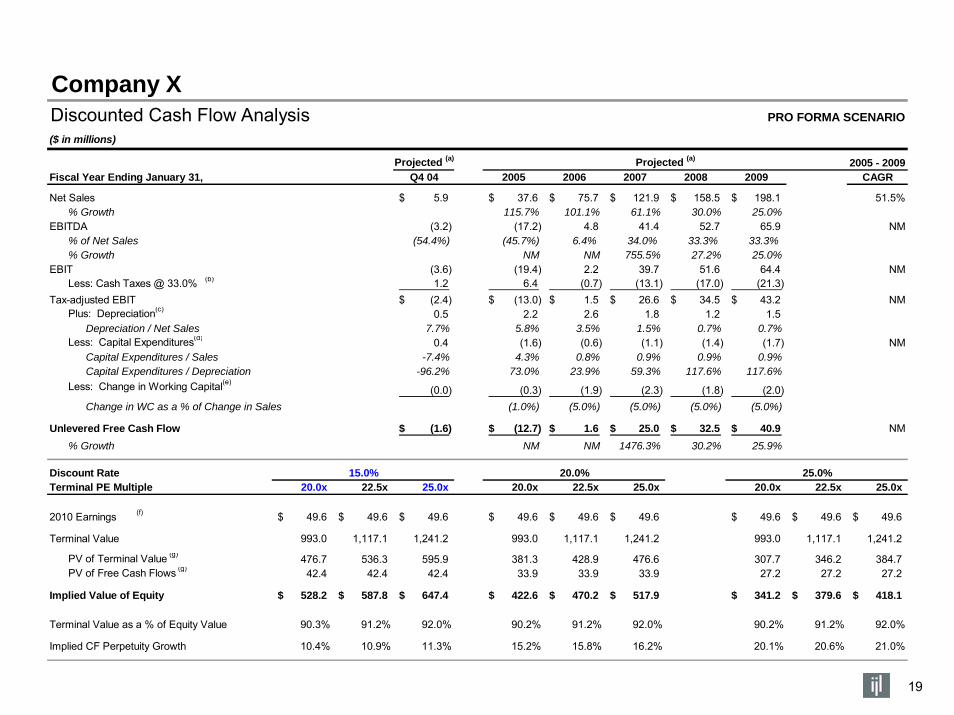
Company XDiscounted Cash Flow Analysis PRO FORMA SCENARIO
($ in millions)
Projected (a) Projected (a) 2005 - 2009Fiscal Year Ending January 31, Q4 04 2005 2006 2007 2008 2009 CAGR
Net Sales 5.9$ 37.6$ 75.7$ 121.9$ 158.5$ 198.1$ 51.5%% Growth 115.7% 101.1% 61.1% 30.0% 25.0%
EBITDA (3.2) (17.2) 4.8 41.4 52.7 65.9 NM% of Net Sales (54.4%) (45.7%) 6.4% 34.0% 33.3% 33.3%% Growth NM NM 755.5% 27.2% 25.0%
EBIT (3.6) (19.4) 2.2 39.7 51.6 64.4 NMLess: Cash Taxes @ 33.0% (b) 1.2 6.4 (0.7) (13.1) (17.0) (21.3)
Tax-adjusted EBIT (2.4)$ (13.0)$ 1.5$ 26.6$ 34.5$ 43.2$ NMPlus: Depreciation(c) 0.5 2.2 2.6 1.8 1.2 1.5 Depreciation / Net Sales 7.7% 5.8% 3.5% 1.5% 0.7% 0.7%Less: Capital Expenditures(d) 0.4 (1.6) (0.6) (1.1) (1.4) (1.7) NM Capital Expenditures / Sales -7.4% 4.3% 0.8% 0.9% 0.9% 0.9% Capital Expenditures / Depreciation -96.2% 73.0% 23.9% 59.3% 117.6% 117.6%Less: Change in Working Capital(e)
(0.0) (0.3) (1.9) (2.3) (1.8) (2.0) Change in WC as a % of Change in Sales (1.0%) (5.0%) (5.0%) (5.0%) (5.0%)
Unlevered Free Cash Flow (1.6)$ (12.7)$ 1.6$ 25.0$ 32.5$ 40.9$ NM% Growth NM NM 1476.3% 30.2% 25.9%
Discount Rate 15.0% 20.0% 25.0%Terminal PE Multiple 20.0x 22.5x 25.0x 20.0x 22.5x 25.0x 20.0x 22.5x 25.0x
2010 Earnings (f) 49.6$ 49.6$ 49.6$ 49.6$ 49.6$ 49.6$ 49.6$ 49.6$ 49.6$
Terminal Value 993.0 1,117.1 1,241.2 993.0 1,117.1 1,241.2 993.0 1,117.1 1,241.2
PV of Terminal Value (g) 476.7 536.3 595.9 381.3 428.9 476.6 307.7 346.2 384.7 PV of Free Cash Flows (g) 42.4 42.4 42.4 33.9 33.9 33.9 27.2 27.2 27.2
Implied Value of Equity 528.2$ 587.8$ 647.4$ 422.6$ 470.2$ 517.9$ 341.2$ 379.6$ 418.1$
Terminal Value as a % of Equity Value 90.3% 91.2% 92.0% 90.2% 91.2% 92.0% 90.2% 91.2% 92.0%
Implied CF Perpetuity Growth 10.4% 10.9% 11.3% 15.2% 15.8% 16.2% 20.1% 20.6% 21.0%
19
IV. Additional Resources
20
DCF and Related MaterialAdditional Resources
♦ More Documentation on the DCF
• The Vault Career Guide to Finance Interviews (visit http://www.vault.com)
♦ Finance Related Documentation
• Research Initiatives Section of Ian Lee’s portfolio site (visit http://users.design.ucla.edu/~ianlee)
21