valuation 3 3 valuation frameworks discounted cash flow (dcf) comparables option value
TRANSCRIPT
EMBA Finance II
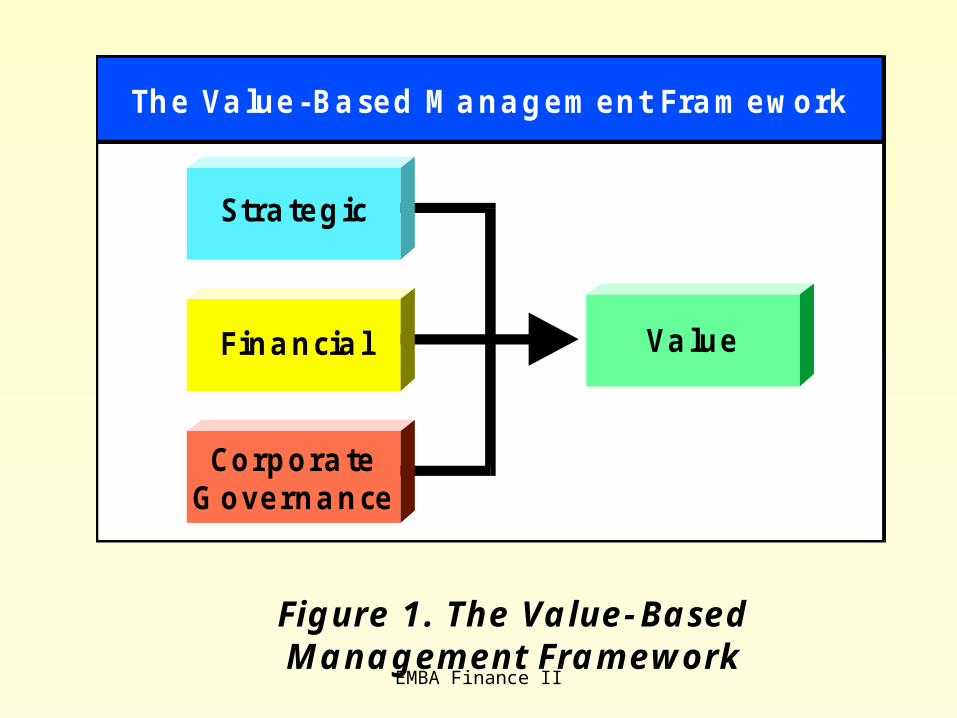
The Va lue- Ba sed M a na gem ent Fra m ework
Va lue
Figure 1. The Va lue- Ba sedM a na gem ent Fra m ew ork
Stra teg ic
Fina ncia l
Corpora teG overna nce

Valuation

EMBA Finance II 3
3 Valuation Frameworks
Discounted Cash Flow (DCF)
Comparables
Option Value

EMBA Finance II 4
3 Valuation Frameworks
Discounted Cash Flow (DCF)
Comparables
Option Value

DCF Valuation
Spreadsheet Approach

EMBA Finance II
Economic Valuation
PV =
C
1+ k ... +
C
1+k1 n
12
21
C
kn .
0 1 2 nk
C1 Cn C2Value
...
+ ++

Capital Projects AsCash Flow Tradeoffs
Initial
Outlay
Net
Benefits
Additional
Outlay
Capital
Recovery
TIME
Match initial investment with the combined PV of all future cash flows

EMBA Finance II
Capital Project Valuation
Annual cash flow
Investment $100
NPV = $13
$20 $20 $20 $20 $20 $20 $20
1
2 3 4 5 6 10k

Discounting Example
Cash Discount P.V.Cumul.
Yr Flow Factor* Cash Flow P.V. 1 $ 20 .9091 $ 18.18 $ 18.182 20 .8264 16.53 34.713 20 .7513 15.03 49.74
10 20 .3855 7.71 113.00
* Discount Factor = 1/(1+.10)n

Corporate Value
infinity
Value = Cash Flowt
t=0 (1 + Cost of Capital)t

Free cash flow is the basis of value!
Investors watch this pattern……
….which is “cash in and cash out”
Free cash flow = NOPAT adjusted for depreciation and other accounting elementsLess net investment in working capital, fixed assets, capitalized R&D, etc.
Trend
Time

PLEASE DO NOT DISTURB
Working on A big project !!!

STRATEGY, PERFORMANCE MEASUREMENT, COMPENSATION
Corporate Business Unit PV of Business Strategy
beyond2001 2002 2003 2004 2005 2005
Planned cash flows $570 $630 $700 $800 $850 $850Discount factor (12%) 0.893 0.797 0.712 0.636 0.567 4.729
2000 Present Value $509 $502 $498 $508 $482 $4,019
TOTAL PV $6,519
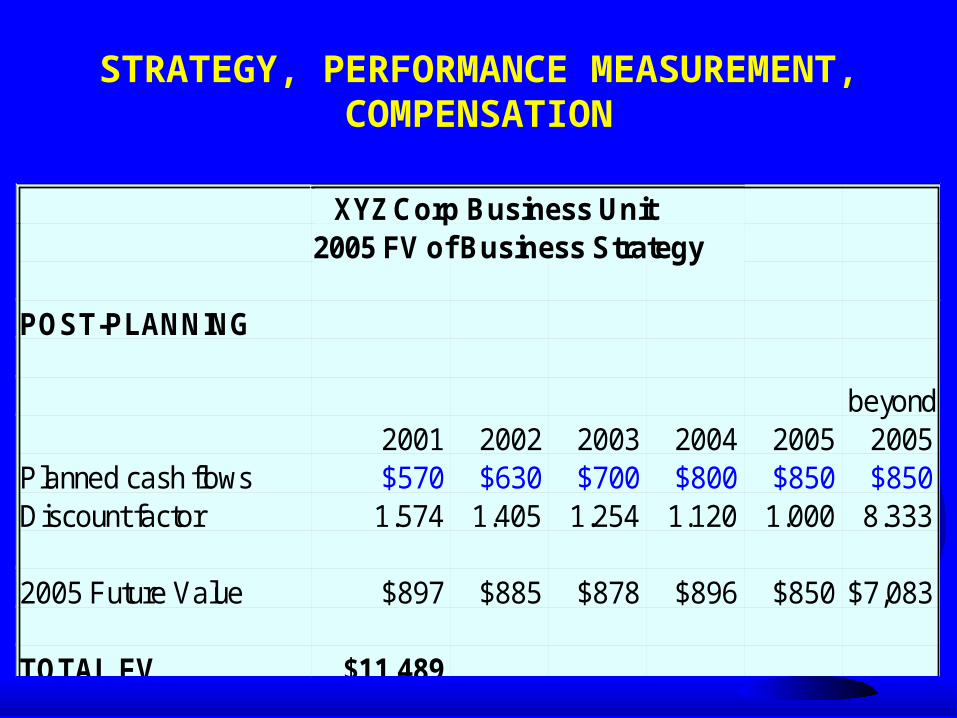
STRATEGY, PERFORMANCE MEASUREMENT, COMPENSATION
XYZ Corp Business Unit2005 FV of Business Strategy
POST-PLANNING
beyond2001 2002 2003 2004 2005 2005
Planned cash flows $570 $630 $700 $800 $850 $850Discount factor 1.574 1.405 1.254 1.120 1.000 8.333
2005 Future Value $897 $885 $878 $896 $850 $7,083
TOTAL FV $11,489

STRATEGY, PERFORMANCE MEASUREMENT, COMPENSATION
PRE-PLANNING
2000 pre-planning $600cash flow
beyond2001 2002 2003 2004 2005 2005
Planned cash flows $600 $600 $600 $600 $600 $600Discount factor 1.574 1.405 1.254 1.120 1.000 8.333
2005 Future Value $944 $843 $753 $672 $600 $5,000
TOTAL PRE-PLAN $8,812FUTURE VALUE
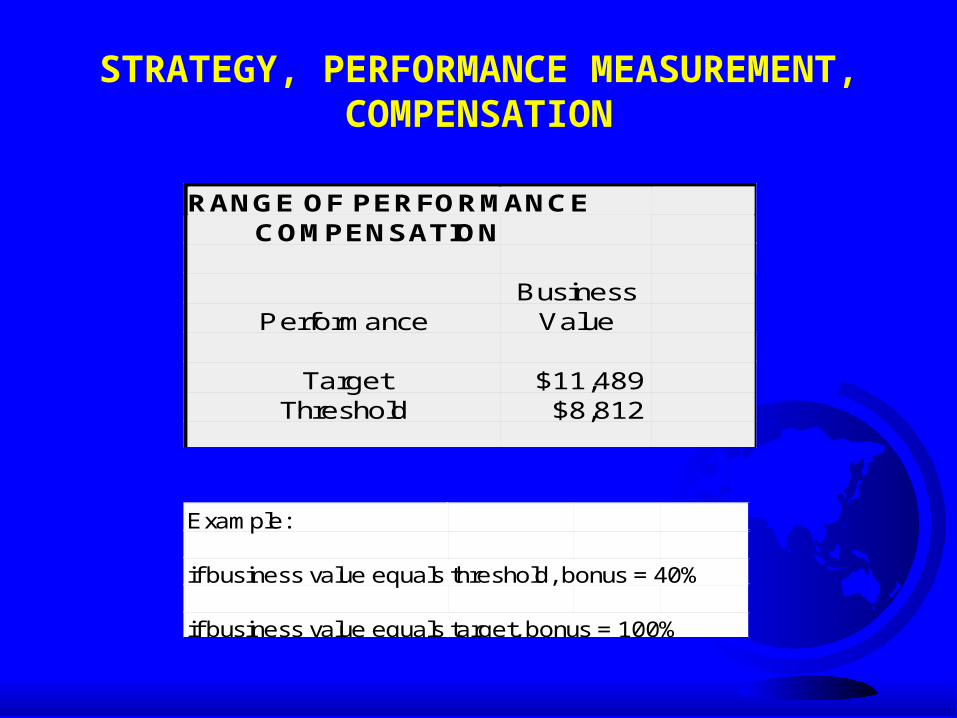
STRATEGY, PERFORMANCE MEASUREMENT, COMPENSATION
RANGE OF PERFORMANCE COMPENSATION
BusinessPerformance Value
Target $11,489Threshold $8,812
Example:
if business value equals threshold, bonus = 40%
if business value equals target, bonus = 100%

Portal.com Example
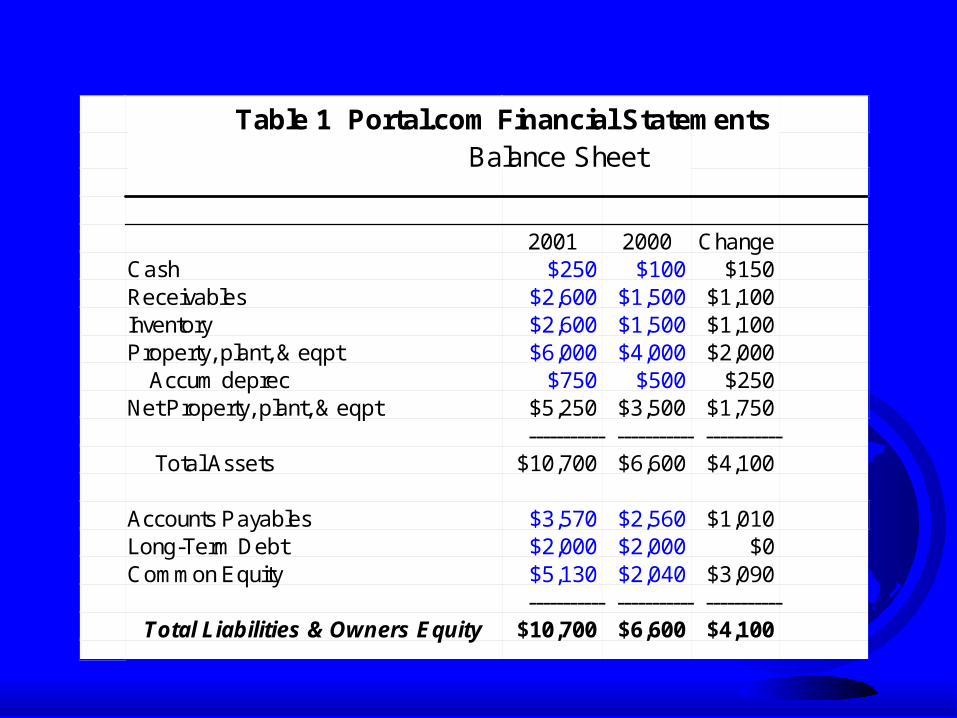
Table 1 Portal.com Financial Statements Balance Sheet
2001 2000 ChangeCash $250 $100 $150Receivables $2,600 $1,500 $1,100Inventory $2,600 $1,500 $1,100Property, plant, & eqpt $6,000 $4,000 $2,000 Accum deprec $750 $500 $250Net Property, plant, & eqpt $5,250 $3,500 $1,750
----------- ----------- ----------- Total Assets $10,700 $6,600 $4,100
Accounts Payables $3,570 $2,560 $1,010Long-Term Debt $2,000 $2,000 $0Common Equity $5,130 $2,040 $3,090
----------- ----------- ----------- Total Liabilities & Owners Equity $10,700 $6,600 $4,100
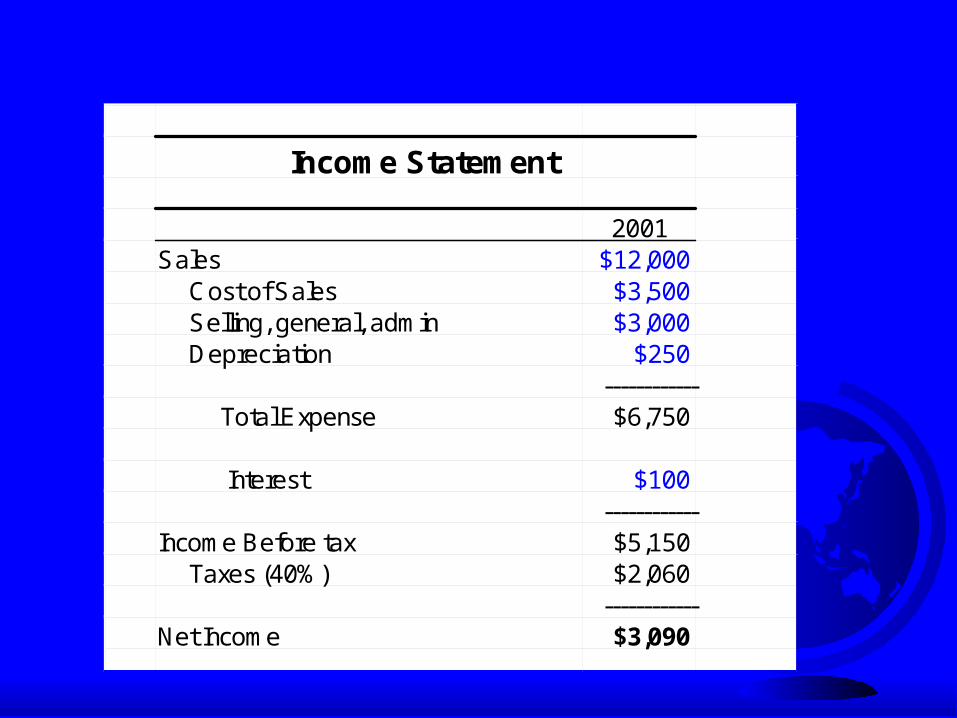
Income Statement
2001Sales $12,000 Cost of Sales $3,500 Selling, general, admin $3,000 Depreciation $250
------------ Total Expense $6,750
Interest $100------------
Income Before tax $5,150 Taxes (40%) $2,060
------------Net Income $3,090

Free Cash Flows
2001Cash Flows - Operations
Revenue $12,000
Cash Expenses $6,500Taxes* $2,100
------------ Total $3,400
Cash Flows - Investments
Working Capital $1,340Fixed Assets $2,000
------------ Total $3,340
------------Net Cash Flows $60
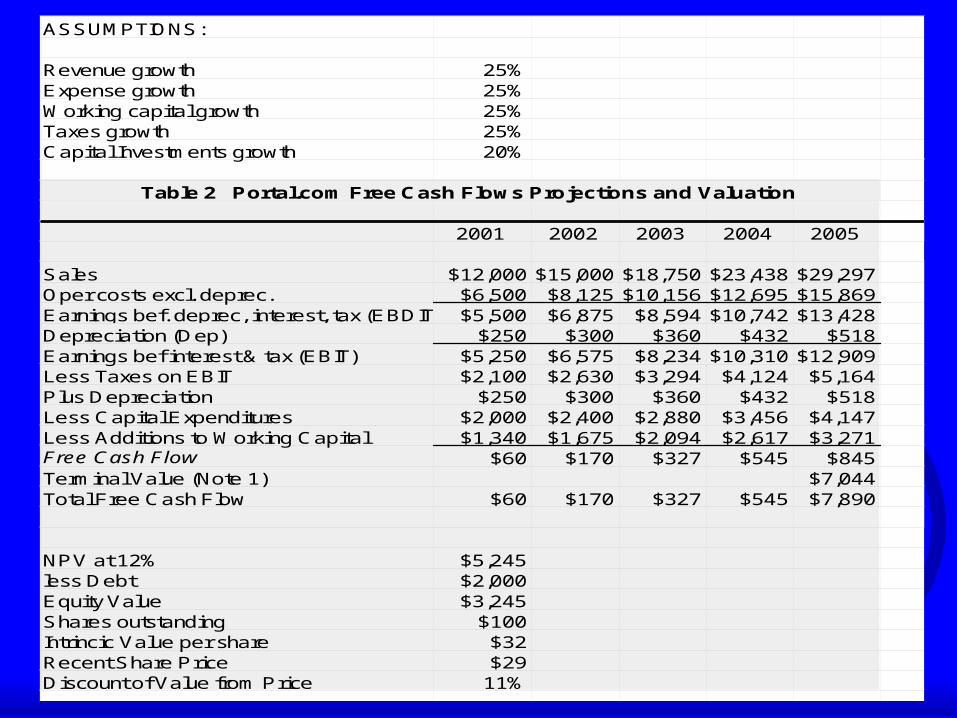
ASSUMPTIONS:
Revenue growth 25%Expense growth 25%Working capital growth 25%Taxes growth 25%Capital Investments growth 20%
Table 2 Portal.com Free Cash Flows Projections and Valuation
2001 2002 2003 2004 2005
Sales $12,000 $15,000 $18,750 $23,438 $29,297Oper costs excl. deprec. $6,500 $8,125 $10,156 $12,695 $15,869Earnings bef. deprec, interest, tax (EBDIT) $5,500 $6,875 $8,594 $10,742 $13,428Depreciation (Dep) $250 $300 $360 $432 $518Earnings bef interest & tax (EBIT) $5,250 $6,575 $8,234 $10,310 $12,909Less Taxes on EBIT $2,100 $2,630 $3,294 $4,124 $5,164Plus Depreciation $250 $300 $360 $432 $518Less Capital Expenditures $2,000 $2,400 $2,880 $3,456 $4,147Less Additions to Working Capital $1,340 $1,675 $2,094 $2,617 $3,271Free Cash Flow $60 $170 $327 $545 $845Terminal Value (Note 1) $7,044Total Free Cash Flow $60 $170 $327 $545 $7,890
NPV at 12% $5,245less Debt $2,000Equity Value $3,245Shares outstanding $100Intrincic Value per share $32Recent Share Price $29Discount of Value from Price 11%

Portal.com2001 Valuation Cash Flows
Customers$12,000 Revenue
Customers$12,000 Revenue
Cash ExpenseCOGS 3,500SG&A 3,000 ------- $6,500
Cash ExpenseCOGS 3,500SG&A 3,000 ------- $6,500
Investment$2,000
Investment$2,000
Working CapitalCash 150Receivables 1,100Inventory 1,100Payables -1,010 -------- $1,340
Working CapitalCash 150Receivables 1,100Inventory 1,100Payables -1,010 -------- $1,340
Taxes$2,100Taxes$2,100
Available toShareholders andDebt Suppliers
$60
Available toShareholders andDebt Suppliers
$60

EMBA Finance II
Company Valuation
Annual cash flow
1 2 3 4 5
7,044
Terminal Value
k
0
60170
327 545
845

Free Cash Flow Valuation
$5,245
$0 $5,245 $2,000
$3,245
Value of
Operating
Cash Flows
Marketable
Securities &
Non-operating
Cash Flows
Market Value
of Entity
Market Value of
Debt and other
Liabilities
Market Value
of
Equity

Adjusted Present Value (APV)
Value of the project as ifit were financed with equity
Interest tax shields
Costs of financial distress
Subsidies
Hedges
Issue costs
+APV =
Base-case value
Value of financing side effects
APV =
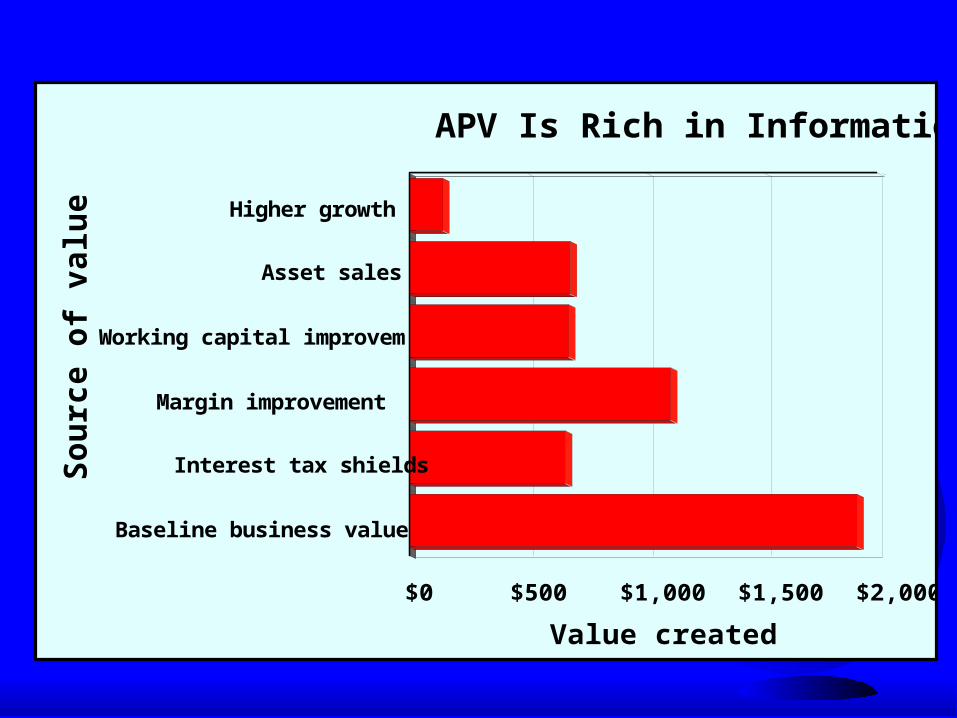
Higher growth
Asset sales
Working capital improvem
Margin improvement
Interest tax shields
Baseline business value
So
urc
e o
f valu
e
$0 $500 $1,000 $1,500 $2,000
Value created
APV Is Rich in Information

DCF Valuation
Formula Approaches

Company ValuationFree Cash Flow Formulas
NOPAT0 = initial after-tax earnings before interest and taxes (EBIT)
b = rate of investment per period divided by NOPAT g = growth in free cash flows. The subscripts s and c refer to the supernormal growth rate and the constant growth rate. n = number of periods of supernormal growth k = the company’s weighted average cost of capital WACC
No growth:
NOPAT0
V = ------------------ k
Constant growth:
NOPAT0(1 - b)(1 + g)
V = -------------------------------- k - g

Company Valuation
Free Cash Flow Formulas
NOPAT0 = initial after-tax earnings before interest and taxes (EBIT)
b = rate of investment per period divided by NOPAT
g = growth in free cash flows. The subscripts s and c refer to the
supernormal growth rate and the constant growth rate.
n = number of periods of supernormal growth
k = the company’s weighted average cost of capital WACC
Temporary supernormal growth, then no growth:
n (1 + g)t NOPAT0(1 + g)n+1
V = NOPAT0 (1 - b) ----------------- + ---------------------------
t=1 (1 + k)t k (1 + k)n
Temporary supernormal growth, then constant growth:
n (1 + gs)t NOPAT0 (1 - bs) (1 + gs)
n+1
V = NOPAT0 (1 - b) ----------------- + --------------------- x -------------
t=1 (1 + k)t k - g (1 + k)n

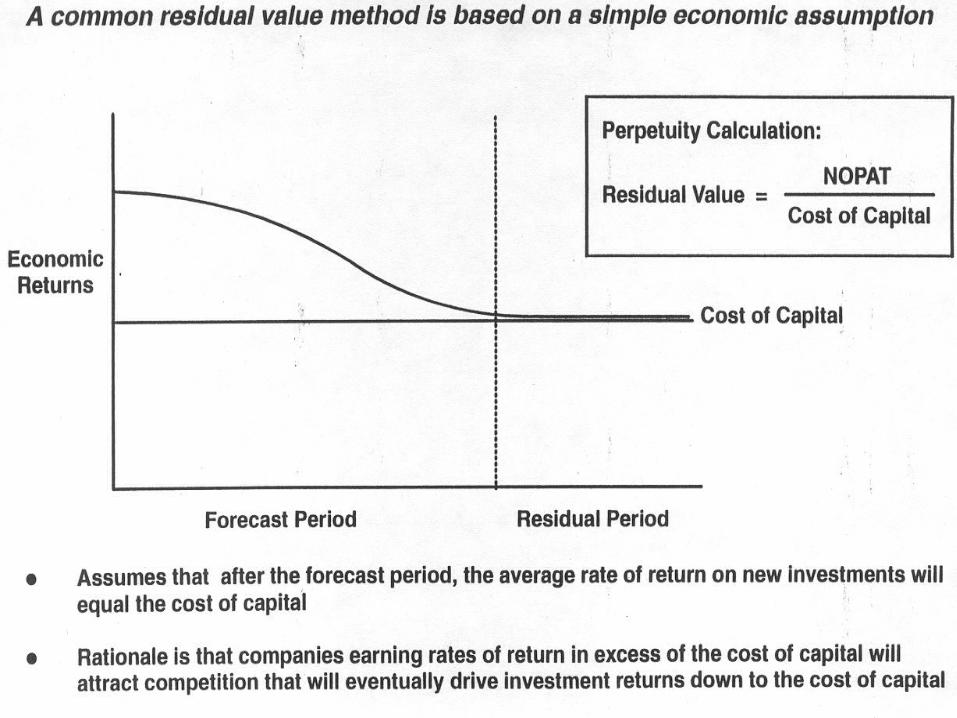
DCF Approaches to Estimate Continuing Value
g = 0 In a perfectly competitive market, in the long-term companies earn their cost of capital, resulting in zero economic profit and hence zero cash flow growth rate
g = industry average
Zero growth rates may be too conservative in the cases of some industries. In that case, it is reasonable to assume that companies’ cash flow will grow at the average industry rate
g = Forecasted long-term inflation growth rate
Usually, both revenues and costs are equally affected by inflation and hence inflation has no or little effect on a firm’s growth rate. In some cases, especially in certain consumer industries, inflation affects the revenues more than the costs. In this case, the forecasted perpetual inflation growth rate is a good proxy for the firm’s revenue growth rate and consequently its cash flow growth rate.
g = Forecasted long-term GDP growth rate
It is reasonable that in the long-term the growth rate of companies will fade to that of the growth rate of the overall economy. If a company grows at a sustained rate higher than that of the economy, eventually it will become larger than the economy itself, which of course is not possible.

Valuation Framework
NOPAT R - K V = ------------- + ------------ * I * T K K
WHERE: NOPAT = NET OPERATING PROFITS AFTER TAX K = COST OF CAPITAL R = RETURN ON CAPITAL I = ANNUAL INCREMENTAL INVESTMENT T = NO. OF YEARS THAT I CAN BE INVESTED AT R > K
V = AS IS VALUE + VALUE GROWTH OPPORTUNITIES
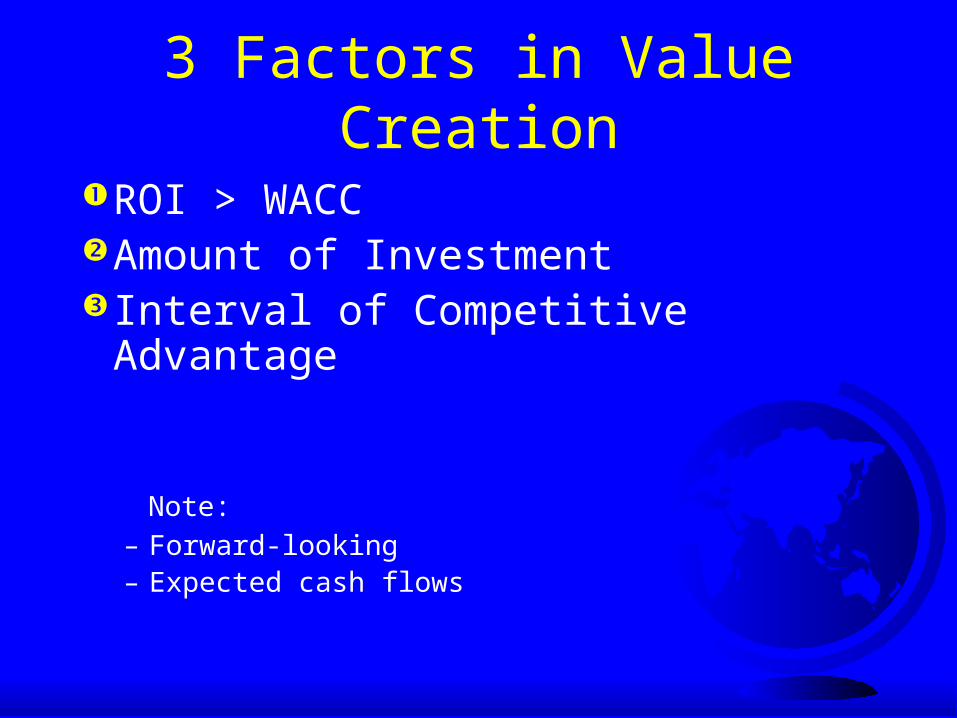
3 Factors in Value Creation
ROI > WACCAmount of InvestmentInterval of Competitive Advantage
Note:– Forward-looking– Expected cash flows
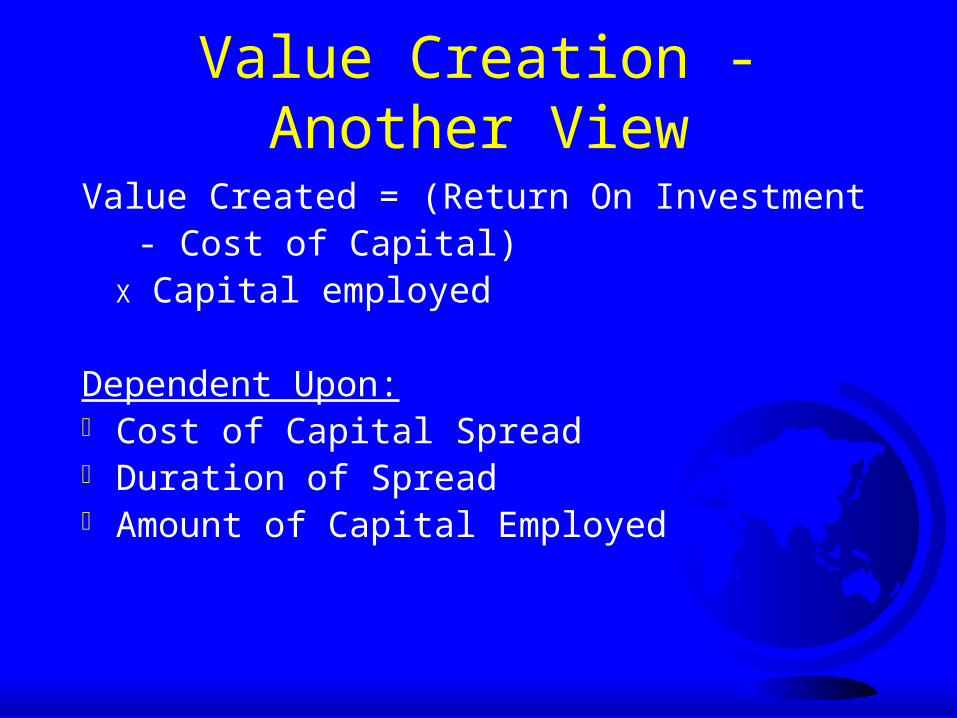
Value Creation - Another View
Value Created = (Return On Investment - Cost of Capital) X Capital employed
Dependent Upon: Cost of Capital Spread Duration of Spread Amount of Capital Employed

Economic Profit (EP)(R - K) x capitalNOPAT - K x capitalOperating profits - a capital charge
EP ties directly to NPV:NPV = market value - capitalNPV = the present value of projected EP Market value = Capital + PV of projected EP
K = WACC R = NOPAT / Capital

Economic Profit
Discounted Cash Flow Approach:
Yr. 0 Yr. 1 Yr. 2
NOPAT $250 $250...
P.V. Perpetuity $2,500
Investment ($1,000)
NPV @ 10% $1,500
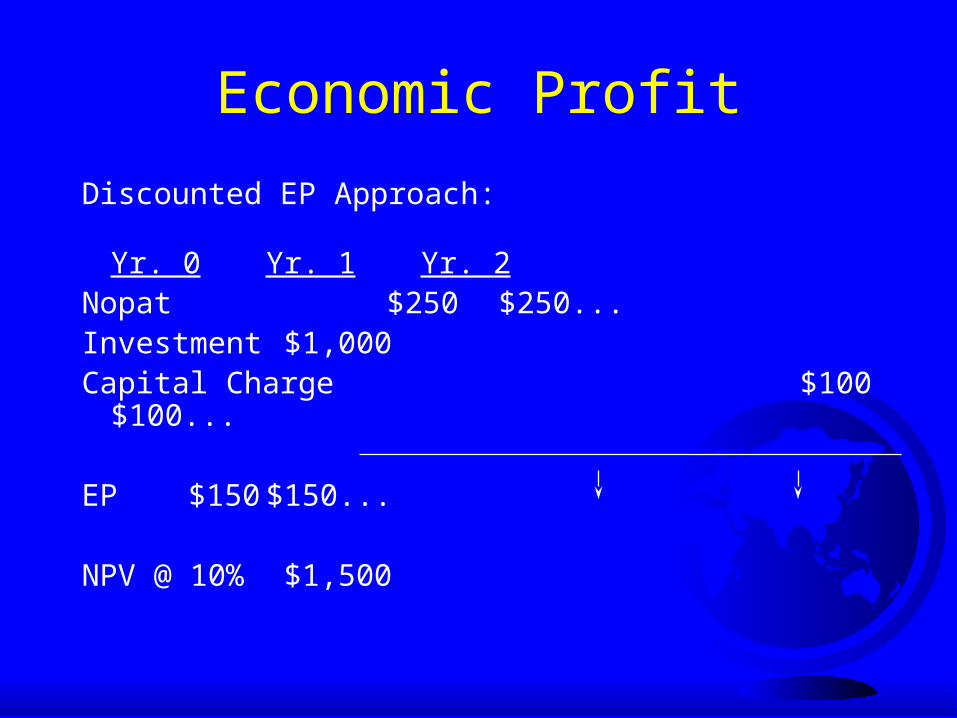
Economic Profit
Discounted EP Approach:
Yr. 0 Yr. 1 Yr. 2Nopat $250 $250...Investment $1,000Capital Charge $100 $100...
EP $150 $150...
NPV @ 10% $1,500

NPV and the Regulatory Process
Remember:
NPV = Cash Inflow - Cash Outflow
where Cash Inflow = Revenues - Costs
But in a regulated environment,
Revenues = Costs + Return x Investment
Therefore, the NPV is always zero

NPV and the Regulatory Process
but R = C + KI
= 0
t=1
n
NPV = - I(R - C)t
(1 + K)t
t=1
n(C + KI - C)t
(1 + K)t- I=
t=1
n(KI)t
(1 + K)t- I= =
(KI)
K- I

EMBA Finance II 40
3 Valuation Frameworks
Discounted Cash Flow (DCF)
Comparables
Option Value

Comparables: An Example
MULTIPLIER COMPANY COMPANY
DATA VALUE
1.5 x book value $23.2 $34.8
9 x cash flow $3.6 $32.4
7 x EBIT $4.3 $30.1
25 x 2000 earnings $1.5 $37.5
20 x 2001 earnings $1.7 $33.0
------------------
Average Estimate $33.6