validation of the electronic kids dietary index (e-kindex
TRANSCRIPT

University of South FloridaScholar Commons
Graduate Theses and Dissertations Graduate School
11-2-2017
Validation of the Electronic Kids Dietary Index (E-KINDEX) Screening Tool for Early Identificationof Risk for Overweight/Obesity (OW/OB) in aPediatric Population: Associations with Quality ofLife PerceptionsPatricia A. HallUniversity of South Florida, [email protected]
Follow this and additional works at: https://scholarcommons.usf.edu/etd
Part of the Nursing Commons, and the Nutrition Commons
This Dissertation is brought to you for free and open access by the Graduate School at Scholar Commons. It has been accepted for inclusion inGraduate Theses and Dissertations by an authorized administrator of Scholar Commons. For more information, please [email protected].
Scholar Commons CitationHall, Patricia A., "Validation of the Electronic Kids Dietary Index (E-KINDEX) Screening Tool for Early Identification of Risk forOverweight/Obesity (OW/OB) in a Pediatric Population: Associations with Quality of Life Perceptions" (2017). Graduate Theses andDissertations.https://scholarcommons.usf.edu/etd/7407

Validation of the Electronic Kids Dietary Index (E-KINDEX) Screening Tool for
Early Identification of Risk for Overweight/Obesity (OW/OB) in a Pediatric Population:
Associations with Quality of Life Perceptions
by
Patricia A. Hall
A dissertation submitted in partial fulfillment
of the requirements for the degree of
Doctor of Philosophy
College of Nursing
University of South Florida
Major Professor: Susan C. McMillan, Ph.D., ARNP
Susan E. Kennel, Ph.D., PNP
Ming Ji, Ph.D.
Frances M. Sahebzamani, Ph.D., ARNP
Date of Approval
October 25, 2017
Keywords: adolescent, obesogenic environment, pediatric obesity
Copyright 2017, Patricia A. Hall

DEDICATION
A doctoral dissertation is the product of an individual who has received support from any
number of individuals. I am grateful to my family, in particular my Aunt Jan who schooled me in
the importance of higher education from the tender age of three. Others of my family, Sandra and
Michael, accepted my absences from family activities without fully understanding why, while
my 6-year-old granddaughter, Nadia, was content to “work” with me in my library on her
spaceship. I will always be grateful to Dr. Susan McMillan, often much more to me than
committee chair, for the positive feedback she provided on some of the darkest days: I always
left her presence feeling upbeat with priorities in perspective. Other advocates who encouraged
me to keep moving forward were Karen Roth, Morton Plant Librarian Extraordinaire, Sandi
Vonnes, and Roberta Capewell. Fellow dissertation travelers who advised me on statistics, Lisa
Huhn, Glenna Brewster, Shannon Morse, Allison Poff, and Pinky Budhrani—all had open-door
policies for statistically challenged folks such as myself. I thank you, dear Jesus, for blessing me
early with Mimi and Jan who planted and nurtured seeds of education that gave me the potential
to complete this project, which I am sure I had to do in preparation for some other work that
must be done. JMJ.

ACKNOWLEDGMENTS
I would like to extend my heartfelt thanks to my doctoral committee: Dr. Sahebzamani-Rankin,
Dr. Ming Ji, and the chairperson of my committee, Dr. Susan McMillan. Dr. Denise Edwards at
the USF Pediatric Clinic and her staff, particularly clinic manager, Jill Barerra, were all very
supportive in facilitating data collection for this project. I am extremely grateful to Sigma Theta
Tau International Honor Society for Nursing, Delta Beta Chapter, for the financial award that so
generously contributed to this effort. Roberta Capewell served as personal trainer for the PhD
presentation in the final critical weeks: thank you so much Dr. Capewell!

i
TABLE OF CONTENTS
List of Tables ...................................................................................................................................v
List of Figures ................................................................................................................................ vi
Abstract ......................................................................................................................................... vii
Chapter One: Introduction ...............................................................................................................1
Background of the Problem .............................................................................................................2
Ineffective Treatment ...........................................................................................................3
Prevention ...........................................................................................................................4
Purpose .................................................................................................................................5
Study Aims...........................................................................................................................6
Hypothesis 1.............................................................................................................6
Hypothesis 2.............................................................................................................6
Hypothesis 3.............................................................................................................6
Hypothesis 4.............................................................................................................6
Definition of Terms..............................................................................................................6
Obesogenic Environment .........................................................................................6
Dietary Quality.........................................................................................................7
Dietary Behaviors ....................................................................................................7
Dietary Meal Patterns ..............................................................................................8
Overweight and/or Obesity (OW/OB) .....................................................................8
Quality of Life..........................................................................................................9
Physical Activity Levels ....................................................................................................10
Inactive ...................................................................................................................11
Minimally Active ...................................................................................................11
HEPA Active .........................................................................................................11
Significance to Nursing......................................................................................................12
Chapter Two: Review of Literature ...............................................................................................14
Conceptual Framework ......................................................................................................16
Obesogenic Environment ...................................................................................................17
Dietary Quality.......................................................................................................18
Dietary Attitudes and Beliefs .................................................................................18
Dietary Meal Patterns ............................................................................................19
Moderator Variables ..........................................................................................................19
Parental OW/OB ....................................................................................................19
Physical Activity Level ..........................................................................................20
Covariates ..........................................................................................................................21

ii
Outcome Variables.............................................................................................................21
OW/OB ..................................................................................................................21
Quality of Life........................................................................................................22
Chapter Three: Methods ................................................................................................................24
Setting and Sample ........................................................................................................................24
Measures ........................................................................................................................................26
Demographic Data Form....................................................................................................26
E-KINDEX ........................................................................................................................27
Validity ..................................................................................................................28
Reliability ...............................................................................................................29
Dietary Quality E-KINDEX ..................................................................................30
Dietary Behavior E-KINDEX ................................................................................32
Dietary Habits E-KINDEX ....................................................................................33
Physical Activity Levels ....................................................................................................35
Validity and reliability ...........................................................................................35
Screen Time .......................................................................................................................36
Impact of Weight on Quality of Life in Kids (IWQOL-KIDS) .........................................36
Validity and reliability ...........................................................................................37
Body Mass Index ...............................................................................................................37
Procedures ......................................................................................................................................39
Approvals ...........................................................................................................................39
Data Collection ..................................................................................................................39
Data Analysis .................................................................................................................................39
Aim One .............................................................................................................................40
Hypothesis 1...........................................................................................................40
Hypothesis 2...........................................................................................................40
Aim Two ............................................................................................................................40
Hypothesis 3...........................................................................................................41
Aim Three ..........................................................................................................................41
Hypothesis 4...........................................................................................................41
Descriptive Statistics ..........................................................................................................41
Pearson Product Moment Correlation Coefficient (r) .......................................................41
Cronbach’s Alpha ..............................................................................................................42
Analysis of Variance ..........................................................................................................42
Multiple Linear Regression................................................................................................42
Receiver Operating Characteristics (ROC) ........................................................................42
Missing Data ......................................................................................................................43
Outliers ...............................................................................................................................43
Chapter Four: Results ....................................................................................................................44
Data Screening ...................................................................................................................44
Missing Data ......................................................................................................................44
Characteristics of the Sample.............................................................................................45
Aims ...............................................................................................................................................47
Relationship of OW/OB to E-KINDEX Scores .................................................................48
iii
Validity ..............................................................................................................................49
Reliability ...........................................................................................................................49
Factor Analysis ..................................................................................................................50
Moderators and Covariates ................................................................................................55
Age .....................................................................................................................................56
Parental Weight Status .......................................................................................................57
Receiver Operating Characteristics Curve Analysis ..........................................................59
Quality of Life....................................................................................................................60
E-KINDEX Short Form .....................................................................................................61
E-KINDEX SF10 Correlations ..........................................................................................62
Chapter Five: Discussion ...............................................................................................................63
Characteristics of the Sample.............................................................................................64
Aims ...............................................................................................................................................64
Validity ..............................................................................................................................64
Proposed 10-item E-KINDEX ...............................................................................65
Reliability ...........................................................................................................................66
Moderating Variables.........................................................................................................66
Covariates ..............................................................................................................67
Quality of Life....................................................................................................................68
E-KINDEX Short Form .....................................................................................................69
Strengths ............................................................................................................................69
Limitations .........................................................................................................................70
Implications for Future Research .......................................................................................71
Complexity of Diet ............................................................................................................72
Implications for Clinical Practice ......................................................................................73
References ......................................................................................................................................75
Appendix A: CDC Growth Charts: BMI Percentiles for Age and Gender ....................................81
Appendix B: Physical Activity Level Questionnaire .....................................................................83
Appendix C: Recruitment Brochure ..............................................................................................84
Appendix D: Parental Informed Consent with HIPPA language...................................................85
Appendix E: Child Assent to Participate in Research ...................................................................91
Appendix F: Impact of Weight on QOL in Kids Questionnaire ....................................................94
Appendix G: Demographic Questionnaire: E-KINDEX ...............................................................96
Appendix H: E-KINDEX Food Groups .........................................................................................97
Appendix I: E-KINDEX Dietary Behaviors ..................................................................................98

iv
Appendix J: E-KINDEX Dietary Habits........................................................................................99
Appendix K: International Physical Activity Questionnaire Scoring Protocol ...........................100
Appendix L: Screen Time Questionnaire ....................................................................................101
Appendix M: Letter of Support USF Pediatric Clinic .................................................................102
Appendix N: Institutional Review Board Approval ....................................................................103
About the Author ............................................................................................................... End Page

v
LIST OF TABLES
Table 1: CDC Growth Chart Interpretation United States ...........................................................8
Table 2: Group Means, Standard Deviations, and Standard Error of Means
(OW/OB, Lean)......................................................................................................25
Table 3: Dietary Quality E-KINDEX (Subscale 1)....................................................................31
Table 4: Dietary Behavior E-KINDEX (Subscale 2) .................................................................33
Table 5: Dietary Habits E-KINDEX (Subscale 3) .....................................................................34
Table 6: E-KINDEX in Relation to Sample (n = 50 dyads) ......................................................46
Table 7: Correlations: OW/OB with E-KINDEX and Subscales...............................................48
Table 8: Cronbach’s for Standardized Items for Overall E-KINDEX and Subscales ............50
Table 9: Factor Analysis E-KINDEX Overall ...........................................................................51
Table 10: Rotated Factor Matrix Loadings ..................................................................................54
Table 11: Moderator and Covariate Correlations with EKINDEX and
OW/OB (BMIAG2) .....................................................................................................55
Table 12: Age Distribution of the Sample ...................................................................................56
Table 13: Sequential Regression Model Summary ......................................................................57
Table 14: E-KINDEX Area Under the Curve ..............................................................................59
Table 15: Analysis of Variance BMI AG 2 (OW/OB) ................................................................61
Table 16: Pearson Correlations E-KINDEX SF 10......................................................................62

vi
LIST OF FIGURES
Figure 1: Trended BMI Stable .......................................................................................................9
Figure 2: Trended BMI Rapid .......................................................................................................9
Figure 3: Conceptual Framework ................................................................................................17
Figure 4: Distribution of E-KINDEX Scores ..............................................................................45
Figure 5: ROC E-KINDEX Overall ............................................................................................60
Figure 6 Trends in Obesity among Children and Adolescents ...................................................73
vii
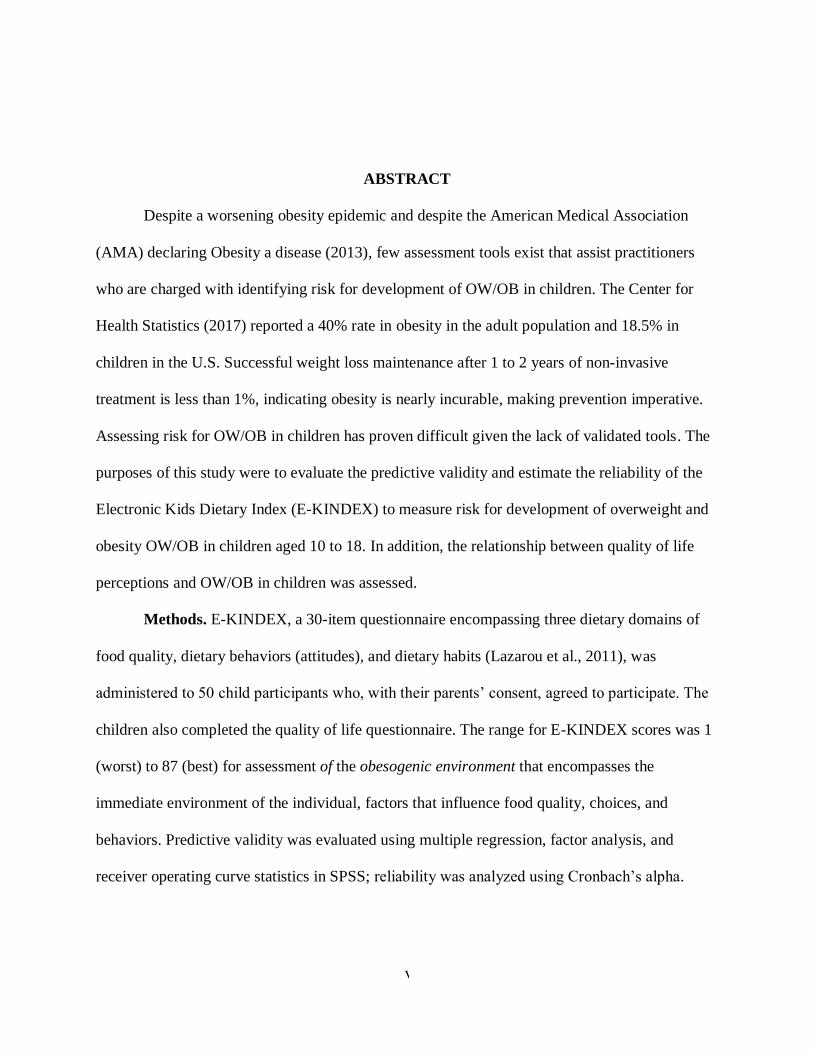
ABSTRACT
Despite a worsening obesity epidemic and despite the American Medical Association
(AMA) declaring Obesity a disease (2013), few assessment tools exist that assist practitioners
who are charged with identifying risk for development of OW/OB in children. The Center for
Health Statistics (2017) reported a 40% rate in obesity in the adult population and 18.5% in
children in the U.S. Successful weight loss maintenance after 1 to 2 years of non-invasive
treatment is less than 1%, indicating obesity is nearly incurable, making prevention imperative.
Assessing risk for OW/OB in children has proven difficult given the lack of validated tools. The
purposes of this study were to evaluate the predictive validity and estimate the reliability of the
Electronic Kids Dietary Index (E-KINDEX) to measure risk for development of overweight and
obesity OW/OB in children aged 10 to 18. In addition, the relationship between quality of life
perceptions and OW/OB in children was assessed.
Methods. E-KINDEX, a 30-item questionnaire encompassing three dietary domains of
food quality, dietary behaviors (attitudes), and dietary habits (Lazarou et al., 2011), was
administered to 50 child participants who, with their parents’ consent, agreed to participate. The
children also completed the quality of life questionnaire. The range for E-KINDEX scores was 1
(worst) to 87 (best) for assessment of the obesogenic environment that encompasses the
immediate environment of the individual, factors that influence food quality, choices, and
behaviors. Predictive validity was evaluated using multiple regression, factor analysis, and
receiver operating curve statistics in SPSS; reliability was analyzed using Cronbach’s alpha.

viii
Pearson product-moment correlations were used to measure strength of relationships among
OW/OB, E-KINDEX scores, and quality of life perceptions in the sample.
Results. E-KINDEX overall score was significantly correlated with OW/OB (r = -340,
n = 50, p = .008), as was Dietary Behaviors (r = -.593, n = 50, p = <.001). These results were
consistent with other statistical analyses, including regression and ROC curve analyses. Internal
consistency for all subscales and the total ranged from .643 to .703. The correlation between
OW/OB and IWQOL-Kids was strong (r = -.340, n = 50, p = <.016), as was E-KINDEX and
IWQOL-Kids (r = .925, n = 50, p = <.001). Subscale structure was supported by factor analysis.
Discussion. Predictive validity of E-KINDEX subscales and overall were supported
through achievement of aims of the study. Correlations between both E-KINDEX scores and
child weights were significant and reliability supported by Cronbach’s alpha. Limitations
included small sample size of 50 and accuracy of children self-report data in the presence of
parents. Parental weight did not correlate with E-KINDEX, but should be studied further relative
to the Obesogenic Environment. Physical activity was high in both OW/OB and lean groups.
Validated Physical Activity tools are needed.
Implications. Although refinement and further study are needed, E-KINDEX is a useful
tool for clinicians to identify children at risk for the chronic disease of OW/OB before it
develops, perhaps before risk factors become difficult to modify.

1
CHAPTER ONE:
INTRODUCTION
Overweight (OW) and Obesity (OB) are complex, chronic diseases that are precursors to
a multitude of chronic ailments that decrease life expectancy and quality of life (QOL) globally
(Centers for Disease Control and Prevention [CDC], 2013). Beyond the individual burden
imposed by chronic diseases such as cardiovascular disease, hypertension, hyperlipidemia,
diabetes, stroke, and cancers that contribute to premature death, OW and OB carry a financial
burden for all citizens in the United States. Tsai, Williamson, and Glick (2011) reviewed 33
U.S. studies to calculate direct medical costs of OW and OB to the individual as $266 and $1,723
respectively, and, combined, to the nation as $113.9 billion annually in 2008. CDC reported a
figure of $147 billion for direct and indirect costs as well, indicating that in 2006 this represented
9.1% of all annual medical costs paid by Medicare, Medicaid, and private insurers—up from
6.5% in 1998. This was a 42% increase in cost for care of obese patients in one decade. In the
time period of 2009 to 2012, 35.7% of adults age 20 to 74 were classified as obese, a number that
increased 31% from 1998. Medical care costs related to obesity increased by more than $315.8
billion in 2010 as a result (Stilwell, 2015). Prevalence of obesity worldwide has caused the
World Health Organization to declare it as an epidemic threatening public health worldwide
(2013), currently causing more deaths worldwide than underweight, and state that it is
preventable (2014). Modern lifestyle patterns have changed to reflect increasing choices of
energy-dense foods combined with decreased expenditures of physical activities (Lang &
2
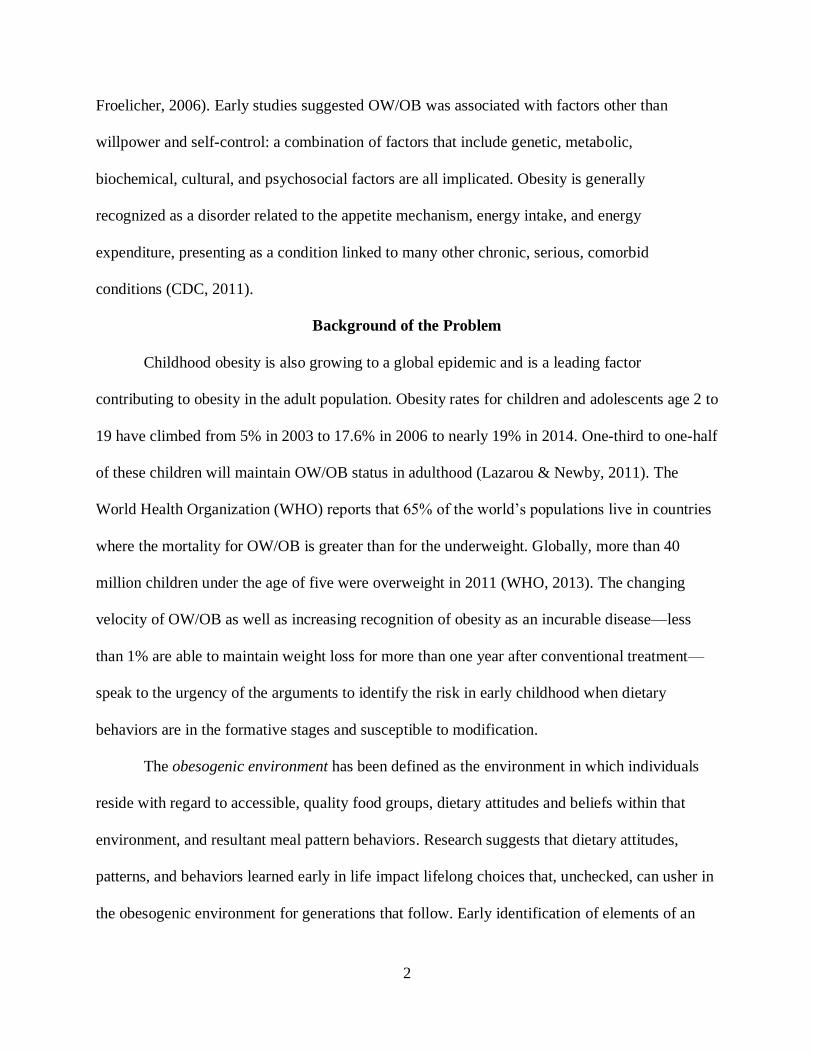
Froelicher, 2006). Early studies suggested OW/OB was associated with factors other than
willpower and self-control: a combination of factors that include genetic, metabolic,
biochemical, cultural, and psychosocial factors are all implicated. Obesity is generally
recognized as a disorder related to the appetite mechanism, energy intake, and energy
expenditure, presenting as a condition linked to many other chronic, serious, comorbid
conditions (CDC, 2011).
Background of the Problem
Childhood obesity is also growing to a global epidemic and is a leading factor
contributing to obesity in the adult population. Obesity rates for children and adolescents age 2 to
19 have climbed from 5% in 2003 to 17.6% in 2006 to nearly 19% in 2014. One-third to one-half
of these children will maintain OW/OB status in adulthood (Lazarou & Newby, 2011). The
World Health Organization (WHO) reports that 65% of the world’s populations live in countries
where the mortality for OW/OB is greater than for the underweight. Globally, more than 40
million children under the age of five were overweight in 2011 (WHO, 2013). The changing
velocity of OW/OB as well as increasing recognition of obesity as an incurable disease—less
than 1% are able to maintain weight loss for more than one year after conventional treatment—
speak to the urgency of the arguments to identify the risk in early childhood when dietary
behaviors are in the formative stages and susceptible to modification.
The obesogenic environment has been defined as the environment in which individuals
reside with regard to accessible, quality food groups, dietary attitudes and beliefs within that
environment, and resultant meal pattern behaviors. Research suggests that dietary attitudes,
patterns, and behaviors learned early in life impact lifelong choices that, unchecked, can usher in
the obesogenic environment for generations that follow. Early identification of elements of an

3
obesogenic environment that lend themselves to modification may allow for changes within that
environment as well as promote long-term healthy eating and dietary behavior patterns for
individuals through the life-span (Lazarou, Panagiotakos, Spanoudis, & Matalas, 2011).
A review of relevant literature suggests strong evidence of negative psychosocial
consequences for obese youth that includes poor quality of life (QOL) scores (Nadeau, Kolotkin,
Boex, Witten et al., 2011; Kolotkin, Zeller, Modi, & Samsa, 2006; Jensen & Steele, 2010).
Health-related QOL is the individual’s quality of life associated with physical, mental, and social
well-being (WHO, 2001). Positive health-related QOL perceptions are essential for individuals
to practice health-promoting behaviors with regard to OW and OB and their sequelae (Tsiros,
Olds, Buckley, Grimshaw et al., 2009). Based on pooled results from 28 studies, Tsiros and
colleagues identified an inverse relationship between Body Mass Index (BMI) scores and
Pediatric Quality of Life Inventory scores in patients who did not have other medical conditions.
The association of QOL with adult OW/OB is well-documented in the literature (Jensen &
Steele, 2010; Katz, McHorney, & Atkinson, 2000). Examination of health-related quality of life
in the pediatric population began around 2000. Preliminary findings indicate that poor health-
related QOL is associated with increased symptoms of depression and decreased social support
for obese youth pursuing a weight-loss program (Zeller & Modi, 2006). Symptoms of depression
can be a barrier to pursuit of weight loss and/or weight loss maintenance for these individuals
who are at a developmental stage when peer acceptance is critical (Kolotkin, Zeller, Modi,
Samsa et al., 2006).
Ineffective Treatment
Extensive research has been devoted to the pathophysiology of OW and OB over the past
three decades (NIH, 2010; Redinger, 2007). Weight loss and maintenance of weight loss across

4
populations remain difficult, however, despite targeted recommendations aimed at both nutrition
and physical activity from the Surgeon General, National Institutes of Health, and medical and
behavioral research communities (Lang & Froelicher, 2006; Montesi, Ghoch, Brodosi, Calugy et
al., 2016; Ogden, Carroll, Kit & Flegal, 2014). High rates of participation in a variety of
evidence-based weight loss regimens have been documented, and many of these same
participants have repeated the regimen or an alternative with poor outcomes over time. Weight
regain in both the pediatric and adult populations continues to contribute to the rise in obesity; in
many cases, the weight regained is greater than the weight lost in a supervised weight-loss
regimen (Elder, Ritenbough, Mist, Aickin et al., 2007). OW/OB are theoretically preventable
conditions, yet prevention methods are not yet clear. Many studies have supported the inverse
relationship of OW/OB to Health-Related Quality of Life (HRQOL) in adults, but studies in the
pediatric population have only begun to appear in the literature since 2003 (Jensen & Steele,
2010; Tsiros et al., 2009). Studies that inform clinicians about risks to their patients at earlier
developmental stages in the life cycle may point to preventive measures that are more effective
than weight loss therapy might be at a later stage. The E-KINDEX behavioral domain scores
have shown strong correlation with OW/OB status as a domain that may lend itself to successful
behavioral interventions interrupting further development of OW/OB in individuals.
Prevention
Instruments have been developed that measure OW/OB retrospectively. Body Mass
Index (BMI) can easily be calculated to diagnose the disease after it has developed. The Centers
for Disease Control and Prevention (CDC) developed growth charts that measure growth in
percentiles based on children’s age, gender, stature, and weight that determine if the child—age
2 to 20—has a body mass index (BMI) that is healthy, overweight, or obese (2000). Clinicians

5
might be of greater service to patients if high-risk individuals could be identified before
development of OW/OB. Screening measures are needed to identify youth at risk for OW/OB in
order to effect changes in their obesogenic environment that, in turn, will decrease the incidence
of OW/OB and sequelae. The Electronic Kids Dietary Index (E-KINDEX), originally developed
by Lazarou et al. (2011), is one of the first tools designed to screen children for risk of
development of OW/OB based on exposure to environmental factors. According to Lazarou et al.
(2011), the index measures the obesogenic dietary habits of children within the family.
Arguably, E-KINDEX measures elements of the obesogenic environment. The index contains
three subscales: Foods E-KINDEX (dietary quality), Dietary Habits E-KINDEX (dietary
attitudes), and Eating Behaviors E-KINDEX (dietary meal patterns). Age, gender, physical
activity level, screen time, socioeconomic status (SES), breastfeeding, and parental OW/OB
status data were examined for significant associations with OW/OB in the original study. Results
supported prior evidence that suggests the importance of dietary habits in childhood obesity. The
index discriminated well across socio-demographic and health behavior factors: children with
low SES also had high screen-time scores while parents practicing healthy dietary habits tended
to have children who did the same (Lazarou et al., 2011). Validated tools are needed, therefore,
that identify risk for unhealthy weight status prospectively.
Purpose. The purpose of this study is to evaluate validity and estimate reliability of the
E-KINDEX in identification of pediatric patients at risk for OW/OB who come to the Healthy
Weight Clinic at University of South Florida Health South Tampa campus and to measure the
association of excess weight with quality of life perceptions in this sample.
6
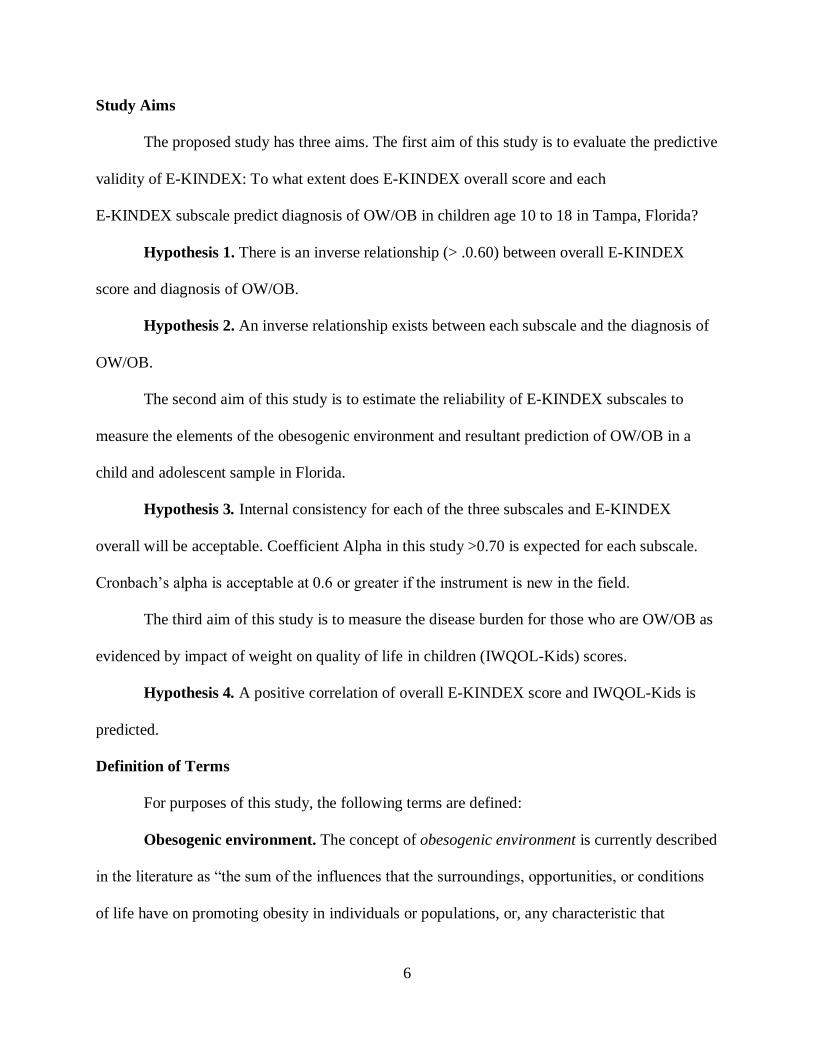
Study Aims
The proposed study has three aims. The first aim of this study is to evaluate the predictive
validity of E-KINDEX: To what extent does E-KINDEX overall score and each
E-KINDEX subscale predict diagnosis of OW/OB in children age 10 to 18 in Tampa, Florida?
Hypothesis 1. There is an inverse relationship (> .0.60) between overall E-KINDEX
score and diagnosis of OW/OB.
Hypothesis 2. An inverse relationship exists between each subscale and the diagnosis of
OW/OB.
The second aim of this study is to estimate the reliability of E-KINDEX subscales to
measure the elements of the obesogenic environment and resultant prediction of OW/OB in a
child and adolescent sample in Florida.
Hypothesis 3. Internal consistency for each of the three subscales and E-KINDEX
overall will be acceptable. Coefficient Alpha in this study >0.70 is expected for each subscale.
Cronbach’s alpha is acceptable at 0.6 or greater if the instrument is new in the field.
The third aim of this study is to measure the disease burden for those who are OW/OB as
evidenced by impact of weight on quality of life in children (IWQOL-Kids) scores.
Hypothesis 4. A positive correlation of overall E-KINDEX score and IWQOL-Kids is
predicted.
Definition of Terms
For purposes of this study, the following terms are defined:
Obesogenic environment. The concept of obesogenic environment is currently described
in the literature as “the sum of the influences that the surroundings, opportunities, or conditions
of life have on promoting obesity in individuals or populations, or, any characteristic that

7
presents a barrier to maintaining a healthy weight” (Swinburn, Egger, & Razzer, 1999, p. 563).
The environment includes the home, school, and social gatherings—anywhere children reside
with regard to availability of dietary quality, attitudes, and meal pattern behaviors. This study
focused on the individual, a pediatric client age 10-18, who is living in the Tampa area. This
study was not concerned with the obesogenic environment of the community, rather that
immediate environment, including home and school, in which the participant conducts his or her
daily life. Lazarou and colleagues (2011) developed the E-KINDEX as a composite measure of
obesogenic dietary habits of children within their environments. The obesogenic environment
encompasses dietary quality, dietary behaviors/attitudes, and dietary meal patterns.
Dietary quality. Obesity researchers have long associated quality of diet as indicated by
variety and balance as being associated with OW/OB or healthy weight individuals (Lazarou,
kalavana, & Matalas; 2008; Ihmels, Eisenmann, Nusser, & Myers, 2009; Kirk, Penney, &
McHugh, 2009). This study examined frequency of consumption of eleven foods/food groups
and two methods of food preparation associated with individuals designated as OW/OB against
those who are of healthy weight. Quality and frequency of dietary intake relative to variety,
balanced choices, cooking methods, and home-made versus fast food intake were measured.
Dietary behaviors. The development of OW/OB has been associated with dietary
behaviors that are related to nutritional attitudes. Specific attitudes that drive lifetime behaviors
are associated with development of OW/OB (DeAndrade, Barros, Carndina, Goldbaum et al.,
2010; Feskanich, Rockett, & Colditz, 2004; Haines, Siega-Riz, & Popkin, 1999), and, based on
review of relevant literature, eight of them were identified by Lazarou (2011) and colleagues for
inclusion in the E-KINDEX: individual feelings regarding attitudes about personal weight status,
history of dieting, food choices, parental insistence on cleaning the plate, and feelings of guilt
8
when eating unhealthy foods. These items are indicators of the concept Lazarou calls “cognitive
schemas” that influence lifetime dietary practices of individuals and are believed to be critical
factors associated with development of OW/OB (Lazarou et al., 2011). These eight items were
measured in this study.
Dietary meal patterns. Several studies have found associations between particular meal
pattern behaviors and OW/OB (Woodward-Lopez, Ritchie, Gerstein, & Crawford, 2006;
Feskanich, Wilbur, & Larson, 2005). This study measured these patterns that include frequencies
of eating breakfast, when not hungry, alone, because of advertising, and foods made in the home.
Overweight and/or obesity (OW/OB). This study includes a sample of OW/OB patients
in a pediatric population in Tampa, Florida, focusing on the obesogenic environment of the
pediatric and adolescent patient age 10 to 18. Children present to the clinic at varying stages of
growth, development, and maturity, and these variances differ for boys and girls. Body Mass
Index (weight for height) is adequate for measuring adult weight status, but measurement in
children is reported as a Body Mass Index (BMI) for gender and age percentiles comparing the
individual BMI, which also incorporates stature, with other boys and girls of the same age CDC,
2010). This study reports weight status as described in Table 1. Individual growth charts
developed by CDC as percentiles for girls and boys age 2 to 20 can be viewed in Appendix A.
Table 1
CDC Growth Chart Interpretation United States
Body mass index for age and gender percentiles: Weight category
Less than 5th percentile Underweight
5th percentile to less than the 85th percentile Healthy weight
85th percentile to less than the 95th percentile Overweight
95th percentile or greater Obese

9
Further, the following graphs, Figures 1 and 2 respectively, illustrate how primary care providers
can plot BMI for age on these charts to detect whether weight gains in the child are stable or
rapid—all based on age, weight, stature, and gender. These figures are published by CDC.
Figure 1. Trended BMI Stable Figure 2. Trended BMI Rapid
Graphed BMI-for-age trend for female. Copyright 2004 by the
Centers for Disease Control..
Graphed BMI-for-age trend for male. Copyright 2004 by the
Centers for Disease Control...
Quality of Life
Health-related quality of life has been defined by the World Health Organization as an
“individual’s quality of life associated with their physical, mental, and social well-being” (WHO,
2001), derived from their original definition of that individual’s “Perceptions of their position in
life in the context of the culture and value systems in which they live and in relation to their
goals, expectations, standards and concerns” (World Health Organization, 2001). Researchers
have measured pediatric quality of life with specific diseases in an effort to quantify the
particular burden of a disease carried by individuals with a specific disease. Health-related
quality of life focuses on health, illness and the impact of treatment in a variety of diseases. In

10
the past decade, the relationship of childhood OW/OB been explored in relationship to the
disease burden experienced by children, and findings suggest a significant relationship between
pediatric OW/OB and decreased quality of life. (Jensen & Steel, 2010; Tsiros, Olds, Buckley,
Grimshaw et al., 2009). Further, young people afflicted with OW/OB suffer self-esteem
deficiencies that can impact the efficacy of specific interventions including weight-loss
interventions and are critical to identify in those with the diagnosis of OW/OB (Ferrans,
Zerwick, Wilburand & Larsen, 2005). Nadeau and colleagues (2011) examined quality of life in
adolescents who had comorbidities with OW/OB and designed an instrument called IWQOL-
Kids, or the impact of weight on quality of life in kids. They demonstrated decreased physical
comfort, diminished body esteem, dissatisfying social life, and strained family relations in
adolescents suffering from OW/OB. Psychosocial correlates are as yet poorly understood in
adolescents, although many who have studied the relationship of quality of life to OW/OB
suggest that body dissatisfaction, pressure to be lean, and depressive symptoms contribute to
difficulties in treating OW/OB in adolescents (Chaiton, Sabiston, O’Loughlin, McGrath et al.
2009; Tsiros et al., 2009; Nadeau et al., 2011). The IWQOL-Kids has subsequently been
validated for use in adolescents and was administered as part of this study.
Although the literature suggests a significant burden of OW/OB for children and
adolescents, consideration must be given to the notion that low self-esteem and depression may
be precedents as opposed to consequences for weight status. This is reflected in the conceptual
framework that depicts the bidirectional arrow for these two concepts.
Physical Activity Levels
Physical activity levels have been associated with decreased incidence of overweight and
obesity (Lazarou & Soteriades, 2010; Loucaides, Jago, & Theophanous, 2011). This study

11
categorizes child participants into three levels based on their responses to items in the
International Physical Activity Questionnaire Short Form (IPAQ-SF) developed by Hagströmer,
Oja, & Sjöström, (2006). The levels are based on measures of metabolic equivalents (MET)
intensity plus duration. One MET minute is the amount of oxygen consumed at rest known
commonly as resting metabolic rate. Moderate intensity activity is in the range of 3.0 to 6.0
METs; intensity that results in greater than 6.0 METs is considered vigorous (United States
Department of Health and Human Services, 1999). (Appendix B).
Inactive. This is the lowest category of physical activity in which individuals are
considered inactive. This category was assigned to those individuals who self-reported some
level of activity but not enough to meet criteria for the other two categories.
Minimally active. This category was assigned individuals who report any one of the
following duration and intensity of activities:
1. Three or more days of vigorous activity of 20 or more minutes’ duration OR
2. Five or more days of moderate-intensity activity and/or walking of at least 30
minutes per day OR
3. Five or more days of any combination of walking, moderate-intensity or vigorous-
intensity activities achieving at least 600 MET minutes per week.
HEPA active. This category was assigned to individuals who exceed the minimum
public health physical activity recommendations and reported either of the following duration
and intensity of activities:
1. Three or more days of vigorous activity that total 1,500 or more MET-minutes per
week OR
2. Seven or more days of any combination of walking, moderate or vigorous

12
intensity activities that total 3,000 or more MET-minutes per week. (Hagströmer
et al., 2006).
Significance to Nursing
Childhood obesity is growing to a global epidemic and is a leading factor related to
obesity in the adult population in the United States and globally. Obesity rates for children and
adolescents have climbed from 5% in 2003 to 17.6% in 2006, and even though they have leveled
to 17.6% in 2012, this represents an alarming 300% increase in rates in one decade. Nearly half
of OW/OB children maintain that weight status in adulthood (Lazarou & Newby, 2011). The
World Health Organization (WHO) reports that 65% of the world’s populations live in countries
where the mortality for OW/OB is greater than for the underweight. Globally, more than 40
million children under the age of five were overweight in 2011 (WHO, 2013).
Identification of at-risk OW/OB clients at earlier ages is essential if progress is to be
made to reverse the epidemic trends that are the status quo. CDC is currently reporting slight
declines in a few states in the U.S. in the recent past, but much more work is needed. Instilling
healthy eating patterns and dietary behaviors in youth is much more likely to result in a decline
in OW/OB rates than trying to change habits in these individuals when they are older (Elder et
al., 2007). Efforts at prevention of the onset of OW/OB in younger populations would be
enhanced if modifiable risks were identified and appropriate interventions implemented before
elements of the obesogenic environment become established. Nursing process begins with
assessment, and valid, reliable measurement tools are essential to accurate assessment.
E-KINDEX promises to be a valid and reliable measure of the obesogenic environment of
children, resulting in the possibility of early and tailored intervention.

13
Nurses are well-positioned to implement the health promotion measures associated with
childhood OW/OB. Primary care practitioners encounter their pediatric patients in clinical
settings ideal to screen for risk factors or sequelae for OW/OB. The obesogenic environment that
is consistently being outlined in the literature includes food group intake, eating beliefs and
behaviors, and dietary practices (Combs, Pearson, & Smith, 2011; Lazarou & Kouta, 2010;
Lazarou, Panagiotakos, Spanoudis, & Matalas, 2011; McAdams, 2010). Results of this study
may be used to advance the body of nursing science in the provision of a tool for clinicians to
use as they attempt early identification of individuals at risk for OW/OB as a consequence of an
obesogenic environment. The National Association of Pediatric Nurse Practitioners (NAPNAP)
has (2015) issued a position statement charging nurse practitioners to identify children at risk for
OW/OB early in childhood. Nurse Practitioners will need measurement tools in order to perform
assessment. An index such as the Electronic Kids Dietary Index (E-KINDEX) presents a method
to assess the obesogenic environment in pediatric patients early—prior to development of
OW/OB. Chapter Two includes a review of relevant literature as well as the conceptual
framework that guides the study.

14
CHAPTER TWO:
REVIEW OF LITERATURE
Chapter Two includes a discussion of relevant literature surrounding the increasing
problems of overweight and obesity that are increasingly being seen in younger populations
[Centers for Disease Control (CDC), 2013; Kirk, Penney, & McHugh, 2009]. The conceptual
framework that drives the literature review of the study will be presented. Factors identified as
contributing to development of OW/OB in children will be explored, as well as quality of life
perceptions that often are diminished in children who are overweight.
Overweight and obesity (OW/OB) in adult populations have been diligently studied over
the past three decades National Institutes of Health (NIH, 2012). The cost to individuals and
society in the forms of disease burden and health care dollars are well known (CDC, 2013).
Despite what is known about pathophysiology, prevention, and treatment, little has been
achieved to stall or retard this epidemic Weight regain after supervised weight-loss programs in
both the pediatric and adult populations is a major factor implicated in the persistent rise of
OW/OB because weight regain is often greater than weight loss (Soeliman & Azadbakht, 2014;
Elder, Ritenbough, Mist, Aickin et al., 2007). Focus on younger individuals has intensified in
order to effect behavioral changes with regard to dietary preferences, attitudes, and behaviors
that can prevent the development of OW/OB earlier (NAPNAP, 2015; Lazarou, Panagiotakos,
Spanoudis, & Matalis, 2011).

15
During the past decade, researchers attempting to advance the science of OW/OB have
begun to use the term “obesogenic environment” to describe the environment of the individual
who is at risk for OW/OB. “Obesogens” in the environment include dietary attitudes, habits, and
beliefs, food preferences, physical activity and screen time (Lazarou, Panaglotakos, Spanoudis,
& Matalas, 2011; Kirk et al., 2009).
While OW/OB is a key public health concern and medical sequelae well-documented
(CDC, 2013; Seals, 2007; WHO, 2016), excess weight exerts deleterious effects on physical,
functional, and social well-being, the components of health-related quality of life (Nadeau,
Kolotkin, Boex, Witten et al., 2011; CDC, 2013; NIH, 2013). Pediatric quality of life related
specifically to OW/OB has been studied only within the past ten years, but the relationship of
OW/OB to poor quality of life has been established. Researchers cite the difficulty of treating
either OW/OB or depressive symptoms in the face of both (Tsiros, Olds, Buckley, Grimshaw et
al., 2009; Chaiton, Sabiston, O’Loughlin, & McGrath, 2009).
Dietitians collected data on dietary and lifestyle characteristics of 1,140 Cypriot children
in the 4th, 5th, and 6th grades in 24 primary schools in Greece for the CYKIDS study. Self-
reported data of interest to Lazarou et al., (2011) were retrieved to calculate the Electronic Kids
Dietary Index (E-KINDEX) Overall Score. This was followed by the collection of
anthropometric data from a subset of 622 children who, with their parents, consented to
participate in the study. Factors considered in the analysis included BMI, waist circumference,
general obesity, physical activity levels, screen time, parental OW/OB status, demographics,
gender, and vital signs. The Lazarou study results suggested E-KINDEX is a useful predictor of
risk for OW/OB in a pediatric population (Lazarou et al., 2010). The study proposed here

16
documented many of these data points in addition to quality of life perceptions in children 10 to
18. A summary concludes Chapter Two.
Conceptual Framework
The conceptual framework for this study guided the review of relevant literature and the
key study concepts including obesogenic environment, physical activity level, screen time,
parental OW/OB status, as well as impact of weight on pediatric quality of life (IWQOL-Kids).
The obesogenic environment encompasses three concepts: dietary quality, dietary attitudes and
beliefs (cognitive schema) and dietary patterns and practices (Lazarou et al., 2011). Moderating
variables included physical activity and screen-time levels determined by self-report as well as
parental OW/OB status, also self-reported. Covariates included age, gender, and socioeconomic
status by proxy of having private health insurance. Outcome variables included weight status and
impact of weight on quality of life perceptions. Databases used to retrieve the literature included
PubMed, CINAHL, and PsychINFO. An explanation of validity and reliability is presented
because this is a psychometric study.
The conceptual framework is derived from the preponderance of the literature over the
past three decades that describes the epidemic of overweight and obesity (OW/OB) that has
increased worldwide despite advances in short-term weight loss treatment as well as
advancement in the body of science of the pathology of OW/OB (CDC, 2010; Cole, Bellizi,
Flegal, & Dietz, 2011; Deurenberg, Weststrate, & Seidell, 1991; WHO, 2013). The rise in the
rates of increase in OW/OB has increased dramatically in younger children as well and continues
to march on; the state of the science with regard to children age 10 to 18 is less robust than that
of the adult population (Lazarou & Newby, 2011). The conceptual framework, Figure 3,
illustrates the obesogenic environmental factors’ influences on the variables of physical activity

17
levels and parental OW/OB that ultimately impact the measured outcomes of OW/OB and
impact of weight on quality of life perceptions.
Figure 3. Conceptual Framework
Figure 3. Visual description of the relationship between obesogenic environmental factors and their influence
on variables that impact outcomes of weight and impact of weight on perceived quality of life. Copyright 2017
by Patricia A. Hall.
Obesogenic Environment
For purposes of this study, the obesogenic environment incorporates three categories of
variables found in the immediate environment of the pediatric individual: food groups indicative
of dietary quality, dietary attitudes, beliefs, and cognitive schema indicative of the formation of
food practices that remain throughout the lifespan. Meal patterns and habits of young people that
develop as they grow within their environment–such as eating alone or with family, whether they
eat home-prepared foods, and whether food preferences are related to advertising–are formed at a
young age. The Electronic Kids Dietary Index (E-KINDEX) concurrently assesses dietary
quality, dietary attitudes and beliefs, and dietary meal patterns known to be associated with the
development of childhood obesity (Combs et al., 2011; Lazarou et al., 2011; Zeller & Modi,
2006). Other dietary indices that are similar to E-KINDEX in that they assess very similar factors

18
within the obesogenic environment include the Family Nutrition and Physical Activity Screening
Tool (Ihmels, Welk, Eisenmann, Nusser et al., 2009), Healthy Lifestyle Diet Index (Manios,
Kourlaba, Grammatikaki, Koubitski et al, 2010), Dietary Quality Index (de Andrade et al., 2010),
and Dietary Index Revised (Haines et al., 1999).
Dietary quality. For purposes of this study, food groups consumed plus two cooking
methods are assessed relative to variety and frequency to be considered as proxy indicators of
quality of the diet. Food frequency questionnaires (FFQs) score frequency of consumptions of
bread, grains (excluding bread), fruits, vegetables, legumes, milk, seafood, meat, salted/smoked
meat, sweets, junk food, soft drinks, fried foods, and grilled foods. These food groups and
cooking methods are accepted across a number of studies as associated with development of
overweight and/or obesity (Haines, Siega-Riz, & Popkin, 1999; Lazarou & Newby, 2011;
Ihmels, Welk, Eisenmann et al., 2009).
Dietary attitudes and beliefs. Dietary attitudes that impact dietary behaviors serve as
proxy indicators of cognitive schema that determine development of children’s dietary
preferences as they develop across the lifespan (Lazarou, Kalavana, & Matalas, 2008; Ihmels et
al., 2009). Dietary attitudes are determined by assessing the degree to which individuals think
their diet is healthy and weight is above normal, whether they have tried to be ‘on a diet’, feel
guilty when eating something unhealthy, whether they choose to eat unhealthy items, whether
parents insist they eat all their food or whether they eat even when not hungry. These attitudes
are associated with OW/OB in adolescents (Ihmels et al.; Lazarou et al., 2008). These attitudes
can influence preferences that can become patterns of usual and lifetime behaviors that are
associated with the development and intractability of obesity. Other factors include parent
modeling, child-feeding practices, restriction of certain foods, restraint with regard to dietary

19
preferences, and parenting styles in general (Lazarou, Kalavana, & Matalas, 2008). Evidence has
shown that these factors are influential on the individually learned dietary patterns that are
difficult to change after childhood (Ihmels et al.; Lazarou et al., 2010, 2011).
Dietary meal patterns. This factor includes assessment of frequencies for patterns of
dietary practices over the past two days of eating in fast food and other restaurants, eating least
favorite but ‘healthy’ food, eating with family, eating alone, eating afternoon school snacks,
numbers of main meals plus snacks, eating foods because of advertising, and eating foods
prepared in the home. Meal patterns and habits assess the psychological factors that influence
dietary preferences. These patterns of behaviors have been identified in several studies as
correlating with development of OW/OB in children (Gutin, 2011; Ihmels et al., 2009; Lazarou,
Panagiotakos, Spanoudis, & Matalas, 2010). The behaviors become patterns in the lifespan
arising from the cognitive schemas discussed and assessed in the dietary attitudes and beliefs
subscale.
Moderator Variables
Moderator variables influence the strength of the relationship between the environment
and the outcome variables in research. This study identified parental OW/OB, physical activity
levels, and screen time as moderator variables.
Parental OW/OB. has been identified as a significant indicator for risk of OW/OB in
children (CDC, 2010; Ihmels et al., 2009; Lazarou et al., 2010) and is included in the conceptual
framework of this study. Leanness of parents is also associated with dietary attitudes, beliefs,
patterns, and behaviors—the obesogenic environment (Combs, Pearson, & Smith, 2011; Ihmels
et al., 2009; Lazarou, Kalavana, & Matalas, 2008). The majority of studies include the
20
assessment of parental OW/OB by self-report. This study collected height and weight for each
parent in order to calculate Body Mass Index for each parent in the pediatric sample.
Physical activity level. Activity (or inactivity) has long been cited in the literature as an
important factor associated with development of OW/OB in the adult population, and currently
the same is true for pediatric OW/OB (Ihmels et al., 2009; Lazarou et al., 2009; Gutin, 2011).
This study included both physical activity levels and screen time as moderating variables. They
are opposing in that they relate to energy expenditure and sedentary behavior and are associated
with elevated BMI scores in both adult and pediatric populations. Physical activity level was
determined by using a questionnaire that documents weekly frequencies and intensity of
activities within an average week as well as number of hours per day of screen time (ST).
Greater than two hours per day of screen time is associated with increased diagnosis of OW/OB
(Lazarou et al., 2010). Very few physical activity indices have been validated for use in the
pediatric population. Actually, few are valid and reliable for adults (NIH, 2013). Further,
children’s physical activities are more difficult to measure than those of adults because children
tend to exhibit short bursts of high-intensity exercise followed by periods of rest (CDC, 2010).
This study utilized the International Physical Activity Questionnaire Short Form (IPAQ-SF) to
measure three self-reported levels of physical activity intensity: low, moderate, or high
(Hagströmer, Oja, & Sjöström, 2006). The levels are calculated measuring the frequency and
intensity of physical activities over the last seven days. Sedentary behavior that is sometimes
cited in adult studies is referred to as screen time in pediatric populations to identify time spent
watching television, gaming, and using social media and computers measured in hours per day
(Gutin, 2011; Ihmels et al., 2009; Lazarou, Panagiotakos, Spanoudis, & Matalas, 2010). Screen

21
time greater than two to three hours per day is associated with higher risk for OW/OB in both
adults and children (Loucaides, Jago, & Theophanous, 2011; Lazarou et al., 2011).
Covariates
Covariates are variables of interest to the researcher that may or may not influence the
outcome variable. Age, gender, and socio-economic status are considered covariates in this study.
Children age 10 to 18 were included for participation in the study. Children in various stages of
development across the lifespan, particularly in adolescence, have metabolic and BMI indicators
that differ within and across both gender and age. Boys and girls produce hormones at various
levels during puberty that affect metabolic rate and demands (Edwards, Huebner, Connell, &
Patrick, 2002; Lazarou, Kalavana, & Matalas, 2008; NIH, 2010). Age differences have been
calculated to reflect normal and abnormal BMI based on percentiles of expected growth in early
childhood (CDC, 2013). Because age and gender are incorporated in the instrument of
measurement of the outcome variable OW/OB, age and gender were reported as descriptive
statistics for the sample. Socioeconomic status was estimated by proxy of having private health
insurance.
Outcome Variables
The outcome variables for this study include OW/OB and quality of life. The obesogenic
environment that includes factors influential in the development of OW/OB in children is well
established (Swinburn, Egger, & Raza, 1999; Manios, Kourlaba, Grammatikaki, & Koubitski,
2010). Disease burden of weight as an outcome of OW/OB is well-established in adult
populations (Jensen & Steele, 2010) and becoming established for children (Zeller & Modi,
2006; Kolotkin et al., 2006).
22
OW/OB. Anthropometric data that include height and weight were utilized to calculate
Body Mass Index (BMI) for each child and plotted on the gender-appropriate CDC growth chart
body mass index-for-age percentiles. CDC has developed separate charts for boys and girls, age
2 to 20, based on height, weight, stature, and age, that are used to identify those who are at risk
or are currently OW/OB. The National Institutes of Health (2010) define OW as BMI greater
than or equal to 25 kg/m2 and OB as BMI greater than or equal to 30 kg/m2 (Cole, Bellizzi,
Flegal, & Dietz, 2000; Lazarou et al., 2010). Once the BMI is appropriately plotted on the
gender-appropriate growth chart, the percentile indicates healthy weight as 5% or greater up to
85%; overweight as greater than 85% but less than 95%; obese as greater than 95% (CDC,
2013).
Quality of life. Treating excessive weight gain, regardless of population, is difficult.
Overweight individuals are stigmatized, often by themselves as well as others. In some cases,
individuals may have become depressed about another issue in their lives and develop OW/OB
as a result while others became depressed as a result of developing OW/OB. Regardless,
diminished quality of life as an association of OW/OB is well-documented (Kolotkin, 2011).
Many studies have combined a pediatric health-related quality of life concept with specific
diseases in an effort to quantify the particular burden of a disease carried by the young person
(Nadeau et al., 2011; Kolotkin et al., 2011). Health-related quality of life focuses on health,
illness and the impact of treatment in various diseases (Nadeau, Kolotkin, Boex, Witten et al.,
2011). Only in the past ten years has the relationship of childhood OW/OB been studied in the
context of QOL experienced by children specifically, and findings are significant for the positive
correlation of these variables (Jensen & Steel, 2010; Tsiros, Olds, Buckley, Grimshaw et al.,
2009). Young people afflicted with OW/OB suffer self-esteem deficiencies that can impact the

23
efficacy of specific interventions, including weight-loss interventions, so are critical to identify
(Ferrans, Zerwick, Wilburand & Larsen, 2005). Children and adolescents diagnosed as OW/OB
were found to experience decreased physical comfort, diminished body esteem, dissatisfying
social life, and strained family relations (Kolotkin et al., 2010). Nadeau and colleagues point out
that psychosocial correlates are as yet poorly understood in adolescents, and more studies are
needed. Many who have studied the relationship of health-related quality of life with OW/OB
suggest that body dissatisfaction, pressure to be lean, and depressive symptoms contribute to
difficulties in treating OW/OB in adolescents (Chaiton, Sabiston, O’Loughlin, McGrath et al.,
2009; Tsiros et al., 2009; Nadeau et al., 2011). IWQOL-Kids was used to assess quality of life in
the children who participated in this study.
The review of literature reveals that research in the area of pediatric OW/OB is relatively
new. The review finds that over the past three decades, the scientific community focused on
physiologic factors leading to the development and sequelae of OW/OB that have led to varieties
of repetitive diets, medicines, and therapies that have shown only short-term successes in the
adult population. Weight loss successes in adults are often accompanied by weight regain and, in
many cases, regain of weight in excess of the onset of the therapy or diet (Elder et al., 2007).
This factor in the obesity epidemic begs for interventions to be successful at earlier instances in
the life span. In order to offer interventions earlier in the life span, it is critical that individuals at
risk be identified earlier. The literature offers minimal tools available to clinicians for screening
at-risk individuals. Anticipation that OW/OB would extend to youth and even pre-school
children seemed to have been overlooked in early studies. Current research is examining OW/OB
in younger individuals in an effort to identify those at higher risk for developing OW/OB.
Methodology for the proposed study can be found in Chapter Three.

24
CHAPTER THREE:
METHODS
Chapter Three describes the methods used in the study. The setting and sample are
described, followed by a description of measures, procedures, and data analysis. The purpose of
this study is to evaluate the validity and estimate the reliability of the E-KINDEX in
identification of pediatric patients at risk for OW/OB who come to the Healthy Weight Clinic at
University of South Florida Health South Tampa campus and to measure the association of
excess weight with quality of life perceptions in this sample.
Setting and Sample
A group of primary care practitioners, both doctors and nurses, devote every Wednesday
to patients at the Healthy Weight Clinic as a part of the Medical Pediatric Clinic. Healthy Weight
specialists see patients exclusively on Wednesdays for excess weight as well as eating disorders
of anorexia and bulimia.
Fifty child-parent dyad participants for the study were recruited from the University of
South Florida Medical Pediatric Clinic in Tampa, Florida. Required sample sizes for validating a
scale are unclear among researchers. A review of 114 PubMed articles published between early
2009 and late 2011 on scale validation for patient outcome measures revealed that sample size
was pre-determined in only 9.6% of the studies, and only 4% (5/114) compared a sample size to
item ratio a posteriori (Anthoine, Moret, Regnault, and Sebille, 2014, p. 1). Of these, 92% had a

25
subject-to-item ratio of greater than or equal to 2; 25% had a ratio greater than or equal to 20.
These authors conclude that sample size required to power psychometric validation studies is
rarely done a priori and that methods to justify sample size in these studies are not readily
available. Power analysis using SPSS reveals this sample size is small (n = 50). Post-hoc analysis
of independent samples T-test analysis for E-KINDEX scores and OW/OB status was performed
in SPSS to reveal a large effect size: Cohen’s d = (57.09 - 51.37) ⁄ 6.34516 = 0.901475.
Hedges’g = (57.09 - 51.37) ⁄ 6.34516 = 0.901475, taking into account the different sample sizes
of the lean and OW/OB groups (Table 2).
Table 2
Group Means, Standard Deviations, and Standard Error of Means (OW/OB, Lean)
Group n Mean
Standard
Deviation
Standard Error
of Mean
E-KINDEX OVERALL OW/OB 29 51.37 6.39 1.18
Lean 21 57.09 6.30 1.37
Participants were recruited from the general pediatric and adolescent population of the
clinic plus those from the Healthy Weight Clinic (HWC) that is partnered with the Pediatric
Clinic. The researcher prescreened the electronic health records of the patients age 10 to 18 who
had upcoming scheduled appointments to further determine eligibility based on inclusion and
exclusion criteria. Participants were invited into the study without regard to gender or ethnicity,
who were 10 to 18 years of age, had the ability to speak, read, and write English at the third-
grade level, but who were generally healthy other than being overweight. Participants without
ability to perform activities of daily living or who suffered severe comorbidities, or neurological,
psychological, or developmental delays were excluded. The researcher collaborated with the
medical assistant who was admitting the patient for the provider visit prior to approaching the
26
patient and family. As prospective patients entered the exam room, the researcher provided them
with a brochure (Appendix C) that described the study in language appropriate to third-grade
reading level. The researcher answered any questions, and parents who, with their children,
decided on participation in the study, signed the informed consent (Appendix D), either then or
after their appointment, depending on flow of providers and patients. Children who agreed with
their parents assented for themselves by printing their name on the assent form (Appendix E). A
total of 50 child-parent dyads were targeted for inclusion. The researcher was assigned a room in
the clinic in order to provide a private space for completion of the questionnaires and to facilitate
patient flow in the clinic. In this study, the researcher collected data on dietary and lifestyle
characteristics of 50 children and their parents in Tampa, Florida. The children were school age,
10 to 18, who were patients of pediatric nurse practitioners and physician providers at the USF
Health Pediatric Clinic. These data were incorporated to calculate the E-KINDEX overall score
as well as total scores for each of the subscales.
Measures
Descriptive data were documented on the Demographic Questionnaire Form identified by
dyad number. The 30-item Electronic Kids Dietary Index, a 7-item IPAQ including Screen Time,
and the 32-item weight-related quality of life questionnaire (IWQOL-Kids) were completed by
the child in the presence of his or her parent(s) and the researcher. (Appendix F).
Demographic Questionnaire
Data were collected from parents within the dyads and documented on this form in order
to provide descriptive characteristics of the sample. They were asked if they lived in the city or
country, what type of insurance they had to determine socioeconomic status (SES) by proxy
private insurance for high SES; Medicaid or none for low SES, and whether parents felt their

27
family dietary habits were good, very good, average, or needed improvement. They self-reported
height and weight so the researcher could calculate BMI (Appendix G).
E-KINDEX
The questionnaire content of the overall E-KINDEX derives from food frequency
questionnaires validated by data from the CYKIDS in Cyprus, Greece (Lazarou, Panagiotakos, &
Matalas, 2008). The E-KINDEX was chosen for this study because it measures elements of the
obesogenic environment as supported by the literature and that are reflected in the conceptual
framework (Kirk, Penney, & McHugh, 2009). E-KINDEX measures the obesogenic environment
of the pediatric client with three subscales:
1. Food Groups E-KINDEX measures frequencies of food group components as
indicators of dietary quality (Appendix H).
2. Dietary Behaviors E-KINDEX measures components as indicators of the
psychology of dietary attitudes and eating behaviors (Appendix I).
3. Dietary Habits E-KINDEX measures components as indicators of dietary
practices and/or meal patterns (Appendix J).
Data on dietary and lifestyle characteristics of 1,140 Cypriot children in 2010 in the 4th,
5th, and 6th grades in 24 primary schools (age 9 to 18) were collected in the CYKIDS study. A
subset of data from 622 children was incorporated to calculate the E-KINDEX overall score.
Lazarou and colleagues further incorporated data that included the anthropometric measurements
from those who assented and, with their parents, consented to participate in the original
E-KINDEX study in 2010. E-KINDEX overall score comprises 3 subscales: Foods E-KINDEX,
Dietary Behavior E-KINDEX, and Dietary Habits E-KINDEX, containing 13, 8, and 9 items
respectively. All subscales scored food choices, attitudes, and behavior frequencies on a scale of

28
0 to 3 based on evidence-based dietary recommendations. Items were weighted to account for
increased influence of some factors in the literature as being more influential than others
(Lazarou et al., 2011). Questions and scoring are tabled (Tables 3, 4 and 5).
Validity. Lazarou et al. (2011) employed a validation dataset from the Cyprus Kids
Study (CYKIDS) that was conducted in 2005 by the Cyprus Ministry of Education to track
lifestyle behaviors of the children to assess the accuracy of E-KINDEX scores to discriminate
OW, OB, and lean weight. E-KINDEX higher scores indicate lowered risk for development of
OW/OB. For the CYKIDS subset, scores ranged from 32 to 77 without regard to gender, with a
highest possible score of 87.
Cutoff-point analysis was used to determine the optimal value of the E-KINDEX total
score and for each of the three subscales, which were able to discriminate for risk of OW/OB in
children. In the Cypriot children study, four approaches were used to examine the association of
the E-KINDEX score and OW/OB status:
1. Model for Excess Fat
2. Model for excess Waist Circumference
3. Model for Generalized Obesity
4. Model for BMI difference
The Lazarou et al., (2011) analysis determined the best score to discriminate OW/OB
from normal weight to be a 61 of 87 total (sensitivity of 74%); OB from normal weight was 53
of 87 (sensitivity of 61%). E-KINDEX items as well as subscales were correlated.; The three
subscale correlation coefficients were less than 0.118 (p < 0.05) (Lazarou et al., 2011). Multiple
linear regression analysis was used to examine the association between overall E-KINDEX score
and anthropometric measures of body composition at baseline and repeated a year later with

29
similar results. Logistic regressions were used to determine the strength of the associations
between E-KINDEX score and these same four variables adjusted for age, gender, physical
activity levels, screen times, SES, breastfeeding, and parental obesity status. Findings were that
children in the top three E-KINDEX categories, >49 points, had 73%, 76%, and 85% decreased
likelihoods respectively, of being OW/OB (Lazarou, 2011). Higher E-KINDEX scores indicate
healthier dietary quality, attitudes, and behaviors in the obesogenic environment. No significant
differences were observed in OW/OB status between genders in the Lazarou study; (2 = 2.37;
df = 2; p = 0.144). The E-KINDEX overall score proved more reliable in screening for prediction
of obesity than overweight. Significant inverse associations of E-KINDEX scores with each of
the approaches were reported. Similarly, children in the 2nd, 3rd, and 4th categories were 62%,
78%, and 86% less likely to have Waist Circumference > 75th percentile. One-year follow-up
showed similar results (Lazarou, 2011, p. 105). Scoring in the highest category was associated
with an 84% decreased likelihood of increasing BMI >3 kg in one year. These analyses
supported construct validity of the overall E-KINDEX scores (Lazarou, Panagiotakos,
Spanoudis, & Matalus, 2011).
Reliability. A Cronbach’s alpha statistic > 0.6 suggests that items in an index are one-
dimensional and may be combined in a scale (Indrayan & Sarmukaddam, 2001). The Cronbach’s
alpha statistic to assess internal consistency in research that is new, exploratory, related to a new
instrument and/or within the behavioral field is acceptable at the >0.7 level (Nunnaly, 1978).
Others have argued against the arbitrary minimum adequacy of alpha, particularly for new
measures and instead point out that some lower levels of alpha, 0.49, might have an upper limit
of validity of .70 (Schmitt, 1996, p. 351). Internal consistency of E-KINDEX for the Lazarou
study was 0.601 using Cronbach’s alpha, suggesting the tool is reliable to use to determine risk

30
for obesogenic dietary behaviors in a field of research of the obesogenic environment that is
relatively new.
Cronbach’s alpha was calculated for each subscale in E-KINDEX to determine internal
consistency. The subscales and scoring are tabled (Table 3-5).
Dietary Quality E-KINDEX. This subscale measures dietary quality or the frequency of
consumption of eleven types of foods and two cooking methods. These items are queried on a
four-point scale where responses vary from zero to three, zero to two and are sometimes reverse-
scored three to zero based on recommended nutritional items and frequencies. Items for the
subscale were chosen by Lazarou et al., (2010), based on findings from the DONALD study
(Feskanich, Rockett, & Colditz, 2004). Response choices are never, one to two times/week, and
three to five times per week. Responses are weighted within the scale to reflect healthy or
unhealthy frequencies; for example, never eating smoked or salted meats is scored as three, one-
two times per week is scored as one, three to five times per week is one and more than six times
per week is zero. The scale includes frequencies for eleven foods and two cooking methods. The
range of score possibilities is 0 to 37 for which, as with overall E-KINDEX, higher scores are
associated with decreased likelihood of having or developing the diagnosis of OW/OB. Lower
scores on this measure of dietary quality indicates healthier food and cooking method choices.
The items and scores for Dietary Quality E-KINDEX are listed (Table 3).
Dietary Quality, subscale 1, the Lazarou study was the weakest in discriminative ability
of the three subscales [Area Under the Curve (AUC) = 54.0], contributing the least to the overall
predictive validity of overall E-KINDEX for OW/OB versus normal weight. Lazarou and
colleagues found scores between 27 of 37 possible with Sensitivity of 82.03 and Specificity of
24.92 (p. 107).

31
Table 3
Dietary Quality E-KINDEX (Subscale 1)
Consumption
frequency
Never
1 to 2 times
per week
3 to 5 times
per week
More than
6 times
per week
Range
Bread
0 1 1 3 0 to 3
Cereals and
grains other
than bread
0 1 2 2 0 to 2
Fruits (whole,
juice)
0 1 2 3 0 to 3
Vegetables
0 1 2 3 0 to 3
Legumes
(beans, peas,
nuts)
0 1 3 3 0 to 3
Milk
0 1 2 3 0 to 3
Fish, seafood
0 3 3 2 0 to 3
Meat
1 3 2 1 0 to 3
Salted, smoked
meats
3 1 1 0 0 to 3
Sweets, junk
food
3 2 1 0 0 to 2
Soft drinks
3 3 1 0 0 to 3
Fried food
2 3 1 0 0 to 3
Grilled food
0 3 3 2 0 to 3
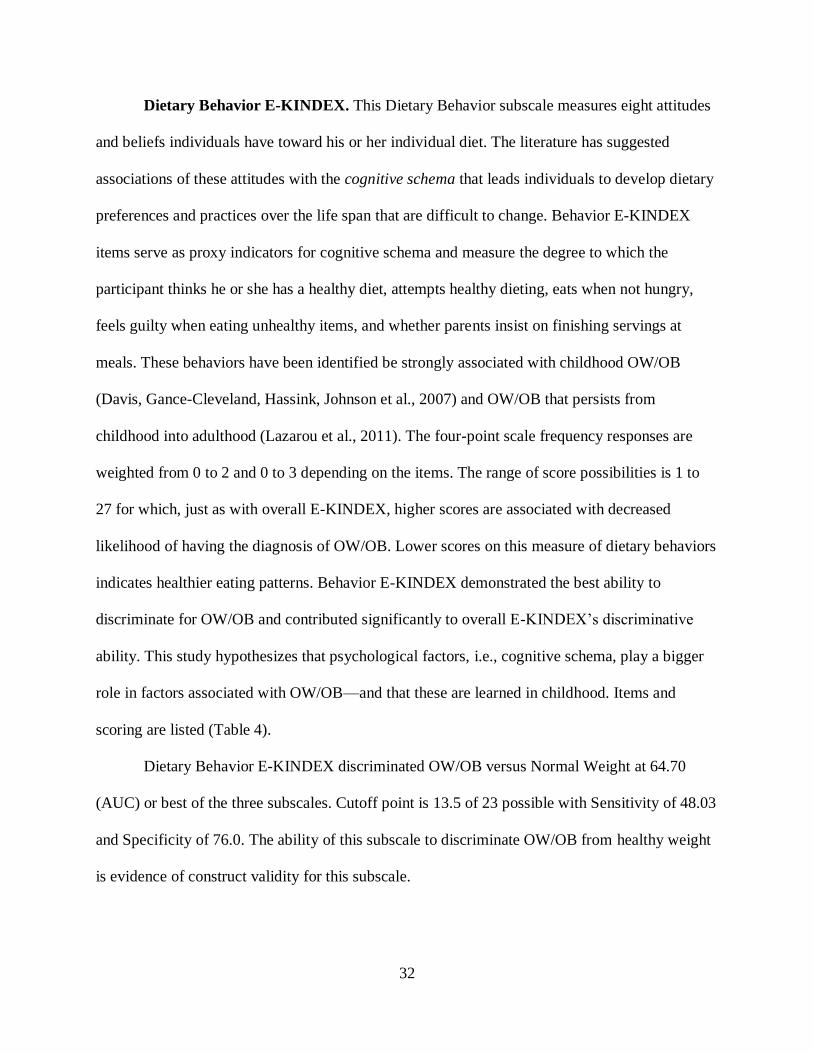
32
Dietary Behavior E-KINDEX. This Dietary Behavior subscale measures eight attitudes
and beliefs individuals have toward his or her individual diet. The literature has suggested
associations of these attitudes with the cognitive schema that leads individuals to develop dietary
preferences and practices over the life span that are difficult to change. Behavior E-KINDEX
items serve as proxy indicators for cognitive schema and measure the degree to which the
participant thinks he or she has a healthy diet, attempts healthy dieting, eats when not hungry,
feels guilty when eating unhealthy items, and whether parents insist on finishing servings at
meals. These behaviors have been identified be strongly associated with childhood OW/OB
(Davis, Gance-Cleveland, Hassink, Johnson et al., 2007) and OW/OB that persists from
childhood into adulthood (Lazarou et al., 2011). The four-point scale frequency responses are
weighted from 0 to 2 and 0 to 3 depending on the items. The range of score possibilities is 1 to
27 for which, just as with overall E-KINDEX, higher scores are associated with decreased
likelihood of having the diagnosis of OW/OB. Lower scores on this measure of dietary behaviors
indicates healthier eating patterns. Behavior E-KINDEX demonstrated the best ability to
discriminate for OW/OB and contributed significantly to overall E-KINDEX’s discriminative
ability. This study hypothesizes that psychological factors, i.e., cognitive schema, play a bigger
role in factors associated with OW/OB—and that these are learned in childhood. Items and
scoring are listed (Table 4).
Dietary Behavior E-KINDEX discriminated OW/OB versus Normal Weight at 64.70
(AUC) or best of the three subscales. Cutoff point is 13.5 of 23 possible with Sensitivity of 48.03
and Specificity of 76.0. The ability of this subscale to discriminate OW/OB from healthy weight
is evidence of construct validity for this subscale.
33
Table 4
Dietary Behavior E-KINDEX (Subscale 2)
Degree to which: Never Sometimes Much Very much Range
I think my diet is
healthy
0 1 2 2 0 to 2
I think my weight is
above normal
3 2 1 0 0 to 3
I have tried to be on
a diet
3 2 1 0 0 to 3
I feel guilty when I
eat something
unhealthy
3 2 1 0 0 to 3
I feel guilty when I
eat something I
know is fattening
3 1 1 0 0 to 3
My parents insist I
eat all my food
0 1 2 3 0 to 3
I eat things I know
are fattening
3 2 0 0 0 to 3
I eat something I
like when I am not
hungry
3 2 1 1 1 to 3
Dietary Habits E-KINDEX. The third subscale contains nine items that measure meal
patterns and dietary practices of the individual. Items include frequencies of: eating breakfast,
eating in fast food restaurants, eating home prepared foods, eating “unfavorite” foods considered
healthy, eating alone, snacking, and eating foods because of advertising. Several studies have
associated these nine dietary practices with OW/OB (Barlow, 2007; Gidding, Dennison, Birch,
Daniels et al., 2006; Manios, Kourlaba, Grammatikaki, Koubitski, Siatista, Vandourou et al.,

34
2010). This subscale has six distinct sections, some of which include both monotonic and non-
monotonic functions ranging from zero to three and one to three. Non-monotonic functions were
needed to account for food items that dietary guidelines recommend as moderate rather than
never, such as breads, fried foods, meats, and sweets (Table 5).
Table 5
Dietary Habits E-KINDEX (Subscale 3)
Habits
frequencies
Almost daily 2 to 4 times
per week
Once
per week
1 to 3 times
per month
Range
Having
breakfast 3 2 1 0 0 to 3
Eating least
favorite healthy
food
3 2 2 0 0 to 3
Eating with
family 3 2 1 0 0 to 3
Eating alone 0 2 2 3 0 to 3
Eating cafeteria
snacks 0 1 * 3 0 to 3
Fast foods past
2 days Never = 3 1 time = 2 2 or more
times = 0 * 0 to 3
Meals + snacks
per day 2 to 3 = 0 4 to 5 = 3 More than 6
= 3 * 0 to 3
Eating foods as
advertised Yes = 0 No = 3 * * 0 to 3
Eating foods
prepared at
home
Yes = 3 No = 0 * * 0 to 3
35
Responses are weighted on the scale to reflect healthy or unhealthy frequencies in the same
manner as the other subscales. Results for the subscale Dietary Habits discriminated OW/OB
versus healthy weight at 61.10 (AUC) or second best of the 3 subscales, contributing to the
discriminative ability of overall E-KINDEX for OW/OB versus healthy weight. The cutoff point
is 19.5 of 27 possible with Sensitivity of 61.54 and Specificity of 57.55. The ability of Dietary
Habits E-KINDEX to discriminate independently as well as contribute strongly to overall
E-KINDEX’s discriminative ability is further evidence for construct validity of this subscale.
Physical Activity Levels
The International Physical Activity Questionnaire (IPAQ) is a 7-item questionnaire that
estimates frequency, intensity, and duration of physical activities over the last 7 days
(Hagströmer, Oja, & Sjöström, 2006). Scores on IPAQ result in categorical levels of physical
activity for the individual: 1 indicates low level or little regular physical activity; 2 indicates
moderate level or 5 or more days per week of 30 minutes of moderate-intensity activity; 3
indicates a high-level physical activity with 7 or more days of combination of moderate or
vigorous-intensity activities OR 3 days of vigorous-intensity activities accumulating at least
1,500 MET-minutes per week (Appendix K).
Validity and reliability. There are few validated Physical Activity Indices (PAIs),
measures of physical activity in children, found in the literature for children in the United States
or elsewhere. During 2000, 14 centers from 12 countries who use the IPAQ examined the
validity and reliability of the short form and found repeated measures with Spearman’s rho of 0.8
(Craig, Marshall, Sjöström, Bauman et al., 2003). These authors assessed criterion validity
against accelerometer over 7 days and found p = 0.30, acceptable, similar self-report measures
(p. 1381).

36
Screen Time
Participants were questioned on the number of hours per day they were sitting in front of
a computer or television screen or screen time. Excess screen time of more than two hours per
day is associated with higher diagnoses OW/OB, as sedentary behaviors preclude healthy
activity levels (Loucaides, Jago, & Theophanous, 2011; Lazarou, 2011). The odds ratio was 2.84
for the association of more than two hours per day of TV viewing and BMI in girls; TV viewing
was the most significant factor in all obesity models for girls and boys: Odds ratios were 1.33
and 3.63 for boys and girls for % Body Fat; 2.15 and 3.25 for boys and girls Waist
Circumference, and 2.26 and 2.23 for boys and girls for Total and Abdominal Obesity. Results of
the backward logistic regression procedures suggest that the most important factors associated
with OW/OB measures across genders are TV and DVD watching. Screen time assessment is
included as part of the International Physical Activity Questionnaire but scored separately where
number of hours of screen time equals the score; screen time greater than two hours per day is
considered excessive and associated with development of OW/OB (Ihmels, Welk, Eiseman, &
Nusser et al., 2009; Lazarou & Soteriades, 2010). (Appendix L).
Impact of Weight on Quality of Life in Kids (IWQOL-Kids)
IWQOL-Kids is used as a measure of quality of life perceptions. Disease burden for
children and adolescents with comorbidities of OW/OB has not been studied to a great extent, as
OW/OB itself in the young has been examined only for the past decade or so. IWQOL-Kids is a
27-item questionnaire that measures quality of life specific to OW/OB in domains of Physical
Comfort, Body Esteem, Social Life, and Family Relations (Nadeau, Kolotkin, Boex, Witten et
al., 2010; Zeller & Modi, 2010). Quality of life for adults with diseases has been well-

37
documented in the literature as has quality of life for the severely obese youth (Schwimmer,
Burwinkle, & Varni 2003; Nadeau et al., 2011; Kolotkin et al., 2006).
IWQOL-Kids, which provides a total score and individual scores on four domains of
Physical Comfort, Body Esteem, Social Life, and Family Relations, was administered to 111
participants and their parents or caregivers. The design is targeted to children and adolescents
age 9 to 18, and each item is queried “Because of my weight…” the following is true: ranged
from 0 to 4, for a total of 5 possible responses. The higher the score, the higher is the
participant’s perception of their quality of life (Appendix F).
Validity and reliability. IWQOL-Kids has four domains, and total scores were
correlated with both BMI and BMI z-scores for all children (Kolotkin , Zeller, Avani, & Modi,
2006). Mean scores for both parents/caregivers and children ranged from 62.2 +/- 26.1 standard
deviations to 91.4 +/-13.8 standard deviations. In four of five IWQOL-Kids domains in a sample
of 642 children, BMIs were inversely and strongly related: Physical Comfort: (r = -0.51; p <
0.001); Social Life: (r = -0.48; p < 0.01), Body Esteem: (r = -0.51; p < 0.01), and weakly related
in Family Relations: (r = -0.25; p < 0.01). Despite the weak correlation in the Family Relations
domain, total score correlation of IWQOL-Kids with BMI was significant [(r = -0.54; p < 0.001),
(p. 452)].
Body Mass Index
Body Mass Index was calculated for parents utilizing self-reported data, height and
weight. The National Institutes of Health (2010) defined OW as BMI greater than or equal to 25
kg/m2 and OB as BMI greater than or equal to 30 kg/m2. Obesity is widely recognized as
measurable by these numbers and further includes children, as outlined by the International Task
Force on Obesity based on age and gender-specified BMI (Heymsfield, Lohman, Wang, &
38
Going, 2005; Cole, Bellizzi, Flegal, & Dietz, 2000; Lazarou et al., 2010). BMI is widely
accepted as the gold standard for defining OW/OB internationally (NIH, 2010). The outcome
variable, OW/OB, was quantified with the CDC Growth Charts BMI for age and gender for boys
age 2 to 20, and for girls age 2 to 20 (BMI AG2). The Centers for Disease Control has developed
a classification system for children that is based on BMI for age and gender, recognizing
developmental variabilities across gender and age, and may be plotted on a chart resulting in
recommended percentiles for boys and girls age two to twenty respectively (CDC, 2010) and was
the basis for estimating OW/OB in children in this study. Children whose age and gender-
adjusted BMI are greater than 5% but less than 85% on the chart are considered of normal
healthy weight; those who are 85% or greater but less than 95% are considered overweight
(OW); those who are 95% or greater are considered obese (Appendix A).
Procedures
Approvals
Approvals were required from both the manager of the clinic that was the setting, and the
Institutional Review Board which is charged with ethical oversight for the patients who are seen
in the clinic. Dr. Denise Edwards is the director of The University of South Florida Medical
Pediatric Clinic, the setting for this study. She was contacted more than one year prior in
anticipation of the research and provided a letter of support for this study (Appendix M).
Expedited Institutional Review Board (IRB) approval was sought and obtained to
commence the study at the Pediatric and Healthy Weight Clinics at the University of South
Florida. Fifty parent-child dyads agreed to participate in the study. Because the target population
for the study was pediatric, the study was explained to both the patients to obtain assent and to

39
their parents to obtain consent. Since some data was obtained from the Electronic Health Record,
HIPPA language was contained in the consent form (Appendix N).
Data Collection
Demographic data for the study were collected by an interview with the parent(s) and
documented on a Demographic Questionnaire (Appendix G), identified by the dyad number.
Data were collected on this form to provide a description of the characteristics of the sample.
Parents and their children were queried whether they resided in the city or a rural area, BMI
status for each parent, SES status by proxy of insurance status (private insurance proxy for high
SES; Medicaid or no insurance proxy for low SES), and whether parents felt their dietary habits
were average, good, very good, or needs improvement.
E-KINDEX, IPAQ, and IWQOL-Kids questionnaires were completed by the child in
privacy in the presence of his or her parent(s) and the researcher. All questionnaires were
completed within 15 to 30 minutes. All children and their parents who initially consented and
assented to the study completed the study. Children who completed the questionnaires were
given a $10.00 Target gift card upon completion of participation.
Data Analysis
Analyses of the data were driven by the three aims of the study. Statistical Package for
the Social Sciences (SPSS) software was used to analyze and present means and standard
deviations of the sample characteristics. Characteristics included age, gender, and socioeconomic
status by proxy of having private insurance. Med-Calc statistical software was used to illustrate
the ROC curve analysis of sensitivity and specificity values of elements of E-KINDEX and its
subscales, as well as 95% confidence intervals. ROC curve analysis was completed software to
determine the ability of the index to discriminate between OW, OB, and lean weight. Preparation
40
of the data prior to analysis is critical to the rigor of any study. The PI collected raw data from 50
parent-child dyads on 94 variables, and they were entered into the Statistical Software Package
for Social Sciences (SPSS) was also used for Cronbach’s alpha, regression, and factor analyses.
Data were screened for accuracy, missing values, and outliers prior to analyses.
Aim One
The first aim was to evaluate the predictive validity of E-KINDEX: To what extent does
E-KINDEX overall score and each E-KINDEX subscale predict diagnosis of OW/OB in
individuals from a child and adolescent sample in Tampa, Florida?
Hypothesis 1. There is an inverse relationship (> 0.60) between overall E-KINDEX score
and diagnosis of OW/OB.
Hypothesis 2. There is an inverse relationship between each subscale and the overall
E-KINDEX scores.
Construct validity was assessed by calculating the Pearson product-moment correlation
between BMI scores and E-KINDEX total scores. Those with E-KINDEX total >60 were 85%
less likely to fall into either the OW or OB category. Subscale scores were individually
correlated for strength of each of those categorical relationships to Growth Percentile (BMI for
stature and gender, girls and boys age 2 to 20, (per CDC) scores. The second hypothesis also
required a Pearson correlation.
Aim Two
The second aim was to estimate the reliability of E-KINDEX scales to measure the
elements of the obesogenic environment and resultant prediction of OW/OB in a pediatric
sample in Tampa, Florida.

41
Hypothesis 3. Internal consistency of the three subscales is acceptable as evidenced by
Cronbach’s alpha between 0.60 and 0.80.
Aim Three
The third and final aim was to measure quality of life for those who are OW/OB as
evidenced by impact of weight on quality of life in children’s (IWQOL-Kids) scores.
Hypothesis 4. A strong correlation between E-KINDEX total score and IWQOL-Kids
exists. A moderate to strong correlation of OW/OB with quality of life perceptions in youth has
been shown in earlier studies (Hullman et al., 2011; Jensen & Steele, 2010; Kolotkin et al.,
2006). The relationship was supported earlier in adult populations (Katz, McHorney, &
Atkinson, 2000; Skevington and McRate, 2010). Much evidence has been disseminated relating
the relationship of eating patterns, psychological behaviors, and perceptions of QOL in youth
(Hullman et al., 2011). More evidence is needed in an effort to begin to tailor interventions based
on psychological and dietary eating behaviors (Meule & Vögele, 2013; Nadeau, 2011).
Descriptive Statistics
SPSS was used to create a histogram to depict normality and absence of skewness and
kurtosis of E-KINDEX overall score distribution. The same analyses were performed on the
subscales individually. Means, standard deviations, coefficients of correlations, and ranges are
reported.
Pearson Product Moment Correlation Coefficient (r)
Pearson r correlations were measured in SPSS to verify hypothesis a that E-KINDEX
scores correlate inversely with excess weight and answer the research question: Do individuals
with lower E-KINDEX scores have a higher risk for developing OW/OB? These data met the

42
assumptions of interval or ratio level, linearity, absence of significant outliers, and normality,
and were eligible for analysis using Pearson’s product moment correlation (r).
Cronbach’s Alpha
Internal consistency of the index was assessed with Cronbach’s alpha to estimate
reliability of items with their scales and overall. Level of significance for reported p values was
set at p < 0.05.
Analysis of Variance
Analysis of Variance (ANOVA) was used to measure associations between normally
distributed continuous variables. Statistical Package for Social Sciences (SPSS) software was
used to calculate the strength of the associations between individual E-KINDEX total score and
each of the subscale scores, each of these with OW/OB status, and weight status (lean and
OW/OB) with quality of life perceptions. The Bonferroni procedure was used to correct for Type
I error that can occur from multiple comparisons, and the Kruskal-Wallis procedure was used for
continuous variables that do not have normal distribution.
Multiple Linear Regression
Linear regression analyses were conducted to examine the strength of the relationships
between E-KINDEX overall and subscale scores, as well as BMI, physical activity levels,
parental weight status, and impact of weight on quality of life.
Receiver Operating Characteristics (ROC) Curve
A ROC curve analysis is often used to calculate sensitivity and specificity levels in
combination to estimate the diagnostic accuracy of measurement instruments, indices, and tools.
(Pepe, Janes, Longton, Leisenring, et al., 2004). ROC analysis was used to pursue Aim 1,
determination of the predictive validity of E-KINDEX. Cutoff-point analysis was determined by

43
examination of the area under the curve (AUC) for the score that exhibited the greatest
sensitivity (accurate identification of a case) and specificity (accurate identification of a non-
case). The optimum cutoff point was at or near the ‘shoulder’ of the ROC curve. This study also
performed cutoff-point analysis to determine the optimal value for E-KINDEX. Multiple
regression analysis was used to determine the strength of the associations of the scores with
OW/OB status, parental OW/OB status, physical activity levels, SES, screen time, and quality of
life perceptions in the sample.
Missing Data
A univariate Missing Values Analysis (MVA) was conducted in SPSS on all quantitative
and nominal variables. SPSS reported that no variables had less than 5% missing values so t-test
was not performed. Output data are not shown.
Outliers
Distribution of normality of scores was verified in SPSS by inspection of normal and
detrended normal P-P plots for each of the subscales and total IWQOL-Kids. A histogram can be
found in Chapter Four, Figure 4. Outliers detection results found two outside scores for cases 37
and 38; inspection of overall data in these cases revealed these are low overall E-KINDEX
scores that do not contain missing data, do not affect assumptions, and do not affect the results as
indicated by regression graphs. All data were entered, verified, and subsequently analyzed using
SPSS or Med-Calc, computerized statistical software packages. The results of these analyses are
presented in Chapter Four.
44
CHAPTER FOUR:
RESULTS
Chapter Four presents results from the analyses conducted. These include comparison of
means and standard deviations sample characteristics, satisfaction of assumptions for regression
and factor analyses, calculation of Cronbach’s alpha statistic, and Receiver Operating
Characteristics curve analysis. Statistical Software for the Social Sciences (SPSS) and Med-Calc
software were used for the analyses.
Data Screening
As participants completed their questionnaires, the primary investigator scanned them
quickly to avoid missing data. These data were checked for accuracy of entry a second time as
each data point was entered into SPSS and Med-Calc statistical software. When data entry for all
50 cases were complete, the data analysis began.
Missing Data
A univariate Missing Values Analysis (MVA) was conducted in SPSS on all quantitative
and nominal variables. SPSS reported that no variables had more than 5% missing values so t-
test was not performed. Output data are not shown. Distribution of normality of scores was
verified in SPSS by inspection of normal and detrended normal P-P plots for each of the
subscales and total IWQOL-Kids. A histogram presents this distribution (Figure 4). Outliers
detection results found two outside scores for cases 37 and 38. Inspection of overall data in these

45
cases revealed these are low overall E-KINDEX scores that do not contain missing data, do not
affect assumptions, and do not affect the results as indicated by regression graphs. These cases
were therefore retained for the analysis (Table 6).
Figure 4. Distribution of E-KINDEX Scores
Characteristics of the Sample
A total of 63 child-parent dyads who met inclusion criteria were invited to participate
during scheduled appointments with providers at the Medical Pediatric Clinic in Tampa, Florida.
A total of 50 parent-child dyads consented and assented to participate in the validation of the
E-KINDEX and associations with quality of life perceptions for the study. Mean age of the
children was 13.7; the sample was split nearly evenly across gender. Ethnicity data were not
collected, but the primary investigator notes that the majority of participants were African-
American or Hispanic. Socioeconomic status was also split nearly evenly between high and low,

46
estimated by proxy of having private insurance. More than half of the sample identified as living
in the city while slightly fewer than half identified as living in rural areas. Nearly half, (44%) of
parents (n = 100), described their family eating habits as “needs improvement” (n = 22), while
only 6% of the parent group of (n = 100 parents) self-reported anthropometric data indicating
healthy weight. Many more parents in the sample described themselves as OW/OB as verified by
their self-reported height and weight, and of these 100 parents, only 3 pairs reported themselves
as lean. The sample of children was nearly half lean and half OW/OB, but more than 90% of
parents of these children were OW/OB. (Table 6).
Table 6
E-KINDEX in Relation to Sample (n = 50 dyads)
Mean (SD) Frequency Percent
Gender
Girls 26 52
Boys
24 48
Age
13.70 (2.4) 50
Obesity Status
Normal Weight 57.09 (7.49) 21 42
Overweight 46.75 (5.96) 4 8
Obese
52.12 (6.26) 25 50
Low SES 53.60 (6.70) 25 50
High SES
Physical Activity (IPAQ)
53.96 (7.24) 25 50
Low 52.8 (7.49) 5 10
Moderate 50.11 (6.52) 17 34
High 56.17 (6.20) 28 56
(continued)

47
Table 6 E-KINDEX in Relation to Sample (n = 50 dyads) (continued)
Mean (SD) Frequency Percent
Screen time
Low 57.44 (9.4) 9 18
High
52.97 (6.08) 41 82
Parental Weights
Both OW/OB 52.86 (5.82) 38 72
One OW/OB 55.11 (9.86) 9 18
Both lean
61.33 (6.65) 3 6
Family Dietary Habits
Needs improvement 50.73 (6.02) 22 44
Average 55.92 (6.26) 14 28
Good 49.70 (7.91) 10 20
Very good 58.50 (7.72) 4 8
Aims
Analyses of the data were carried out to achieve the aims of the study and to accept or
reject the alternate hypotheses. The aims of the study were to estimate the predictive ability of
E-KINDEX to identify OW/OB diagnoses in the sample, estimate the reliability of E-KINDEX
to measure the elements of the Obesogenic Environment that combine in the scale to be
predictive, and to estimate the association of OW/OB and quality of life in the sample. It was
hypothesized that an inverse statistically significant correlation would be found between
E-KINDEX scores as a measure of the obesogenic environment and the diagnosis of OW/OB in
the pediatric sample.

48
Relationship of OW/OB to E-KINDEX Scores
The first hypothesis predicted a moderate correlation would be found between
E-KINDEX overall scores and each of the subscales in order to estimate the validity of these
scales to predict risk for OW/OB and diagnosis of OW/OB in a pediatric sample in Tampa,
Florida. Pearson product-moment correlation was used to address this hypothesis. Assumptions
needed for Pearson calculations include using data that is interval or ratio level measurement,
linear, normally distributed, and has no outliers Tabachnick & Fidell (2007). Normality for the
variables E-KINDEX and OW/OB was analyzed in SPSS (Table 7). Outputs produced from the
FREQUENCIES EXPLORE PLOTS P-P HISTOGRAM commands in SPSS were examined for
normality of distribution, skewness and kurtosis of each variable; transformation was not
indicated by the results from these analyses.
Table 7
Correlations: OW/OB with E-KINDEX and Subscales
OW/OB
Attitudes
E-KINDEX
Habits
E-KINDEX
Food Quality
E-KINDEX
E-KINDEX
Overall
Pearson
Correlations
OW/OB 1.000 -.593*** -.033 -.041 -.340**
Attitudes EK -.593*** 1.000 -.027 -.295 .355**
Habits EK -.033 -.027 1.000 .200 .656**
Quality EK -.041 -.295 .200 1.000 .635***
EK Overall -.340** .355** .656** .635*** 1.000
Note. n = 50 for all correlations. * = p <.05; ** = p <.01; *** p < .001
The range of scores in the sample was 37 to 72 with a mean of 53.78. The distribution of
E-KINDEX scores was symmetrical (Figure 4).

49
Validity
After satisfaction of assumptions, Pearson product moment correlation analyses were
calculated to determine the relationships between E-KINDEX overall scores and diagnosis of
OW/OB. These same calculations were made for each of the E-KINDEX subscale scores:
Dietary Quality, Dietary Attitudes, and Dietary Habits. (Table 7). An inverse correlation between
E-KINDEX overall and diagnosis of OW/OB (BMI AG2) was found, which was statistically
significant (r = -.340, n = 50, p = .008). There was no correlation between Dietary Habits (Habits
EK) and diagnosis of OW/OB (BMI AG2), (r = .033, n = 50, p = .089). Results -for correlation
of Dietary Quality (Quality EK) and diagnosis of OW/OB (BMI AG2) were similar, no
correlation was found (r = .04, n = 50, p = .389). There was an inverse correlation between
Dietary Behavior and Attitudes (ATT EK) and diagnosis of OW/OB (BMI AG2), which was
statistically significant (r = -.593, n = 50, p = <.001).
Reliability
The second aim of this study was to estimate the reliability of E-KINDEX scales to
measure the elements of the obesogenic environment and resultant risk for development of
OW/OB in the pediatric sample. Each of the subscales of E-KINDEX was expected to result in
lower because they are short: Dietary Quality E-KINDEX, Dietary Behaviors E-KINDEX, and
Dietary Habits E-KINDEX contain 13, 8, and 9 items respectively. Scales were tested for
internal consistency by performing Cronbach’s alpha analysis ( ) on the items in the total scale
and for each subscale and its total independently. Cronbach’s alpha for Dietary Quality
E-KINDEX was found to be acceptable ( = .65). Cronbach’s alpha for Dietary Behaviors
E-KINDEX, cognitive schema and attitudes that influence developmental dietary practices, was
found to be acceptable, ( = .703). Cronbach’s alpha for Dietary Habits E-KINDEX, indicators

50
of dietary habits and practices, was found to be acceptable ( = .643). Cronbach’s alpha for
Overall E-KINDEX, the composite score of the three subscales that comprise the indicators of
the obesogenic environment was found to be acceptable ( = .683). The results of the analyses
are summarized (Table 8).
Table 8
Cronbach’s for Standardized Items for Overall E-KINDEX and Subscales
Cronbach’s
Cronbach’s on
standardized items
Items
Dietary Quality
E-KINDEX
.653
.590
13
Dietary
Behaviors/Attitudes
E-KINDEX
.703
.735
9
Dietary Habits
E-KINDEX
.643
.622
8
E-KINDEX
Overall Score
.683
.597
30
Factor Analysis
Principle components factor analysis with Varimax rotation was performed on the 30-
item E-KINDEX overall through SPSS, even though sample size (n is 50) provides insufficient
power to determine effects. Initial extraction revealed that 10 items contributed to 73.25% of
shared variance. Items contributing most to the variance include feeling ‘guilty when eating
something fattening’, ‘guilty when eating something unhealthy’, reported having ‘dieted’, not
having ‘eaten something I don’t like because it is healthy’, frequency of ‘eaten fattening’ foods,
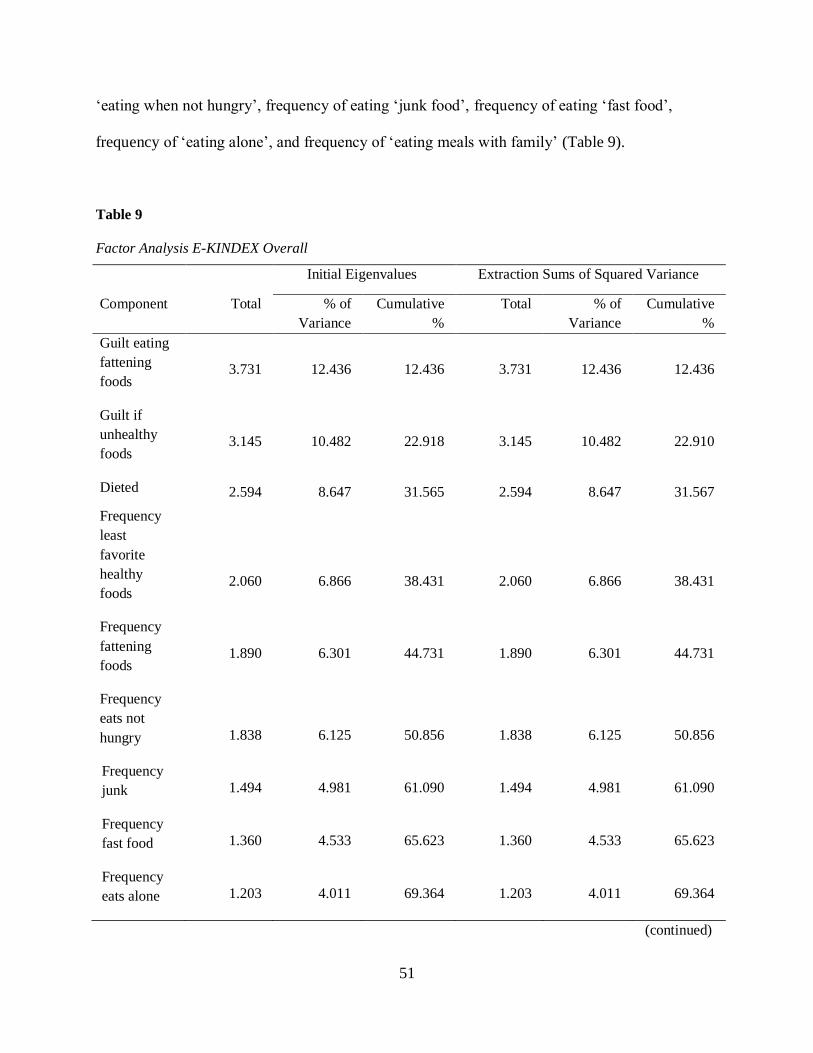
51
‘eating when not hungry’, frequency of eating ‘junk food’, frequency of eating ‘fast food’,
frequency of ‘eating alone’, and frequency of ‘eating meals with family’ (Table 9).
Table 9
Factor Analysis E-KINDEX Overall
Initial Eigenvalues Extraction Sums of Squared Variance
Component Total % of
Variance
Cumulative
%
Total % of
Variance
Cumulative
%
Guilt eating
fattening
foods
3.731 12.436 12.436 3.731 12.436 12.436
Guilt if
unhealthy
foods
3.145 10.482 22.918 3.145 10.482 22.910
Dieted 2.594 8.647 31.565 2.594 8.647 31.567
Frequency
least
favorite
healthy
foods
2.060
6.866
38.431
2.060
6.866
38.431
Frequency
fattening
foods
1.890 6.301 44.731 1.890 6.301 44.731
Frequency
eats not
hungry
1.838
6.125
50.856
1.838
6.125
50.856
Frequency
junk
1.494 4.981 61.090 1.494 4.981 61.090
Frequency
fast food
1.360 4.533 65.623 1.360 4.533 65.623
Frequency
eats alone
1.203 4.011 69.364 1.203 4.011 69.364
(continued)

52
Table 9 Factor analysis E-KINDEX overall (continued)
Initial Eigenvalues Extraction Sums of Squared Variance
Component Total % of
Variance
Cumulative
%
Total % of
Variance
Cumulative
%
Frequency
eats
w/family
1.085 3.615 73.249 1.085 3.615 73.249
Frequency
meals +
snacks/day
.973
3.244
76.493
Frequency
grains
.932 3.106 75.599
Frequency
fruit
.833 2.776 82.375
Frequency
fish
.756 2.519 84.894
Frequency
grilled
.654 2.182 87.076
Frequency
legumes
.593 1.975 89.051
Frequency
fried
.550 1.833 90.884
Think weight
high
.448 1.494 92.378
Eat foods
advertised
.434 1.448 93.826
Clean plate .322 1.072 92.898
Feel diet
healthy
.292 .972 95.870
Frequency
dairy
.253 .844 96.714
(continued)

53
Table 9 Factor analysis E-KINDEX overall (continued)
Initial Eigenvalues Extraction Sums of Squared Variance
Component Total % of
Variance
Cumulative
%
Total % of
Variance
Cumulative
%
Feel diet
healthy
.292 .972 95.870
Frequency
vegetables
.243 .810 97.523
Frequency
home
prepared
.195 .649 98.172
Frequency
deli meats
.169 .562 98.735
Frequency
school
snacks
.126 .420 99.155
Frequency
soda
.112 .373 99.527
Frequency
breakfast
.085 .283 99.810
Frequency
meat
.057 .190 100.000
A 3-factor analysis was conducted to estimate factor loadings of the three subscales of
E-KINDEX. The results indicate that 8 of 13 items in the Dietary Quality, subscale 1, loaded on
Factor 1. Five of 8 items from the Dietary Behaviors (Attitudes) scale stayed with Factor 2, while
some of the Dietary Quality items also loaded to Factor 2—namely frequency of consuming fish,
soda, deli meats and legumes. These loadings ranged from -.37 to 0.47. The item ‘eats least
favorite food because it is healthy’, an item that seems to fit in the Attitudes subscale, had a
loading of .47. Seven of 9 of subscale 3 items, Dietary Habits (practices), loaded to Factor 3.
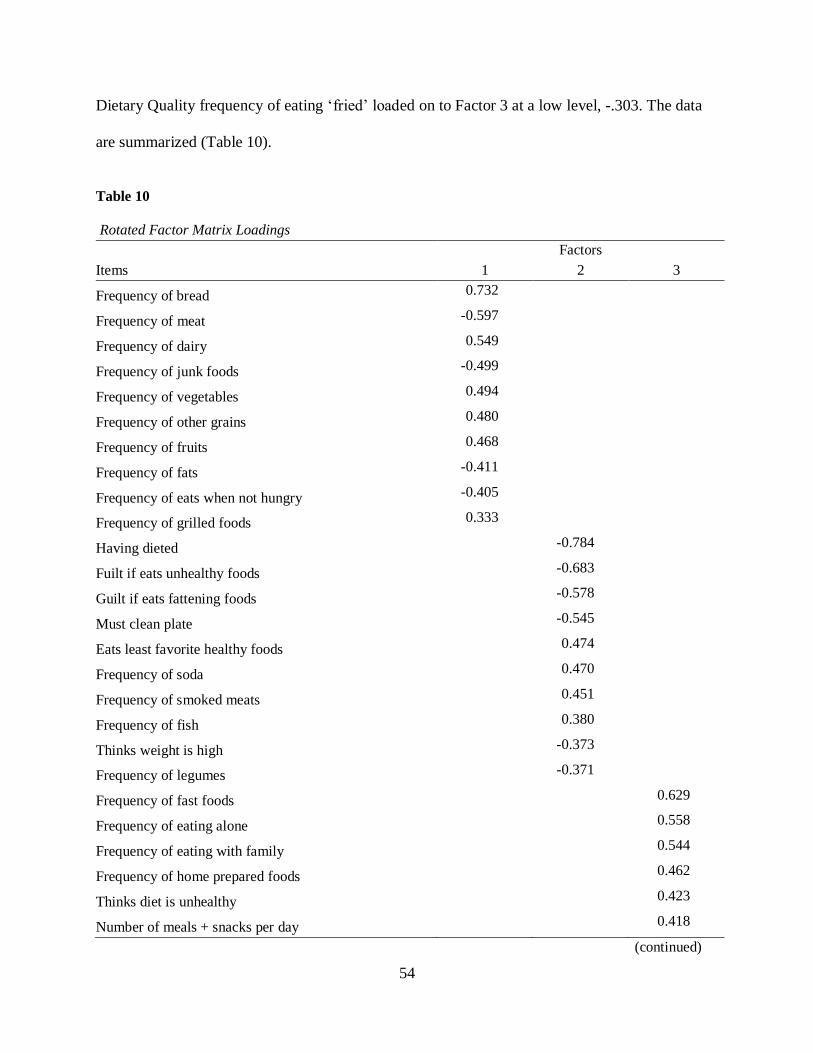
54
Dietary Quality frequency of eating ‘fried’ loaded on to Factor 3 at a low level, -.303. The data
are summarized (Table 10).
Table 10
Rotated Factor Matrix Loadings
Items
Factors
1 2 3
Frequency of bread 0.732
Frequency of meat -0.597
Frequency of dairy 0.549
Frequency of junk foods -0.499
Frequency of vegetables 0.494
Frequency of other grains 0.480
Frequency of fruits 0.468
Frequency of fats -0.411
Frequency of eats when not hungry -0.405
Frequency of grilled foods 0.333
Having dieted -0.784
Fuilt if eats unhealthy foods -0.683
Guilt if eats fattening foods -0.578
Must clean plate -0.545
Eats least favorite healthy foods 0.474
Frequency of soda 0.470
Frequency of smoked meats 0.451
Frequency of fish 0.380
Thinks weight is high -0.373
Frequency of legumes -0.371
Frequency of fast foods 0.629
Frequency of eating alone 0.558
Frequency of eating with family 0.544
Frequency of home prepared foods 0.462
Thinks diet is unhealthy 0.423
Number of meals + snacks per day 0.418
(continued)

55
Table 10 Rotated Factor Matrix Loadings (continued)
Frequency of fried foods -0.303
Frequency of school snacks
Eats foods that are advertised
Frequency of having breakfast
Note. Extraction Method: Principal Component Analysis, Varimax rotation. Values < .30 not shown.
The subscale structure is confirmed with the analysis, contributing to evidence of validity of the
scale.
Moderators and Covariates
As a further assessment of E-KINDEX validity, moderating variables of physical activity,
screen time, and parental weight status were measured. Physical activity levels as measured with
IPAQ scores were correlated with E-KINDEX (r = .315, n = 50, p = .026). OW/OB also was
significantly related to physical activity (r = -.320, n = 50, p = .023). Covariates including age,
gender and SES did not affect the analyses as illustrated earlier in sample characteristics (Table 11).
Table 11
Moderator and Covariate Correlations with EKINDEX and BMIAG2 (OW/OB)
EKINDEX
Overall
Parent
Weights
BMIAG2
(OW/OB) Gender Age SES
Pearson Correlations
EKINDEX
Overall
1
.292*
-.340*
.074
-.268
.026
Parent Weights
.292*
1
-.142
.293*
-.152
.035
BMIAG2 (OW/OB)
-.340* -.142 1 .027 .129 -.111
(continued)
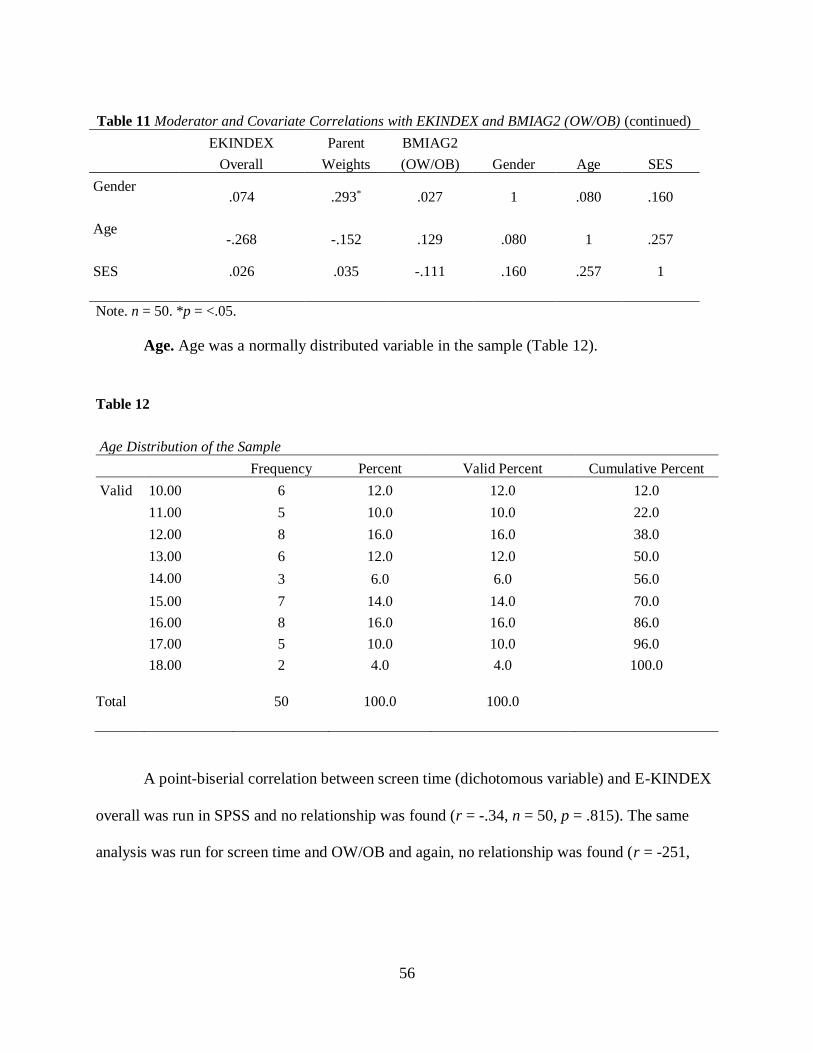
56
Note. n = 50. *p = <.05.
Age. Age was a normally distributed variable in the sample (Table 12).
Table 12
Age Distribution of the Sample
Frequency Percent Valid Percent Cumulative Percent
Valid 10.00 6 12.0 12.0 12.0
11.00 5 10.0 10.0 22.0
12.00 8 16.0 16.0 38.0
13.00 6 12.0 12.0 50.0
14.00 3 6.0 6.0 56.0
15.00 7 14.0 14.0 70.0
16.00 8 16.0 16.0 86.0
17.00 5 10.0 10.0 96.0
18.00 2 4.0 4.0 100.0
Total
50 100.0
100.0
A point-biserial correlation between screen time (dichotomous variable) and E-KINDEX
overall was run in SPSS and no relationship was found (r = -.34, n = 50, p = .815). The same
analysis was run for screen time and OW/OB and again, no relationship was found (r = -251,
Table 11 Moderator and Covariate Correlations with EKINDEX and BMIAG2 (OW/OB) (continued)
EKINDEX
Overall
Parent
Weights
BMIAG2
(OW/OB) Gender Age SES
Gender
.074 .293* .027 1 .080 .160
Age
-.268 -.152 .129 .080 1 .257
SES
.026 .035 -.111 .160 .257 1

57
n = 50, p = .079). Parental weight status correlated with EKINDEX overall score (r = .292,
n = 50, p = .040). but not with OW/OB (r = -.142, n = 50, p = .326).
Parental Weight Status
Because parents, and families in general, contribute integral elements of the obesogenic
environment in which they all live, parental weight status is important to any discussion of
healthy or unhealthy weight status. In order to describe whether parental weight provided
additional information to the prediction of OW/OB status in children, sequential regression
analysis in SPSS was performed to quantify the information. SPSS EXPLORE demonstrated
non-normality of the Parental Weight distribution of scores and substantial positive skewness.
The variable required logarithmic transformation prior to analysis to achieve normality. The
remainder of the variables were previously established as meeting assumptions of normality.
OW/OB was the dependent variable and the predictor variables of Parental Weight status (log
10). Overall E-KINDEX, Dietary Behavior (Attitudes) E-KINDEX, Dietary Habits E-KINDEX,
and Dietary Quality E-KINDEX were sequentially entered into the SPSS regression equation.
Table 13
Sequential Regression Model Summary (DV: BMI AG2)
Model
R
R Square
Adjusted R
Square
Standard Error of
the estimate
1
.340
.115
.097
6.178
2 .344 .118 .081 6.233
3 .613 .376 .335 5.301
4 .614 .377 .322 5.354
5
.634 .402 .335 5.303
(continued)

58
Table 13 Sequential Regression Model Summary (DV: BMI AG2) (continued)
Change Statistics
Model
R Square
Change
F Change
df 1
df2
Sig. F
Change
1 .021 6.266 1 48 .314
2 .003 .152 1 47 .699
3 .258 18.990 1 46 .000
4 .001 .086 1 45 .771
5 .025 1.867 1 44 .179
Note.
1. Predictors: (Constant), EKINDEXOVERALL
2. Predictors: (Constant), EKINDEXOVERALL LG_PRNTWTS,
3. Predictors: (Constant), EKINDEXOVERALL LG_PRNTWTS, , SS2_TOTAL
4. Predictors: (Constant), EKINDEXOVERALL LG_PRNTWTS, SS2_TOTAL, SS1_TOTAL
5. Predictors: (Constant), EKINDEXOVERALL, LG_PRNTWTS, SS2_TOTAL, SS1_TOTAL, SS3_TOTAL
The significant bivariate correlation of BMI AG2 (OW/OB) assessed at the end of step 1 finds
correlation of .34 accounting for 11.5 % of the variance. Looking further at model 1, F change is
6.266, exceeding critical F for df (1, 48). E-KINDEX overall is a predictor for BMI AG 2,
F (1, 48) = 6.266, p <.05. In step 2, parental weights are entered into the equation: The results
indicate that parental weight status does not improve R squared nor result in significant F
change. The most significant result in the sequential multiple regression analysis is the addition
to the equation of Dietary Behaviors (Attitudes) or subscale two. The addition of SS2 TOTAL to
the equation in step three results in F change value for 18.99. Critical F for df 1, 46 = 5.42.
F value of 18.99 exceeds critical F and the change is significant, F (1, 46) = 18.99, p <.0001).
Dietary Habits (Attitudes) is a significant predictor of OW/OB diagnosis. The sequential
regression analyses of addition of Dietary Quality and Dietary Habits (Practices) did not
contribute significantly to the analysis. Analyses for this study included an n of 50; a larger
sample size may have produced different results (Table 13).

59
Receiver Operating Characteristics Curve Analysis
Signal theory can assist in achieving aim two which was to estimate the ability of
E-KINDEX scales to measure the elements of the obesogenic environment and resultant
prediction of OW/OB in a pediatric sample in Tampa, Florida. Receiver Operating
Characteristics (ROC) Curve analysis was used to evaluate the predictive score for diagnosis of
OW/OB. ROC analysis was run on the three subscales and E-KINDEX overall. The area under
the curve (AUC) for E-KINDEX overall was .722 or 72% (Figure 5). Dietary Quality, Subscale
1, had the least AUC was the Dietary Quality scale at 52%, supporting other analyses that
Dietary Quality E-KINDEX, (food groups), is a less-powerful indicator of risk for OW/OB than
psychological factors. Dietary Behaviors (Attitudes) E-KINDEX had an AUC of 88%. Dietary
Habits E-KINDEX had an AUC of 60%, but asymptotic significance was .216 (Table 14).
Table 14
E-KINDEX Area Under the Curve
EKINDEX Test Result Variable(s) Area Asymptotic Sig.
Dietary Quality
(Foods)
.521 .798
Dietary Behaviors
(Attitudes)
.844 .000*
Dietary Habits
(Practices)
.603 .216
EKINDEXOVERALL
.722 .008*
The graph of the ROC curve depicts the test results that Dietary Quality with an AUC of .521 is not useful
in predicting OW/OB.

60
Figure 5. ROC E-KINDEX Overall
Quality of Life
Aim three was to measure the relationship between OW/OB and quality of life as
evidenced by IWQOL-Kids scores. A positive correlation between E-KINDEX scores and
IWQOOL-Kids scores was hypothesized. Standard multiple regression was performed between
QOL as the dependent variable and OW/OB as the independent variable. Assumptions were
evaluated and data did not require transformation. There were no missing values or outliers. The
bivariate relationship, R, results in adjusted R 2 accounting for 92.4% of the variance.
E-KINDEX scores were significantly correlated with quality of life perceptions:
(r = -.340, n = 50, p = .016). In all the analyses in this study, Quality of Life was significantly
correlated with E-KINDEX and OW/OB (Table 15).
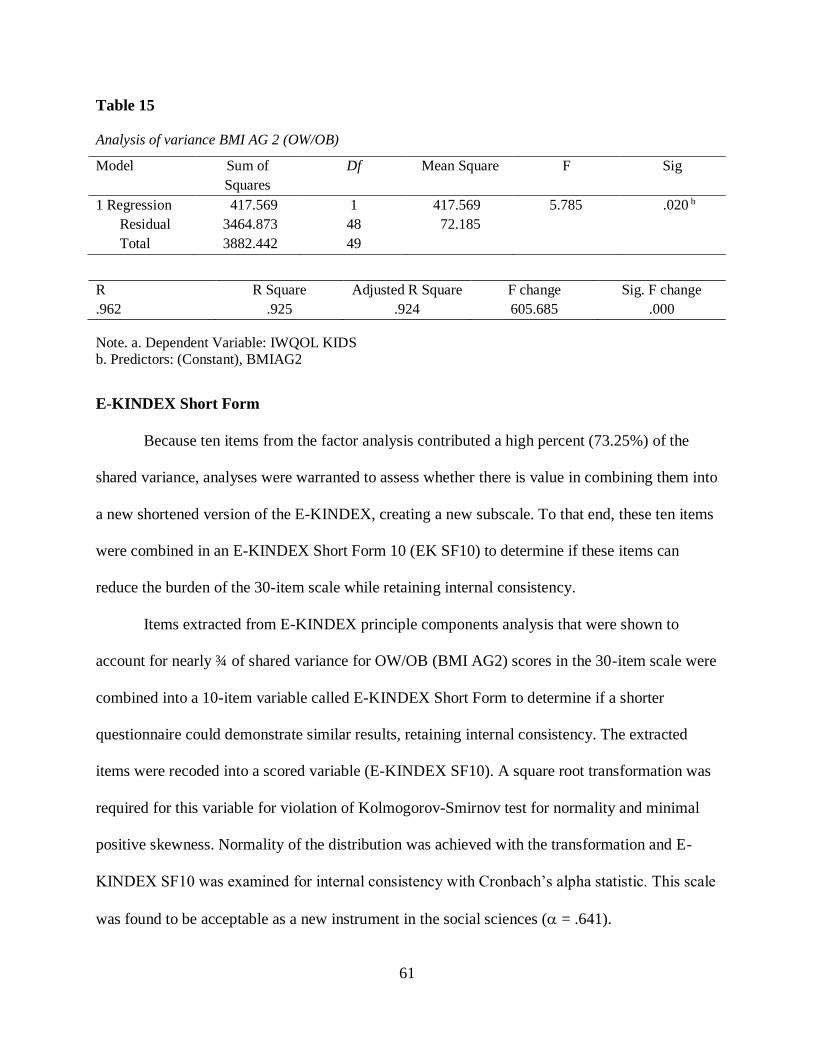
61
Table 15
Analysis of variance BMI AG 2 (OW/OB)
Model Sum of
Squares
Df Mean Square F Sig
1 Regression 417.569 1 417.569 5.785 .020 b
Residual 3464.873 48 72.185
Total 3882.442 49
R R Square Adjusted R Square F change Sig. F change
.962 .925 .924 605.685 .000
Note. a. Dependent Variable: IWQOL KIDS b. Predictors: (Constant), BMIAG2
E-KINDEX Short Form
Because ten items from the factor analysis contributed a high percent (73.25%) of the
shared variance, analyses were warranted to assess whether there is value in combining them into
a new shortened version of the E-KINDEX, creating a new subscale. To that end, these ten items
were combined in an E-KINDEX Short Form 10 (EK SF10) to determine if these items can
reduce the burden of the 30-item scale while retaining internal consistency.
Items extracted from E-KINDEX principle components analysis that were shown to
account for nearly ¾ of shared variance for OW/OB (BMI AG2) scores in the 30-item scale were
combined into a 10-item variable called E-KINDEX Short Form to determine if a shorter
questionnaire could demonstrate similar results, retaining internal consistency. The extracted
items were recoded into a scored variable (E-KINDEX SF10). A square root transformation was
required for this variable for violation of Kolmogorov-Smirnov test for normality and minimal
positive skewness. Normality of the distribution was achieved with the transformation and E-
KINDEX SF10 was examined for internal consistency with Cronbach’s alpha statistic. This scale
was found to be acceptable as a new instrument in the social sciences ( = .641).

62
E-KINDEX SF10 Correlations
Bivariate correlation analysis was conducted between OW/OB and the new variable
E-KINDEX Short Form, logarithm parental weight status, quality of life, physical activity, and
screen time. No correlation between the new E-KINDEX Short Form (SF) score and the
diagnosis of OW/OB (BMIAG2) was found, (r = -.261 n = 50, p = .067). The inverse correlation
between quality of life and E-KINDEX SF was moderate and significant (r = -.311, n = 50, p =
<.028). This was as expected for quality of life relative to E-KINDEX overall score and OW/OB
as quantified by BMIAG2 (Table 16.) Sequential regression analyses did not improve the results
(Table 16).
Table 16
Pearson Correlations E-KINDEX SF 10
Physical
Activity
OW/OB
(BMI AG2)
E-INDEX
Short Form
Quality of
Life
Parental
Weights
Pearson Correlations
Physical
Activity
1
-.320*
.175
.439**
-.068
OW/OB
(BMI AG2)
-.320* 1 -.261 -.311* -.145
E-INDEX
Short Form .175 -.261 1 .179 -.028
Quality of Life
.439** -.311* .179 1 .125
Parental Weights
-.068 -.145 -.028 .125 1
Note. n = 50* p = <.05; **p = <.005

63
CHAPTER FIVE:
DISCUSSION
This chapter presents a discussion of results, clinical significance for practitioners, and
implications for future research in this field.
Results from the Validation of the Electronic Kids Dietary Index Dietary Screening Tool
for Early Identification of Risk for Overweight/Obesity (OW/OB) and Associations with Quality
of Life Perceptions in a Pediatric Population study provide valuable information to advance the
state of the science in identification of risk for development of OW/OB in pediatric populations.
Tools are needed in pediatric clinical practice in order to satisfy the charge made by the National
Association of Nurse Practitioners to begin screening preschoolers for risk of development of
OW/OB. Absent other medical conditions, babies do not begin their lives being overweight or
obese. It is intuitive that feeding practices by parents are critical to whether their children will
maintain healthy weight. Parents are critical in determination of the environment in which their
young children live. Whether it is an obesogenic environment in which the individual resides or
not is determined early in life. Cognitive schema is associated in dietary habits (attitudes) and
habits (practices) that grow with the individual and can be very difficult to change later in life.
This study aimed to advance the science of obesity prevention by validating a tool that assesses
for presence of an obesogenic environment. E-KINDEX may be a useful tool in identification of
obesogenic elements in a child’s environment that may be modifiable.

64
Characteristics of the Sample
Targeted balance in the sample of approximately 50% lean and 50% OW/OB participants
was achieved. Covariates in the sample included age, gender, and SES. As with the Lazarou
study (2011), correlations were not found relative to E-KINDEX scores however, age and gender
are embedded into the BMIAG2 variable for OW/OB. The sample adequately represented the
age of the population as discussed in Chapter Four.
Aims
Aim one was to estimate predictive validity for the E-KINDEX instrument by finding an
inverse relationship with OW/OB. CDC Growth Chart Percentiles were calculated for
participants as part of their visit to the clinic. BMI for age and gender was used as the
determinant of Growth Chart percentile.
Validity
One accepted approach to validation of a scale is via correlation with measures of the
same or related concepts. Scores from the E-KINDEX overall and its subscales were correlated
with BMI AG2. Moderate correlations were found between BMI AG2 and Dietary Behaviors
(Attitudes) subscale score and E-KINDEX Overall score, as hypothesized, supporting construct
validity of the instrument. Although Dietary Quality E-KINDEX and Dietary Habits E-KINDEX
did not have significant correlation as stand-alone subscales, their items did contribute to the
diagnostic ability of E-KINDEX total. Regression analyses supported evidence for the
relationship between E-KINDEX overall and E-KINDEX behaviors with both OW/OB and
quality of life. However, this is just one piece of evidence of construct validity.

65
Another approach to evidence of validity is factor analysis. Principle components factor
analysis confirmed three factor structure of E-KINDEX, further supporting validation of
E-KINDEX overall.
Signal theory in the form of the Receiver Operating Characteristics curve analysis was
used to further estimate the ability of E-KINDEX to measure elements of an obesogenic
environment. ROC curves revealed significance of diagnostic ability for E-KINDEX overall and
Dietary Behaviors E-KINDEX, supporting the results of other analyses in this study. In the
Lazarou (2010) study, ROC cutoff point analysis determined the best score for discriminating
OW/OB from normal weight to be 61 of 87; in this study, the best score was 65 of 87. The
difference in scores may be related to sample size–50 in this study versus 622 in the Lazarou
study. Repeated validation of scales for different populations
As we gather more evidence in the field about the factors that contribute to the
development of OW/OB at earlier ages, we will need to concentrate on the factors that contribute
most heavily. An obvious problem in this area of research is the idea that we are seeking validity
for a tool that measures ‘risk for’ by validating it using data from those who already have this
chronic disease.
Proposed 10-item E-KINDEX. Because of these results, further refinement of the scale
was considered. To that end, a factor analysis was conducted with oblimin rotation. Initial
extraction calculated that ten items contributed to 73.2% of shared variance. Further analyses of
these ten items included as a single subscale, E-KINDEX Short Form, were performed to
determine whether a shortened form of E-KINDEX might be able to demonstrate similar results
while retaining validity and reliability.
66
Reliability
The second aim of this study was to estimate the reliability of E-KINDEX overall and
each of its subscales to measure the elements of the obesogenic environment and risk for
development of OW/OB in a pediatric sample. Acceptable alpha for multi-item measures that are
not yet established is > 0.60 (Nunnally,1978). Cronbach’s coefficient of reliability in this study
ranged from .643 to .703 (Table 8). Lazarou and colleagues (20111) reported Cronbach’s alpha
of .601 for overall E-KINDEX, less than what is reported here. Lazarou did not report
Cronbach’s alpha for the subscales individually. The highest reliability coefficients were Dietary
Habits E-KINDEX and E-KINDEX overall, respectively. These are the same two scales that
demonstrated the highest predictive validity.
Moderating Variables
Moderating variables proposed in this study included parental weight status, physical
activity levels, and screen time. Correlations of parental weight status with OW/OB were
significant, (r= -.29, n = 50, p = < .05). The sequential multiple regression that was conducted
revealed that adding parental weight status did not improve information in that analysis.
Electronic health records were examined to achieve a balanced sample of children relative to
weight status, but it was found at interview that the majority of parents, 91 of 100, were found to
be OW/OB despite the fact that only slightly more than half of the child participants were in that
category.
Physical activity, despite the press it gets as being essential in healthy weight
maintenance and weight loss, was found to be significantly correlated with E-KINDEX (r = .315,
n = 50, p = .026) and nearly identically correlated with OW/OB (r = .32, n = 50, p = .023).
Analysis of screen time, a factor relating to physical activity was similar in results. A point-

67
biserial correlation analysis was run between the dichotomous variable ‘screen time’ and
E-KINDEX overall and OW/OB; no relationship was found. Lazarou and colleagues (2010)
identified a significant relationship with regard to screen time in her study. Screen time has
changed significantly in this technologically advancing world and the evaluation tool used has
not changed with the technology. Many children participate in screen time as homework time
and others who are older may be in the gym at the same time they are listening to music or
watching television: each of these items are answered separately by participants.
While not strong, these relationships were significant. It is to be expected that when two
measures of related but different variables are correlated, the relationship will not be very strong.
Strong relationships would be expected only between measures of the same concept or variable.
Thus, these results seem important and help to confirm the validity of the E-KINDEX. The
multiple regression analysis using OW/OB as the dependent variable with the independent
variables of E-KINDEX total, parental weight status, Dietary Behaviors, Dietary Quality, and
Dietary Habits introduced into the equation sequentially, failed to identify parental weight status
as a predictor for OW/OB. This analysis did confirm that E-KINDEX overall and Dietary Habits
were significant predictors of OW/OB. The 30-item scale and its second subscale, as in the
Lazarou et al., (2010) study, have merit in identification of risk for and status of OW/OB.
Covariates. Age, gender, and socioeconomic status had no bearing on the regression
analyses. Lazarou and colleagues had similar findings (2010) and subsequently stopped
collecting these demographic data. However, age and gender are included in the measurement of
OW/OB, BMIAG2.

68
Quality of Life
Aim three was to assess the quality of life for those who are OW/OB using the validated
Impact of Weight on Quality of Life in Kids (IWQOL-Kids) tool. Moderate inverse correlations
between E-KINDEX scores and quality of life and OW/OB and quality of life were hypothesized
and found. E-KINDEX scores were significantly related (r= -.340, n = 50, p = < .05) as were
OW/OB scores (r= -.311, n = 50, p = < .028).
Some of the information gleaned from answers on the quality of life questionnaires were
difficult for the investigator to read as answers to questions about family ‘not proud of me
because of my weight’, ‘family talks about me behind my back’, and ‘family avoids being with
me because of my weight’ were ‘always true’ to a higher degree than expected. The Family
Relations subscale items in the IWQOL-Kids section were answered candidly by many of the
participants in this study even in the presence of their parents. The format of the IWQOL-Kids
lends itself to the researcher being able to easily note if the participant is circling 1 (always true)
or 5 (never true). Children who are lean and active filled this survey out quickly—circling all 5’s
while those who are not lean seemed to take longer and seemed to have painful answers. Of
question is whether all children answer accurately in the presence of their parents. Perhaps in
future studies, children and parents might be assessed in different rooms. Age differences may
also have played a role in quality of life responses by the children.
The validity of E-KINDEX overall score and subscale two, Dietary Behavior (Attitudes)
were shown to be both valid and reliable, and E-KINDEX overall was shown to be valid and
reliable retaining all of the 30 items. Findings here support the initial Lazarou and colleagues
(2010) study results in spite of the small sample size here. The analyses of the validity and

69
reliability of E-KINDEX are worthy of utilization in the clinical setting to determine the risk for
overweight and obesity in children before they are diagnosed.
E-KINDEX Short Form
Development of the E-KINDEX Short Form by combining the top 10 factors extracted
from the factor analysis into a subscale did not yield beneficial results for this study. However,
further analysis of the factors contained in E-KINDEX is warranted. It is clear there are factors
in the Dietary Quality and Dietary Practices scales that do not contribute to predictive validity.
E-KINDEX Short Form was found to be acceptable for use as a scale ( = .64). However, Short
Form scores were not correlated with either OW/OB or E-KINDEX (r= .179, n = 50, p = .21).
E-KINDEX Short Form correlations are available to view (Table 16).
Strengths
Strengths of this study include the ability to look at analyses that preceded this one with
the benefit of the advancement of science since the prior analysis. Factors previously thought to
be highly associated with OW/OB, such as the actual diet, are now known not to be so influential
in development of OW/OB. Unfortunately, the epidemic of OW/OB has grown larger. Thus, the
need to intervene early for at-risk individuals is paramount. E-KINDEX contributes added
information regarding the trajectory of OW/OB.
Interviewing the parents was a strength of this study. Many parents questioned the items’
importance to overall healthy weight; many asked how they could see the results of this study.
They were advised that these results would be published as a dissertation available to the public
at the University of South Florida website. An abstract will be posted in the clinic that can
inform those who are interested in the results of the study.

70
Anecdotally, it should be noted that nurse practitioners in the clinic were using the
Growth Chart percentiles to trend the percentiles of their patients, including those who fall
between the 5% and 85%, normal weight, such that they were able to intervene when a patient
jumped from a trended 50% to the 67% range, as was the situation of the child who increased his
percentile by 17 points.
Limitations
The sample size of 50 children was a definite limitation of this study. Tampa is fortunate
to have this clinic dedicated to children, but many children who frequent the clinic were
necessarily excluded from this study based on physical and mental limitations. Analyses of the
relationships would likely have yielded stronger results with a larger sample. Factor analysis and
Cronbach’s alpha analyses were insufficiently powered by this sample.
Time was another limitation of this study. The busy clinic was not always able to
accommodate the principal investigator based on availability of privacy that was required to be
accorded to participants. Data collection for this small sample took several months. Computer
access to HIPPA-protected information is very important for health care providers, and clinics
are becoming increasingly unwilling to grant direct access to patient records to someone not
employed by the clinic, as was the case in this study. These factors contributed to the time
constraints as the study needed to be completed within a doctoral program.
A limitation might have been the children’s ability to respond. Some children may not
have accurately entered their true responses. The screen time assessment seems to not take into
account the advancement of technology. Listening to music is considered a sedentary activity,
but many children listen to music while they are playing sports. Screen time assessment tools
require revision according to advancement of technology in our daily lives. Another limitation

71
may have been that many of the OW/OB participants were being treated in the clinic for their
excess weight, biasing some item responses on the questionnaires. Two of the children were 10;
the researcher noted that 10-year old participants required longer time to complete questionnaires
but not longer than five minutes more. All dyads completed all questionnaires in less than 25
minutes. Many of the children were visiting the clinic for well child follow-up, but collection of
data surrounding their visit might have been helpful to screen for bias as many of the OW/OB
children were coming in for monitoring in the Healthy Weight Clinic for their chronic excess
weight.
Implications for Future Research
Future studies should look closely at parental OW/OB. These findings of such high self-
reported levels of parental OW/OB for the majority of the healthy-weight children in the study
do not bode well and could well be indicative of eventual diagnosis of OW/OB in the lean
participants as they grow. E-KINDEX that looks at the obesogenic environment of children
should look at the obesogenic environment of their caregivers—particularly as the adults seem to
be more OW/OB than their children. Parents and children do reside in the same obesogenic
environment to a certain extent other than when children are at school. Now that many schools in
this country are providing both breakfast and lunch to a majority of students, the obesogenic
environment is different for children than their parents. Perishable foods that are generally the
healthiest are difficult to provide, resulting in processed food items being offered.
During data collection, the principle investigator accompanied the nurse practitioner
during a patient visit (not the normal procedure) during which the provider noted her 11-year-old
son had ‘increased’ from the 50th percentile level on the growth to the 68th percentile in just six
months, a significant increase in the trended growth percentiles chart. Utilization of CDC growth

72
charts in combination with E-KINDEX assessment scores may allow parental counseling
targeted to obesogenic environmental factors. For this child, healthy weight had increased 18%
on the growth chart, and his E-KINDEX was positive for high risk for development for OW/OB.
The child subsequently participated in the study and scored 32, significant for prediction of
OW/OB. Mom was one of the few lean parents in this study and was surprised to be counseled
by the nurse practitioner. This is an example of E-KINDEX scoring the obesogenic environment
high but the child scored normal for BMIAG2, evidence of predictive validity, albeit only in one
case.
Complexity of Diet
In reviewing the E-KINDEX questionnaires, it is evident that processed foods are not
accurately assessed. These foods are well known in nutrition science to contribute to inhibited
appetite and satiety signals as well as inhibition of fat digestion. While Dietary Quality
E-KINDEX did not play a substantial role in contributing to significant relationships, processed
foods may be linked to items in the Dietary Behavior subscale. Nutrition science has advanced
since the Lazarou et al., (2010) study that implicates many of the chemicals in processed foods to
the psychology of eating. Revision of the scale and further study may be needed. Lazarou
conducted her study in Cyprus where the diet had become westernized but still contained
elements of the Mediterranean diet (2011).
E-KINDEX is written for older children, but younger children can also be at risk. This
scale should be transformed by a pediatric expert so that it can be administered to younger
children. Another recommendation is to administer E-KINDEX to parents of the very young
children.

73
This study may be considered as a pilot study for larger clinical trials. Persistence will be
required in this area to identify and determine the factors most influential in the obesogenic
environment. After all, there is no ‘Gold Standard’ measurement for the obesogenic environment
as research is still relatively new, but the problem is urgent. New information released October
13, 2017 revealed that after some stabilization in OW/OB numbers, rates are on the rise again
(CDC, 2017).
Implications for Clinical Practice
Obesity is growing world-wide among both adults and children. Prevention of onset of
OW/OB is key to reduction in the rate of growth of the epidemic. Obesity is becoming
recognized as incurable as less than 1% of patients can maintain weight loss after 1 year of non-
invasive treatment. The National Center for Health Statistics (2015-2016) reports that 40% of
adults and 19% of children are obese. Choose any trend line and it is immediately evident that
the line is increasing. We have moved from a labor-intensive society in the past to a sedentary
one today, and we eat many things that interfere with normal digestion and energy expenditure.
The problem is illustrated in the National Health and Nutrition Examination Survey (NHANES)
data from CDC (2016), (Figure 6).
Figure 6. Trends in Obesity among Children and Adolescents
74
The obesogenic environment also includes schools where children spend a great deal of
their time. Information from this study should be disseminated to schools as a method to educate
children, teachers, and their parents.
Clinical practitioners want to intervene in this crisis, and unfortunately, we still seem not
to have the tools to do so. We do not exactly know the factors that have led to the epidemic as
this study indicates. More evidence is needed about the factors contributing to this epidemic. The
disease itself, and sequelae that include cardiac disease, diminished quality of life, diabetes, and
innumerable personal burdens, as well as the financial cost for healthcare as a result, begs for
solutions. The National Association of Pediatric Nurse Practitioners (2015) has issued a position
statement charging pediatric nurse practitioners to begin screening for OW/OB at the preschool
level. Primary care nurses as well as physicians are well-positioned to implement health
promotion measures by the indicators of risk for OW/OB.
The first step in patient care for clinicians is assessment: E-KINDEX is a first step in
assessment tools that can identify young people who are at risk so that if risk modification is
possible, it is implemented. Those who suffer from OW/OB are motivated to work towards
healthy weight. The evidence is in the advertising and dollars spent in pursuit of weight loss.
Clinicians who can identify those at risk, and intervene to turn back this tide, can have a great
impact on those who are prevented from becoming overweight.

75
REFERENCES
American Medical Association House of Delegates (2013). Resolution: 420 (A–13). Resolved
that our American Medical Association recognize obesity as a disease state with multiple
pathophysiological aspects requiring a range of interventions to advance obesity
treatment and prevention. Retrieved October 26, 2017 from
http://www.npr.org/documents/2013/jun/ama-resolution-obesity.pdf
Anthoine E, Moret L, Regnault A, Sébille V, Hardouin J-B. (2014), Sample size used to validate
a scale: A review of publications on newly-developed patient reported outcomes
measures. Health and Quality of Life Outcomes, 12, 2. doi:10.1186/s12955-014-0176-2.
Barlow, S. (2007). Expert committee recommendations regarding the prevention, assessment,
and treatment of child and adolescent overweight and obesity: Summary report.
Pediatrics, 120, 164-192.
Centers for Disease Control and Prevention (2002). Retrieved June 12, 2015 from
http://www.cdc.gov/obesity/data/trends.html
Centers for Disease Control and Prevention (2010). Retrieved June 12, 2015 from
http://www.cdc.gov/obesity/data/trends.html
Centers for Disease Control and Prevention (2014). Retrieved June 12, 2015 from
http://www.cdc.gov/obesity/data/trends.html
Centers for Disease Control and Prevention (2016). National Center for Health Statistics
(NCHS). National Health and Nutrition Examination Survey Data. Hyattsville, MD: U.S.
Centers for Disease Control and Prevention (2014). National Center for Health Statistics
(NCHS). National Health and Nutrition Examination Survey Data. Hyattsville, MD: U.S.
Department of Health and Human Services, Centers for Disease Control and Prevention,
http://www.cdc.gov/growthcharts/percentile_data_files.htm
Chaiton, M., Sabiston, C, O’Loughlin, J, McGrath, J., Maximova, K., & Lambert, M. (2009).
A structural equation model relating adiposity, psychosocial indicators of body image and
depressive symptoms among adolescents. International Journal of Obesity, 33, 588-596.
doi:10.1038/ijo.2009.43
Cole,T., Bellizzi M., Flegal, K., and Dietz, W. (2000) Establishing a standard definition for
child overweight and obesity worldwide: international survey: The British Medical
Journal, 6, (320), 1240-1243.
76
Combs, J., Pearson, C., and Smith, G. (2011). A risk model for preadolescent disordered eating.
International Journal of Eating Disorders, 44(7), 596-604.
Craig, C., Marshall, A., Sjöström, M., Bauman, A., Booth, M. L., Ainsworth, B., & Oja P.,
(2003).International physical activity questionnaire: 12-Country reliability and
validity. Medicine and Science in Sports and Exercise, 35(8), 1381-1395.
doi: 10.1249/01.MSS.0000078924.61453.FB
Davis, M., Gance-Cleveland, B., Hassink, S., Johnson, R., Paradis, G., Resnickow, K., et al.
(2007). Recommendations for prevention of childhood obesity. Pediatrics,120, 229-253.
De Andrade, S. C., Barros, M.B., Carandina, L., Goldbaum, M., Cesar, C. L., and Fisberg, R. M.
(2010). Dietary quality index and associated factors among adolescents of the state of
Sao Paulo, Brazil. The Journal of Pediatrics, 156(3), 456-460.
Deurenberg, P., Weststrate, J., & Seidell, J. (1991). Body mass index as a measure of body
fatness: Age- and sex-specific prediction formulas. British Journal of Nutrition, 65(2),
105-114. doi:10.1079/BJN19910073
Edwards, T., Huebner, C., Connell, F., and Patrick, D. (2002). Adolescent quality of life, part 1:
Conceptual and measurement model. Journal of Adolescence, 25, 275-286.
Elder, C., Ritenbough, C., Mist, S., Aickin, M., et al. (2007). Randomized trial of two
mind-body interventions for weight-loss maintenance. The Journal of Alternative and
Complementary Medicine, 13(1), 67-78.
Ferrans, C., Zerwic, J., Wilbbur, J.E., Larson, J. (2005). Conceptual model of health-related
quality of life. Journal of Nursing Scholarship, 37 (4), 336-342.
Feskanich, D., Rockett, H., and Colditz, G. (2004). Modifying the healthy eating Index to
assess diet quality in children and adolescents. Journal of the American Dietary
Association, 104, 1375-1383.
Gidding, S., Dennison, B., Birch, L., Daniels, S., Gillman, M., Lichtenstein, A., et al. (2006).
American Heart Association: Dietary recommendations for children and adolescents: a
guide for practitioners. Pediatrics, 117, 544-559.
Gutin, B. (2011) Diet vs exercise for the prevention of pediatric obesity: the role of exercise.
The International Journal of Obesity, 35(1), 29-32. doi: 10.1038/ijo.
Hagströmer, M., Oja, P., & Sjöström, M. (2006). The international physical activity
questionnaire (IPAQ): A study of concurrent and construct validity. Public Health
Nutrition,9(6), 755-762. doi:10.1079/PHN2005898

77
Haines, P. S., Siega-Riz, A. M., Popkin, B. M. (1999). The diet quality index revised: A
measurement instrument for populations. Journal of the American Dietetic Association,
99(6), 697-704.
Hullmann, S. E., Ryan, J.L., Ramsey, R.R., Chaney, J. M., and Mullins, L. L. (2011). Measures
of general pediatric quality of life. Arthritis Care and Research, 63(11), 420-430; doi:
10.1002/acr.20637.
Ihmels, M. A., Welk, G. J., Eisenmann, J. C., Nusser, S. M., and Myers, E. F. (2009). Prediction
of BMI change in young children with the family nutrition and physical activity
screening tool. Annals of Behavioral Medicine, 38, 60-68; doi; 10.1007/s12160-009-
9126-3.
Indrayan, A., and Sarmukaddam, S. (2001) Medical Biostatistics, 562. Boca Raton, FL: CRC
Taylor and Francis.
Jensen, C. D., and Steele, R. G. (2010). Validation of the perceptions of teasing scale (POTS) in
a preadolescent sample: Associations with attitudes toward physical activity. Children’s
Health Care,39, 249-265; doi: 10.1080/02739615.2010.515925
Kirk, S. F., Penney, T. L., and McHugh, F. (2009). Characterizing the obesogenic environment:
the state of the evidence with directions for future research. International Association for
the Study of Obesity: Obesity Reviews, 11, 109-117; doi: 10.1111/j.1467-
789X.2009.00611.x
Katz, D. A., McHorney, C. A., & Atkinson, R. L. (2000). Impact of obesity on health-related
quality of life in patients with chronic illness. Journal of General Internal
Medicine, 15(11), 789–796. http://doi.org/10.1046/j.1525-1497.2000.90906.x
Kolotkin, R., Zeller, M., Modi, A., Samsa, G., Quinlan, N. et al. (2006). Assessing weight-
related quality of life in adolescents. Obesity, 14(3), 448-457.
Lang, A., and Froelicher, S. S. (2006). Management of overweight and obesity in adults:
Behavioral intervention for long-term weight loss and maintenance. European Journal
of Cardiology Nursing, 5, 102-114.
Lazarou, C., and Kouta, C. (2010). The role of nurses in the prevention and management of
obesity. British Journal of Nursing, 19(10), 641-647.
Lazarou, C., Panagiotakos, B. D., Spanoudis, G., and Matalas, A. (2009). Dietary and other
lifestyle characteristics of Cypriot children: results from the nationwide CYKIDS
study. BMC Public Health, 9, 147.
Lazarou, C., Kalavana, T., and Matalas, A.L. (2008). The influence of parents’ dietary beliefs
and behaviours on children’s dietary beliefs and behaviours, the CYKIDS study.
Appetite, 51, 690-696.

78
Lazarou, C., Panagiotakos, B. D., Spanoudis, G., and Matalas, A. (2011). E-KINDEX: A
Dietary Screening Tool to Assess Children’s Obesogenic Dietary Habits. Journal of
the American College of Nutrition, 30 (2), 100-112.
Lazarou, C., and Newby, P. (2011). Use of Dietary Indexes among Children in Developed
Countries. American Society for Nutrition 2, 295-303.
Lazarou, C., Panagiotakos, B. D., Spanoudis, G., and Matalas, A. (2010). Physical activity
mediates the protective effect of the Mediterranean diet on children’s obesity status:
the CYKIDS study. The Nutrition Journal, 26(61-67).
Lazarou, C., and Soteriades, E. (2010). Children’s physical activity, TV watching and Obesity
in Cyprus: the CYKIDS study. European Journal of Public Health, 20, 70-77.
Loucaides, C., Jago, R., and Theophanous, M. (2011). Physical activity and sedentary behaviors
in Greek-Cypriot children and adolescents: a cross-sectional study. International Journal
of Behavioral Nutrition and Physical Activity, 8(90), 1-11.
Manios, Y., Kourlaba, G., Grammatikaki, E., Koubitski, A., Siatitsa, P., Vandourou, A., et al.
(2010). Development of a lifestyle-diet quality index for primary schoolchildren and its
relation to insulin resistance: the healthy lifestyle diet index. European Journal of
Clinical Nutrition, 64, 1399-1406.
McAdams, C. (2010) Clinical practice: The environment and pediatric overweight: A review
for nurse practitioners. Journal of the American Association of Nurse Practitioners,
22, 460-467. xdoi:10.1111/j.1745-7599.2010.00537.x
Meule A, and Vögele C. The psychology of eating. Frontiers in Psychology, 4, 215.
doi:10.3389/fpsyg.2013.00215.
Montesi, L., El Ghoch, M., Brodosi, L., Calugi, S., Marchesini, G., & Dalle Grave, R. (2016).
Long-term weight loss maintenance for obesity: a multidisciplinary approach. Diabetes,
Metabolic Syndrome and Obesity: Targets and Therapy, 9, 37–46.
http://doi.org/10.2147/DMSO.S89836
Nadeau, K., Kolotkin, R., Boex, R., Witten, T., McFann, K.K., Zeitler, P., and Walders-
Abramson, N. (2011). Health-related quality of life in adolescents with comorbidities
related to obesity. Journal of Adolescent Health, 49, 90-92; doi:
10.1016/j.jadohealth.2010.10.005.
National Association of Nurse Practitioners (2015). Position Statement on the Prevention and
Identification of Overweight and Obesity in the Pediatric Population
Journal of Pediatric Health Care, 29(4), 13-15.
79
National Institutes of Health (2010). Disease and Conditions Index: What are Overweight and
Obesity? Retrieved September 17, 2013 from http://www.nhlbi.nih.gov/health/health-
topics/topics/obe/
National Institutes Health (2010). How are Overweight and Obesity Diagnosed? Retrieved
September 22, 2013 from http://www.nhlbi.nih.gov/health/health-
topics/topics/obe/diagnosis.html
Nunnally, J. (1978). Psychometric theory (2nd ed.). New York: McGraw-Hill.
Ogden, C., Carroll, M., Kit, B., & Flegal, K. (2014). Prevalence of childhood and
adult obesity in the United States, 2011-2012. Journal of the American Medical
Association, 311(8), 806-814.
Panagiotakos, D. (2009). Health measurement scales: Methodological issues. The Open
Cardiovascular Medicine Journal, 3, 160-165.
Pepe, M., Janes, H., Longton, G., Leisenring, W., and Newcome, P. (2004). Limitations of the
odds ratio in gauging the performance of a diagnostic, prognostic, or screening marker.
American Journal of Epidemiology, 159, 882-890.
Redinger, R. (2007). The pathophysiology of obesity and its clinical
manifestations. Gastroenterology & Hepatology, 3(11), 856–863.
Schwimmer, J. B., Burwinkle, T. M., and Varni, J. W. (2003). Health-related quality of life of
severely obese children and adolescents. JAMA, 289, 1813-1819.
Seals, J. (2007). Integrating the transtheoretical model into the management of overweight and
obese adults. Journal of the American Academy of Nurse Practitioners, 19, 63-71.
Skevington, S., and McCrate, F. (2010). Expecting a good quality of life in health: Assessing
people with diverse diseases and conditions using the WHOQOL-BREF. Health
Expectations, 15, 49-62.
Soeliman, F. A., & Azadbakht, L. (2014). Weight loss maintenance: A review on dietary related
strategies. Journal of Research in Medical Sciences: The Official Journal of Isfahan
University of Medical Sciences, 19(3), 268–275.
Stilwell, V. (2015). Obesity is hurting the U.S. economy in surprising ways. Bloomberg
Financial News. Retrieved July 18, 2016 from http://www.bloomberg.com.
Swinburn, B., Egger, G., and Raza F. (1999). Dissecting obesogenic environments: the
development and application of a framework for identifying and prioritizing
environmental interventions for obesity. Prevention Medicine, 29, 563-570.

80
Tabachnick, B. G., & Fidell, L. S. (2007). Using multivariate statistics. Boston:
Pearson/Allyn & Bacon.
Tsai, A. G., Williamson, D. F. and Glick, H. A. (2011). Direct medical cost of overweight and
obesity in the USA: A quantitative systematic review. Obesity Review, 12(1), 50-61.
Retrieved September 22, 2013 from http://www.ncbi.nlm.nih.gov/pubmed/20059703;
doi: 10.1111/j. 1467-789x.
Tsiros, M.D., Olds, T., Buckley, J. D., Grimshaw, P., Brennan, L., Walkley, J., et al., (2009).
Pediatric review: Health-related quality of life in obese children and adolescents.
International Journal of Obesity, 33, 387-400; doi: 10.1038/ijo.2009.42.
U.S. Department of Health and Human Services, Public Health Service, Centers for Disease
Control and Prevention, National Center for Chronic Disease Prevention and Health
Promotion, Division of Nutrition and Physical Activity (1999). Promoting physical
activity: a guide for community action. Retrieved August 15, 2017 from
https://www.cdc.gov/nccdphp/dnpa/physical/pdf/pa_intensity_table_2_1.pdf.
Woodward-Lopez, G., Ritchie, L.D., Gerstein, D. E., Crawford, P.B., Eds., (2006) in Obesity:
Dietary and Developmental Influences, Boca Raton, FL: CRC Press.
World Health Organization (2001). International classification of functioning, disability and
health: short version. Retrieved October 16, 2013 from
http://www.who.int/mediacenter/en/
World Health Organization (2013). Obesity and overweight. Factsheet. Retrieved September 13,
2013 from http://www.who.int/mediacentre/factsheets/fs311/en/.
World Health Organization (2016). Obesity and overweight. Factsheet. Retrieved September 13,
2013 from http://www.who.int/mediacentre/factsheets/fs311/en/.
Zeller, M., and Modi, A. (2006). Predictors of health-related quality of life in obese youth.
Obesity, 14(1), 122-130.
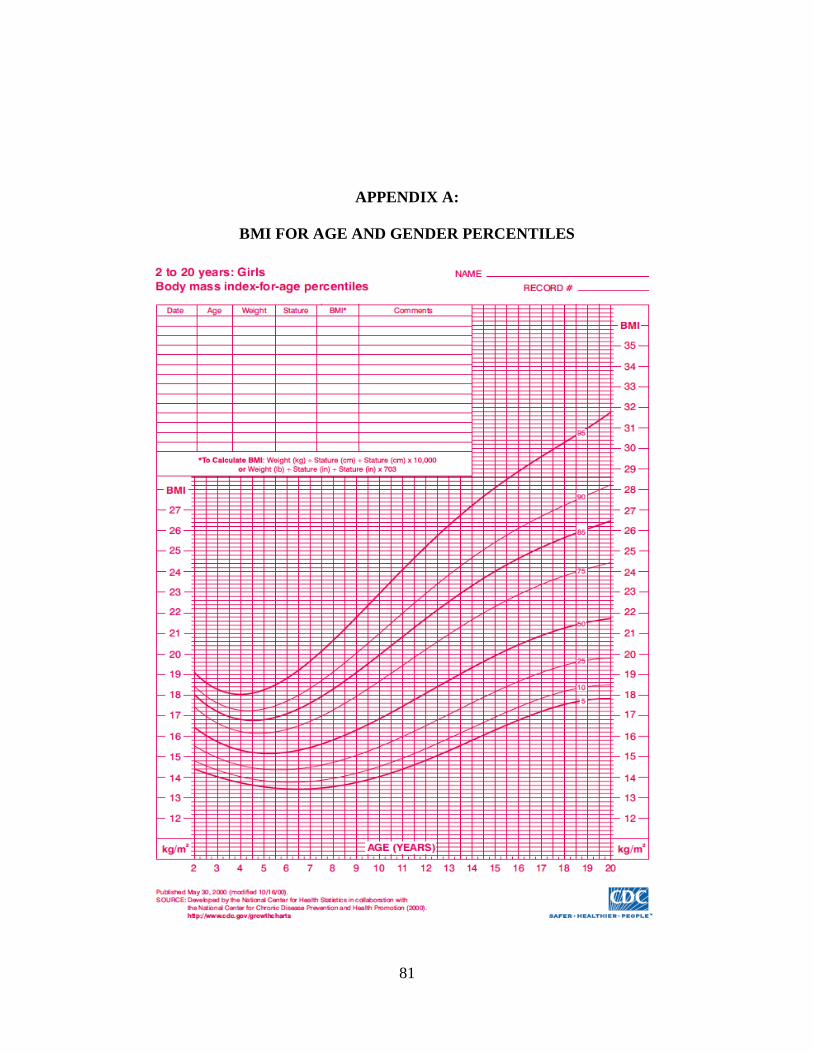
81
APPENDIX A:
BMI FOR AGE AND GENDER PERCENTILES
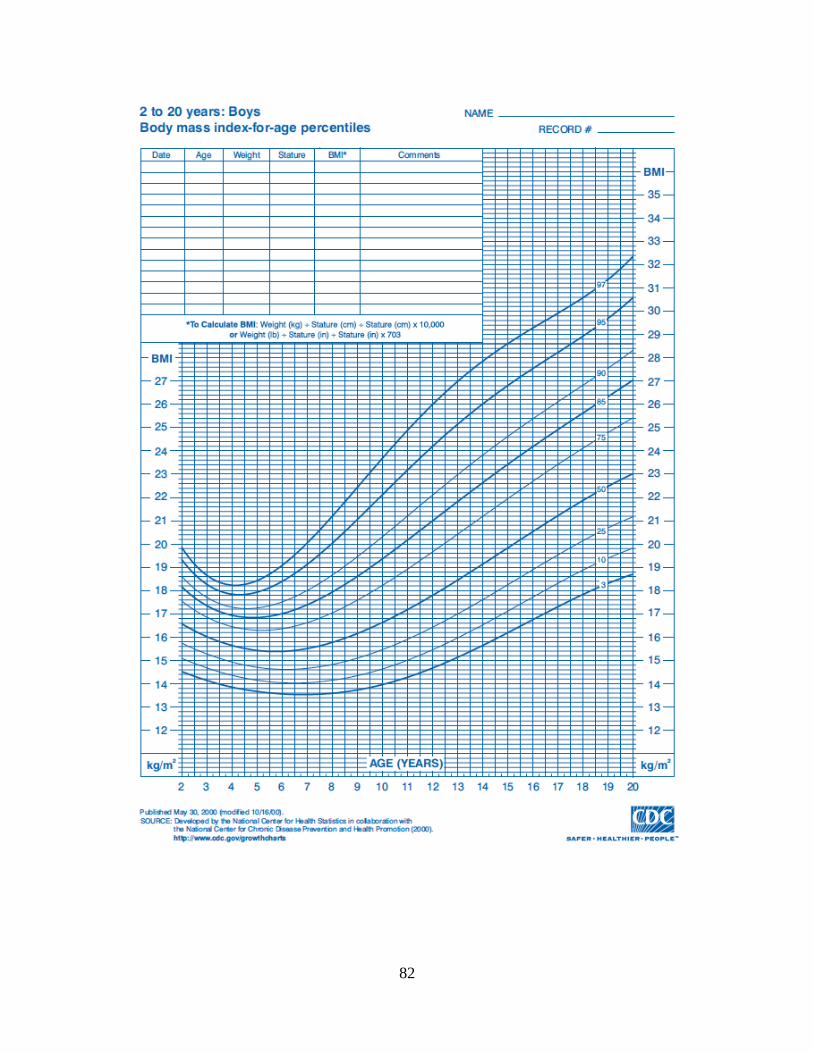
82

83
APPENDIX B
PHYSICAL ACTIVITY LEVEL QUESTIONNAIRE
Please answer the following statements by drawing a circle around the number of times in the
last 7 days you have completed the following physical activities. Please try to be correct. There
are no right or wrong answers.
Physical Activity Index
1. In the past 7 days, I
have done easier
activities that did not
make me sweat or
breathe hard
(walking, slow
biking, skating or
scootering for
example)
None
1 time
2 times
3 times
4 times
5 times
6 times
7 times
2. The usual time I did
these easier activities
above usually lasted
Less
than ½
hour
Less
than 1
hour
Less
than 1
½ hour
More
than 1
½
hours
3. In the past 7 days, I
have done harder
activities that made
me sweat or breathe
hard (running,
playing basketball or
football, swimming,
fast biking, for
example.
None
1 time
2 times
3 times
4 times
5 times
6 times
7 times
4. The usual time I did
these harder activities
above usually lasted
Less
than ½
hour
Less
than 1
hour
Less
than 1
½ hour
More
than 1
½
hours

84
APPENDIX C
RECRUITMENT BROCHURE
KIDS DIETARY INDEX AND QUALITY OF LIFE
Are you interested in healthy nutrition and your child’s feeling of well being?
Please consider allowing your child aged 10 to 18 to take part in a research study about nutrition habits and self-image.
Thisresearchstudywilltestwhetheraquestionnaire
canhelpdoctorsandnursepractitionersidentify
childrenwhosehabitsmightcausethemtobecome
overweight.Thestudywillalsoseeifthereisa
relationshipbetweenweightandfeelingsofwell
being.
Childrenwhoareinterestedshouldbegenerally
healthy,canbenormalweightoroverweight,beable
toreadEnglishatthe3rd gradelevel,andnothavea
mentalorphysicaldisabilitythatrequireshelpfrom
others.Parentsmustgivepermissionandchildren
mustagree.
Questionnairesaboutnutritionhabits,physical
activities,andselfimagecanbecompletedwithin15
to30minutes.A$10.00TargetGiftCardwillbe
giventothosewhocompletethequestionnaires.
PatriciaHall,aPhDstudentatUniversityofSouth
FloridaCollegeofNursing,isinchargeofthestudy
andcanbecontactedasbelow.
kids
10/10/10
USFCON
AT, MSN/ED, R
PatriciaHallMSN/Ed,RNPhDCandidate
USFCollegeofNursing
12901BruceB.DownsBlvd,MDC22
920-819-8854
IRB#=00029711

85
APPENDIX D
PARENTAL INFORMED CONSENT
Consent to Participate in Research & Parental Permission for my Child to Participate in
Research and Authorization to Collect, Use and Share my Child’s Health Information
Pro #00029711
The following information is being presented to help you and your child decide whether or not
you would like to be a part of a research study. Please read this information carefully. If you
have any questions or if you do not understand the information, we encourage you to ask the
researcher.
We are asking you to take part, and to allow your child to take part, in a research study called:
E-KINDEX.
The person in charge of this study is Patricia Hall, RN, PhD student. She is being guided in this
research by Dr. Susan McMillan from the University of South Florida College of Nursing.
However, other research staff may be involved and can act on behalf of the person in charge.
The study will be take place here at the clinic You will be asked to complete 2 questionnaires
which will take about 15-30 minutes. That is all.
Purpose of the study:
By doing this study, we hope to find out about eating habits that are healthy and unhealthy, and
how being overweight affects how a person feels about themselves.

86
Why are you & your child being asked to take part?
You are being asked to take part in this research study because we want to learn about which
habits of children cause a healthy weight and which ones cause too much weight. Our study also
wants to learn how much a person’s weight affects their feelings of well-being. If you take part
in this study, you will be one of about 50 parent-child groups at this site.
Study Procedures:
All children, even those who are age 18, who take part in the study will need a parent to take part
as well, even though the parent will not fill out the surveys for the study.
If you and your child take part in this study, you will be asked to provide your current height,
weight, gender, age, and their opinion on family eating habits to the researcher. Your child will
be asked to complete 3 surveys all of which will take about 15-30 minutes of your time. The
researcher will remain with you and your child in order to answer any questions that may come
up. That is all.
Total Number of Participants
About 50 parent-child groups will take part in this study at this clinic. This study is only being
done at this clinic.
Alternatives / Voluntary Participation / Withdrawal
If you decide not to let your child take part in this study and you do not participate, that is okay.
Instead of being in this research study you and your child can choose not to participate.
You and your child should only take part in this study if both of you want to. You or your child
should not feel that there is any pressure to take part in the study to please the study investigator
or the research staff.
If you or your child decide not to take part:
• You will not be in trouble or lose any rights you would normally have.
• You will still get the same services or health care benefits you would normally have.
• You can still get regular treatments from your regular doctor.
• You do not have to participate in this research study and may stop even after you have
started filling out the survey.
You can decide after signing this informed consent form that you no longer want your child or
yourself to take part in this study. We will keep you informed of any new developments which
might affect your willingness to participate or allow your child to continue to participate in the
study. However, you and your child can decide to stop taking part in the study for any reason at
any time. If you and/or your child decide to stop taking part in the study, tell the study staff as
soon as you can.
87
Benefits
You and your child will receive no benefit(s) by participating in this study.
Risks or Discomfort
To the best of our knowledge, your participation in this study will not harm you. Although we
have made every effort to try and make sure this doesn’t happen, you may find some questions
on the written survey may upset you. If so, you can stop the study right away and we will tell you
and your parent or guardian about other people who may be able to help you with these feelings.
Compensation
Your child will receive a $10.00 Target gift card for taking part in this study. If you or your child
stop participating before the study is over, the payment you receive will be based on the amount
of time you were in the study. If you or your child stop the study once you start it, the minimum
compensation you will receive is a $5.00 Target gift card.
Cost
It will not cost you anything to participate and to let your child take part in the study.
Privacy and Confidentiality
We will keep you and your child’s study records private and confidential. Certain people may
need to see your study records. Anyone who looks at your records must keep them confidential.
These individuals include:
• The research team, including the Principal Investigator, faculty advisor, research
nurses, and all other research staff.
• Certain government and university people who need to know more about the study,
and individuals who provide oversight to ensure that we are doing the study in the
right way.
• Any agency of the federal, state, or local government that regulates this research.
• The USF Institutional Review Board (IRB) and related staff who have oversight
responsibilities for this study, including staff in USF Research Integrity and
Compliance.
We may publish what we learn from this study. If we do, we will not include you or your child’s
name. We will not publish anything that would let people know who you are.
You can get the answers to your questions, concerns, or complaints.
You can ask questions about this study at any time. You can talk with your parents, guardian or
other adults about this study. You can talk with the person who is asking you to volunteer by
calling or texting Patricia Hall at 920-819-8854 or emailing [email protected].

88
If you have questions about you or your child’s rights, complaints, or issues as a person taking
part in this study, call the USF IRB at (813) 974-5638 or contact by email at RSCH-
Authorization to Use and Disclose Protected Health Information (HIPAA Language)
The federal privacy regulations of the Health Insurance Portability & Accountability Act
(HIPAA) protect your identifiable health information. By signing this form, you are
permitting the University of South Florida to use your child’s health information for research
purposes. You are also allowing us to share your child’s health information with individuals
or organizations other than USF who are also involved in the research and listed below.
The following groups of people may also be able to see your child’s health information and
may use that information to conduct this research
• The medical staff that takes care of your child and those who are part of this research
study;
• Each research site for this study: this site is the only site conducting the study.
• The USF Institutional Review Board (IRB) and the USF Pediatric Clinic/Healthy Weight
Clinic its related staff who have oversight responsibilities for this study, including staff in
USF Research Integrity and Compliance and the USF Health Office of Clinical Research;
• Data Safety Monitoring Boards or others who monitor the data and safety of the study;
• There may be other people and/or organizations who may be given access to your
personal health information, including health care providers at the USF Pediatric
Clinic/Healthy Weight Clinic. Anyone listed above may use consultants in this
research study, and may share your child’s information with them. If you have questions
about who they are, you should ask the study team. Individuals who receive your child’s
health information for this research study may not be required by the HIPAA Privacy
Rule to protect it and may share your child’s information with others without your
permission. They can only do so if permitted by law. If your child’s information is
shared, it may no longer be protected by the HIPAA Privacy Rule.
By signing this form, you are giving your permission to use and/or share your child’s health
information as described in this document. As part of this research, USF may collect, use, and
share the following information that include collection and analysis of the data obtained from the
health record and E-KINDEX surveys.
• Your child’s research record
• All of your child’s past, current or future medical and other health records held by USF,
other health care providers or any other site affiliated with this study as they relate to this
research project.
You can refuse to sign this form. If you do not sign this form your child will not be able to take
part in this research study. However, your child’s care outside of this study and benefits will not
change. Your authorization to use your child’s health information will not expire unless you

89
revoke (withdraw) it in writing. You can revoke this form at any time by sending a letter clearly
stating that you wish to withdraw your authorization to use your child’s health information in the
research. If you revoke your permission:
• Your child will no longer be a participant in this research study;
• We will stop collecting new information about your child;
• We will use the information collected prior to the revocation of your authorization. This
information may already have been used or shared with others, or we may need it to
complete and protect the validity of the research; and
• Staff may need to follow-up with your child if there is a medical reason to do so.
To revoke this form, please write to:
Principal Investigator Patricia Hall
For IRB Study # 00029711
3900 38th Way S.
St. Petersburg, FL 33711
While we are conducting the research study, we cannot let you see or copy the research
information we have about your child. After the research is completed, you have a right to see
the information about your child, as allowed by USF policies. You will receive a signed copy of
this form.
Consent to Participate and Parental Permission for My Child to Participate in this
Research Study and Authorization to Collect, Use and Share His/Her Health Information
for Research
I freely give my consent take part and to let my child take part in this study and authorize that
his/her health information as agreed above, be collected/disclosed in this study. I understand that
by signing this form I am agreeing to take part in and to let my child take part in research. I have
received a copy of this form to take with me.
________________________________________________ __________________
Signature of Person and Parent of Child Taking Part in Study Date
________________________________________________
Printed Name of Person and Parent of Child Taking Part in Study
Statement of Person Obtaining Informed Consent
I have carefully explained to the person taking part in the study what he or she can expect from
their participation. I confirm that this research subject speaks the language that was used to
explain this research and is receiving an informed consent form in their primary language. This
research subject has provided legally effective informed consent.
___________________________________________ ____________
Signature of Person Obtaining Informed Consent Date

90
___________________________________________
Printed Name of Person Obtaining Informed Consent

91
APPENDIX E
ASSENT OF CHILDREN TO PARTICIPATE IN RESEARCH
Assent of Children to Participate in Research
Pro #00029711
Title of study: Validation of the Electronic Kids Dietary Index (E-KINDEX) Screening Tool for
Early Identification of Risk for Overweight and Obesity (OW/OB) and Associations with Quality
of Life Perceptions in a Pediatric Population
Why am I being asked to take part in this research?
You are being asked to take part in this research study because we want to learn about which
habits of children cause a healthy weight and which ones cause too much weight. Our study also
wants to learn how much a person’s weight affects their feelings of well-being. If you take part
in this study, you will be one of about 50 people at this site.
Who is doing this study?
The person in charge of this study is Patricia Hall, RN, PhD student. She is being guided in this
research by Dr. Susan McMillan from the University of South Florida College of Nursing.
However, other research staff may be involved and can act on behalf of the person in charge.
What is the purpose of this study?
By doing this study, we hope to learn about eating habits that are healthy and unhealthy, and how
being overweight affects how a person feels about themselves.

92
Where is the study going to take place and how long will it last?
The study will be take place here at the clinic You will be asked to complete 2 questionnaires
which will take about 15-30 minutes. That is all.
What will you be asked to do?
The E-KINDEX survey will ask you a series of questions regarding how frequently you eat
certain foods, how frequently you eat at home or in restaurants, who you eat with, and if
advertising affects your choices. Other questions are about how much you watch TV, play video
games, and exercise or play sports.
The second survey will ask you questions about how you feel about yourself and your weight.
What things might happen if you participate?
To the best of our knowledge, your participation in this study will not harm you.
Although we have made every effort to try and make sure this doesn’t happen, you may find
some questions we ask may upset you. If so, we will tell you and your parents or guardian about
other people who may be able to help you with these feelings.
Is there benefit to me for participating?
We cannot promise that you will receive benefit from taking part in this research study.
What other choices do I have if I do not participate?
You do not have to participate in this research study and may stop even after you have started
filling out the survey.
Do I have to take part in this study?
You should talk with your parents or guardian and others about taking part in this research study.
If you do not want to take part in the study, that is your decision. You should take part in this
study because you want to volunteer.
Will I receive any compensation for taking part in this study?
You will receive a $10.00 Target gift card for taking part in this study. If you stop participating
before the study is over, the payment you receive will be based on the amount of time you were
in the study. If you stop the study once you start it, the minimum compensation you will receive
is a $5.00 Target gift card.
Who will see the information about me?
Your information will be added to the information from other people taking part in the study so
no one will know who you are.

93
No one, not even the people who are doing this study, will know that the information you
provide comes from you.
Can I change my mind and quit?
If you decide to take part in the study you still have the right to change your mind later. No one
will think badly of you if you decide to stop participating. Also, the people who are running this
study may need for you to stop. If this happens, they will tell you when to stop and why.
What if I have questions?
You can ask questions about this study at any time. You can talk with your parents, guardian or
other adults about this study. You can talk with the person who is asking you to volunteer by
calling or texting Patricia Hall at 920-819-8854 or emailing [email protected]. If you think of
other questions later, you can ask them. If you have questions about your rights as a research
participant you can also call the USF IRB at (813) 974-5638 or contact by email at RSCH-
Assent to Participate
I understand what the person conducting this study is asking me to do. I have thought
about this and agree to take part in this study. I have been given a copy of this form.
__________________________________________ _________________
Name of person agreeing to take part in the study Date
__________________________________________ _________________
Printed name & Signature of person providing information (assent) to subject Date

94
APPENDIX F
IMPACT OF WEIGHT ON QUALITY OF LIFE IN KIDS (IWQOL-KIDS)
QUESTIONNAIRE
Please answer the following statements by circling the number that best applies to you in the past
seven days. Be as open as possible. There are no right or wrong answers
Physical Comfort ALWAY
STRUE USUALLY
TRUE SOMETIME
S TRUE RARELY
TRUE NEVER TRUE
1. Because of my weight, I avoid using stairs whenever possible.
1 2 3 4 5
2. Because of my weight, it is hard for me to bend over to tie my shoes or to pick something up off the floor.
1 2 3 4 5
3. Because of my weight, it is hard for me to move around.
1 2 3 4 5
4. Because of my weight, it is hard for me to fit into seats in public places (e.g., movie theaters, desks at school, booths in restaurants).
1 2 3 4 5
5. Because of my weight my knees or ankles hurt.
1 2 3 4 5
6. Because of my weight, it is hard for me to cross my legs.
1 2 3 4 5
Body Esteem ALWAY
S TRUE USUALLY
TRUE SOMETIME
S TRUE RARELY
TRUE NEVER TRUE
7. Because of my weight, I am ashamed of my body.
1 2 3 4 5
8. Because of my weight, I don’t like myself very much.
1 2 3 4 5
9. Because of my weight, I try not to look at myself in mirrors or in photographs.
1 2 3 4 5
10. Because of my weight, I have a hard time believing compliments that I receive from others.
1 2 3 4 5
11. Because of my weight, I am lacking in self-confidence.
1 2 3 4 5
12. Because of my weight, I avoid activities that involve wearing shorts or a bathing suit.
1 2 3 4 5
13. Because of my weight, it is very difficult for me to buy clothing.
1 2 3 4 5

95
14. Because of my weight, I don’t like to change my clothes or undress in front of others.
1 2 3 4 5
15. Because of my weight, I am embarrassed to try out for activities at school.
1 2 3 4 5
Family Relations ALWAYS
TRUE USUALLY
TRUE SOMETIMES
TRUE RARELY
TRUE NEVER TRUE
22. Because of my weight family members treat me differently from the way they treat other people.
1 2 3 4 5
23. Because of my weight family members talk about me behind my back.
1 2 3 4 5
24. Because of my weight one or more people in my family reject me.
1 2 3 4 5
25. Because of my weight my parents aren’t proud of me.
1 2 3 4 5
26. Because of my weight family members make fun of me.
1 2 3 4 5
27. Because of my weight family members don’t want to be seen with me.
1 2 3 4 5
Social Life ALWAYS TRUE
USUALLY TRUE
SOMETIMES TRUE
RARELY TRUE
NEVER TRUE
16. Because of my weight people tease me or make fun of me.
1 2 3 4 5
17. Because of my weight people talk about me behind my back.
1 2 3 4 5
18. Because of my weight people avoid spending time with me.
1 2 3 4 5
19. Because of my weight people stare at me.
1 2 3 4 5
20. Because of my weight, I have trouble making or keeping friends.
1 2 3 4 5
21. Because of my weight people don’t think I’m very smart.
1 2 3 4 5

96
APPENDIX G
DEMOGRAPHIC QUESTIONNAIRE: E-KINDEX
PARENT-CHILD DYAD NUMBER___________
We live in the:_________City_________Country
Parent 1:
Gender: ________Female ________Male ________Other
I feel our family eating habits are:
Good: ______Very Good: ______Average: ______ Need Improvement: ________
Height: _______ Weight: ________ Age: _______
Parent 2:
Gender: ________Female ________Male ________Other
I feel our family eating habits are:
Healthy: ______Mostly Healthy: ______Somewhat Healthy: ______ Not Healthy: ________
Height: _______ Weight: ________ Age: _______
Child:
Gender: ________Female ________Male ________Other
I feel our family eating habits are:
Good: ______Very Good: ______Average: ______ Need Improvement: ________
Height: _______ Weight: ________ Age: _______

97
APPENDIX H
ELECTRONIC KIDS DIETARY INDEX QUESTIONNAIRE
Please answer the following statements by drawing a circle around how often you think each
statement is true for you all the time. There are no wrong answers.
Food Groups E-KINDEX
1. In the past 7 days, I have eaten
Bread
Never
1-2 times
3-5 times
> 6 times
2. In the past 7 days, I have eaten grains
besides bread (rice, pasta, mac and
cheese for example)
Never
1-2 times
3-5 times
> 6 times
3. In the past 7 days, I drank fruit juices and
ate whole fruits
Never
1-2 times
3-5 times
> 6 times
4. In the past 7 days, I have eaten vegetables
Never
1-2 times
3-5 times
> 6 times
5. In the past 7 days, I drank milk and ate
yogurt
Never
1-2 times
3-5 times
> 6 times
6. In the past 7 days, I have eaten legumes:
(seeds, nuts, black beans)
Never
1-2 times
3-5 times
> 6 times
7. In the past 7 days, I have eaten fish and
seafood
Never
1-2 times
3-5 times
> 6 times
8. In the past 7 days, I have eaten meat
(chicken, beef, pork for example)
Never
1-2 times
3-5 times
> 6 times
9. In the past 7 days, I have eaten salted and
smoked meats and foods (packaged deli
meats, hot dogs, bacon for example.
Never
1-2 times
3-5 times
> 6 times
10. In the past 7 days, I have sweets and junk
foods (candy, potato chips, Doritos for
example
Never
1-2 times
3-5 times
> 6 times
11. In the past 7 days, I drank soda or sugary
drinks
Never
1-2 times
3-5 times
> 6 times
12. In the past 7 days, I have eaten foods that
are fried
Never
1-2 times
3-5 times
> 6 times
13. In the past 7 days, I have eaten foods that
are grilled
Never
1-2 times
3-5 times
> 6 times

98
APPENDIX I
ELECTRONIC KIDS DIETARY INDEX
Please answer the following statements by drawing a circle around how often you think each
statement is true for you all the time. There are no wrong answers.
Dietary Behaviors E-KINDEX
1. I think my diet is healthy Never Sometimes Often Very often
2. I think my weight is above
normal
Never Sometimes Often Very often
3. I have tried to be on a diet Never Sometimes Often Very often
4. I feel guilty when I eat
something that is not healthy
Never Sometimes Often Very often
5. I feel guilty when I eat
something I know is fattening
Never Sometimes Often Very often
6. My parents want me to eat all
my food, clean my plate.
Never Sometimes Often Very often
7. I eat something I like even if
I am not hungry
Never Sometimes Often Very often
8. I eat things I know are
fattening
Never Sometimes Often Very often

99
APPENDIX J
ELECTRONIC KIDS DIETARY INDEX
Please answer the following statements by drawing a circle around how often you think each
statement is true for you all the time. There are no wrong answers.
Dietary Habits E-KINDEX
1. I eat breakfast Almost
daily
2 to 4 times
in a week
Once a week 1 to 3 times
in a month
2. I have eaten in a fast food
or other restaurant in the
past 2 days
Never Once 2 or more
times
3. I eat my least favorite food
if I know it is healthy
Almost
daily
1 to 4 times
in a week
1 to 3 times in
a month
Seldom
4. I eat meals with my family Almost
daily
1 to 4 times
in a week
1 to 3 times in
a month
Seldom
5. I eat meals by myself Almost
daily
1 to 4 times
in a week
1 to 3 times in
a month
Seldom
6. I eat snacks in school Almost
daily
1 to 4 times
in a week
1 to 3 times in
a month
7. I eat this number of snacks
and meals every day
2 to 3 in a
day
4 to 5 in a
day
More than 6 in
a day
8. I eat some foods because
they are advertised
Yes No
9. I eat whatever foods are
prepared in my home
Yes No

100
APPENDIX K
INTERNATIONAL PHYSICAL ACTIVITY QUESTIONNAIRE SCORING PROTOCOL
IPAQ is a categorical score.
Three categories of physical activity were defined for the IPAQ short.
Category One - Low physical activity level:
• Those individuals who did not meet criteria for categories two or three below were put in
this category and considered to have a low physical activity level.
Category Two: Moderate physical activity level:
• At least 30 minutes of vigorous intensity activity per day for three or more days per week
OR
• At least 30 minutes of moderate intensity activity per day for 5 or more days per week
OR
• Five or more days of any combination of walking, moderate-intensity or vigorous
intensity activities achieving a minimum Total physical activity of at least 600 MET
minutes per week.
Category Three- High physical activity level:
• Vigorous-intensity activity on at least three days achieving a minimum total physical
activity of at least 1500 MET-minutes per week OR
• Five or more days of any combination of walking, moderate-intensity or vigorous
intensity activities achieving a minimum total physical activity of at least 3000 MET-
minutes per week.

101
APPENDIX L
SCREEN TIME QUESTIONNAIRE
Please answer the following statements by drawing a circle around the number of hours every
day you usually spend doing the following activities. Please try to be correct. There are no right
or wrong answers
Sedentary Behaviors
1. I usually watch
TV
None Less than 1
hour a day
Less than 2
hours a day
Less than 3
hours a day
Less than 4
hours a day
More than 4
hours a day
2. I usually am on
the computer
(include watching
videos, playing
video games,
browsing
websites, and
doing homework)
None Less than 1
hour a day
Less than 2
hours a day
Less than 3
hours a day
Less than 4
hours a day
More than 4
hours a day
3. I usually talk or
message on the
phone
None Less than 1
hour a day
Less than 2
hours a day
Less than 3
hours a day
Less than 4
hours a day
More than 4
hours a day
4. I usually listen to
music
None Less than 1
hour a day
Less than 2
hours a day
Less than 3
hours a day
Less than 4
hours a day
More than 4
hours a day
5. I am usually in
the car or bus
None Less than 1
hour a day
Less than 2
hours a day
Less than 3
hours a day
Less than 4
hours a day
More than 4
hours a day

102
APPENDIX M
LETTER OF SUPPORT USF PEDIATRIC CLINIC
103
APPENDIX N
IRB APPROVAL
5/17/2017
Patricia Hall
College of Nursing
3900 38th Way S
St. Petersburg, FL 33711
RE: Expedited Approval for Initial Review
IRB#: Pro00029711
Title: Validation of the Electronic Kids Dietary Index (E-KINDEX) Screening Tool for Early
Identification of Risk for Overweight and Obesity (OW/OB) and Associations with Quality of
Life Perceptions in a Pediatric Population
Study Approval Period: 5/15/2017 to 5/15/2018
Dear Ms. Hall:
On 5/15/2017, the Institutional Review Board (IRB) reviewed and APPROVED the above
application and all documents contained within, including those outlined below.
Approved Item(s):
Protocol Document(s):
Protocol Guidelines E-KINDEX for expedited IRB application
Consent/Assent Document(s)*:

104
AssentForm 5/1/2017.pdf
E-KINDEX SB Adult Minimal Risk Consent >18 years.pdf
E-KINDEX SB Combined Consent and Parental Permission with HIPPA 5/10/2017.pdf
*Please use only the official IRB stamped informed consent/assent document(s) found under the
"Attachments" tab. Please note, these consent/assent documents are valid until the consent
document is amended and approved.
It was the determination of the IRB that your study qualified for expedited review which
includes activities that (1) present no more than minimal risk to human subjects, and (2) involve
only procedures listed in one or more of the categories outlined below. The IRB may review
research through the expedited review procedure authorized by 45CFR46.110 and 21 CFR
56.110. The research proposed in this study is categorized under the following expedited review
category:
(5) Research involving materials (data, documents, records, or specimens) that have been
collected, or will be collected solely for nonresearch purposes (such as medical treatment or
diagnosis).
(7) Research on individual or group characteristics or behavior (including, but not limited to,
research on perception, cognition, motivation, identity, language, communication, cultural
beliefs or practices, and social behavior) or research employing survey, interview, oral history,
focus group, program evaluation, human factors evaluation, or quality assurance methodologies.
Research Involving Children as Participants: 45 CFR 46, Subpart D
This research involving children as participants continues to be approved under 45 CFR 46.404:
Research not involving greater than minimal risk.
As the principal investigator of this study, it is your responsibility to conduct this study in
accordance with IRB policies and procedures and as approved by the IRB. Any changes to the
approved research must be submitted to the IRB for review and approval via an amendment.
Additionally, all unanticipated problems must be reported to the USF IRB within five (5)
calendar days.
We appreciate your dedication to the ethical conduct of human subject research at the University
of South Florida and your continued commitment to human research protections. If you have any
questions regarding this matter, please call 813-974-5638.
Sincerely,
John Schinka, Ph.D.,Chairperson
USF Institutional Review Board

ABOUT THE AUTHOR
Patricia Ann Hall received an Associate Degree in Nursing from Northeastern Wisconsin
Technical Institute in 1980, and a Bachelor of Science Degree from the University of South
Alabama in 2004. Her clinical experience includes specialization in cardiac critical care, and
Critical Care Transport Team to include fixed and rotor wing transport of critical care patients
for EAGLE III (Emergency and Ground Life Express) in Green Bay, Wisconsin. After earning
the Master’s Degree in Nursing with a Specialty in Health Science Education from the
University of Phoenix, Ms. Hall joined the faculty of the University of South Florida College of
Nursing as an instructor in the undergraduate program. Her teaching and research interests
continue to focus on pediatric obesity and cardiac intensive care.