validation of gps-based estimates of integrated water
TRANSCRIPT

Introduction
Accurate representation of the spatial and temporaldistribution of water vapour in the atmosphere repre-sents a significant challenge in current meteorological
practice. The quality of quantitative precipitationforecasting and of model representation of hydrolog-ic processes is clearly dependent on accurate initiali-sation of the atmospheric moisture distribution.
Atmospheric water vapour is often quantified inkg/m2 as the vertically integrated mass of watervapour per unit area, or in mm as the height of an
Aust. Met. Mag. 55 (2006) 131-148
Validation of GPS-based estimates ofintegrated water vapour for the
Australian region and identificationof diurnal variability
Tomasz J. Glowacki1, Nigel T. Penna2,3 and William P. Bourke1
1. Bureau of Meteorology Research Centre, Melbourne, Australia2. Western Australian Centre for Geodesy, Curtin University of Technology,
Perth, Australia 3. Now at School of Civil Engineering and Geosciences,
University of Newcastle upon Tyne, UK
(Manuscript received June 2005; revised January 2006)
We compare estimates of integrated water vapour derived fromground-based Global Positioning System (GPS) and nearby surfacemeteorological data, with estimates derived from radiosonde sound-ings and from two global numerical weather prediction systemsover the Australian Region for the year 2000. The relative accura-cies of GPS-based estimates for sites with co-located radiosondes aresimilar to those reported in previous studies for other regions of theworld, with the exception of Antarctica. For eight GPS sites withnearby radiosonde launch sites, an average GPS-integrated watervapour estimation standard deviation error of 8.8 per cent over theyear 2000 was obtained, relative to that of radiosonde estimates.Respective percentage errors of 10.7 and 18.0 obtained for integrat-ed water vapour derived from analyses and six-hour forecasts of theAustralian Bureau of Meteorology’s operational global numericalweather prediction system for 2000, indicate the potential of GPSestimates, when comprehensively available for assimilation, to sig-nificantly reduce such errors. Marked precipitable water diurnalvariations in the time series of GPS-based data were also detected.The variations, averaged over one year, were found to be very simi-lar to variations in GPS-derived zenith wet delay at all GPS sites.The potential of using GPS estimates of precipitable water for mon-itoring the performance of numerical weather prediction systemmoisture variables is indicated.
Corresponding author address: T. Glowacki, Bureau of MeteorologyResearch Centre, GPO Box 1289, Melbourne, Vic. 3001, Australia.Email: [email protected]
131

equivalent column of liquid water, termed precip-itable water (PW). Numerically 1 kg/m2 of watervapour is equivalent to 1 mm PW. We also use theterm ‘integrated water vapour’ (IWV) when referringto various estimates or measurements of PW, as iscommon in the literature.
Traditional PW sensors include ground and satel-lite-based water vapour radiometers (WVRs),radiosondes, ground-based humidity sensors and sen-sors on research aircraft. More recently, the GlobalPositioning System (GPS), whilst designed as a mili-tary navigation and positioning aid and now compris-ing some 29 satellites, has evolved into an IWV sen-sor accessible by civilians. Ground-based GPSreceivers track the satellites and record data, whichmay be processed to provide high temporal frequencyestimates, as often as every 15 minutes, of IWV in allweather at a spatial resolution that depends solely onthe number of receivers deployed.
The capability of GPS to deliver continuous, hightemporal frequency measurements of IWV is antici-pated to be very useful for current numerical weatherprediction (NWP) systems, particularly in improvingquantitative precipitation forecasts. Bevis et al.(1992) first proposed the use of ground-based GPSIWV (GPS_IWV) estimates for meteorology. Sincethen numerous studies for different regions of theworld have been conducted to assess its quality. AGPS_IWV estimation accuracy of 1 to 2 mm underideal conditions has been well documented (e.g.Bevis et al. 1994; Duan et al. 1996; Tregoning et al.1998), including near real-time demonstrations (e.g.Dick et al. 2001) and applications (Gutman et al.2004). Such IWV accuracy is desired by meteorolo-gists for use in assimilation and NWP systems (Bakeret al. 2001). Consequently the availability of high fre-quency measurements of GPS_IWV has attractedconsiderable interest in establishing their usefulness.
Assimilation and prediction systems of theAustralian Bureau of Meteorology (ABM) do not yetmake use of GPS_IWV. Before embarking on thedevelopment of any operational system for the incor-poration of GPS_IWV in Australian NWP, it was con-sidered essential to undertake a validation study of theaccuracy with which GPS_IWV may be estimatedfrom ground-based GPS receivers across Australia.The only previous work on GPS_IWV estimationover the Australian region, using somewhat limiteddatasets, was undertaken by Tregoning et al. (1998)and later Feng et al. (2003). Tregoning et al. (1998)compared GPS, WVR and radiosonde estimates ofIWV at Cape Grim Tasmania through November andDecember 1995, reporting differences between theinstrument measurements of just less than 1.5 mm.Feng et al. (2003) assessed GPS_IWV relative to co-
located radiosonde estimates for five sites across theAustralian region from July to September 2000, find-ing mean differences between GPS and radiosondeestimates of 0.66 mm, root mean square (rms) errorsof 1.92 mm and standard deviations of 1.80 mm for500 comparisons after discarding outliers.
To assess the accuracy of GPS_IWV estimation,we chose to use all readily available GPS data fromseventeen sites across continental Australia, islandterritories and Antarctica for the whole of 2000, thuscovering four seasons and a wide range of climates.Our initial studies focused on validating GPS_IWVestimates against data from other meteorological sen-sors and products from NWP systems in order toexamine the feasibility of using GPS data in the ABMassimilation and prediction systems. Extensive com-parisons of IWV estimated from GPS, radiosondes,the ABM Global Assimilation and Spectral Prediction(GASP) and European Centre for Medium-rangeWeather Forecasts (ECMWF) NWP systems wereperformed for this period. Such comparisons can sup-port a derivation of quality indicators for GPS_IWVestimates needed for effective assimilation of this datainto NWP systems. Furthermore, the comparisonsalso provide some insight into the quality of moistureanalysis by both GASP and ECMWF systems and ofGASP forecasts. Finally, we considered whether diur-nal variability of IWV could be detected acrossAustralia using GPS since this has not previouslybeen reported and has the potential for improving thevalidation of NWP system moisture accuracy.
In what follows, relevant background theory forthe retrieval of IWV from GPS is provided. Thedetails of the datasets and specific procedures imple-mented when estimating IWV across the Australianregion using GPS, radiosondes and NWP systems aredescribed. An intercomparison is made of IWV esti-mates obtained using these three methods and resultsof IWV diurnal variability obtained from GPS arepresented. Some factors affecting the accuracy ofGPS IWV estimates are discussed, with conclusions,outlooks and suggestions for further work.
Basic theory
The Global Positioning System currently comprises29 navigation satellites at an altitude of about 20,200km, grouped in six planes evenly distributed aroundthe equator, having orbital periods of just under 12hours. For precise navigation a ground-based GPSreceiver tracks and records carrier phase measure-ments simultaneously from as many as ten satellites,accumulates the data over time and estimates param-eters such as receiver coordinates. In order to estimate
132 Australian Meteorological Magazine 55:2 June 2006

coordinates to the greatest accuracy, it is necessary tomitigate all sources of error that affect the carrierphase measurements. A major source of error is theatmosphere affecting the speed of signal propagationfrom satellite to ground-based receiver. However,whilst the amount of atmospheric propagation delayis considered noise for applications such as position-ing, since its value is dependent on the atmosphericcomposition, it can be converted to a signal for use inapplications such as meteorology.
In GPS work, the atmosphere is considered tocomprise the ‘neutral atmosphere’ to a height ofabout 50 km above the earth’s surface and the iono-sphere from about 50 to 1000 km above the surface.The ionospheric refraction may be almost complete-ly eliminated by comparing the effect of this refrac-tion at two frequencies that are dispersed at a knownrate. The delay due to the neutral atmosphere, whichdoes not disperse the different GPS radio frequen-cies, must be modelled or estimated and cannot beeasily eliminated. The neutral atmosphere is conven-tionally just termed the ‘troposphere’ in GPS work,since about 75 per cent of the delay is caused by thelowest 10 km of the atmosphere, which correspondsclosely to the meteorological troposphere. Using amapping function, the tropospheric delay experi-enced along each receiver-to-satellite path may bemapped to the zenith and a single zenith total delay(ZTD) parameter estimated per receiver site. In prac-tice, ZTD is estimated as a constant parameter perreceiver site over intervals of around fifteen minutesto one hour. The ZTD estimated in scientific geodet-ic-GPS software represents a least-squares best-fitmean of all zenith-mapped signal slant-path delaysfrom receiver to each visible satellite over the timeinterval considered. This procedure is adoptedregardless of atmospheric conditions.
The ZTD that is obtained from a GPS softwarepackage can be considered to comprise a zenithhydrostatic delay (ZHD) and a zenith wet delay(ZWD). ZHD is dependent on surface pressure, sitelatitude and height, and may be computed, followingElgered et al. (1991), as
whereP0 is the total pressure at the GPS antenna height (Pa),φ is the site latitude (degrees),h is the height of the site above the (international)ellipsoid (m), the constant 2.2779 10-5 is in m/Pa,the constant 2.8 10-7 is in m-1,and ZHD is in metres.
ZHD values are typically around 2.3 m, but can beestimated accurately using Eqn 1 if pressure P0 meas-urements are available. For example, pressure dataaccurate to 0.3 hPa yields a ZHD accuracy of about 1mm.
ZWD is largely dependent on the quantity ofatmospheric water vapour and can vary from around0 mm in polar regions to over 400 mm in the tropics.It may be simply obtained by subtraction
ZWD = ZTD – ZHD(P0,φ,h) ...2
Any errors in the modelled hydrostatic delay willpropagate to the ZWD. At GPS sites co-located withmeteorological surface stations, the error in the pres-sure observed by a barometer should not exceed 0.3hPa and therefore the hydrostatic delay there can becomputed to within 1 mm accuracy. At GPS siteswithout co-located barometers, the pressure must beestimated from the nearest barometer, so larger errorsin ZWD will be expected there. Alternatively, NWPsystem surface pressure can be used, where errorswould depend on the NWP system interpolated output(analysis or forecast) accuracy.
ZWD may be converted to IWV via a dimension-less conversion factor Q (Askne and Nordius 1987)that is dependent on the mean temperature of theatmosphere for the site in question and is given as
IWV = ZWD/Q …3
and
Q = 10-6ρRv (k3/Tm + k′2 ) …4
whereρ is the density of liquid water (1000 kg/m3), Rv is the specific gas constant of water vapour(461.524 Jkg-1K-1), k3 and k′2 are atmospheric refractivity constants(0.037x10⁵ K2/Pa and 0.22 K/Pa respectively) and Tm (K) is the moisture-weighted mean temperature ofthe troposphere (Davis et al. 1985) defined as
where e is partial water vapour pressure (Pa), T is temperature (K) as a function of height h.
The integrations are from the surface, actually theGPS antenna height, to the top of the troposphere.However, in practice Tm is often approximated by theBevis regression formula (Bevis et al. 1992) based onradiosonde profiles from continental USA:
∫∫(e/T)dh
(e/T2)dhTm = ...52.2779 10-5
1 – 2.66 10-3 – 2.8 10-7...1
hZHD(P0,φ,h) = P0
cos(2φ)
Glowacki et al.: Validation of GPS-based integrated water vapour for Australia 133

Tm = 70.2 + 0.72Ts …6
where Ts is the temperature (K) at GPS antenna ele-vation rather than at the surface.
The main uncertainty when converting ZWD toIWV is the estimation of Tm. It was consideredbeyond the scope of this initial validation study toderive new regressions at all radiosonde sites. Forcomparison local regressions were derived at a fewsites co-located with GPS ground stations. Anothersource of error is ignoring the small contribution ofliquid water in the conversion from ZWD to IWV(Eqn 3). For example, Elgered (1993) estimated anupper bound of 7.5 mm for the delay due to liquidwater. Typical values for Q are approximately six, so6 mm of ZWD is equivalent to about 1 mm of IWV.
Dataset description
All accessible GPS data from dual frequencyreceivers across the Australian region and territorieswere collated for the entire year 2000. This gave thelargest dataset with which to validate GPS_IWV. Theseventeen GPS sites used are shown in Fig. 1. Thesesites predominantly form the Australian RegionalGPS Network maintained by Geoscience Australia,whose data are also made available through theInternational Global Navigation Satellite Systems(GNSS) Service (IGS). All receivers were equipped
with choke ring antennas and recorded carrier-phaseGPS measurements every 30 seconds throughout2000, except for times of occasional communicationfailures when small quantities of data were lost.
To convert ZTD to IWV, three-hourly surface pres-sure and temperature recordings from the weather sta-tion nearest to each GPS receiver were obtained fromthe ABM’s Australian Data Archive for Meteorology(ADAM). Similarly, daily radiosonde observationsfrom the nearest Australian Upper Air Network sitewere obtained. All data corresponding to the originalsignals from sensors were retrieved and used.Atmospheric soundings were obtained by VaisalaRS80-A radiosondes manufactured betweenSeptember 1988 and May 2000. These radiosondessuffer from a dry bias in relative humidity, which maybe estimated by using a formula proposed by Wang etal. (2002). Two NWP systems were selected for com-puting IWV, namely ABM’s GASP, since it is the sys-tem developed by ABM and the highly sophisticatedECMWF system. The 2000 operational GASP systemis largely as described in Seaman et al. (1995) and inBourke et al. (1995). Relative to the system describedin these references the overall resolution in 2000 hadbeen upgraded to T239/L29, with the predictionmodel differing primarily with respect to its use ofsemi-Lagrangian time-stepping and improved con-vective parametrisation. The ECMWF global assimi-lation and prediction system is as described bySimmons and Hollingsworth (2002).
134 Australian Meteorological Magazine 55:2 June 2006
Fig.1 GPS sites with nearby radiosonde sites used in this study.
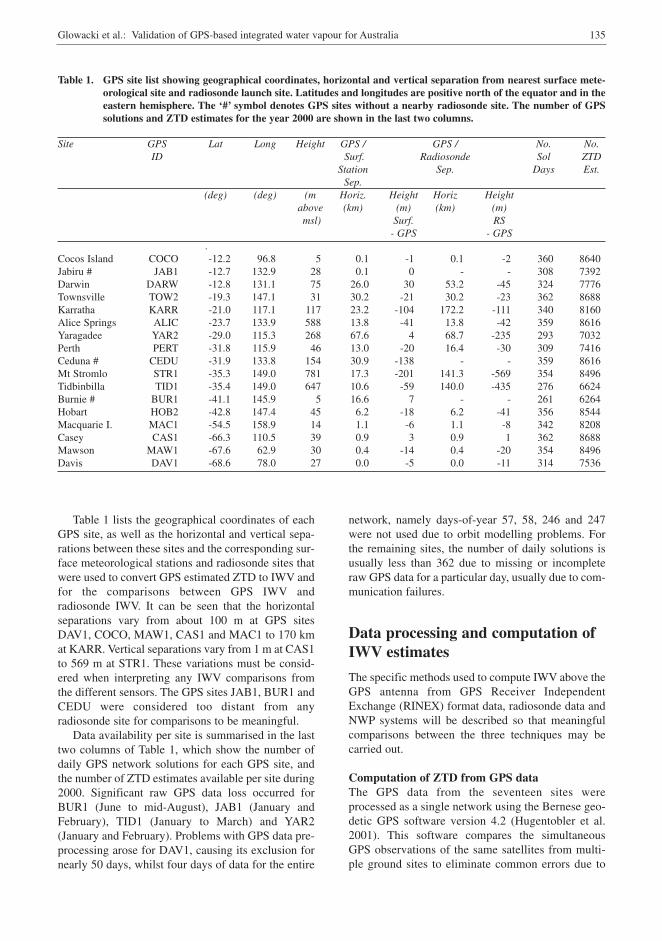
Table 1 lists the geographical coordinates of eachGPS site, as well as the horizontal and vertical sepa-rations between these sites and the corresponding sur-face meteorological stations and radiosonde sites thatwere used to convert GPS estimated ZTD to IWV andfor the comparisons between GPS IWV andradiosonde IWV. It can be seen that the horizontalseparations vary from about 100 m at GPS sitesDAV1, COCO, MAW1, CAS1 and MAC1 to 170 kmat KARR. Vertical separations vary from 1 m at CAS1to 569 m at STR1. These variations must be consid-ered when interpreting any IWV comparisons fromthe different sensors. The GPS sites JAB1, BUR1 andCEDU were considered too distant from anyradiosonde site for comparisons to be meaningful.
Data availability per site is summarised in the lasttwo columns of Table 1, which show the number ofdaily GPS network solutions for each GPS site, andthe number of ZTD estimates available per site during2000. Significant raw GPS data loss occurred forBUR1 (June to mid-August), JAB1 (January andFebruary), TID1 (January to March) and YAR2(January and February). Problems with GPS data pre-processing arose for DAV1, causing its exclusion fornearly 50 days, whilst four days of data for the entire
network, namely days-of-year 57, 58, 246 and 247were not used due to orbit modelling problems. Forthe remaining sites, the number of daily solutions isusually less than 362 due to missing or incompleteraw GPS data for a particular day, usually due to com-munication failures.
Data processing and computation ofIWV estimates
The specific methods used to compute IWV above theGPS antenna from GPS Receiver IndependentExchange (RINEX) format data, radiosonde data andNWP systems will be described so that meaningfulcomparisons between the three techniques may becarried out.
Computation of ZTD from GPS dataThe GPS data from the seventeen sites wereprocessed as a single network using the Bernese geo-detic GPS software version 4.2 (Hugentobler et al.2001). This software compares the simultaneousGPS observations of the same satellites from multi-ple ground sites to eliminate common errors due to
Glowacki et al.: Validation of GPS-based integrated water vapour for Australia 135
Table 1. GPS site list showing geographical coordinates, horizontal and vertical separation from nearest surface mete-orological site and radiosonde launch site. Latitudes and longitudes are positive north of the equator and in theeastern hemisphere. The ‘#’ symbol denotes GPS sites without a nearby radiosonde site. The number of GPSsolutions and ZTD estimates for the year 2000 are shown in the last two columns.
Site GPS Lat Long Height GPS / GPS / No. No.ID Surf. Radiosonde Sol ZTD
Station Sep. Days Est.Sep.
(deg) (deg) (m Horiz. Height Horiz Heightabove (km) (m) (km) (m)msl) Surf. RS
- GPS - GPS.
Cocos Island COCO -12.2 96.8 5 0.1 -1 0.1 -2 360 8640Jabiru # JAB1 -12.7 132.9 28 0.1 0 - - 308 7392Darwin DARW -12.8 131.1 75 26.0 30 53.2 -45 324 7776Townsville TOW2 -19.3 147.1 31 30.2 -21 30.2 -23 362 8688Karratha KARR -21.0 117.1 117 23.2 -104 172.2 -111 340 8160Alice Springs ALIC -23.7 133.9 588 13.8 -41 13.8 -42 359 8616Yaragadee YAR2 -29.0 115.3 268 67.6 4 68.7 -235 293 7032Perth PERT -31.8 115.9 46 13.0 -20 16.4 -30 309 7416Ceduna # CEDU -31.9 133.8 154 30.9 -138 - - 359 8616Mt Stromlo STR1 -35.3 149.0 781 17.3 -201 141.3 -569 354 8496Tidbinbilla TID1 -35.4 149.0 647 10.6 -59 140.0 -435 276 6624Burnie # BUR1 -41.1 145.9 5 16.6 7 - - 261 6264Hobart HOB2 -42.8 147.4 45 6.2 -18 6.2 -41 356 8544Macquarie I. MAC1 -54.5 158.9 14 1.1 -6 1.1 -8 342 8208Casey CAS1 -66.3 110.5 39 0.9 3 0.9 1 362 8688Mawson MAW1 -67.6 62.9 30 0.4 -14 0.4 -20 354 8496Davis DAV1 -68.6 78.0 27 0.0 -5 0.0 -11 314 7536

satellite orbits and poor synchronisation betweensatellite and ground site clocks. The GPS baselineswere formed to maximise the number of double dif-ference observations, with the satellite positionstightly constrained to those from the final (latencyabout 13 days) IGS precise ephemeris, which has apositional quality of about 5 cm and is sufficient forenabling an IWV accuracy of 1 mm (Ge et al. 2000).The final IGS earth rotation parameter estimateswere also used. The effect of ionospheric refractionwas minimised by linearly combining dual frequencyGPS data. Earth-body and ocean tide-loading effectswere corrected by using the IERS Conventions(McCarthy 1996) and the GOT00.2 ocean tide model(Ray 1999) respectively. Receiver antenna phasecentre variations were corrected using the IGS phasecentre models (ftp://igscb.jpl.nasa.gov/pub/station/general/igs_01.pcv).
The continuous data were processed in discrete 24-hour solutions using a 180 second data samplinginterval and a minimum elevation cut-off of 15°.Receiver-to-satellite elevation-angle data weightingwas used, with estimates of all ambiguities left asfloating point, i.e. not integer-fixed. This was toensure a consistent strategy and solution comparisonacross the entire network. GPS site marker coordi-nates were constrained to within 1 cm of theITRF2000 estimates (Boucher et al. 2004) for eachdaily processing session to improve the decorrelationbetween the estimated station coordinates and tropos-pheric delays. A one-centimetre constraint, instead ofvery tight ‘fixing’, was applied to ensure the solutionswere not biased by unexplained seasonal coordinatetime series effects (Dong et al. 2002) or any unac-counted errors. The ZTD was computed by estimat-ing a zenith correction to the Saastamoinen (1972)model delay estimate per site per hour, using the Niell(1996) mapping function. Relative constraints of 2mm were applied between adjacent tropospheric esti-mates and the discrete 24-hour solutions from threeconsecutive days were combined at the post-processed normal equation level (Brockmann 1996)to provide the final ZTD estimates for each ‘middle’day. This follows the procedure of Vedel et al. (2004)to overcome any jumps in the ZTD time series at pro-cessing session boundaries.
Computation of ZHD, ZWD and Q above the GPSantennaTo compute the ZHD above the GPS antenna usingEqn 1, the pressure data collected at the nearest sur-face weather station were mapped from the barometerheight above sea level to that of the GPS antennaaccording to the WMO (1968) formula, with horizon-tal pressure variations ignored. The computed ZHDs at
each station were available at three-hourly intervalsthat correspond to the timing of pressure observationsat the weather stations, while one-hourly ZTD esti-mates were computed using the GPS data. Thereforethe three-hourly ZHD estimates were interpolated tothe epoch of the ZTD estimate (using eight-knot cubicsplines). To test the errors associated with thisapproach, pressure data collected every 60 secondsfrom a Paroscientific Met3 sensor, co-located with theTOW2 GPS antenna, were used as a reference andcompared with the hourly estimates of pressurethroughout 2000. The mean and rms of the differenceswere 0.002 hPa and 0.17 hPa respectively, suggestingthat the interpolation caused errors of about 1 mm inZHD. Similarly, when extrapolating the nearest sur-face station temperature Ts to the GPS antenna level,only the height dependence was considered using afixed lapse rate of 0.0065 K/m. The conversion factorQ was computed at three-hourly intervals with Ts atGPS antenna level in Eqn 6, then interpolated to theZWD epochs using eight-knot cubic splines. This gaveGPS_IWV estimates above each GPS antenna athourly intervals for the whole of 2000.
Computation of IWV from radiosonde soundingsRadiosonde IWV (RS_IWV) estimates may beobtained using all available complete soundings fromradiosonde pressure, temperature, dew-point temper-ature and height recorded along the ascending bal-loon’s path. For IWV comparisons of estimatesderived from radiosondes and GPS, the RS_IWV esti-mates can be corrected for the difference in heightbetween the radiosonde surface data and the GPSantenna.
For the column bounded by the GPS antennaheight Zb (at pressure Pb) and the top radiosonderecording level ZT (at pressure PT), IWV in kg/m2 isgiven by
where ρv is the density of water vapour (kg/m3) in the col-umn integrated from Zb to ZT, dh is the height difference (m) between layers,q is the specific humidity (mass mixing ratio, kg/kg)computed from discrete radiosonde reports,dP is the pressure difference (Pa) between layers,g is the acceleration due to gravity (m/s2).
Given radiosonde measurements of dew-pointtemperature Td (K) and pressure P (Pa), the partialwater vapour pressure e (Pa) for temperatures warmerthan –50.01°C, was computed using a simplified sat-uration vapour equation (Gueymard 1993):
1∫IWV = ...7ZT
Zb
ρvdh = – ∫PT
Pb
qdPg
136 Australian Meteorological Magazine 55:2 June 2006

and the specific humidity q using
RS_IWV was computed above the GPS antennausing the radiosonde soundings from the nearestlaunch site as input to Eqns 7, 8 and 9, with horizon-tal water vapour variations ignored.
Computation of IWV from GASP and ECMWFNWP systemsThe objective analysis of mixing ratio from GASP andrelative humidity from the ECMWF global NWP sys-tems obtained from the ABM archives at the listed pres-sure levels were first horizontally interpolated to GPSlocations, then converted to specific humidity and inte-grated above the GPS locations to obtain IWV (Eqn 10).
where P1 is the pressure at the GPS antenna height and Pj for each j=2, ... n are sequential NWP level pressures. The values of q1 at P1 and of q were calculated assum-ing q varies as logarithm of pressure between analysislevels, and whenever P1 was greater than 1000 hPa q1was assumed equal to specific humidity at the firstmodel level (1000 hPa).
GASP:10 levels (1000, 850, 700, 600, 500, 400, 300, 200,150, 100) hPa1.5 x 1.5 degrees;
ECMWF:11 levels (1000, 925, 850, 700, 600, 500, 400, 300,200, 150, 100) hPa2.5 x 2.5 degrees.
Comparisons of IWV estimates fromGPS, radiosondes, GASP andECMWF NWP systems
Intercomparisons of GPS_IWV, RS_IWV, IWVderived from the GASP (GASP_IWV) and ECMWF(ECMWF_IWV ) NWP system analyses, and six-hourforecasts for GASP (GASPfg_IWV) were carried out.
The objective was to validate GPS retrieval proce-dures under different climatic conditions of the south-ern hemisphere, and to gauge the accuracies of theyear 2000 operational analyses (and six-hour first-guess forecasts) representation of IWV relative tooperational radiosonde data and independent GPSestimates.
In GASP, the 3D moisture field is determined bythe GASP six-hour first guess and by moisture andmoisture-sensitive observations. Enhancing obser-vations with GPS_IWV data should theoreticallycontribute to the reduction in analysis error. To beuseful for data assimilation, the new GPS_IWVdata should have well-understood and easy-to-describe error characteristics such as known ran-dom error, minimum gross errors, small or well-known correlations and be bias free. The compar-isons of GASPfg_IWV and GPS_IWV relative toradiosondes provide an indication of the possiblebenefit of assimilating GPS_IWV data. As will beshown in the following, its relative accuracy is sig-nificantly greater at most GPS sites than that ofGASPfg_IWV prior to assimilation. GPS_IWV canthus contribute new information when assimilatedand is expected to contribute significantly to thereduction of the remaining unexplained variance inanalysed GASP moisture field. Due to the differ-ences in the resolution of the archived output of thetwo NWP systems, which affect the accuracies ofthe retrieved NWP IWV and thus slightly obscurecomparison results, direct intercomparison ofGASP and ECMWF derived IWV is not a specificfocus of this study.
Comparison of IWV from GPS and radiosondesEstimates of GPS_IWV and RS_IWV above the GPSantenna were compared for the year 2000 for fourteenGPS sites that are co-located with or near radiosondesites. Figure 2 provides graphical comparisons ofGPS_IWV and RS_IWV for COCO, DARW, ALICand MAW1 for twelve months. The RS_IWV isshown depending on the availability of the radiosondereports, twice daily for COCO, DARW and MAW1,or once daily for ALIC.
A strong correlation between the GPS_IWV andRS_IWV is clearly seen in Fig. 2, and the compari-son statistics for the fourteen selected sites are list-ed in Table 2. These are also summarised graphical-ly in Fig. 3 together with the average GPS_IWV foreach site. The largest standard deviations occur atsites where atmospheric moisture is the highest orwhere the distance between the GPS site and theradiosonde or surface station is large. For example,KARR is 172.2 km from the nearest radiosonde siteat Port Hedland and TID1 and STR1 are both
ΣIWV= ...10(q((Pj+Pj+1)/2)+(qj+qj+1)/2) (Pj-Pj+1)/21g
n–1
j=1
...9q = 0.62198e/(P – e)
1 + 0.62198e/(P – e)
4914.0396+109218.53 26.9348692–
– 0.0039015156Td ...8
e = exp/Td
Td{
}( )
Glowacki et al.: Validation of GPS-based integrated water vapour for Australia 137

approximately 140 km from the nearest radiosondesite at Wagga Wagga. These findings match those ofLiou et al. (2001), who suggest that the magnitudeof the standard deviation of the difference betweenGPS_IWV and WVR IWV estimates relates to themagnitude of IWV. They report an average value of2.2 mm for Taipei and Guam located near the trop-ics between 18 and 24 March 1998. In this study,the standard deviations of GPS_IWV and RS_IWVdifferences for COCO, DARW and TOW2 are ofsimilar magnitude. The standard deviation of 1.1mm for HOB2 is similar to the two-month averagefrom November to December 1995 reported byTregoning et al. (1998) for Cape Grim, Tasmania of1.5 mm between GPS_IWV and RS_IWV and 1.3mm between GPS_IWV and WVR_IWV.Furthermore, Feng et al. (2003) report a GPS_IWVminus RS_IWV standard deviation of 1.8 mm and amean difference of 0.66 mm for five GPS sites forJuly to September 2000, with Tm derived fromradiosondes. However, July to September is a peri-od of reduced tropospheric water vapour at all theirfive GPS sites when compared to the yearly aver-age. For ALIC, DARW and TOW2 it is only 54, 60and 62 per cent respectively of the yearly amount.When scaled, for a given site, by the amount ofwater vapour, the standard deviations reported byFeng et al. (2003) and those obtained in this study(Table 2) are very similar. The standard deviation istypically less at higher latitudes since it is a func-tion of the amount of IWV. It is apparent from Table2 and Fig. 3 that the GPS estimates all show a pos-itive bias relative to radiosondes, varying from 0.5mm at DARW to about 2.2 mm in Hobart.
138 Australian Meteorological Magazine 55:2 June 2006
Fig. 2 Comparison of GPS_IWV and RS_IWV for(a) COCO, (b) DARW, (c) ALIC and (d)MAW1. Radiosonde estimates were availabletwice daily, except at ALIC where they wereonly available once per day.
(a) COCO
(b) DARW
(c) ALIC
(d) MAW1
Fig. 3 Year 2000 average GPS_IWV at 17 GPS sitesand comparison statistics of GPS_IWV minusRS_IWV.

Comparison of IWV from radiosondes with GASPand ECMWF analysesTable 3 provides a summary of the accuracy of inte-grated moisture in the two NWP system analyses forthe entire year 2000 relative to radiosondes. It can beseen that both GASP and ECMWF analyses have pre-dominantly moist biases relative to radiosonde esti-mates. Excluding the Antarctic sites, the average bias-es are 1.09 mm for GASP and 1.01 mm for ECMWF.This means that both GASP and ECMWF mixingratio analyses yield IWV values that are systematical-ly larger than respective radiosonde observations. Welink these relative underestimates in RS_IWV to drybiases in Vaisala RS80-A humidity measurements asthey have more effect on estimates of RS_IWV thanon NWP analyses of IWV. The latter are corrected inpart by model physics, but also have contributionsfrom other measurements of moisture. The correspon-ding average standard deviations of IWV estimatesrelative to radiosondes for these non-Antarctic sta-tions are 2.66 mm for GASP and 2.59 mm forECMWF.
Comparison of IWV from GPS with GASP andECMWF analysesA comparison of GPS_IWV estimates withGASP_IWV and ECMWF_IWV from operationalanalyses is shown in Table 4 for all seventeen GPS
sites. Results indicate that GPS_IWV estimates are,in most cases, slightly larger than respectiveGASP_IWV and ECMWF_IWV and for Antarcticstations substantially larger. We have just seen that theGASP_IWV and ECMWF_IWV are also biased pos-itively with respect to radiosondes (Table 3). That isthe GPS_IWV and numerical analyses are somewhatsurprisingly (as both NWP systems assimilateradiosonde data) in closer agreement than GPS_IWVand RS_IWV. Comparison with NWP system analy-ses also allows GPS_IWV verification and vice versa,which is useful at locations such as BUR1, CEDU andJAB1 where radiosonde reports are not available tothe assimilation systems. Standard deviations forthese sites are somewhat larger as seen in Table 4.
The comparison performed separately for 0000UTC and 1200 UTC as in Table 5, when considered inconjunction with the composite results of Table 4,provides an indication of the effect of radiosondedata. ALIC and TOW2 were selected to illustrate theperformance of the two NWP assimilation systems atlocations where radiosondes are only launched onceper day at 0000 UTC.
It can be seen from Table 5 that there is a substan-tial loss in accuracy in GASP_IWV estimates at 1200UTC relative to 0000 UTC, as measured by rms orstandard deviation. This we attribute to the lack ofradiosonde reports available for assimilation at that
Glowacki et al.: Validation of GPS-based integrated water vapour for Australia 139
Table 2. Comparison of GPS_IWV with RS_IWV for the year 2000. Outliers omitted at the 3.5 standard deviation level.N is the number of comparison time points. IWV values are expressed in mm. The last column shows the cor-relation coefficients between GPS_IWV and RS_IWV.
Site ID N Ave Ave rms Std dev Mean bias Std dev CorrRS_ IWV GPS_ IWV /Ave RS _IWV
%
COCO 700 42.9 44.4 2.9 2.5 1.5 5.8 0.97
DARW 645 41.0 41.9 3.0 2.9 0.9 7.0 0.98TOW2 357 32.3 34.0 2.7 2.1 1.7 6.5 0.99KARR 737 26.6 28.6 5.0 4.6 2.1 17.3 0.95ALIC 350 19.4 21.5 2.7 1.8 2.0 9.3 0.99YAR2 368 14.9 16.2 2.4 2.0 1.3 13.4 0.98PERT 607 17.2 17.4 1.6 1.6 0.2 9.3 0.98STR1 414 12.8 13.5 2.9 2.8 0.7 22.0 0.93TID1 330 12.4 12.6 2.7 2.7 0.2 21.8 0.92HOB2 709 14.4 16.7 2.5 1.1 2.2 7.6 0.98
MAC1 662 10.4 11.5 1.7 1.2 1.1 11.5 0.96
CAS1 580 3.3 5.1 1.9 0.6 1.8 18.2 0.91MAW1 660 2.6 3.0 0.9 0.7 0.5 26.9 0.92DAV1 589 2.9 4.5 1.7 0.7 1.6 24.1 0.89

time. There is also a smaller loss in accuracy inECMWF_IWV estimates. This may be explained bythe generally higher accuracy of the more sophisticat-ed ECMWF system analyses and possibly a moreaccurate calculation of ECMWF_IWV because theyinclude an extra level at 925 hPa. Thus the additionalGPS_IWV observations at 1200 UTC have the poten-tial to substantially improve the accuracy of GASPand ECMWF analyses at these sites. At both of thesesites the two assimilation-system-derived estimates at1200 UTC predominantly overestimate relative toGPS, while Table 2 shows the tendency for theradiosondes to underestimate relative to GPS. A ques-tion arises as to why the numerical analyses are show-ing a moist bias relative to the radiosonde moisturedata, when, over continental Australia, the radioson-des contribute the major source of moisture dataavailable to the assimilation systems. Clearly, this isaffected by other moisture information available forassimilation from either moisture sensitive radiancechannels of the polar-orbiting satellites or short-rangeprediction, which data assimilation combines accord-ing to their respective reliabilities. Both the ECMWFand GASP systems use NOAA Advanced TelevisionInfrared Observation Satellite Operational VerticalSounder radiative data from the Advanced
Microwave Sounding Unit and the High ResolutionInfrared Radiation Sounder. Additionally ECMWFuse Defense Meteorological Satellite Programmicrowave moisture-sensitive radiances in their sys-tem. However, such satellite data is used predomi-nantly over the oceans, and thus the positive moisturebiases relative to the radiosondes are likely to be dueto biases in physics parametrisation, which conditionthe atmosphere of the assimilation systems to have apositive moist bias. The GPS versus analysis statisticsfor ALIC and TOW2 at 1200 UTC, when radiosondesare not available, highlight the effect of modelphysics as well as prediction error.
As a summary, but also to demonstrate graphicallyan application of GPS_IWV to NWP system perform-ance monitoring, time series comparisons for January2000 for four sites, COCO, DARW, ALIC and HOB2are shown in Fig. 4. Here the number of comparisontime-points at GPS sites has been adjusted to the num-ber of radiosonde flights at 0000 UTC and 1200 UTC.For ALIC there are no 1200 UTC flights and thus noRS_IWV at that time. The time series in Fig. 4 showclearly the overall positive bias of the GPS_IWV rela-tive to the other estimates, but also show again thehigh correlation of all estimates in their variability.Note that the outlier detection carried out for the pres-
140 Australian Meteorological Magazine 55:2 June 2006
Table 3. Comparisons of RS_IWV with GASP_IWV and RS_IWV with ECMWF_IWV at 0000 UTC and 1200 UTC forthe year 2000. Outliers omitted at the 3.5 standard deviation level. N is the number of comparison time points.IWV values are expressed in mm. ALIC and TOW2 statistics are only computed for 0000 UTC.
Site ID N Ave rms Std dev Mean Std dev N rms Std dev Mean Std devRS_IWV bias /Ave bias /Ave
RS _IWV RS _IWV% %
RS_IWV – GASP_IWV at 0000 UTC,1200 UTC RS_IWV – ECMWF_IWV at 0000 UTC,1200 UTC
COCO 711 43.1 3.5 3.4 -1.0 7.9 712 3.2 3.0 -1.1 7.0
DARW 731 41.0 3.0 2.9 -0.6 7.1 730 2.9 2.9 0.1 7.1TOW2 365 32.6 3.1 2.8 -1.3 8.6 365 3.0 2.8 -1.1 8.6KARR* 771 26.8 4.3 4.1 -1.4 15.2 726 4.0 3.8 -1.3 14.5ALIC 364 19.7 2.5 2.4 -0.8 12.2 364 2.4 2.2 -0.9 11.2YAR2 463 16.9 2.7 2.4 -1.3 14.3 462 2.6 2.3 -1.3 13.8PERT 723 17.5 2.3 1.9 -1.2 10.9 717 2.8 2.1 -1.9 12.2STR1 426 12.8 3.1 2.9 -1.2 22.6 424 2.6 2.5 -0.9 19.1TID1 430 14.0 4.0 3.8 -1.2 27.1 431 3.7 3.6 -1.0 25.6HOB2 713 14.4 2.0 1.6 -1.3 11.1 716 2.2 2.0 -1.1 13.6
MAC1 712 10.3 1.4 1.3 -0.7 12.3 712 1.4 1.3 -0.5 12.7
CAS1 692 3.6 0.7 0.6 -0.3 16.7 693 0.7 0.7 -0.1 19.9MAW1 689 2.6 0.7 0.6 -0.4 22.8 690 0.5 0.5 -0.2 17.9DAV1 705 3.0 0.7 0.7 -0.3 22.4 703 0.5 0.5 -0.2 15.8
* Radiosonde flights at times other than 0000 UTC and 1200 UTC were also available and used for KARR.

entation of the comparison statistics of Tables 3, 4 and5, has not been applied to these plots. The big dips inRS_IWV in Fig. 4(b) at 0000 and 1200 UTC on 9January 2000 are the result of radiosonde humiditysensor failures during these flights.
Comparison of IWV from radiosondes with GASPfirst guessRS_IWV at 0000 UTC and 1200 UTC were also com-pared with GASPfg_IWV estimates to gauge thepotential impact of GPS_IWV in the current ABM
global assimilation. The relative average error meas-ured as a ratio of standard deviation betweenGASPfg_IWV and RS_IWV relative to year 2000average RS_IWV for stations other than Antarctica(CAS1, MAW1, DAV1) is 20.0 per cent which is larg-er than the equivalent 11.9 per cent error ofGPS_IWV to RS_IWV estimation obtained fromTable 2, column eight. In this comparison KARR,STR1 and TID1 relative errors between first guessstatistics and RS_IWV statistics are larger than atother non-Antarctic sites (as in the case of the same
Glowacki et al.: Validation of GPS-based integrated water vapour for Australia 141
Table 4. Comparisons of GPS_IWV with GASP_IWV and GPS_IWV with ECMWF_IWV at 0000 UTC and 1200 UTCfor the year 2000. Outliers omitted at the 3.5 standard deviation level. N is the number of comparison timepoints. IWV values are expressed in mm.
Site ID N rms Std dev Mean bias N RMS Std dev Mean bias No. of RS
GPS_IWV- GASP_IWV GPS_IWV- ECMWF_IWV
COCO 723 4.1 4.1 0.4 720 3.2 3.1 0.3 707
JAB1 623 4.0 4.0 0.1 621 4.2 4.1 0.3 -DARW 669 3.2 3.2 0.2 668 3.2 3.1 0.7 727TOW2 727 4.0 4.0 -0.2 725 3.5 3.5 -0.5 726KARR 691 4.1 4.1 0.3 688 3.6 3.6 0.4 724ALIC 724 4.4 4.3 0.8 722 3.2 3.1 0.6 362YAR2 590 2.4 2.4 0.3 591 2.4 2.4 -0.1 724PERT 630 2.3 2.1 -1.1 628 2.8 2.1 -1.8 718CEDU 717 3.4 3.4 -0.2 715 3.0 3.0 -0.2 -STR1 713 4.0 3.7 -1.4 710 2.2 2.2 -0.3 728TID1 554 2.5 2.4 -0.8 553 2.2 2.1 -0.8 728BUR1 535 3.1 3.1 0.1 534 2.7 2.7 0.2 -HOB2 716 2.1 1.9 1.0 711 2.2 1.9 1.1 728
MAC1 699 1.7 1.6 0.5 694 1.6 1.4 0.7 710
CAS1 708 1.8 0.9 1.6 690 2.0 0.9 1.8 687MAW1 714 1.0 1.0 0.1 711 0.9 0.8 0.3 678DAV1 646 1.7 1.0 1.4 635 1.7 0.9 1.5 700
Table 5. Comparisons of GPS_IWV with GASP_IWV and GPS_IWV with ECMWF_IWV at 0000 UTC and 1200 UTCfor the year 2000. Outliers omitted at the 3.5 standard deviation level. N is the number of comparison timepoints. IWV values are expressed in mm.
Site ID Time N rms Std dev Mean bias N rms Std dev Mean bias No ofUTC RS
GPS_IWV – GASP_IWV GPS_IWV- ECMWF_IWV
ALIC 00 364 3.3 3.1 1.4 363 3.0 2.7 1.3 362ALIC 12 360 5.3 5.3 0.3 359 3.4 3.4 -0.1 -TOW2 00 364 3.4 3.4 0.6 363 3.1 3.0 0.8 363TOW2 12 363 4.5 4.4 -1.1 362 3.9 3.5 -1.8 -

stations’ relative GPS_IWV and RS_IWV compari-son in Table 2). This can be attributed to the large dis-tance between the GPS and radiosonde or surface sta-tion sites, which adversely affects GPS_IWV accura-cy at the GPS sites. Excluding these three sites, thecomparisons between GASPfg_IWV and GPS_IWVerrors relative to radiosondes are 18.0 and 8.8 per centrespectively. It thus points to potential benefits forGASP NWP system for both analyses and forecastsfrom assimilation of GPS_IWV data.
GPS_IWV diurnal variations
Substantial variability in atmospheric water vapourcontent is known to exist on both synoptic spatialscale and observing frequency time-scales. A detailedquantification of this variability for meteorologicalpurposes is difficult without sophisticated instrumen-tation. High temporal frequency WVR and GPS datacan provide an insight into higher frequency time-
scales of IWV than that obtainable from radiosondes.Hogg et al. (1981), Rogers and Schwartz (1991),Güldner and Spänkuch (1999), Bouma and Stoew(2001) have all analysed such data for selected loca-tions that did not include Australia and were able toisolate either high frequency mesoscale fluctuationsor diurnal cycles in IWV. In Australia Dunsmuir andPhillips (1990) used 10 years of three-hourly obser-vational data from 31 sites to examine and model tem-poral variations (annual, semiannual and diurnalcycles) in surface moisture mixing ratio, which isstrongly correlated with IWV.
It is clearly desirable to have a capability for cor-rect representation of diurnal variability in the hydro-logic cycle in terms of amplitude and phase in theanalysis and prediction of moisture in NWP systems.GPS derived diurnal variations as a function of bothlocation and season should allow better verification ofNWP system moisture accuracy. Therefore time seriesof hourly GPS_IWV estimates across the Australianregion, which encompass a wide range of climatic
142 Australian Meteorological Magazine 55:2 June 2006
Fig. 4 Intercomparison of GPS_IWV, RS_IWV, GASP_IWV and ECMWF_IWV estimates during January 2000 for (a)COCO, (b) DARW, (c) ALIC and (d) HOB2. Estimates are produced for 0000 UTC and 1200 UTC, corre-sponding to the twice-daily radiosonde flights, except at ALIC where there is a single radiosonde launch at 0000UTC each day. The obvious outliers at (b) DARW in RS_IWV are due to humidity sensor failures.
(a) COCO (b) DARW
(c) ALIC (d) HOB2

conditions and capture substantial spatial IWV vari-ability (Fig. 3), were used to investigate the presenceof diurnal frequency variations in IWV. The meandiurnal GPS_IWV anomalies for the year 2000 werecomputed as described in Dai et al. (2002). Figure 5shows these anomalies for five GPS sites and a cleardiurnal variation in IWV of 1 to 2 mm amplitude maybe seen. Most of these variations are easily seen tohave a similar phase response across continentalAustralia, with morning minima between 0700 and0800 and late afternoon maxima between 1500 and1800 local solar time.
The occurrence of a systematic diurnal IWV cycleat inland sites such as ALIC is attributed to a natural-ly occurring solar-driven cycle of moisture enhancingevapotranspiration, usually peaking between mid-morning and mid-afternoon local solar time, slowingdown in late afternoon, followed by drying of theatmosphere by gradual cooling and dew formation inthe evening and overnight. Patterns like this are moredifficult to isolate in locations of substantial horizon-tal air movements and unstable weather such asCOCO, which is not shown, where the yearly aver-aged diurnal signal is weaker. Coastal sites such asDARW have their daily cycles affected by oceanicmoisture supply, land-sea contrast driven convectionand sea or land breezes. Higher latitude sites such asMAC1 and those in Antarctica are characterised by anapparent semidiurnal cycle in yearly averaged data,an effect which is in part due to the length of solar dayin high latitudes. Although a semidiurnal cycle hasalso been detected for TOW2, it is not shown.
Amplitudes of diurnal variations vary with thelevel of moisture content, with diurnal temperaturerange and are dependent on geographical location(Fig. 5), being generally larger in the moist tropicsand smaller in dry inland locations or higher latitudes.Figure 5 also indicates that the amplitude of the diur-nal signal is usually substantially lower than theamplitude of day-to-day variations in IWV as seen forcorresponding stations in Fig. 2.
The apparent similarities in the diurnal variationcharacteristics over similar geographical areas may behelpful in validating IWV from NWP systems at loca-tions where there are no GPS stations, but for whichthe diurnal variations may be approximated fromthose known at other GPS locations. Furthermore, itcan be seen in Fig. 5 that the mean hourly rate ofchange in GPS_IWV varies during the day and fromsite to site. At most sites it is most rapid during morn-ing hours when there is a sharp increase in surfacetemperature. This information may be useful whenchoosing a time-window for the assimilation of mois-ture observations from low temporal frequency meas-uring instruments such as radiosondes.
GPS_IWV and thus the amplitude of its diurnalvariation at a given location depend on ZWD and Tm,which are functions of surface pressure and tempera-ture, variables that also have diurnal variations.Quantifying the magnitude of GPS_IWV diurnal vari-ation amplitude, given the amplitudes of surface pres-sure and temperature, is not straightforward due tointerdependence of all three parameters and to otherfactors that affect ZWD and Tm independently. By fix-ing ZWD in Eqn 3 for a given Ts and using different Tmmodels, we have found a dependence of the amplitudeof GPS_IWV variations on the assumed model for the(Tm, Ts) relationship. In the case of the regressionmodel in Eqn 6, sensitivity is dependent on the regres-sion slope, which effectively scales the diurnal cycleamplitude. Our initial local estimation of (Tm, Ts)regression, using 23 years of soundings for DARW is,Tm = 208.66 + 0.27Ts. However Tm = 153.75 + 0.448Tsfor just year 2000 soundings data. For PERT, Tm =104.54 + 0.612Ts and 115.9375 + 0.57Ts for just year2000 soundings data. Locally derived regression mod-els indicate that in the case of DARW, the regressionslope should be lower for that site, and thus the respec-tive diurnal amplitude smaller. GPS_IWV values couldconsequently be revised upwards by nearly 0.6 mmwhen the corresponding Ts is low, and downwards byalmost 0.2 mm when Ts is high. On average the DARWGPS_IWV would slightly increase, but the amplitudeof diurnal variations would slightly decrease. A clearerpicture of diurnal variations could be gained with fur-ther reduction in the uncertainty in the estimation of Tmand when using GPS_IWV data from time series thatare longer than a single year. This is intended in a sub-sequent study.
Because derived diurnal variations in GPS_IWVdata are relatively small and could be induced only bydiurnal variations in temperature (Ts and thus Tm),another GPS moisture dependent variable ZWD wasexamined for the presence of diurnal variations, as itis free from temperature effects in GPS data process-ing. Figure 6 shows anomalies in ZWD for the samesites as in Fig. 5. It can be seen that the GPS_IWVand ZWD anomalies have very similar variability ateach of the five sites considered. This suggests thatvariations in GPS_IWV, and implicitly in PW, aremost likely real and not due to a Tm artifact.
Factors influencing GPS_IWVaccuracy
In the various comparisons considered here, theGPS_IWV estimation accuracy was assessed by com-paring GPS_IWV estimates with the independentIWV estimates from radiosondes and NWP systems.
Glowacki et al.: Validation of GPS-based integrated water vapour for Australia 143

The inaccuracies of radiosonde-derived water vapourproducts have long been known to be at the 5 per centor more level, approximately 1.5 mm of the globalaverage IWV (Keihm 2001). The inaccuracies arepartly due to systematic biases, and unless these areaccurately known, validation of GPS_IWV estimatesagainst radiosondes will not be better than this level,even if GPS_IWV estimates are more accurate thanRS_IWV estimates. That is assuming their errors areuncorrelated. Therefore, we now discuss three factorsthat influence the relative accuracies, namely inaccu-racies in radiosonde estimates due to dry biases, GPSdata processing inaccuracies and errors in the adop-tion of a Tm model generated from data not local tothe site considered. It is also of note that independentresearch of van der Hoeven et al. (1998) has demon-strated that GPS_IWV estimation has an accuracy thatis at least comparable to that of radiosondes and WVRmeasurements; of those two, WVR measurements areconsidered to be of somewhat higher accuracy.
Effect of radiosonde dry bias Recent findings of dry biases in Vaisala RS80-Ameasurements of relative humidity (Wang et al. 2002;Leiterer et al. 2005; Nakamura et al. 2004) suggest abetter agreement between RS_IWV and GPS_IWV islikely than indicated by Table 2. We estimated drybias corrections (see Appendix) for the radiosondesites used in this study using data from flights in theyear 2000. We followed the method of Wang et al.(2002), but tailored it to the Vaisala RS80-Aradiosonde and to the standard processing ofradiosonde data in Australia. This meant omitting thecontamination, basic calibration model and measuredground check error corrections used by ibid. For com-parison, dry bias corrections estimated according toLeiterer et al. (2005) are also shown in the Appendix.These corrections would substantially reduce themean differences between GPS_IWV and RS_IWV inTable 2 and would also contribute to the reduction ofrms errors. Recent comparisons using data collectedin Poland (Brzoska et al. 2004) found that the Leitereret al. (2005) corrections performed somewhat betterthan those of Wang et al. (2002). Nakamura et al.(2004) tested three correction methods on data col-lected in Japan and found that the method of Leitereret al. (2005) accounted for a smaller fraction of theVaisala RS80-A dry bias relative to the other twomethods, including that of Wang et al. (2002). Giventhose discrepancies in correction methods and theiroutcomes, and the lack of unbiased IWV referenceestimates (from WVR or the new more accurateVaisala RS90 radiosonde) in our study, we did notrecalculate Table 3 values with the above-mentionedcorrections.
Another consideration was that GPS_IWV esti-mates in this study were calculated using (Tm, Ts)regression, and so indirectly radiosonde moisture data(Eqn 5 for Tm uses water-vapour partial-pressure e)that were not corrected for the dry bias when used toderive this regression. NWP system analyses andforecasts in our comparisons also used uncorrectedradiosonde data.
Effect of data-processing softwareEach step of the GPS ZTD retrieval process is per-formed with a certain degree of uncertainty and eachintroduces its own instrumental, procedural andcomputational errors, such as those associated withGPS antennas, receivers and with processing algo-rithms and strategies adopted by the data analyst andalso IGS Analysis Centres. Each of these steps isbeing continually refined by the GPS geodeticresearch community, which results in smaller errors.Furthermore, this study was undertaken during atime of high ionospheric activity. The eleven-year
144 Australian Meteorological Magazine 55:2 June 2006
Fig. 6 Year 2000 mean diurnal GPS ZWD anomaliesat selected GPS locations
Fig. 5 Year 2000 mean diurnal GPS_IWV anomaliesat selected GPS locations

sunspot cycle peaked in 2000; as such 2000 repre-sents the most pessimistic scenario regardingGPS_IWV quality. The retrieval and conversionprocedures also rely on data such as corrections forocean tide loading, derived from instruments otherthan GPS receivers, and these contribute their ownuncertainties.
The current knowledge of error statistics of GPSZTDs in a meteorological context is limited. The GPSestimation of atmospheric delay parameters was per-formed in this study using the Bernese software.Other popular geodetic software, notably GIPSYfrom the Jet Propulsion Laboratory, CaliforniaInstitute of Technology and GAMIT fromMassachusetts Institute of Technology use similarmodels and methods to compute the troposphericdelay, so comparisons with such estimates provideother means of quality control. For instance, Feng etal. (2003) used GAMIT and obtained accuracies sim-ilar to those in this study. The IGS tropospheric prod-uct, namely the combination of ZTDs from (then)seven different IGS Analysis Centres that used vari-ous geodetic GPS software packages, can also be usedfor quality control, although these are only producedwith a two-hour temporal frequency. As an illustrationof the quality of the IGS tropospheric product over theyear 2000 for the sites in this study, Table 6 lists therms, standard deviation and bias of IGS derivedGPS_IWV compared with RS_IWV. Recalling Table2, it can be seen that GPS_IWV derived from the IGStropospheric product and the Bernese software usedin this study are very similar.
As mentioned earlier, relative constraints of 2mm were applied between adjacent troposphericestimates for tropospheric delay estimation as thesewere found to be a reasonable 'generic optimum'.
From a GPS perspective, different constraints maybe more appropriate for some sites than others andthe choice may also depend on the atmosphericactivity. Assigning ‘dynamic’ constraints in softwaresuch as Bernese is, at present, extremely difficult.Before choosing the 2 mm constraint, we varied theconstraint from no constraint down to 1 mm, andobtained very similar results for 1 mm and 2 mmconstraints. Overall, if the constraint is too loose,occasional large spurious spikes in ZTD arise. If theconstraint is too tight, the estimates are over-smoothed and are not sensitive to more rapid atmos-pheric changes that may be of interest.
The effect of mean atmospheric temperature onthe modelIt follows from Eqns 3 to 6 that given the ZWD esti-mate, the mean temperature model used and the accu-racy of the temperature estimate at the GPS site arethe main factors affecting GPS_IWV determinationaccuracy. For greater accuracy, models for Tm aresometimes derived locally and allow for seasonalvariations. However, Mendes et al. (2000) concludedthat ‘regionally-optimized models do not providesuperior performance compared to the global models’as ‘there is little gain in tuning the models for a par-ticular region, as regards the mean bias, and almost nogain in reducing the rms scatter’ in Tm. Two of theMendes ‘global’ mapping functions (Tm = 50.4 +0.789Ts and Tm = 196.05 + 0.000003402Ts
3) testedhere, for the DARW and PERT data, yieldedGPS_IWV consistent with those produced using Eqn6, while our locally derived regressions for these sitesyielded GPS_IWV more consistent with those basedon the Ross and Rosenfeld (1997, 1999) local formu-lae, with Guam used as a proxy for DARW.
Glowacki et al.: Validation of GPS-based integrated water vapour for Australia 145
Table 6. Differences between GPS_IWV derived from the IGS tropospheric product and RS_IWV for the year 2000.Outliers omitted at the 3.5 standard deviation level. Error values are expressed in mm.
Site ID No of comparison rms Std dev Mean bias Std dev / Ave data points RS_IWV (%)
COCO 693 3.2 2.2 2.4 5.1DARW 638 3.3 2.7 1.9 6.5TOW2 353 3.3 1.9 2.7 5.9KARR 707 5.4 4.9 2.3 18.6ALIC 334 2.9 1.6 2.4 8.4PERT 645 1.5 1.5 0.2 8.5HOB2 687 2.0 1.0 1.8 7.0MAC1 665 1.7 1.0 1.3 9.8CAS1 455 1.9 0.4 1.8 14.7MAW1 669 1.1 0.6 0.9 24.0DAV1 516 1.6 0.4 1.5 15.4

Feng et al. (2003) compared Tm estimates derivedfrom radiosonde data for July-September 2000 forfive Australian GPS sites and from the regressionmodel of Bevis et al. (1992), obtaining very similarresults for both methods. Infrequent and sparseradiosonde reports are, however, less practical forestimation in real-time hourly applications. Vey et al.(2004) report (after Schuler 2001; Bevis et al. 1994)that using site specific Tm derived from NWP systemsrather than a global relation reduces the IWV relativeerror from 2 to 1 per cent. For assimilation ofGPS_IWV observations into a NWP system, directTm estimation from NWP system outputs should beconsidered.
Conclusions
The quality of GPS_IWV across the Australian regionhas been assessed using data for the whole of 2000from seventeen sites distributed across a wide rangeof climates. For eight GPS sites (COCO, DARW,TOW2, ALIC, YAR2, PERT, HOB2, MAC1) eitherco-located or close to (average separation of 24 km)radiosonde launch sites, an average error ofGPS_IWV relative to RS_IWV estimation standarddeviation was 8.8 per cent. This error would be some-what smaller if all GPS sites were co-located with sur-face weather stations and radiosonde sites.Furthermore, mean biases found in GPS_IWV esti-mates relative to RS_IWV estimates would be furtherreduced if RS_IWV estimates were corrected for thedry bias in the Vaisala RS80-A relative humiditymeasurements. For Antarctica the GPS_IWV stan-dard deviation errors were found to be about 18 to 21per cent, which is a relatively large value.
The ABM NWP system six-hour forecasts, used asa first guess in operational data assimilation, werefound to have relative IWV errors with respect toradiosondes of 20.0 per cent for all radiosondes in thisstudy except for those in Antarctica in the year 2000data. Since GPS_IWV estimates can be obtained dur-ing all weather conditions and have a high temporalfrequency, timely and accurate GPS moisture obser-vations, when converted to proxies for moisture pro-files in NWP assimilation, have the potential toreduce IWV errors. Modest positive impacts havealready been noted elsewhere in the world, as detailedby Gutman et al. (2004) for continental USA. Thesites ALIC and TOW2, where radiosondes are onlylaunched once per day at 0000 UTC, well illustratethe potential benefit resulting from the assimilation ofhigher temporal frequency GPS moisture data. The1200 UTC GASP_IWV estimates were clearly shownto be less satisfactory than those for 0000 UTC
reflecting the absence of radiosonde data at this time.Since early 2004 the ABM is launching radiosondespredominantly at 0000 UTC, with occasional 1200UTC radiosondes on an ad hoc basis.
In addition, the following conclusions, outlooksand recommendations can be made:• GPS offers a promising total column water vapour
estimation system for the Australian region.• The comparison of GPS and radiosonde derived
IWV indicates accuracies similar to those reportedin previous studies and these accuracies validatethe applied methodology and software used toderive GPS_IWV. Relative accuracies ofGPS_IWV estimates with respect to radiosondesshow dependence on the amount of atmosphericmoisture. Standard deviations are larger in the trop-ics and small in Antarctica. Further study of theaccuracy of GPS_IWV estimates, particularly bias-es relative to RS_IWV, is recommended. It wouldbe desirable to compare GPS_IWV against addi-tional independent measurements of IWV, such asavailable from the more accurate WVRs. Issuesregarding the GPS processing technique requireinvestigation and refinement, particularly the treat-ment of new antenna phase centre models and map-ping functions currently under development.
• GPS_IWV can be used for monitoring the per-formance of data assimilation and prediction sys-tems over an extended period of time and on adaily basis. Relevant comparisons may be usedfor detecting moisture biases in NWP systems.
• The GPS_IWV estimation accuracy warrants itsuse in the ABM assimilation systems, except atthis time, for Antarctica. Furthermore, directassimilation of ZTD or ZWD is also warranted andpossibly more preferable given that it is unaffectedby the issues in estimating Tm. Despite their smallnumber, GPS moisture estimates have potential toenhance moisture analyses in data assimilationbecause of the relatively low spatial and temporalfrequency of the current radiosonde networkacross the Australian region.
• Significant diurnal GPS_IWV variations werefound to exist at most of the GPS sites across theAustralian region, which have not been reportedpreviously because radiosonde measurements at0000 UTC and 1200 UTC are not able to representthe amplitude or phase of the diurnal cycle. Theamplitude of the GPS-based estimate of the diurnalcycle is clearly dependent on the (Tm,Ts) regres-sion accuracy.
• ZTD was converted to IWV using surface temper-ature data as the input to a regression model devel-oped to replicate the mean atmospheric tempera-ture obtained from radiosonde profiles across the
146 Australian Meteorological Magazine 55:2 June 2006

USA. The derivation of local mean atmospherictemperature models should be undertaken.
• This validation study used IGS ‘final’ orbits (avail-able with a latency of approximately 13 days).However, since the IGS real-time orbital productand the IGS Ultra Rapid Orbit has been shown(Dousa 2001) to provide similar quality results topost-processed applications, the operational appli-cation of near real-time GPS_IWV in the ABMNWP data assimilation system should now be feasi-ble. Implementing such a system operationally willdepend on the successful demonstration of the useof the GPS_IWV estimates in the current assess-ment experiments and the testing of the quality ofreal-time orbits across the Australian region.
Acknowledgments
We acknowledge the contribution of Jaan Paeverefrom the Bureau of Meteorology Research Centre fordiscussion on the relationship between diurnalGPS_IWV variations and local weather patterns andare grateful to Richard Coleman from the Universityof Tasmania for access to the Burnie GPS data.Agnes Apostolou from the Bureau of MeteorologyObservations and Engineering Branch was very help-ful in pointing out and dealing with the Vaisala RS80-A dry bias issues. The authors would also like to thankall reviewers of this paper, of whom we are able toname Robert Seaman, Jeffrey Kepert and Peter May,for their useful and insightful comments.
ReferencesAskne, J. and Nordius, H. 1987. Estimation of tropospheric delay for
microwaves from surface weather data. Radio Sci., 22, 379-86.
Baker, H.C., Dodson, A.H., Penna, N.T., Higgins, M. and Offiler, D.2001. Ground-based GPS water vapour estimation: potential formeteorological forecasting. J. Atmos. Sol-Ter. Phys., 63, 1305-14.
Bevis, M., Businger, S., Chiswell, S., Herring, T.A., Anthes, R.A.,Rocken, C. and Ware, R.H. 1994. GPS meteorology: mappingzenith wet delays onto precipitable water. Jnl Appl. Met., 33,379–86.
Bevis, M., Businger, S., Herring, T.A., Rocken, C., Anthes, R.A. andWare, R.H. 1992. GPS meteorology: remote sensing of atmos-pheric water vapor using the Global Positioning System. J.Geophys. Res., 97, 15787-801.
Boucher, C., Altamimi, Z., Sillard, P. and Feissel-Vernier, M. 2004.The ITRF2000. IERS Technical Note 31, Frankfurt am Main:Verlag des Bundesamts für Kartographie und Geodäsie, 289 pp.
Bouma, H.R. and Stoew, B. 2001. GPS observations of daily varia-tions in the atmospheric water vapor content. Phys. Chem.Earth., 26, 389-92.
Bourke, W., Hart, T., Steinle, P., Seaman, R., Embery, G., Naughton,M. and Rikus, L. 1995. Evolution of the Bureau of Meteorology'sglobal assimilation and prediction system. Part 2: resolutionenhancements and case studies. Aust. Met. Mag., 44, 19-40.
Brockmann, E. 1996. Combination of Solutions for Geodetic and
Geodynamic Applications of the Global Positioning System(GPS). Inauguraldissertation der Philosophisch-naturwis-senschaftlichen Fakultat der Universtitat Bern, 211 pp.
Brzoska, B., Jaczewski, A. and Litynska, Z. 2004. Homogenisation ofwater vapour data from RS-80 and RS-90 radiosondes. COST723 Workshop, Noordwijk, The Netherlands, 11-13 March 2004.
Dai, A., Wang, J., Ware, R.H. and Van Hove, T. 2002. Diurnal vari-ation in water vapor over North America and its implications forsampling errors in radiosonde humidity. J. Geophys. Res., 107,doi: 10.1029/2001JD000642.
Davis, J.L., Herring, T.A., Shapiro, I.I., Rogers, A.E.E. and Elgered,G. 1985. Geodesy by radio interferometry: effects of atmospher-ic modeling errors on estimates of baseline length. RadioScience, 20, 1593-607.
Dick, G., Gendt, G. and Reigber, C. 2001. First experience with nearreal-time water vapor estimation in a German GPS network. J.Atmos. Sol-Ter. Phy., 63, 1295-304.
Dong, D., Fang, P., Bock, Y., Cheng, M.K. and Miyazaki, S. 2002.Anatomy of apparent seasonal variations from GPS-derived siteposition time series. J. Geophys. Res., 107(B4),doi:10.1029/2001JB000573.
Dousa, J. 2001. The impact of ultra-rapid orbits on precipitable watervapor estimation using a ground GPS network. Phys. Chem.Earth. Part A, 26, 6-8, 393-8.
Duan, J., Bevis, M., Fang, P., Bock, Y., Chiswell, S., Businger, S.,Rocken, C., Solheim, F., van Hove, T., Ware, R., McClusky, S.,Herring, T.A. and King, R.W. 1996. GPS meteorology: directestimation of the absolute value of precipitable water. Jnl App.Met., 35, 830-8.
Dunsmuir, W.T.M. and Phillips, D.M. 1990. Modelling of temporalvariation of atmospheric moisture at surface level in theAustralian region. Aust. Met. Mag., 38, 181-9.
Elgered, G. 1993. Tropospheric radio-path delay from ground-basedmicrowave radiometry. Atmospheric Remote Sensing byMicrowave Radiometry, M.A Janssen, Ed., John Wiley and Sons,215-58.
Elgered, G., Davis, J.L., Herring, T.A. and Shapiro, I.I. 1991.Geodesy by radio interferometry: water vapor radiometry forestimation of the wet delay. J. Geophys. Res., 96, 6541-55.
Feng, Y., Bai, Zh., Fang, P. and Williams, A. 2003. GPS water vapourexperimental results from observations of the AustralianRegional GPS Network. Geomatics Research Australasia, 79,21-41.
Ge, M., Calais, E. and Haase, J. 2000. Reducing satellite orbit erroreffects in near real-time GPS zenith tropospheric delay estima-tion for meteorology. Geophys. Res. Lett., 27(13), 1915-18.
Gueymard, C. 1993. Assessment of the accuracy and computingspeed of simplified saturation vapor equations using a new refer-ence dataset. Jnl App. Met., 32(7), 1294-300.
Güldner, J. and Spänkuch, D. 1999. Results of year-round remotelysensed integrated water vapour by ground-based microwaveradiometry. Jnl App. Met., 38, 981-8.
Gutman, S.I, Sahm, S.R., Benjamin, S.G., Schwartz, B.E., Holub,K.L., Stewart, J.Q. and Smith, T.L. 2004. Rapid retrieval andassimilation of ground-based GPS precipitable water observa-tions at the NOAA Forecast Systems Laboratory : impact onweather forecasts. J. Met. Soc. Japan, 82, 351-60.
Hogg, D.C., Guiraud, F.O. and Sweezy, W.B. 1981. The short-termtemporal spectrum of precipitable water vapor. Science, 213,1112-13.
Hugentobler, U., Schaer, S. and Fridez, P. 2001. Bernese GPSSoftware Version 4.2 User Manual, Astronomical Institute,University of Bern, Switzerland.
Keihm, S.J. 2001. WVR intercomparisons from the CART site Fall2000 WVIOP. JPL Technical Reports Server(http://hdl.handle.net/2014/13177).
Leiterer, U., Dier, H., Nagel, D., Naebert, T., Althausen, D., Franke,K., Kats, A. and Wagner, F. 2005. Correction method for RS80-
Glowacki et al.: Validation of GPS-based integrated water vapour for Australia 147

A humicap humidity profiles and their validation by lidarbackscattering profiles in tropical cirrus clouds. J. Atmos.Oceanic. Tech., 22(1), 18-29.
Liou, Y.A., Teng, Y.T., van Hove, T. and Liljegren, J.C. 2001.Comparison of precipitable water observations in the near tropicsby GPS, microwave radiometer, and radiosondes. Jnl App. Met.,40, 5-15.
McCarthy, D.D. 1996. IERS conventions. IERS Technical Note, 21.US Naval Observatory.
Mendes, V.B., Prates, G., Santos, L. and Langley, R.B. 2000. An eval-uation of models for the determination of the weighted meantemperature of the atmosphere. Proceedings of The Institute ofNavigation 2000 National Technical Meeting, Anaheim, CA,USA, 26-28 January 2000, 433-438.
Nakamura, H., Seko, H. and Shoji, Y. 2004. Dry biases of humiditymeasurements from the Vaisala RS80-A and Meisei RS2-91radiosondes and from ground-based GPS. J. Met. Soc. Japan. 82,277-99.
Niell, A.E. 1996. Global mapping functions for the atmosphere delayat radio wavelengths. J. Geophys. Res., 101, 3227-46.
Ray, R.D. 1999. A global ocean tide model from TOPEX/POSEI-DON altimetry: GOT99.2. NASA Technical Memorandum209478.
Rogers, R.R. and Schwartz, A.P. 1991. Mesoscale fluctuations ofcolumnar water vapor. Jnl App. Met., 30, 1305-22.
Ross, R.J. and Rosenfeld, S. 1997. Estimating mean weighted tem-perature of the atmosphere for Global Positioning System appli-cations. J. Geophys. Res., 102, 21719–30.
Ross, R.J. and Rosenfeld, S. 1999. Correction to ‘Estimating meanweighted temperature of the atmosphere for Global PositioningSystem applications’. J. Geophys. Res., 104, 27625.
Saastamoinen, J. 1972. Atmospheric correction for the troposphereand stratosphere in radio ranging of satellites. The Use ofArtificial Satellites for Geodesy, Geophys. Monogr., 15, Amer.Geophys. Union, 247–51.
Seaman, R., Bourke, W., Steinle, P., Hart, T., Embery, G., Naughton,M. and Rikus, L.1995. Evolution of the Bureau of Meteorology'sGlobal Assimilation and Prediction System. Part 1: analysis andinitialisation. Aust. Met. Mag., 44, 1-18.
Schuler, T. 2001. On Ground-Based GPS Tropospheric DelayEstimation. PhD thesis, Universitat der Bundeswehr Munchen,Studiengang Geodasie und Geoinformation.
Simmons, A.J. and Hollingsworth, A. 2002. Some aspects of theimprovement in skill of numerical weather prediction. Q. Jl R.Met. Soc., 128, 647-77.
Tregoning, P., Boers, R., O'Brien, D. and Hendy, M. 1998. Accuracyof precipitable water vapour estimation from GPS observations.J. Geophys. Res., 103, 28901-10.
van der Hoeven, A.G.A., Ambrosius, B.A.C., van der Marel, H.,Derks, H., Baltink, H.K., van Lammeren, A. and Kösters A.J.M.1998. Analysis and comparison of integrated water vapor esti-mation from GPS. Proceedings of the ION GPS 98 conference,Dierendonck, A.J. and Klobuchar, J. Session A3 AtmosphericEffects: Nashville, USA, September 15-18, 749-55.
Vedel, H., Huang, X.-Y., Haase, J., Ge, M. and Calais, E. 2004.Impact of GPS zenith tropospheric delay data on precipitationforecasts in Mediterranean France and Spain. Geophys. Res.Lett., 31, L02102, doi:10.1029/2003GL017715.
Vey, S., Dietrich, R., Johnsen, K.-P., Miao, J. and Heygster, G. 2004.Comparison of tropospheric water vapour over Antarcticaderived from AMSU-B data, ground-based GPS data and theNCEP/NCAR reanalysis. J. Met. Soc. Japan, 82, 1B, 259-67.
Wang, J., Cole, H.L., Carlson, D.J., Miller, E.R., Beierle, K.,Paukkunen, A. and Laine, T.K. 2002. Corrections of humiditymeasurement errors from the Vaisala RS80 radiosonde - applica-tion to TOGA-COARE data. J. Atmos. Oceanic. Tech., 19, 981-1002.
WMO 1968. Methods in use for the reduction of atmospheric pres-sure, WMO Technical Note No. 91. World Meteorological
Organization.
Appendix
Average RS_IWV corrections resulting from dry biascorrections to year 2000 radiosondes’ relative humid-ity (RH) reports. Two correction methods compared:‘W’, after Wang et al (2002); ‘L’, after Leiterer et al.(2005). RS_IWV estimates were done and correctionscomputed for GPS sites from nearby radiosonde data.‘W’ corrections include age corrections for theVaisala RS80-A sensor. If corrections are appliedRS_IWV values should be revised upwards.
GPS ‘W’ RH ‘L’ RH No of RS RSID correction correction cases station average
(mm IWV) (mm IWV) number (years)
COCO 1.14 2.50 718 200284 0.61DARW 1.08 2.36 735 14015 0.65TOW2 1.35 1.90 368 32040 1.00KARR 1.06 1.58 808 4032 0.83ALIC 1.02 1.13 366 15590 0.64YAR2 0.99 0.97 466 8051 0.66PERT 1.00 1.00 730 9021 0.70HIL1 1.00 1.02 730 9021 0.70STR1 0.83 0.75 432 72150 0.65TIDB 0.86 0.80 432 72150 0.65BUR1 0.89 0.86 728 72150 0.65HOB2 0.88 0.84 728 72150 0.65MAC1 0.70 0.60 725 300004 0.86CAS1 0.42 0.22 705 300017 0.95MAW1 0.38 0.16 698 300001 1.03DAV1 0.39 0.19 714 300000 0.99
148 Australian Meteorological Magazine 55:2 June 2006