validation and statistical assessment of heat syndromic data
TRANSCRIPT

Validation and Statistical Assessment of Heat Syndromic Data
Stacey Hoferka, MPH, MSIS National Heat-Health Surveillance Expert Workshop
New York City, NY March 17, 2015

Presentation Overview • Chicago & Illinois experience and response
– Historic – Infrastructure
• Stakeholders – Emergency Preparedness – Climate change
• Analysis – System comparison – Definition comparison – Broad risk assessment
• Next Steps – New data – New methods

Chicago Heat Wave, 1995 • 5 days: July 12-16th
– Max Heat Index = 120 – High night temps – Urban heat island effect – Power failures – Hospitals on bypass
• 700+ deaths • Over 1000 HRI hospitalizations • At risk:
– Elderly – Male – African Americans – Poor - without AC
• Common factor: isolation http://www.isws.illinois.edu/atmos/statecli/general/1995chicago.htm

Landscape - then • Debate: “really real”
– Cook County Medical Examiners Office • 465 deaths /3 days
– City officials “It’s hot…not blow this out of proportion”
• “I still remember the back and forth debates on TV about the ‘correct numbers of heat related deaths’ between the Mayor’s office and the Cook County Medical Examiner’s Office.“ (T.Shen)
• “The situation got out of hand quickly. Dead bodies piled up in commentaries and because so many were not claimed by any relatives (an evidence of living alone was a risk factor), mass burials were conducted” (T. Shen)
*Interview with Eric Kinkenberg. http://www.press.uchicago.edu/Misc/Chicago/443213in.html ** Tiefu Shen – comments from the EIS experience in Chicago in 1995

Perspectives & Study Findings • Was 1995, weather-related?
– “Climate”-related: Political, economic, social – Climate models: failed to detect relationships b/w
weather & mortality that would explain what happened in July 1995 in Chicago (Whitman, AJPH 1997)
• Challenge: difficult to assess true risk of HRI – Deaths even with the broad heat-related fatality
definition used by the Cook County medical examiner compared with excess all-cause mortality was underestimate [19 vs. 24-25 per 100,000] (Shen, AJFMP, 1998)

Landscape –recent years • Hospital Reporting HRI in ED
– Conducted in the hospital bypass system (HBS) – Limited to Chicago region – Manual entry by hospital staff – Implemented intermittently on as needed daily basis
• Dependent of heat advisories, watches and warnings
• Resources – Warnings and messaging aligned with NWS – Cooling centers – Transportation – Social service and police checks on elderly
• Expanded monitoring – Manual 2x daily entry into HBS June-September – Alternative: utilize automated, statewide syndromic surveillance data

Study: System Comparison ESSENCE with Hospital Bypass, 2013
• Correlation higher with bypass
System consideration • Representativeness • Historic trends • Automated/manual • Different users • Different definitions • Different collection • Different queries • Timeliness
Bahena, Fabien. Comparison of 2 Syndromic Surveillance Systems Over 3 Year Period During Extreme Heat Events in Chicago12/5/13

Stakeholders for Heat-Related Illness • Immediate Response
– Health Departments: State & local – Emergency Preparedness – Other government agencies (i.e. police, park districts, schools) – Organizations
• Red Cross • Salvation Arm
• Long-term planning – BRACE (Building Resilience Against Climate Effects) Grantee
• Collaboration with University of Illinois at Chicago & IDPH • Working on a long-term climate response plan
– Midwest BRACE Group • Collaboration of grantees
– Climate and Health Syndromic Surveillance Workgroup – Region 5 workshop
• May 2013, use case for data sharing workshop / discussion
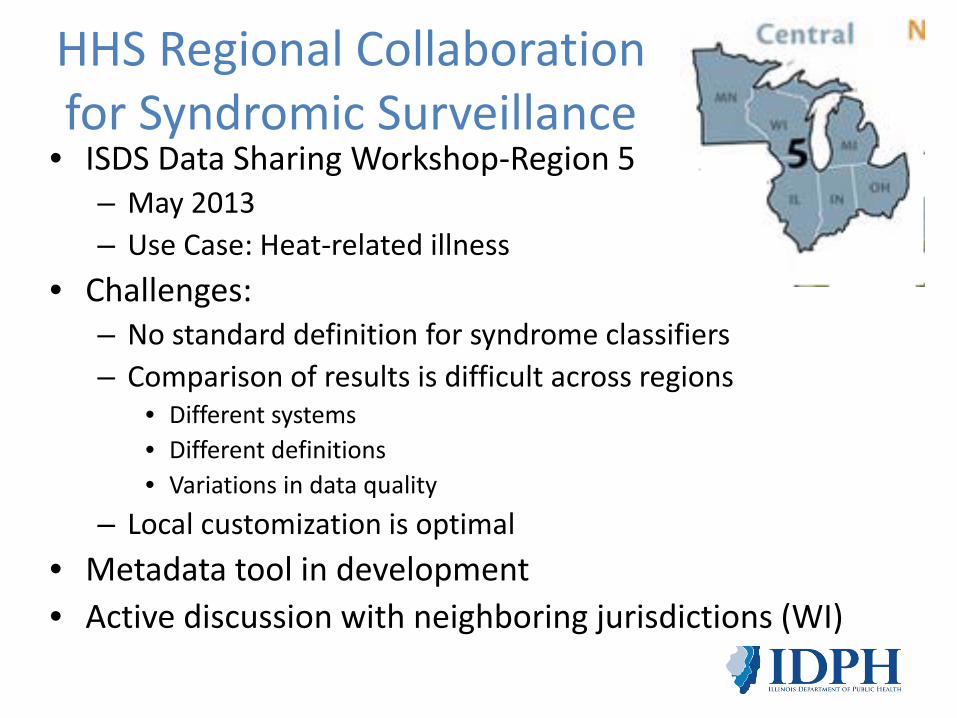
HHS Regional Collaboration for Syndromic Surveillance
• ISDS Data Sharing Workshop-Region 5 – May 2013 – Use Case: Heat-related illness
• Challenges: – No standard definition for syndrome classifiers – Comparison of results is difficult across regions
• Different systems • Different definitions • Variations in data quality
– Local customization is optimal • Metadata tool in development • Active discussion with neighboring jurisdictions (WI)

Study: Definition Comparison Heat-Related Illness, 2013
Objective: To determine differences in case detection using different syndrome definitions for heat effects

Results Accuracy CC (local)
N (%) DD (local)
N (%) ESSENCE-defined
N (%) BioSense 2.0-defined
N (%) Correct 417
(91.2) 338
(98.5) 305 (99.0) 616 (89.8)
Incorrect 36 (7.9) 5 (1.5) 0 (0) 45 (6.6) Likely 4 (0.9) 0 (0) 3 (1.0) 25 (3.6) Total 457 343 308 686
141 Matched by CC
207 Matched by DD
77 Matched CC & DD
Patel M., Hoferka S. An Evaluation of Heat-Related Emergency Department Visits Based on Differences in Heat Syndrome Definitions in Northern Illinois. 2013 ISDS conference

Application of Final Definition
0
5
10
15
20
25
30
35
40Heat Related Emergency Visits, Northern IL, Jun - Aug 2013
Accuracy CC N (%)
DD N (%)
CC & DD N (%)
Correct 222 (99.6)
193 (98.8)
368 (99.2)
Incorrect 1 (0.4)
2 (1.0)
3 (.8)
Likely 0 (0) 0 (0) 0 (0)
Total 223 195 371
Age Group N (%)
00-01 9 (2.4)
02-04 8 (2.2)
05-17 65 (0.2)
18-44 144 (38.4)
45-64 90 (24.3)
65+ 55 (14.9)
Total 371
Illinois Infrastructure • Illinois
– State-wide syndromic surveillance implementation, 2012 – Representation is 75% of ED visits captured, 125 hospitals (N=185) – Mandate for 100% reporting by end 2014 – Use National Syndromic Surveillance Program to store / process data – 9,500 visits/day – 1 M messages/month – HL7 and Meaningful Use – Data and facility management – standard DQ
• Cook County
– 45 facilities in Northeastern Illinois – 10+ years of data – Use ESSENCE

Strategy Routing of Public Health Messages
IGA with IDPH
2014 CCHIT certified software
DUA with IDPH (agent
of state)

Surveillance in Illinois, 2014

Research – Broad Definitions • Limited studies of non-fatal HRI • Hospital Discharge data (Semenza)
– Primary diagnoses: Dehydration, heat stroke, heat exhaustion, acute renal failure,
– Co-morbidities associated with HRI: CVD, diabetes, renal disease, nervous system disorders (65+ pop)
• ED visits (Knowlton) – CA – 2006 – Increase in ED visits not hospitalization – Stratified by age, race/ethnicity, region, condition – Case-crossover – Increase acute renal failure, CVD (Hispanic), diabetes, electrolyte
imbalance (<5), nephritis
• Hospital admissions in elderly (Bobb)-1999-2010 – 283 primary diagnosis categories – Increases electrolyte /fluid disorders, renal failure, urinary tract
infections, septicemia, and heat stroke

Study: Illinois Cause-Specific Risk Analysis, 2015
• Identify causes of ED visits during heat, measure risk (Patel. M, et. al.)
• Daily counts • Defined coronary disease, MI, stroke, diabetes, acute renal
disease, nephritis, electrolyte disorders, heat stress (2009-2014)
• Poisson regression, matched baseline • Heat days: two or more days w/daily Tmax > 97, 98, 99
percentile • Increased risk electrolyte disorders, nephritis, acute renal
disease.
Impact of heat events on ED visits _pending APHA abstract.

Solution Requirements: How to count things right?
• Accurately characterizing weather-related illness – Broad vs. narrow case/syndrome definitions – All-cause excess morbidity – Cause-specific risk ratio – Stratified by (age, gender, race/ethnicity)
• Visualization / Dashboard • New Methods
– Dan Neil • Asyndromic –text patterns undefined by syndrome • Pre-syndromic –known health-related exposure** (heat) • Multiple data stream analysis
– ISDS Technical Conventions Committee use case

Broader Solution Applications • Cold-related illness • Effect on mental illness & violence • Floods & other natural events
– Hurricanes-displacement
• Large event / mass-casualty • Targeted interventions

Final Thoughts
• Tiefu Shen, December 2014 – “Now if we think about it, we can’t help but
wonder how much time was wasted by questioning and confirming numbers, and how many lives could have been saved if the door-to-door visit were organized earlier and cooling centers were opened earlier.”

References •
• Knowlton K, Rotkin-Ellman M, King G, Margolis HG, Smith D, Solomon G, Trent R, English P. The 2006 California heat wave: impacts on hospitalizations and emergency department visits. Environ Health Perspect. 2009 Jan;117(1):61-7. doi: 10.1289/ehp.11594. Epub 2008 Aug 22.
• Patel MT, Hoferka S. An Evaluation of Heat-Related Emergency Department Visits Based on Differences in heat Syndrome Definitions in Northern Illinois. Online Journal of Public Health Informatics. 2014; 6(1).
• Semenza JC, McCullough JE, Flanders WD, McGeehin MA, Lumpkin JR. Excess hospital admissions during the July 1995 heat wave in Chicago. Am J Prev Med. 1999 May;16(4):269-77.
• Shen T, Howe HL, Alo C, Moolenaar RL. Toward a broader definition of heat-related death: comparison of mortality estimates from medical examiners' classification with those from total death differentials during the July 1995 heat wave in Chicago, Illinois. Am J Forensic Med Pathol. 1998 Jun;19(2):113-8.
• Whitman, S., Good, G., Donoghue, E. R., Benbow, N., Shou, W., & Mou, S. (1997). Mortality in Chicago attributed to the July 1995 heat wave. American Journal of public health, 87(9), 1515-1518.