vales oatio liberating - esselpropack.com · such brands can soon feel liberated that essel’s...
TRANSCRIPT

Essel Propack Limited
Annual Report 2017-18
MAKING SUSTAINABILITY THE BUSINESS’ DNA
CSR
Environment
Products
Innovation
Technology & Process
Values
...LIBERATING...LIBERATING

Disclaimer:This document contains statements about expected future events and financial and operating results of Essel Propack Ltd., which may constitute “forward-looking statements”. By their nature, forward-looking statements require the Company to make assumptions and are subject to inherent risks and uncertainties. There is significant risk that the assumptions, predictions and other forward-looking statements may not prove to be accurate. Readers are cautioned not to place undue reliance on forward-looking statements as a number of factors could cause assumptions, actual future results and events to differ materially from those expressed in the forward-looking statements.
ContentsSustainability as Essel’s DNA
Message from Chairman & Managing Director
Driving Sustainability Liberating Brands
CSR, Awards & Accolades and Financial Highlights
Directors with Leadership Team
Corporate Information
Board’s Report
Management Discussion and Analysis
Corporate Governance Report
Financial Statements - Standalone
Financial Statements - Consolidated
01
02
04
06
08
09
10
18
25
67
127
SUSTAINABILITY is one of ESSEL’s intrinsic values. Our patented products like Green Maple leaf and Etain provide for efficient re-cycling and consequent reduced carbon footprint. The challenge for any Packaging solution is how to meet the various functionality needs of brands such as safety, protection to the product, ease of use and aesthetic look and feel, in an eco-friendly way. Often the functionality considerations may prevail over the use of a sustainable packaging solution. There is no one size fit all here.
At Essel, we therefore are committed to the cause of Sustainability not only by offering innovative products such as Green Maple leaf, but also by creating solutions for efficient re-use and re-cycling where the functionality needs require the brand to use traditional laminate structures.
The two exquisite laminated tubes you see below, one with a unique triangle shape and rich decoration designed to highlight the premium nature of the product it contains which is a Restoring Cleansing foam; and the other which is a specialty tube designed to pack a sensitive product viz. Sunblock cream, and provided with a unique colour change property when exposed to harmful UV rays outdoor to signal the consumer to apply the cream. Both these tubes use a metal barrier embedded in the laminate on functionality considerations.
Such brands can soon feel liberated that Essel’s newly identified LIBERTY Technology can separate the metal and the plastic components in an eco-friendly manner and without harming either, so that the two fractions can be most efficiently re-used/re-cycled.
This is but one way we Make Sustainability the Business’ DNA…

Today, when across the globe, Environment and Sustainability hold the centrestage, urging brands to go Green, it is most LIBERATING for our customers to have in Essel an enlightened long-term supply partner ready to power their Brand innovations with unique Sustainable packaging solutions designed to win the hearts and minds of increasingly environment-conscious consumers, the world over.
MAKING SUSTAINABILITY THE BUSINESS’ DNA, is truly LIBERATING…
Essel’s R&D with its deep understanding of material science, has been the fountainhead of rapidly-evolving laminate structures which demonstrate Essel’s ethos of caring for environment in everything we do. Besides R&D, from products to processes, materials to machines, governance to CSR, every aspect of Essel’s business is committed to Environmental and Sustainability considerations, BECAUSE it is THE Right thing to do; it is THE Responsibility to Society, that we own with pride; and, it is THE stakeholders’ expectation of us as the global leader in laminated tubes.
At Essel Propack, SUSTAINABILITY as a credo has been internalized ever since we commenced our journey in the early eighties, so much so it now MAKES THE BUSINESS’ DNA. Every step of our journey has seen us innovate in products, processes, materials, technology and design with a single-minded focus on how we can further the cause of resource reduction, re-use and re-cycling as much as on how we can delight
customers and create value for our stakeholders.
01Annual Report 2017-18

MESSAGE FROM CHAIRMAN AND MANAGING DIRECTORDear ShareholdersIt is that time of the year again when I have the privilege of apprising you of the activities during the year gone by.
I am happy to announce that with your good wishes, your Company has maintained a steady performance.
During FY18, the Company’s Consolidated Revenue was up 5.3% year-on-year at ` 2,424 Crores (exclusive of excise duty recovery) and Net Profit at ` 171.6 Crores. Despite the temporary setback during the GST roll out and implementation in India and the challenges that are an integral part of any expansion project (Wada, Vapi - injection moulding & Colombia), the Company has maintained its growth trajectory and has charted out a strategic roadmap, that besides helping sustain and boost growth, is also conducive to adapt to the changing needs of customers and business dynamics. “Customer Centricity” being one of our core values is always the pivot of our innovations, processes and technology.
Two major developments in recent times pose both challenges and opportunity for us – challenges in the short term; opportunities in the long term.
The first is the call for ‘Sustainability’, which we are continuously addressing, the latest being our “sustainable innovations” Etain and Green Maple Leaf, details of which have been communicated earlier. The call for sustainability has reached new heights and now includes finding solutions for disposal of waste generated as well as handling the material post use. The social and legal obligations on the manufacturer and Brands to ensure eco-friendly waste collection and disposal is increasing by the day. For us, this means handling our laminate and tube scrap, and the best way for this is to recycle them; recycling helps recover valuable material besides trying to make it economically viable.
Our Plastic Based Laminate poses no problem for recycling since it consists only of polymers. It is the Aluminium Based
Laminate (ABL) that poses a challenge since it has metal (aluminium) and polymer. We have been working on finding a solution for recycling ABL for 3-4 years now and I am happy to inform you that your Company is once again “first mover”; we have identified a process and technology that will facilitate electrostatic separation of polymer and metal. As a result, the polymer and metal can go into their respective recycling chains without any degradation during the process of liberation, without the use of heat or chemicals. We have christened this Project “Liberty”. It will be rolled out in India this year and subsequently to all our units. Later, we propose to offer the facility to our customers, should they want us to re-cycle them after the end of the consumer cycle.
The second challenge is the new flourishing business form – E-Retail or E-Commerce. It is a big disruptor globally as far as supply-chain is concerned. The established brands are struggling to compete with the mushrooming new brands, that just launch themselves on the e-commerce platform. They are gaining quite a bit of market share thanks to the advancement of internet and online technology. The tech savvy millennial population and Gen X are active on social media with a natural propensity to try new products, buying them online from e-commerce sites. This trend causes volatility and uncertainty in the offtake of existing brands in traditional forms of business on the one hand, while the newer ones on e-platform gain currency. The established players are grappling with the need to understand the on-ground scenario and find a solution to respond to the disruption caused by e-commerce. For us, this volatility makes the forecasts given to us by our Customers less reliable. Volatile forecasts and established Brands losing market share gives rise to need for us to fill in the gap in volumes. The mushrooming new brands on the e-commerce platform provides us ample opportunity.
However, to take advantage of this, we need to introspect – go into a self-disruption mode to change the way we do business, because here, speed to market is the essence. We have deliberated the situation internally and have
02 03Annual Report 2017-18
begun working on solutions that will help us gain share and to be ready for the future, when e-commerce retailing becomes a way of life. The plan of action involves identifying bottlenecks and if need be, changing some of our processes and/or adapting technology to debottleneck production and be able to respond faster to changing needs of existing customers as well as prospective new ones. Our front end teams need to coordinate with the established Brands and give them their requirement while at the same time, meet with and evaluate opportunities with the new brands emerging owing to change in the delivery system viz. new market place, referred to as e-commerce.
In short, we need to be Lean, Hungry and Fast to stay ahead. We must change the rules of the game – do what it takes to accelerate speed of seizing new opportunities and executing them.
The entire organisation is fully charged up and I am confident that together, we will meet the targets we have set for ourselves. “THE OLD ORDER (TRULY) CHANGETH, YIELDING PLACE TO NEW….”
I would like to thank our valued Customers, Suppliers, Bankers and all our Stakeholders including the Shareholders, for their continuous support in all our endeavours, the Board of Directors for their guidance and encouragement, Esselites across the globe for their never-say-die attitude and commitment, all of which have contributed to the growth of your Company.
Ashok Goel Chairman & Managing Director
We have been working on finding a solution for recycling Aluminium Based Laminate (ABL) for 3-4 years now and I am happy to inform you that your company is once again “first mover”.
02 03Annual Report 2017-18

Green MapleLeaf Laminate,(Recycle Code-2)
Etain Laminate, up to 40% Post consumer regrind
• Foil-less PBL Laminate• Source reduced Laminate (250 micron)
Laminate with only aluminum foil & Polymer (thinner foil)
Combination laminate with Paper,Aluminum & Polymer(330 micron)
1980199020002010
2017
DRIVING SUSTAINABILITY LIBERATING BRANDS
PRODUCTS AND MATERIALSOver the three decades of existence, we have transformed the laminated tubes with higher and higher levels of resource reduction, recyclability and environmental conservation. Deep knowledge of the polymer science coupled with an equally deep commitment to Sustainability, has paved way for us to successively eliminate paper, optimize polymer usage, replace metal barrier films, incorporate Post Consumer Grind polymers and introduce sub micron single family films and organic polymers in our laminated tubes. Available under names PBL, Etain, Super Titanium, GML etc., our laminated tubes today make possible for our customers to create and offer “Sustainable Brands“ to the delight of the environmentally conscious consumers worldwide.
Plastic packaging offers the benefits of affordability, ease of use and handling, and relatively lower demand on fossil hydrocarbon as compared to metals and glass packaging. By promoting its efficient re-use/recycling, it will be a Win-Win solution for the society as a whole.
With Etain, we are able to incorporate up to 40% Post Consumer Regrind in our tubes; the Green Maple leaf is created using polymers of one family
Rooted in our long–term vision, Sustainability encompasses every facet of our business – from products to process, material to machines, governance to CSR.
EP INNOVATION JOURNEY
and qualifies for Recycle Code-2. We are much encouraged by some of our early discerning customers who see the longer term value/lower “cost of ownership” aspects of our Sustainable tubes, rather than only the price, in adopting these packaging solutions for their brands. We believe this line of thinking will gain traction going forward, and vindicate our passion and efforts in pioneering various Sustainable tube structures.
Efficient Recycling
Moderate Recycling
Complex Recycling
04 05Annual Report 2017-18

TECHNOLOGY AND PROCESSGoing beyond the Products, our Sustainability drive also extends to Technology and Process. Some of the key initiatives that make our manufacturing environmental friendly, include:
(a) On-line and real-time inspection systems, now under trial in our factories, aimed at reducing the process scrap for both us and our customers.
(b) Curing with UV instead of hot air, further reducing energy usage, and making it a non-polluting process.
(c) A Computer to Plate process which leverages digital technology in making for a near pollution-free
Green Maple Leaf, with Organic polymer
OUR SUSTAINABLE OFFERINGS
PROJECT LIBERTY
Essel Propack has collaborated with multiple major technical partners across the globe and co-created a solid-state environment-friendly process. By this, the metal and the plastic components of the Aluminum Barrier Laminate tubes can be separated in an eco-friendly manner without the use of chemicals or heat, and without degrading the two components. The recovered materials can be efficiently re-used/recycled in separate streams
dispelling any concerns on Sustainability.
pre-press operation with high consistency and high quality reproduction of images.
(d) Co-creating jointly with Machinery manufacturer higher and higher speed tubing lines, taking up the speed from 60 tubes per minute to 500 tubes per minute but with much lower consumption of power and other utilities.
(e) Working jointly with Equipment supplier to create advanced decoration capabilities on a single equipment (ELITE printing technology) obviating multi stage handling and wastage of material.
(f) Deploying “one click“ technology inter alia to radically improve the print integrity and lower the set up scrap.
Further, in step with our Vision of “Every single tube made by Essel is recyclable” we have launched in March 2018, the first-of-its-kind path breaking solution (Project LIBERTY) to help our customers whose brands necessitate use of laminate tube with embedded metal barrier and liberate them of concerns on recyclability.
Complex Recycling
Green Maple Leaf, Recycling Code-2
Super Titanium with Post Consumer Regrind
04 05Annual Report 2017-18

CSR
We are also innovating more ways to re-use our manufacturing waste in a socially responsible manner. This accomplishes in one stroke, the twin objectives of Sustainability and Social development. Given the versatility and flexibility of plastic as base material, there is much that can be done with it. People in our factories are actively involved with the local communities to identify their infra-structural needs and creatively address those needs using inter alia the plastic scrap generated at our factories. One such initiative has been the manufacture of school chairs and benches from the process scrap. These are distributed free to schools in and around our manufacturing units. Another example is toilet made from recycled plastic and distributed to the rural communities.
All weather-resistant toilet as part of SWACHH BHARAT
Small and large school benches and desks distributed free to schools
PORTABLE TOILET AND SCHOOL FURNITURE MADE WITH ESSEL’S LAMINATE SCRAP
06 07Annual Report 2017-18

CavinKareLong Standing Partner
Award 2018
Indian Institute of PackagingIndiaStar 2017 awarded to Ginger Garlic Paste in Tube
Exxon Mobil appreciation for being their valued Partner in
India for the year 2017
IFCA STAR 2017 Awardin Recognition of Excellence
for Children Water Colour Tube in the category of
Innovations
2014
2014
2014
2015
2015
2015
2015
2016
2016
2016
2016
2017
2017
2017
2017
2018
2018
2018
2018
SALES AND OTHER INCOME` in lakhs
PROFIT AFTER TAX` in lakhs
RETURN ON CAPITAL EMPLOYED%
RETURN ON EQUITY%
AWARDS & ACCOLADES
FINANCIAL HIGHLIGHTS
2,47
,279
17,1
60
16.8
15.0
2,42
,324
19,0
32
17.7
19.0
2,22
,944
17,0
10 18.2
19.5
2,34
,392
14,0
64 16.4
18.9
2,14
,900
10,7
83 13.7
13.1
2014
06 07Annual Report 2017-18

DIRECTORS WITH LEADERSHIP TEAM
STANDING LEFT TO RIGHT:
Suresh Savaliya, Head - Legal & Company Secretary | Roy Joseph, Regional Vice President - AMESA M. K. Banerjee, Director - Creativity & Innovation | Vinay Mokashi, Financial Controller - Corporate Dileep Joshi, Director - Human Capital | Hariharan K, Vice President - C & I | Rajesh Bhogavalli, Head Supply Chain GlobalPrakash Dharmani, Chief Information Officer | Alan Conner, Regional Vice President - EuropeParag Chaturvedi, Head - Global Quality & Process Improvement | Rajiv Verma, Technical Head - CorporateShrihari K. Rao, Head - Printing Technology | Mauro Catopodis, RVP - Americas
SITTING LEFT TO RIGHT:
Ted Sojourner, Director - Americas | M. R. Ramasamy, Chief Operating Officer | Boman Moradian, Independent DirectorAshok Goel, Chairman & Managing Director | Radhika Pereira, Independent Director | Atul Goel, DirectorMukund Chitale, Independent Director | A. V. Ganapathy, Chief Financial Officer Kelvin Wang, Regional Vice President - EAP
08

09Annual Report 2017-18
Corporate InformationBOARD OF DIRECTORS
Ashok Goel Chairman & Managing DirectorBoman Moradian Independent DirectorMukund Chitale Independent DirectorRadhika Pereira Independent DirectorAtul Goel Non Executive Director
A.V. Ganapathy ChiefFinancialOfficer Suresh Savaliya Head – Legal & Company Secretary
AUDITORSFord Rhodes Parks & Co. LLP,Chartered Accountants
BANKERSAxis Bank LimitedKotak Mahindra Bank LimitedYes Bank LimitedDBS Bank LimitedState Bank of IndiaICICI Bank LimitedThe Ratnakar Bank LimitedCity Bank, N.A.The Hongkong and Shanghai Banking Corporation Limited
DEBENTURE TRUSTEE Axis Trustee Services Limited
REGISTRAR & SHARE TRANSFER AGENTBigshare Services Private Limited, 1st Floor, Bharat Tin Works Building, Opp Vasant Oasis, Makwana Road, Marol, Andheri (E), Mumbai-400059, Maharashtra, Tel No. 022-62638200, Fax: 022-62638299 [email protected]
REGISTERED OFFICEP.O. Vasind, Taluka: Shahapur, District: Thane,Maharashtra - 421 604, India.
CORPORATE OFFICETop Floor, Times Tower, Kamala City,Senapati Bapat Marg, Lower Parel,Mumbai - 400 013, India.Tel: 022-24819000 Fax: 022-24963137Email:[email protected]: L74950MH1982PLC028947
UNITS - INDIAVasind, Wada, Goa, Dhanoli (Vapi) and Nalagarh (Himachal Pradesh)

10 11Annual Report 2017-18
ToMembersEssel Propack Limited
Your Directors are pleased to present their Report on your Company’s business operations along with the audited financial statements for the financial year ended on 31March 2018.
YourCompanyhaspostedhealthyfinancialresults,bothin India and in Global operations. The highlights of the financialresultsaresetoutbelow.
CONSOLIDATED GLOBAL RESULTSThe summary results are set out below.
(` in lakhs)
Particular Year ended 31.03.2018
Year ended 31.03.2017
Total Income 247279 242324
Total Income excluding Excise duty
245025 233759
ProfitBeforeDepreciation,Finance and Tax (PBDIT) inclusive of other income
49112 45719
Finance cost (5491) (5812)
Depreciation (16707) (14148)
Profitbeforeshareofprofit/(loss)fromAssociate/Jointventure and exceptional items
26914 25759
Shareofprofit/(loss)fromAssociate/Jointventure
(104) 105
Profitbeforeexceptionalitems and tax
26810 25864
Exceptionalitemsnet(loss)/gain
(498) 1565
Tax expense (8891) (7869)
NetProfitfortheyearattributable to owners of the parent
17160 19032
The Consolidated Total Income exclusive of Excise duty recovery grew year over year by 4.8%, with the Sales and Operating income growing by 5.3% helped by the acquisition of 100% stake in the German tubing joint venturewitheffectfrom30September2016.Weaksalesin
IndiainthewakeoftransitiontotheGSTregimeeffective 1July2017,andlowerthanforecastofftakebycustomersin Europe, majorly impacted the Sales growth this year. Improved material costs and efficiencies and operatingcost control measures helped improve the Consolidated Operating margin by 30 bps to 12.6%. Consequently, Profit before Exceptional items and tax improved by3.7% over the previous year despite an increase in the depreciation charge on account of new capital investment in the previous year for supporting the planned business growth.Net profit attributable to the equity holders forthe year is ̀ 17160 lakhs after taking an exceptional charge of ` 498 lakhs on account of liquidation of an overseas subsidiary. It may be noted that in the previous year, there was a net exceptional gain of ` 1565 lakhs. Exclusive of the exceptionalitems,theNetprofitfortheyearunderreportwas marginally higher compared to the previous year.
INDIA STANDALONE RESULTSThe summary results are set out below.
(` in lakhs)
Particular Year ended 31.03.2018
Year ended 31.03.2017
Total Income 87429 90068
Total income exclusive of excise duty
85175 81503
ProfitBeforeDepreciation,Interest and Tax (PBDIT) inclusive of other income
21174 17770
Finance cost (2140) (2322)
Depreciation (6866) (6021)
ProfitbeforeTaxandexceptional items
12168 9427
Exceptionalitemsnet(loss)/gain
- -
Tax Expense (4050) (2916)
NetProfitfortheyear 8118 6511
Appropriations - -
Transfer to Debenture Redemption Reserve
0 750
GSTregimekickedoffinIndiaeffective1July2017.Priorto this date the Sales and operating income included the excise duty recovery as mandated by the IND AS. Post this date, there is no excise duty having been subsumed by the GST, and the GST recovery is not to be included in the Sales
BOARD’S REPORT

10 11Annual Report 2017-18
and Operating income as per the IND AS. Consequently, the reported Total income for the year is seen lower than the previous year. The Total income exclusive of the excise duty recovery for the year however has grown by 4.5% over the previous year. Weak demand from the customers in the wake of transition to the GST regime is the key reason for the Sales growth to be subdued in India. On the otherhand, improvedmaterial costandefficienciesandlower operating costs as compared to the previous year, helped in improving the Standalone operating margin by 220 bps to 14.7%. Consequently, in a challenging external environment,yourCompany’sstandaloneNetprofithasgrown strongly by 24.7% to ` 8118 lakhs, compared to ` 6511 lakhs in the previous year.
REVIEW OF MARKET, BUSINESS AND OPERATIONS
Your Company is a leading manufacturer globally of Laminated Plastic Tubes and Laminates. Its products are extensively used in the packaging of products across categories such as Beauty & Cosmetics, Pharma & Health, Foods, Home and Oral care. The FMCG and Pharma industry which your Company serves, continue to offer much growth opportunity for your Company.In the evolved markets of Europe, USA and Japan, theFMCG sector continues to innovate several new life-style products in the Beauty care and Wellness categories. Beauty care products such as Anti-Ageing creams, Beauty Balms, Complexion Correction creams, Hair colorants, cosmetic/ therapeutic toothpastes need vibrant andpremium looking tube packaging to help them stand out inshopfloorshelfandattracttheincreasinglydiscerningand demanding consumer in a competitive market. In the emerging markets such as India, China, Far East and Latin America, the per capita usage of FMCG products is fast expanding helped by fast increasing disposable income, growing youth population, rapid growth of modern retail/e-tail and the general aspiration of the consumerto look and feel good. The demand for pharma product too is buoyed by the increasing life expectancy, growth of generics and “health for all” programmes promoted by Governments/NGOs.
Your Company as a global supplier of innovative tube packaging solutions for products in the paste/cream/gel forms, continues to benefit from this growth in theFMCG/Pharma space by leveraging its scale, globalmanufacturing and marketing presence and proven innovation/ technology capability. Besides the sectorgrowth of FMCG/Pharma brands, your Company is alsodriving to establish its new generation laminated tubes as a superior value packaging format as compared to extruded plastic and aluminium tubes, bottles and tottles used by
many Cosmetics, Food and Pharma brands. This adjacent space opens up even larger value opportunity for your Company to grow and gain share. In a sense therefore, your Company’s growth potential is not capped by just the underlying secular growth in the FMCG/Pharma space.Rather, there are multiple propellers for your Company to drive a healthy double digit top line and bottom line growth in the coming years.
India Standalone
India accounts for around 35% of your Company’s Consolidated Sales. Your Company having pioneered laminated tube solutions in this country since the early 80’s, continues to enjoy a massive franchise in India among the FMCG/Pharmabrands.TheCustomerportfolio–spanningIndian and MNC players, mass and niche, established and new, continues to expand.
The year under report however was challenging in India. from Sales growth stand point. It will be recalled that during the previous year your Company had to contend with reduced customer demand following the Demonetisation announced in November 2016. With the GSTregimekickingofffrom1July2017,therewerefurtheruncertainties among your Company’s customers and their Supply and Distribution partners. This led to contraction of demand and a shrinkage of the pipeline inventory all through the year under report. Consequently the Revenue growth in India remained muted. Your directors believe that GST is a welcome tax reform which will make for ease of doing business and promote economic growth over the long term. As the market constituents stabilize and align their processes, the India growth story should take over once more.
Nevertheless, new Customer development activity was sustained targeting the non oral care categories. Further, with a view to seizing market opportunities provided by the FMCG industry growth in the North Eastern States, your Company is setting up a new factory near Guwahati for manufacture and sale of tubes to nearby customers.
Operations in the newly commissioned factory at village Dhanoli (Vapi) in Gujarat have now been stabilised. During the year, the caps & closure manufacturing also got commissioned in-house at the Dhanoli (Vapi) site with an eye on material cost savings and faster response time to customerdemand.With all this, the scalebenefits fromthe consolidation of production sites in the Western India have started accruing to your Company.
Exports to markets in South Asia, Middle East and Africa continue to be pursued as a strategy to grow and gain share in the smaller markets which are not viable for a full-fledgedmanufacturingsetup.

12 13Annual Report 2017-18
Your Board is of view that India growth story remains intact, and your Company is well positioned to post healthy growth in the months and years to come.
Subsidiaries, Joint Ventures and Associates
Being a global player in laminated tubes, your Company has manufacturing and marketing presence in eleven other countries through its direct and step down subsidiaries, and an associate.
Allthesesubsidiaries/associatecontinuetoworkcloselywith customers to grow their business with product offeringsrelevanttotheirrespectivemarkets.Duringtheyear, the new factory in Colombia was stabilized and a number of measures taken to improve its performance. Consequently, the Colombian subsidiary significantlyimproved itsOperatingprofit compared to thepreviousyear. However, adverse currency movement caused the subsidiary to post loss for the year, albeit 26% lower than the previous year. With improved sales, the subsidiary should turn around in the next year. The Russian subsidiary posted a small loss during the year impactedbylowerofftake.Allotheroperatingsubsidiariespostedprofitduringtheyear.TheAssociatecompany inIndonesia posted a loss on account of cost increases and an exceptional charge.
Considering the prospects and huge size of the non oral care category market in the various countries your Company operates and the disruptive nature of the packaging solutions that your Company has been introducing, the Board expects the overseas subsidiaries topostsustainedprofitablegrowth.
The development at these entities and the markets they operate in are further discussed in the Management Discussion and Analysis (MDA) forming part of this report. Thesalient featuresof thefinancial statementsof thesesubsidiaries and the associate in the prescribed format is attachedasapartoftheauditedfinancialstatements.
During the year, a subsidiary in Egypt having ceased operations was liquidated and the proceeds distributed amongst the shareholders. Consequently, an exceptional charge of ` 498 lakhs has been considered in the Consolidated Financial statements as detailed in Note 44 to the Consolidated accounts. Lamitube Hongkong Ltd., another step down subsidiary was deregistered during the year having ceased to do business. Further details about the subsidiaries, associate etc. are given in MGT9.
CONSOLIDATED FINANCIAL STATEMENTS
In compliance with the Companies Act, 2013 and SEBI (Listing Obligation and Disclosure Requirements) Regulations, 2015 (the Listing Regulations), consolidated
financial statements of the Company and all of itssubsidiaries and associate / joint venture, have beenprepared for the year under report. The audited Consolidatedfinancialstatementsalongwiththeauditors’report thereon forms part of this Annual report. The consolidated financial statements presented by theCompanyincludethefinancialresultsofallitssubsidiaries,joint venture and Associate. The audited standalone financialstatementsoftheseentitieshavebeenreviewedby the Audit Committee and the Board.
MANAGEMENT DISCUSSION AND ANALYSIS
The Management discussion and analysis (MDA) report for the year under review, of the operations of your Company andallofitssubsidiaries,associate/jointventureisgivenin a separate section of this Annual Report and forms part of this Annual Report.
CORPORATE GOVERNANCE
The Company is committed to maintain highest standards of corporate governance aligned with the best practices. Pursuant to applicable provisions of the SEBI (Listing Obligations and Disclosure Requirements) Regulations, 2015, a detailed report on Corporate Governance forms part of this Report. The Company is in compliance with the various requirements and disclosures that have to bemade in this regard. A certificate from the Auditorsconfirming compliance of the conditions of CorporateGovernance as stipulated under the Listing Regulations forms part of the Annual Report.
DIVIDEND AND ISSUE OF BONUS SHARES
YourCompanycontinuestobeonthepathofprofitablegrowth.TheCompany’scashflowsandfinancialpositioncontinue to be strong.
Considering the cash requirement for business growth and debt servicing, the Board believe that a steady dividend payout will best serve the interests of the Company and of the shareholders especially those dependent on regular income. Accordingly, your Directors recommend a dividend of ` 2.40 per equity share of face value of `2each,forthefinancialyearendingon31March2018(previousfinancialyear:` 2.40 per share of face value of ` 2 each).
Further, your Directors are pleased to note that the sustained strong performance of your Company has created value to its shareholders as seen from its market capitalization. With a view to encouraging even more participation of small investors by making the share price affordable, your directors have approved an issue ofbonus equity shares in the ratio of 1:1 i.e. one bonus equity

12 13Annual Report 2017-18
share for every one equity share held by the shareholders, subject to approval by members at the forthcoming AGM.
Dividend Distribution Policy of the Company is given as a part of this Report marked as Annexure 1 and also posted in investors section on the Company’s website or link, http://www.esselpropack.com/corporate-governance/
TRANSFER TO RESERVESA sum of ` 2250 lakhs is already standing to the credit of Debenture Redemption Reserve (DRR), representing 25% of the value of listed debt securities issued and outstanding at the end of the year under report. Hence, no further transfer to DRR is required under the applicable guidelines.Thereisalsonospecificstatutoryrequirementto transfer any sum to General reserve in relation to the payment of dividend. Your Directors therefore have not proposed any sum for transfer to Reserves during this year.
FINANCE AND ACCOUNTSYourCompanycontinuedtoreduceitsfinancialleverageand the finance cost by enhancing capital productivityand improving cash generation. Financial parameters such as Debt service cover ratio, Interest cover ratio, Debt Equity ratio are all at healthy levels and show further improvement over the previous year, both on Standalone and Consolidated basis.
Your directors are pleased to inform that your Company continues to enjoy CARE AA rating for its NCDs and various long term bank facilities, and CARE A1+ rating for its short term bank facilities. The Company is also rated by India RatingsandResearch(FITCHGroup)whohavere-affirmedthe Company’s long term issuer rating at IND AA and its Commercial Paper rating at IND A1+.
During the year, your Company continued to make successful issues of Commercial papers at competitive interest rates commensurate with its short-term top credit rating. During the year, the Company also redeemed ` 50 crores of the Non Convertible Debentures (NCDs) issued in the year 2015 by exercising the call option, and further exercised call option in respect of the balance ` 40 crores of the 2015 issue for redemption in April 2018. A fresh issue of unsecured NCDs of value ` 50 crores was made in December 2017, which are redeemable at the end of three years.
Forex exposures continued to be closely reviewed and appropriately hedged in order to minimize risk to the results.
STATUTORY AUDITORSAt the AGM held in the year 2017, M/s. Ford RhodesParks & Co. LLP, Chartered Accountants, were appointed as Statutory Auditor of the Company for a period of 5 years. As required by the Companies Act, provisions in force,theirappointmenthastoberatifiedateachAGM.TheCompanyhasreceivedletterfromthemtotheeffectthat their appointment is within the prescribed limits and confirming that they are not disqualified for suchappointment pursuant to the Companies Act, 2013 and applicable statutory provisions.
Accordingly, the Audit Committee and Board of the Company have considered and recommend to the memberstheratificationoftheirappointmentasStatutoryauditor of the Company at the ensuing Annual General Meeting.
SECRETARIAL AUDITPursuant to the provisions of section 204 of the Companies Act, 2013M/s. D M Zaveri & Co., PracticingCompany Secretary (CP No. 4363), have been appointed to undertake the secretarial audit of the Company for the year ended on 31 March 2018. The secretarial audit report forms a part of this Report and is annexed as Annexure 2. Thesaidreportdoesnotcontainanyqualification,adverseremarks or disclaimer.
Company has complied with the Secretarial Standards as applicable to the Company pursuant to the provisions of the Companies Act, 2013.
COST AUDITORSPursuant to section 148 and applicable provisions of the Companies Act, 2013 and the Companies (Cost Records and Audit) Rules 2014, the Company is required to appoint cost auditor for audit of cost records maintained by the Companyinrespectofthefinancialyearending31March2019. Your Directors have on the recommendation of the Auditcommittee,appointedM/s.RNanabhoy&Co.,CostAccountants, as the Cost Auditor to audit the cost records forthefinancialyearending31March2019.Remunerationpayable to the Cost Auditor is subject to ratification bythe members of the Company. Accordingly, a resolution seeking members’ ratification for the remunerationpayable toM/s.RNanabhoy&Co.,CostAccountants, isincluded in the Notice convening the Annual General Meeting, along with relevant details, including the proposed remuneration.

14 15Annual Report 2017-18
DIRECTORSIn accordance with the provisions of section 152(6) of the Act and the Articles of Association of the Company, Mr. Ashok Goel, Director is proposed to retire by rotation at the ensuing Annual General Meeting (AGM), and being eligible, offers himself for re-appointment. The Boardrecommends his re-appointment.
ThemembersoftheCompanyattheAGMheldon9July2013, have approved the appointment of Mr. Ashok Goel as Vice Chairman and Managing Director of the Company for theperiodoffive yearswitheffect from21October2013 and also approved payment of his remuneration.
The Nomination and Remuneration Committee, Audit Committee and Board of Directors of the Company have recommended the reappointment of Mr. Ashok Goel as Managing Director of the Company upon expiry of the saidfiveyearsperiod,foranothertermasmentionedinthe Resolution seeking Members’ approval at the ensuing AGM. Necessary information including the applicable terms and conditions and the proposed remuneration is given in the said Resolution and the explanatory statement included in the Notice convening the next AGM.
Details about the directors are given in the accompanying Notice of AGM and Corporate Governance Report.
All the Independent Directors have given declarations that they meet the criteria of independence laid down under Section 149 of the Companies Act, 2013 and the Listing Regulations.
Further details of Directors including remuneration, policy, criteria for qualification, independence; performanceevaluation of the Board, Committees and Directors;meetings, committees and other details are given in the Corporate Governance Report, which is integral part of this Annual and Board’s Report.
DIRECTORS’ RESPONSIBILITY STATEMENTTo the best of their knowledge and belief and according to the information and explanations obtained by them, your Directors make the following statements in terms of Section 134(3)(c) of the Companies Act, 2013:
a) that in the preparation of the annual financialstatements for the year ended 31 March 2018, the applicable accounting standards have been followed along with proper explanation relating to material departures,ifany;
b) that such accounting policies as mentioned in note 3A to the Financial Statements have been selected and applied consistently and judgment and estimates have been made that are reasonable and prudent so astogiveatrueandfairviewofthestateofaffairsoftheCompanyasat31March2018andoftheprofitoftheCompanyfortheyearendedonthatdate;
c) that proper and sufficient care has been taken forthe maintenance of adequate accounting records in accordance with the provisions of the Companies Act, 2013 for safeguarding the assets of the Company and for preventing and detecting fraud and other irregularities;
d) that the annual financial statements have beenpreparedonagoingconcernbasis;
e) thatproper internal financial controlswere inplaceand that the financial controls were adequate andwereoperatingeffectively;
f) that systems to ensure compliance with the provisions of all applicable laws were in place and were adequate and operatingeffectively.
AUDIT COMMITTEEAudit Committee of the Board has been constituted as per the Listing Regulations and section 177 of the Companies Act, 2013. Constitution, meetings, attendance and other details of the Audit Committee are given in Corporate Governance Report which is part of this Report.
PERFORMANCE EVALUATIONThe Board has carried out the annual evaluation of its own performance, and of each of the directors individually including the Independent Directors and Chairman, as well of the working of its committees. The manner in which the evaluation has been carried out has been explained in detail in the Corporate Governance Report, which forms part of this Annual Report.
FAMILIARIZATION PROGRAMMESThe Company’s policy on programmes and measures to familiarize Independent Directors about the Company, its business, updates and development includes various measures viz. issue of appointment letters containing terms, duties etc., management information reports, presentation and other programmes as may be appropriate from time to time. The Policy and programme aims to provide insights into the Company to enable independent directors to understand the business, functionaries, business model and others matters. The said Policy and details in this respect is displayed on the Company’s website.
14 15Annual Report 2017-18
CORPORATE SOCIAL RESPONSIBILITYAs a part of its Corporate Social Responsibility (CSR) initiative, the Company has undertaken CSR projects and programs. Thrust areas for CSR include care and empowerment of the underprivileged, education, health and environment and sanitation. These activities are in accordancewithCSRactivitiesasdefinedunder theAct.The Company has a CSR Committee of Directors. Details about the Committee, CSR activities and the amount spent during the year, as required under section 135 of the Act and the related Rules, reasons and other details are given in the CSR Report as Annexure 3 forming part of this Report.
The Company has framed a CSR Policy in compliance with the provisions of the Act and the same is placed on the Company’s website www.esselpropack.com. The CSR Policy lays down areas of activities, thrust area, types of projects, programs, modes of undertaking projects/programs, resources etc.
Your directors are pleased to report that the Company’s subsidiaries overseas also actively give back to the society in their respective geographies through various initiatives on the health, education and other fronts.
LOANS, GUARANTEES AND INVESTMENTSDetails of loans, guarantees and investments covered under applicable provisions of section 186 of the Act are giveninthenote51tothestandalonefinancialstatements.
RELATED PARTY TRANSACTIONSContracts/arrangements/transactions entered by theCompany during the financial year with related partieswere on an arm’s length basis and largely in the ordinary course of business. All related party transactions are placed for approval before the Audit Committee and also before the Board wherever necessary in compliance with the provisions of the Act and Listing Regulations. During theyear,theCompanyhasnotenteredintoanycontracts/arrangements/ transactions with related parties whichcould be considered material in accordance with the policy of the Company on material related party transactions or under section 188(1) of the Act. Accordingly, there are no particulars to report in Form AOC- 2.
Details of the related party transactions during the year as required under Listing Regulations and Indian accounting standards are given in note 54 to the Standalone Financial Statements.
The policy on dealing with the Related Party Transactions including determining material subsidiaries is posted in investors/corporate governance section on theCompany’swebsiteorlink,http://www.esselpropack.com/wp-content/uploads/2015/03/Related-Party-Transaction-Policy.pdf
HUMAN CAPITALRelationswithemployeesacrossalltheofficesandunitscontinued to be cordial. HR policies of the Company are focused on developing the potential of each employee. With this premise, a comprehensive set of HR policies are in place, aimed at attracting, retaining and motivating employees at all levels. Your Company had 1163 permanent employees as of 31 March 2018.
The statement containing particulars of employees as required under Section 197(12) of the Companies Act, 2013 read with Rules 5(2) and 5(3) of the Companies (Appointment and Remuneration of Managerial Personnel) Rules, 2014 is annexed herewith as Annexure 4 (a) and forms part of this Report.
Other details in terms of Section 197(12) of the Companies Act, 2013 read along with Rule 5(1) of the Companies (Appointment and Remuneration of Managerial Personnel) Rules, 2014, is annexed herewith as Annexure 4(b) and forms part of this Report.
EMPLOYEE STOCK OPTIONSThe Nomination and Remuneration Committee of the Board of Directors (NRC) of the Company, inter alia, administers and monitors the Employee Stock Option Scheme 2014 (“ESOS 2014” or “Scheme”) of the Company in accordance with applicable SEBI regulations.
The disclosure relating to the Scheme and other relevant details are posted in investors>corporate governance section on the Company’s website or link, http://www.esselpropack.com/corporate-governance/.Forthesakeofclarity, this Scheme does not extend to any of the Directors and Promoters of the Company.
No stock options were granted or vested during the year under report. Out of the stock options vested in the earlier years, 80166 options were exercised during the year and equal number of equity shares of face value ` 2 each were issued as fully paid up against payment of the stipulated exercise price as per the terms and conditions of the Scheme and the Grant letter.

16 17Annual Report 2017-18
The relevant details on the options granted and the accounting of their costs are set out in the Notes to the Standalone accounts.
ENERGY, TECHNOLOGY & FOREIGN EXCHANGEThe information on conservation of energy, technology absorption and foreign exchange earnings and outgo stipulated under Section 134(3) of the Companies Act, 2013 read with Rule 8 of the Companies (Accounts) Rules, 2014, is annexed herewith as Annexure 5 and forms part of this Report.
OTHER INFORMATION / DISCLOSURESThere are no significant material orders passed by theRegulator, Courts or Tribunal which would impact the going concern status of the Company and its future operations.
There have been no material changes and commitments affectingthefinancialpositionoftheCompany,occurredbetweenendoffinancialyearanddateofthisReport.
In accordance with section 134(3)(a) and section 92(3) of the Act, an extract of the annual return as at 31 March 2018 in Form MGT9 forms part of this Report as Annexure 6.
As per applicable provisions of the Listing Regulations, business responsibility report is given herewith and forms part of this Report as Annexure 7.
Wherever applicable, refer the Company’s website www.esselpropack.com or relevant details will be provided to the members on written request to the Company Secretary.
The Company has in place a policy against sexual harassment at work place in line with the requirements of the concerned statute. Internal complaint committees are set up in this respect. There was no complaint received from any employee during the year, nor any complaint remains outstanding for redressal as on 31 March 2018.
VIGIL MECHANISM / WHISTLE BLOWER POLICYThe Company has a whistle blower policy laying down a vigil mechanism to deal with instances of unethical behavior, fraud or mismanagement. The said policy has been explained in the corporate governance report and also displayed on the Company’s website www.esselpropack.com.
INTERNAL FINANCIAL CONTROLThe Company has a proper and adequate Internal Financial Control System, to ensure that all assets are safeguarded and protected against loss from unauthorized use or disposition and the transactions are authorized, recorded and reported correctly.
The Internal Financial control is exercised through documented policies, guidelines and procedures. It is supplemented by an extensive program of internal audit conducted by in house trained personnel and external firms of Chartered Accountants appointed onrecommendation of the Audit Committee and the Board. The audit observations and corrective action, if any, taken thereon are periodically reviewed by the Audit committee to ensure effectiveness of the Internal Financial ControlSystem. The internal financial control is designed toensure that the financial and other records are reliableforpreparingfinancialstatementsandotherdata,andformaintaining accountability of persons.
During the year as part of control assurance process, thefinancial controlswere reviewedby an independentagency in line with the guidelines issue by ICAI on internal financialcontrolsandreportedsatisfactoryindesignandoperationaleffectiveness.
RISK MANAGEMENTThe Company has laid down a well-defined riskmanagement mechanism covering the risk mapping and analysis, risk exposure, potential impact and risk mitigation measures. A detailed exercise is carried out every year to identify, evaluate, manage and monitor the principal risks that can impact the Company’s ability to achieve its strategic and financial objectives. TheBoard periodically reviews the risks and suggests steps to be taken to control and mitigate the same through a properlydefinedframework.Detailsontheriskelementswhich the Company is exposed to are covered in the Management Discussion and Analysis which forms part of this Annual Report. The Company has formally framed a Risk Management Policy to identify and assess the key risk areas,monitorand report complianceandeffectivenessof the policy and procedure. The Risk management committee under the Chairmanship of an Independent Director oversees the risk management process.
PUBLIC DEPOSITSYour Company has not accepted any deposits from the public and there are no outstanding deposits as on 31 March 2018.

16 17Annual Report 2017-18
CAUTIONARY STATEMENTStatements in this Report and the Management Discussion and Analysis may be forward looking within the meaning of the applicable securities laws and regulations. Actual resultsmaydiffermateriallyfromthoseexpressedinthestatement.CertainfactorsthatcouldaffecttheCompany’soperations include increase in price of inputs, availability of raw materials, changes in Government regulations, tax laws, economic conditions and other factors.
APPRECIATIONDirectors wish to place on record their sincere thanks and appreciation to all our customers, suppliers, banks, authorities, members and associates for their co-operation
and support at all time, and to all our employees for their unstinted contribution to thegrowthandprofitabilityofyour Company’s business, and look forward to continued support.
For and on behalf of the Board Essel Propack Limited
Ashok GoelChairman & Managing Director
26 April 2018, Mumbai

18 19Annual Report 2017-18
Your Directors are pleased to present the Management Discussion and Analysis for the year ended 31 March 2018.
BUSINESS OVERVIEW
Your Company’s business is an integral part of the FMCG and Pharma space, packaging being one of the four key P’s of Marketing mix that underpin the success of any brand.
The FMCG business across categories of Beauty and Cosmetics, Foods, Home and Oral care constitutes a multi-trillion dollars market globally and continues to grow in many different ways. In the developing economies, thegrowth is powered by increasing young population, growing disposable income, life-style changes etc. In the developed economies where penetration and usage of FMCG products is already high, there is still a churn happening in the sense that new products addressing the contemporary lifestyle needs and aspirations emerge while some of the traditional products get phased out, for e.g. products like Anti-ageing creams, Beauty balms, Complexion creams, Sun protection creams, and of late, Hair colorants and styling gels etc. are some of the new and growing applications. There is also a growing trend for products to go the organic, natural and herbal way. Yet another disruption we see these days, is caused by the e-commerce. Leveraging the power of social media and the digital market place made possible by the Internet, a numberofstartupsareactiveintheFMCGspaceofferingcustomized, attractive and niche products to a net-savvy consumer.
Clamouring for a share of consumer’s mind and wallet in this highly dynamic and competitive scene, the brands looktoleveragePackagingasfirstmomentofTruthasifit was an important spokesperson on their behalf, be it on the retail shelf or on a web portal. Packaging therefore is not merely something necessary to hold and protect the product, but is a key value enhancer for the brand.
That is where your Company fits snugly in the schemeof things. A range of FMCG and pharma products in viscous form such as pastes, gels and creams use tube as a packaging format. The world market for tubes is huge, about 36 billion in the countries your Company operates. Of this, oral care tubes account for 14 billion, Beauty & Cosmetics account for 12 billion and Pharma & others account for 10 billion. Beauty & Cosmetics applications are pre-dominantly in extruded Plastic tubes and bottles, and Pharma are pre-dominantly in Aluminum tubes. The non
MANAGEMENT DISCUSSION AND ANALYSISoral care tube market represents much higher value, three times or more as compared to oral care tube market. Having established global leadership with its laminated tubes for the oral care category, your Company began to pursue a considerably bigger market opportunity in the non oral care category. This also is the space where market is getting more and more dynamic and throwing up opportunities with new products, new applications, new brands and expanding consumption as outlined earlier. With its global manufacturing and marketing presence, large scale, strong R&D and New Product Development (NPD) capability, state of art equipment, your Company has been active and growing inter alia in the high value add non oral care category. Its growth in the non-oral care category is further powered by the larger diameter tube packaging format in the case of Beauty & Cosmetics and Pharm and Food migrating from extruded plastic/aluminumtubesandbottlestothenewgenerationlaminated tubes, a trend in some way heralded by the new generation laminated tubes introduced by your Company as a superior value proposition for these categories. Your Company’s laminated tubes provide superior customized barrier property, outstanding look and feel, shorter lead-time and improved Sustainability features in comparison tothetraditionalplastic/aluminumtubesandbottles.
In the case of pharmaceuticals, use of aluminum tubes for packaging is going out of favour for reasons of concerns on product safety and supply security. High barrier, safe laminated tubes with features such as tamper evidence, anti-counterfeitandinnovativedispensing,offeredbyyourCompany,arefindingincreasingacceptanceasasuperiorpackaging format by both the OTC and Prescription drugs.
Categories such as Foods and Home care, are now seeing tube as an attractive packaging format and a value enhancer compared to bottles and other traditional packaging for a range of products such as condensed milk, Wasabisauce,Cheesespread,glue/adhesivesetc.
OPERATIONAL PERFORMANCE REVIEW
During FY 18, your Company’s consolidated revenue exclusive of excise duty was ` 2424 crores, higher by 5.3% overpreviousyear.Theoperatingprofit(excludingotherincome) grew by 7.9% to ` 306 crores with the operating margin expanding by 30 bps to 12.6%, helped by improved materialcostsandefficienciesandtightcontrolovertheoperating costs. Key factors holding back a higher Revenue growth were:

18 19Annual Report 2017-18
• India sale growth was muted on account of thetransitiontotheGSTregimebeginning1July2017.
• Off-takedropatkeycustomersinEuropeinOralcare.
• Servicing issuesrelatedcustomerattrition inEDG inNon Oral care post acquisition.
• Delayincommercializationofnonoralcarecustomersin Europe and brand offtake issues post launch insome cases.
• Adverse Sales mix in Colombia in the course ofstabilizing the new plant.
The operational performance has been analyzed by business segments below.
SEGMENT PERFORMANCE REVIEW
Your Company’s business is in plastic packaging materials. The business is managed by four geographical segments viz.
1 Americas (with operations in the USA, Mexico and Colombia)
2 Europe (with operations in the UK, Germany (w.e.f 1 October 2016), Poland and Russia)
3 AMESA - Africa, Middle East & South Asia (with operations in Egypt and India )
4 EAP-EastAsiaPacific (withoperations inChinaandPhilippines)
Segment Financial Highlights
Thetablebelowsetsoutthesegmentfinancialhighlightsfor the year:
(` in lakhs)Particulars FY ended 31
March 2018FY ended 31 March 2017
Growth
Revenue:Americas 48846 48277 +1.2%Europe 50959 43525 +17.1%Europe excl acquisition impact
29912 32976 -9.3%
AMESA excl India excise duty
91230 89515 +1.9%
EAP 57437 55285 +3.9%Profit Before Interest and Tax (PBIT):Americas 6112 5265 16.1%Europe 1200 2447 -51.0%AMESA 14123 12840 10.0%EAP 9050 7808 15.9%
Developments in each of the regions are set out below:
AMERICAS
Your Company has a strong market presence in both North and South America, through its wholly owned subsidiaries in USA, Mexico and Colombia.
Following the closure of the extruded plastic tube operations in US, the laminated tube unit in the USA has taken to actively marketing your Company’s new generation laminated tubes to non oral care customers, winning new awards which should see commercialization in the next year. The Very High Speed tubing line - “Shot line”, introduced during the previous year was stabilized. Customer servicing was sustained at high levels in this demanding market.
TheMexico unit operational efficiencies were sustainedat high level following the turnaround during the previous year. Helped by strong share in revenue of the non oral care category (35%), the Unit posted high double digit EBITDAmarginanddoubleditsnetprofitduringtheyear.
The Colombia unit has been fast stabilizing its new plant, improving its sales mix and operating costs compared to the previous year. Consequently, the EBITDA margin moved up by 7.3 pp to 11.7%. However, adverse currency fluctuation caused the Unit to post net loss despiteimproved operating performance. More initiatives are under way to drive Sales growth including through exports to neighboring markets, closely monitored by the Regional management, which should get the Unit post healthy results in the next year.
With Colombian operations improving further and helped by higher non oral care category sales in the US and Mexico units, the Region is poised for improved performance going forward.
EUROPE
Your Company sells both laminated tubes and extruded plastic tubes in Europe. It has manufacturing presence in Poland, Russia and Germany. The German unit became a wholly owned subsidiary effective 1 October 2016.Accordingly, its sales are consolidated in the Region’s Revenue from the said date. The Region’s reported Sales growth on this basis is 17.1% y-o-y, but if the acquisition impact is excluded, it is a degrowth of 9.3%.
The key reasons for the sales degrowth in the existing operationsisthelowerthancontractedofftakebyakey

20 21Annual Report 2017-18
customer in Poland and lower sales in Russia. Impacted by the top line de-growth, the Poland unit’s net profitdeclined. The Russian unit which had turned profitablejust in the previous year, posted a small loss this year due to lower sales.
The German unit had faced customer attrition on account of servicing issues. Soon after the acquisition, your Company implemented a number of initiatives which saw theunit’soperationstabilizeandefficiencies improvebyJune 2017. The unit ismeticulouslyworking towin neworders and customers, and has made notable progress by March of the year under report. For the year as a whole, the unit has improved its EBITDA margin to 11.5% and postedprofit.
Europe being the largest tube market, continues to be a focus market for your Company. There is potential for your Company to grow strongly on its current small market share by driving new product and business development in a structured way backed by its new generation laminated tubes and advanced decoration capability. The new business development pipeline is being monitored closely andbuffer is being created to counter delays orfailure in individual brand launch. The Poland unit is also in the process of de-bottlenecking its extruded plastic tube capacitytoaddressthechangingcustomerspecifications.New customers are being developed in Russia to drive top line and bring it back to profit while the capacity de-bottlenecking and facility improvements are under wayforthenextfinancialyear.
AMESA (Africa, Middle East and South Asia)
ThisRegionisservicedbyyourCompanyfromitsfiveunitsacross India and by its subsidiary in Egypt.
The sales growth in India was muted at 4.3% in the context oftheeconomytransitingtothenewGSTregimeeffective1 July2017.Nevertheless,yourCompanycontinuednewcustomerandnewproductdevelopmenteffortstargetingthe pharma and cosmetics categories. The new unit in Vapiwasstabilizedandthescalebenefitsofconsolidationbeginning to get realized. Your Company also successfully re-located the caps and closures operations to the Vapi unit, simultaneously upgrade the technology to reduce waste and improve productivity. With a view to participating in the opportunity thrown up by FMCG industry growth in the North Eastern States, your Company is in the process of setting up a custom-built factory near Guwahati, Assam.
Your Company’s subsidiary in Egypt continues to grow strongly with the non-oral care share of revenue increasing by 6pp to 41%. The unit has proactively addressed the cost escalationeffectofa80%currencydevaluation towards
endoftheyear2016,andsustainedprofitablegrowth.Theunit is actively working to develop more customers and across all categories including exports to the MEA region.
AMESA continues to promise significant growthopportunities especially in the Cosmetics and Pharma categories where the growing population, low per capital consumption, changing aspirations, increasing disposable income are seen to drive consumption in a big way. Customers both MNCs and Local are looking to grow and gain share of the consumer spend in this Region. Your Company is involved in several exciting new business development projects in the non-oral care categories with several niche brands. In India, your Company is now the leading solution provider to Pharma category, replacing the aluminum tubes with laminated tubes in a big way. Short term blip because of transition to the GST regime in India, notwithstanding, the Region is expected to benefitfromtheeconomicgrowthandalargediversifiedcustomer base in the coming years.
EAP (East Asia Pacific)
Your Company has manufacturing presence in this region through subsidiaries in China and the Philippines.
China for long has been a large and successful operation foryourCompanyintheOralcarecategory.Butofftakein the recent years of key customers in this category has seen a decline, eventhough the China subsidiary holds its wallet share with them. With a view to restoring growth, the China subsidiary has been steadily expanding its innovation and technical capability for manufacture of high Value new generation laminated tubes catering to the Cosmetics, Pharma, Foods and niche premium Oral care categories. Coupled with strong customer marketing and development initiatives, the unit is establishing itself as a quality Supplier of non-oral care packaging solutions. The unit is also focusing on automation as a means to contain the operating cost escalation in the context of sharp increases in the wage cost. The strategy has is working well and the unit growing again having posted a high singledigitsalesgrowthandadoubledigitprofitgrowth.
The Philippines unit continued to contribute to your Company’sprofits,withalargepartofitssalesandprofitarising from non-oral care category.
The EAP Region has a track record of operational excellence and a strong balance sheet. With the non oral care strategy gaining traction, the region is well poised to take share and grow in the large non oral care market in the Region.

20 21Annual Report 2017-18
CONSOLIDATED FINANCIAL PERFORMANCE OVERVIEW
(` in lakhs)
ParticularsFY ended 31 March
2018
FY ended 31 March
2017
Increase /(Decrease)
NetSales/Incomefrom operations excl excise duty
242388 230229 5.3%
ProfitfromOperations before Other Income, Interest and Exceptional items
30568 28335 7.9%
Finance Cost 5491 5812 -5.5%Profitbeforetaxand exceptional item
26810 25864 3.7%
NetProfitfortheyear to equity holders
17160 19032 -9.8%
Consolidated numbers consider the full year impact of German joint venture acquired effective 30 September2016.
Sales growth at 5.3% was muted for reasons explained earlier; operating margin grew higher by 7.9% becauseofmaterialandothercostefficiencies.Financecostwasreduced by 5.5% due to better capital productivity and improvedborrowingmix.Profitbeforetaxandexceptionalitems grew by 3.7% reflecting the above and furtherconsidering the change in the Other income and Exchange gain/(loss)comparedtopreviousyear.Netprofit for theyear is lower considering exceptional charge this year of ` 498 lakhs and exceptional gain in the previous year of `1565lakhs.Exclusiveofexceptionalitems,netprofitforthe year is marginally higher than the previous year.
CREATIVITY AND INNOVATION (C&I)
The Research and Development (R&D) function (a.k.a. Creativity and Innovation within the Company) has been one of the key drivers of your Company’s growth as a leading global player. Your Company’s C&I Team have successfully amalgamated its deep knowledge of the polymer science, conversion process and engineering to create Tubes with special features. Outcome is the best of aesthetics and functionality. C&I team brain storm with market research group, customers and strategic partners to understand the evolving needs in the market place and develop new packaging solutions for reputed brands proactively. Your C&I team continually partner with customers in rolling out new products globally. A structured C&I process ensures
that the innovation pipeline of the Company at all times is full,andcontributestothesalesandprofitabilityofyourCompany.
The C&I function intensely work on sustainability and continually launches environment-friendly tubes and process. Cross sections of the latest innovated products of your Company are presented in the Features section of the Annual Report. The R&D facility of your Company hasbeenrecognizedandcertifiedbytheDepartmentofScientific&IndustrialResearch,GovernmentofIndia.
Your Company continues to protect the enormous intellectual property which the C&I function is creating. In thisregard,yourCompanyhasfiledtilldateasmanyas142patentapplicationsinthedifferentgeographiesinrespectof the various inventions by its R&D, and has already been granted 38 patents. To strengthen the capability of the R&D, additional resources have been inducted in the advancedscientificresearchandsimulationlab.
Your Company’s research and development effortscontinue to win accolades in several forums and among customers across the globe.
TECHNOLOGY
Your Company always has seen Technology as a great enabler to deliver disruptive changes be in the Product, Process, Equipment or Raw materials. As a means to create and sustain competitive edge at all times.
Our success last year with developing Mystik, the tube structure that can comprehensively protect highly aggressive formulations we believe is a great disruptor as it can open entirely new categories such as Hair Colorants, Packaged foods and even some Pharma products which were out of reach of plastic or laminated tubes so far. These tubes are now under stability and storage trial tests with several customers. Hair colorant, as and when it opens up to Mystik, will bring additional about 2 bio tubes for Hair colorants into our market eco-system and possibly equivalent number on account of the Developer tubes usually supplied along with.
Your company is now challenging it self on identifying the bottleneck processes and technology that hinders the quicker turn-around of the products to its customers, therefore actively working on forging strategic alliances to bring in the solution to the above challenges.
As shared in the previous Annual report, your Company is now working on high speed on-line real-time quality inspection systems which will help assure the customers that every tube supplied by Essel is defect free for direct use in their process. These systems are now under trial in our units and will be rolled out in a phased manner across the globe.
e-Commerce is causing new disruptions in the FMCG market place. Niche brands with global visibility through the web and social media, and helped by e-logistics now

22 23Annual Report 2017-18
compete with traditional brands. This has introduced new volatility in the off-take which in turn affects ourcapacity and supply chain for tubes. We are working on newtechnologytohelpuscreateflexibilitybasedonthetheory of constraints. With this we believe we can optimize our capacity utilization and improve our response time to the delight of our customers.
FINANCE
Robust operational performance, judicious capex spend, continuous measures to improve capital productivity accountforyourCompany’shealthycashflows.Averageinterest rate reduced by 40 bps and the global financecost continued its reducing trend by dropping 5.5% vs previous year. Prudent exchange risk management has helped to contain the exchange loss in the consolidated financial statement at ` 8 crore Large part of exchange loss is actually the premium paid on forward exchange contracts used in hedging exposures. The consolidated net debt as at end of FY18 was ` 564 crores lower by ` 140 crores compared to previous year end, representing a healthy debt equity ratio of 0.59 and a DSCR of 2.2. Your Company’s term debt is rated AA. The consolidated ROCE and ROE however declined due to the muted growth in Sales for reasons stated earlier, but continue to be healthy at 16.8% and 15% respectively.
HUMAN CAPITAL
Your company strongly believes that our people are our greatest assets. They give your company its unique competitive edge. As a global organization, your company comprises of a diverse mix of people from differenteducational, cultural and geographic backgrounds who bring their unique inherent strengths to the organization.
Your company recognizes and nurtures their strengths through a structured Talent Management process focused on capability building through customised Classroom Trainings, e-Learning, Executive Coaching and Cross functional/cross geographical action learning projects.The process also ensures continuous talent availability, through Job rotation, Job enlargement, Cadre buildingprograms, leveraging talent in various geographies for global roles.
Your company is committed to continuously engaging its employees as a key driver for shareholder value creation. Customised Unit level and Manager level Employee engagement action plans have enabled your company to take up positive steps in this journey. These actions helped the company to take up the global Employee Engagement score to 69%. In order to ensure that employees across the globe are aligned with company goals and experience all people processes in a standard manner, your company uses ‘EPRISM’ system a best in class software for Employee Lifecycle management. EPRISM brings all employees globally closer to each other and ensures information availability on their fingertips. EPRISM also provides
a forum for internal networking, plus it has advanced analytics ability and connects all “people processes” together to help organisation build internal capability and take holistic people decisions.
Your company also continues to put special emphasis on Employee Communication through Town halls, Leadership interactions and messages, newsletters and interesting competitions to ensure alignment with Company’s Vision and Mission.
INFORMATION TECHNOLOGY (IT)
Your company strongly believes in the power of IT and it continues to invest in new systems and processes which enable it to move on Digital Transformation and Business Intelligence journey. Your company hasaugmented and implemented warehouse managementsystem tightly integrated with ERP in many of its units thereby further improving operational efficiency. Yourcompany continues to work on improving collaboration across various units spread across many geographies by implementing on-line Document Management System (DMS) and Business Process Management (BPM) tools which is helping in automating various workflowsthereby reducing turnaround time (TAT) of processes, increasing transparency and governance. Keeping customer experience in mind, your company has further invested in enhancing the features of Graphics & Artwork Management System which has digitized the entire process of capturing customers requirement and getting their approval online, thereby reducing cycle time and errors. We are proud to state that due to robust internal processes, excellent planning and coordination amongst various departments your company migrated to new GST regime as per schedule, without any disruption in production or in our supplies to the customers which was much appreciated by our esteemed customers.
While undertaking IT implementation we take particular care about IT security as part of “must do” activity. To this end, we periodically undertake Vulnerable Assessment and Penetration test (VAPT) which also involves ethical hacking of critical infrastructure. Your company continues to invest in state of art Disaster Recovery systems, redundant networking system and processes which ensure business continuity in case of any unforeseen events. A Steering Committee comprising of the Corporate Leadership Team supervises the IT initiativesand ITeffectiveness throughregular monthly reviews.
INTERNAL CONTROL SYSTEMS AND ITS ADEQUACY
Your Company has in place internal control systems and a structured internal audit process charged with the task of safeguarding the assets of your Company and ensuring reliability and accuracy of the accounting and other operational data. The internal audit department reports to the Audit Committee of the Board of Directors.

22 23Annual Report 2017-18
Your Company has a system of monthly review of business as a key operational control wherein the performance of units is reviewed against budgets and corrective action is initiated.
Your Company has in place a capital expenditure control system for authorizing spend on new assets and projects. Accountability is established for implementing the projects on time and within approved budget. This is overseen by the Investment Committee of the Corporate Leadership team.
YourCompanydeploysITsupportedworkflowsindifferentareas as a way to enhance controls without compromising on speed and accountability.
The Audit Committee, the Statutory Auditors and the top management are regularly apprised of the internal auditfindings,andregularupdatesprovidedattheAuditcommittee meetings of the Action taken on the internal audit reports. The Audit Committee of the Board consisting of non- executive independent Directors reviews the quarterly,halfyearlyandtheannualfinancialstatementsof your Company. A detailed note on the functioning of the Audit Committee and of the other Committees of the Board forms part of the section on Corporate Governance in the Annual Report.
During the year, your Company carried out a detailed review of internal financial controls in the India units.The findings were satisfactory and suggestions forimprovement have been taken up for implementation. Policy guidelines and SOPs continue to be updated where required to keep pace with business needs.
RISK MANAGEMENT
The Board of Directors and the Audit Committee of the Board review the business risks to which your Company is exposed and the various mitigation measures. The senior management team led by Chairman & Managing Director is responsible to manage risks pro-actively, developing and implementing appropriate mitigation measures.
Key risks to which your Company is exposed include:
a) Escalation in raw material prices and impact for long term contracts
• YourCompanyhasincorporatedrawmaterialcostescalation pass through clauses in its customer contracts which enable the product prices to be revised periodically to reflect any variation inmaterial costs.
• Where possible, your Company continues toidentify and establish alternate supply sources and/oralternativematerialsinordertoeffectivelymanage the material costs as well as supply continuity.
b) Single Product dependency
• Being an essential consumer product and anitem of daily use, tooth paste as a category still dominates your Company’s product range albeit to a much lesser extent than before. However, it also tends to have a stable demand during adverse economic environment. Your Company’s engagement with all major brands in this category furtherfortifiesitsposition.
• YourCompanynowhasover40%ofitsrevenuecoming from cosmetics, food and pharma categories which is making for a diversifiedportfolio in terms of customers and application categories.
• Tubeasapackagingformatisbeingincreasinglypreferred for products in paste/gel/cream andeven viscous liquid form for reasons of ease of dispensing, convenience, resource reduction, capability for branding and decoration. Here too, Laminated Tubes are being increasingly sought after by FMCG brands compared to plastic and aluminum tubes.
• Scale, technology, integrated manufacturingprocess, innovation capability, operational efficiencies are other factors which furtherstrengthen your Company’s competitiveness in the tubes space, as well its ability to work as global partner for large multi-national customers including local brands in each geography.
c) Attracting and retaining talent
As with any other business, high demand for talent globally impacts employee turnover. Your Company addresses this to the best possible extent by being an empowering organization with professional management culture and maintaining a lean structure. Contemporary HR practices such as career planning, competitive remuneration, performance management system, performance linked pay, stock options, skills and competency training are now well established across the Company and its subsidiaries. Top talent is given the opportunity to move across functions and geographies. Employee engagement survey is carried out annually and the findings areused to further improve employee satisfaction.
d) Currency volatility
The global nature of operations exposes the Company to multiple currencies; fluctuations in exchangerates could affect your Company’s performance.Appropriate pass through clauses have been built into long term customer contracts in order to offset the impact onmaterial cost due to exchangerate fluctuations. Prices get reviewed and revised

24 25Annual Report 2017-18
in the event of significant currency movements.Your Company also has the policy of systematically hedging its trade and capital exposures using forward contracts. Wherever possible transactional currencies are aligned to the reporting currency in order to obviateexchangefluctuationimpact.
e) Economic downturn
This could impact your Company’s markets, suppliers, customers and finances leading to business slowdown, disruptions etc.
• Your Company’s products are linked to dailynecessities of the consumers and their demand generally is not much impacted by the downturn.
• Your Company pro-actively monitors theemerging trends in consumption and offersrelevant solutions to its customers so as to stay ahead of the curve.
• Your Company also is focused on containingcosts and improving efficiencies as ameans tostay competitive.
• Proactive supplierand customerengagement isanother way your Company seeks to minimize risk to business continuity.
f) Competition
This could put pressure on volume growth and pricing. Your Company focuses on superior quality, shorter lead time and high service level as means to keep the customer satisfaction high. It also invests in technology driven innovation, Sustainability driven products/ process to sustain its competitive edge.Besides, its ability to support the customer across the globeandfocusonefficiencyandvaluemanagement
help to sustain its position as a world-class provider of packaging solution.
g) Wage increases in the developing markets This could impact costs and margins. Your Company is
pro-actively using automation and asset productivity improvement as a means to contain the headcount and manage employee costs.
OUTLOOKYour Company is on track with strategy implementation. The non-oral care category globally holds much growth potential for your Company over next few years by replacing plastic/ aluminum tubes andbottleswith newgeneration laminated tubes.Added to that, Technology/Sustainability innovations such as Mystik, Green Maple Leaf, Etain etc. have the potential to open up new opportunities, brands and customers going forward. Extensive customer engagement and focused business development efforts have made your Company a well-regarded packaging solution provider for non oral care brands globally. The performance in the recent years of your Company’s business is an ample evidence of this. There are a number of initiatives under way for deploying technology to elevate customer experience of our products and service. With its large scale, global presence, innovation capability, technology focus and a motivated Human capital, your Company is well set to deliver on the task of delighting all its stakeholders.
CAUTIONARY STATEMENTStatements in this Annual report, particularly those which relate to management discussion and analysis, describing your Company’s objectives, projections, estimates and expectations may constitute “forward looking statements” within the meaning of applicable laws and regulations. Actualresultsmaymateriallydifferfromthoseexpressedor implied.
Amesa
38%
Europe
19%
EAP 22%
Amer
icas
21%
Revenue 2017
Amesa
37%
Europe
21%
EAP 22%
Amer
icas
20%
Revenue 2018
24 25Annual Report 2017-18
Corporate Governance ReportESSEL’S PHILOSOPHY ON CORPORATE GOVERNANCECorporate Governance pertains to system, by which companies are directed and controlled ethically, keeping in mind enhancement of long-term sustainable interests of stakeholders. It refers to blend of law, regulations, ethical and voluntary practices, which enable the Companytoattractfinancialandhumancapital,performefficientlyandtherebyperpetuateitintogeneratinglong-term economic value for its shareholders, while respecting and balancing the interests of other stakeholders and the society at large.
It aims to align interest of the Company with its shareholders and other stakeholders The incentive for companies, and those who own and manage them, to adopt global governance standards, is that these standards will help them to achieve a long-term partnership with its stakeholders and achieve its corporate objectives efficiently. The principal characteristics ofcorporate governance are transparency, independence, accountability, responsibility, fairness and social responsibility.
A good governance process provides transparency of corporate policies and the decision making process and also strengthens internal systems and helps in building good relationship with all stakeholdes. We at Essel Propack believe in being transparent and commit ourselves to adherence of good corporate governance practices at all times as we believe that good governance generates goodwill among business partners, customers and investors and helps the Company to grow.
Corporate EthicsThe Company adheres to the highest standards of business ethics, compliance with statutory and legal requirements and commitment to transparency in business dealings.
Code of Conduct for Board Members and Senior ManagementThe Code of Conduct highlights Corporate Governance as the cornerstone for sustained management performance, for serving all the stakeholders and for instilling pride of association.
The Code is, inter alia, applicable to all directors and senior management executives. The Code impresses upon directors and senior management to uphold the interest
of the Company and its stakeholders and to endeavour to fulfillallthefiduciaryobligations.TheCodeisavailableonthe Company’s website.
Company has received a declaration of compliance with the Code of Conduct from Directors and Senior Management Personnel. The declaration by the Managing Director affirming compliance of the Board of Directorsand Senior Management Personnel to the Code of Conduct is appended to this Report.
Code of Conduct for Prevention of Insider TradingThe Company has adopted a ‘Code of conduct to regulate, monitor and report Trading by Insiders’ (the Code) pursuant to SEBI (Prohibition of Insider Trading) Regulations, 2015. The Code is applicable to all Directors andsuchDesignatedPersonsasdefinedintheCode.
The detailed report on Corporate Governance for the year ended on 31 March 2018 under applicable provisions of the SEBI (Listing Obligations and Disclosure Requirements) Regulations, 2015 (the Listing Regulations or Listing Agreements) is set out below.
1 BOARD OF DIRECTORS1.1 Directors’ profile The Board of Directors of the Company comprises
highly renowned professionals drawn from diverse fields.Theybringwiththemwiderangeofskillsandexperience to the Board which enhance the quality oftheBoard’sdecisionmakingprocess.ProfileoftheDirectors are posted on the Company’s website www.esselpropack.com.
1.2 Board Procedure With a view to follow transparency, the Board follows
procedure of advance planning for the matters requiring discussion/decisionsbytheBoard.TheBoardisgivenpresentation covering finance, sales, major businessarea and operations of the Company and other matters as members want. Agenda papers for the Board and committeemeetingsarefinalized inconsultationwithconcerned functionaries. The minutes of proceeding of each board meetings are maintained in terms of statutory provisions. Meetings of various committees are held properly. The minutes of committee meetings are placed regularly before the Board.
The Agenda and notes to agenda for the meetings of the Board and Committees, together with relevant details, resolutions and documents are circulated

26 27Annual Report 2017-18
in advance of the meeting. The Company follows practice to schedule dates of meetings for coming year or such period as possible. Meetings are largely held in attendance of ChiefOperatingOfficer, ChiefFinancial Officer and Company Secretary and otherexecutives are also invited wherever necessary for discussion or inputs.
1.3 Composition of the Board, category, directorship etc.
TheBoardoftheCompanycomprisesoffiveDirectorsas on 31 March 2018 with an optimum combination of
executive and non-executive directors, of which three are Independent Directors, one is Non-executive and one is Managing Director. Independent Directors are renowned professional with specialization in their respective fields, having varied skills and expertiseand not related to promoters of the Company. The Company is in compliance of the Listing Regulations and the Companies Act 2013 (the Act). The composition of the Board and other details as on 31 March 2018 are as below.
Name of Director Category No. of Directorship in other companies (1)
Position in outside Committees (2)
Chairman MemberMr. Mukund Chitale Independent Director 9 3 5Mr. Boman Moradian Independent Director 3 0 4Ms. Radhika Pereira Independent Director 4 2 3Mr. Ashok Goel Chairman and Managing Director 13 0 2Mr. Atul Goel Non-executive Director 11 0 0
(1) Including private companies but excluding foreign companies, companies registered under section 8 of the Companies Act 2013, and alternate directorship.
(2) Represents Chairmanship /MembershipofAuditCommitteeandStakeholdersRelationshipCommitteesofothercompanies.
Mr. Ashok Goel and Mr. Atul Goel are related to each other. None of the other Directors on the Board are related to each other.
Mr. Ashok Goel holds 4,23,760 equity shares in the Company. 8,93,39,014 equity shares are in the name of Mr. Ashok Kumar Goel, which is being held by him as a trustee of Ashok Goel Trust. Other directors are not holding any share in the Company.
Directors of the Company do not hold any options or instruments convertible into equity shares of the Company.
1.4 Board Meetings and attendance During the year under review, the Board of Directors
oftheCompanymetfivetimes i.e.on23May2017, 10 August 2017, 7 November 2017, 1 February 2018 and 16 March 2018. The agenda papers along with notes and other supportings were circulated in advance of the Board Meeting with sufficientinformation.
Directors’ attendance in Board Meetings held during thefinancialyearandlastAnnualGeneralMeetingareas under.
Name of DirectorNo. of Board Meetings Attendance at Last
Annual General Meeting
Held Attended
Mr. Mukund Chitale 5 5 YesMr. Boman Moradian 5 4 YesMs. Radhika Pereira 5 5 YesMr. Ashok Goel 5 5 YesMr. Atul Goel 5 3 Yes
1.5 Familiarization Programme The Company’s policy on programmes and measures
to familiarize Independent Directors about the Company, its business, updates and development includes various measures viz. issue of appointment letters containing terms, duties etc, presentation and other programmes as may be appropriate from time to time. Periodic presentations are made at the Board and Committee meetings on business,
performance updates of the Company, global business environment, business strategy and risk involved. The Policy and programme aims to provide insights into the Company to enable independent directors to understand the business, functionaries, business model and other matters. The Company’s Policy and other details in this respect is posted in investors section on the Company’s website or link, http://www.esselpropack.com

26 27Annual Report 2017-18
2 PERFORMANCE EVALUATIONDuring the year, the Board conducted a formal annual evaluation for evaluating its performance as well as that of its Committees and individual Directors, including the Chairman of the Board meetings. The performance of the Committees was evaluated by the Board seeking inputs from the Committee members. The criteria to evaluate the performance of the Board, committees, independent directors and non-independent directors were;a)BoardComposition,size,mixofskill,experienceandrole;b)attendanceanddeliberationinthemeetings;c) contribution or suggestions for effective functioning,development of strategy, board process, policies and others. TheDirectorswere satisfiedwith the evaluationresults, which reflected the overall engagement of theBoard and its Committees with the Company.
3 POLICY ON APPOINTMENT OF DIRECTOR, QUALIFICATION AND ATTRIBUTES
The Company’s policy on appointment of directors provides, inter alia, criteria of qualification, experienceand skills in relation to appointment for the position of director.
4 AUDIT COMMITTEEAudit Committee of the Board has been constituted in terms of the Listing Regulations and Section 177 of the Act.
The Audit Committee comprises of three directors. All members of the Audit Committee are independent directors. The Committee met four times during the year on 23 May 2017, 10 August 2017, 7 November 2017, and 1 February 2018.
Name of the Member Category
No. of MeetingsHeld Attended
Mr. Mukund Chitale, Chairman
Independent Director
4 4
Mr. Boman Moradian
Independent Director
4 3
Ms. Radhika Pereira
Independent Director
4 3
Company Secretary of the Company acts as secretary to the Audit Committee.
Audit Committee meetings are also attended by Chief Financial Officer, COO, representatives of the StatutoryAuditor and Internal Auditors and other executives as and when required. The Committee also invites senior
executives, where it considers appropriate, to attend meetings of the Audit Committee.
Terms of reference and role of the audit committee includes the matters specified under the Act and theListing Regulations. Broad terms of reference includes: oversightsoffinancialreportingprocess,reviewfinancialresults and related information, approval of related party transactions, review internal financial controls and riskmanagement, evaluate performance of statutory and internal auditors, audit process, relevant compliances, appointment and payments to statutory auditors.
5 NOMINATION AND REMUNERATION COMMITTEE
Nomination and Remuneration Committee of the Board (NRC) has been constituted in terms of the Listing Regulations and Section 178 of the Act.
The Nomination and Remuneration Committee comprises of three directors. All the members of the Nomination and remuneration committee are independent directos
During the year under review, the Nomination & Remuneration Committee met once on 23 May 2017.
The Composition of the NRC and the attendance are as under.
Name of the Member Category
No. of MeetingsHeld Attended
Mr. Boman Moradian, Chairman
Independent Director
1 1
Mr. Mukund Chitale
Independent Director
1 1
Ms. Radhika Pereira
Independent Director
1 1
Terms of reference of the NRC includes the matters specifiedundertheActandtheListingRegulations.Broadtermsofreferenceincludes;formulationofremunerationpolicy,setcriteriafordeterminingqualifications,positiveattributes and independence of a director, formulation of criteria for evaluation of independent directors and the Board and criteria for appointment of directors and senior management.
5.1 Remuneration of Directors Details of remuneration, perquisites etc and sitting
fees of Directors for the financial year ended on 31 March 2018 are as under.

28 29Annual Report 2017-18
Name of Director Category` in lakhs
Commission or annual remuneration Sitting fees Total
Mr. Mukund Chitale Independent Director 15.00 2.20 17.20
Mr. Boman Moradian Independent Director 15.00 2.40 17.40
Ms. Radhika Pereira Independent Director 15.00 2.00 17.00
Mr. Atul Goel Non-executive Director Nil Nil Nil
Name of Director CategoryRemuneration components ` in lakhs
Salary Allowance, perquisites Cont. to PF Performance
bonus Total
Mr. Ashok Goel Chairman & Managing Director
304.66 145.48 36.56 153.00 639.70
Policy are summarized hereunder.
a) Nomination and Remuneration committee (NRC) has important role in monitoring the policy.
b) The Board, on the recommendation of NRC approves the remuneration payable to the Managing Director of the Company. The remuneration payable to the Managing Director shall be in accordance with the applicable provisions of the Act, and the rules framed thereunder.
c) The Board, on the recommendation of the NRC approves the remuneration payable to the Key Managerial Personnel and Senior Management Personnel. The structure of remuneration payable to Key Managerial Personnel and Senior Management Personnel will be in accordance with the compensation framework adopted for employees generally by the Human Resource department of the Company.
d) The commission to the Independent Directors is paid as per the provisions of the Act and the rules framed thereunder.
e) The Commission will be distributed among the independent directors as per criteria mentioned in this Report.
5.3 Criteria for payment to Non-executive / Independent Directors
Independent Directors are paid sitting fee of ` 20,000 for each meeting of the Board or committee thereof. The Company also reimburses expenses incurred by the directors for attending the meetings. The remuneration by way of commission to the independent directors is decided, keeping in view the recommendations by NRC, based on number of factors including number of meetings attended by the
Period of appointment of Mr. Ashok Goel, Chairman & ManagingDirectorisforaperiodoffiveyearsw.e.f21October 2013 and it can be terminated by either party giving three months’ notice to other.
Remuneration to Mr. Ashok Goel, Chairman & ManagingDirectoroftheCompanycomprisesoffixedpay, perquisites and variable pay as mentioned above. Performancebonus/variablepayisbasedoncriteriaincluding achievement of performance standards as per Remuneration policy of the Company.
Performance bonus of the Chairman & Managing Director is as may be approved by the Nomination & Remuneration Committee and based on criteria including achievement of performance standards as mutually set out from time to time and as per Remuneration policy of the Company.
Commission payable to Directors as mentioned above is provided for the financial year 2017-18 and willbepaid subsequent to theapprovalof thefinancialstatements.
5.2 Remuneration policy The Board on the recommendation of Nomination and
Remuneration Committee approved Remuneration Policy for Directors, KMP and senior management employees.
The policy describes various aspects and guiding factors while determining the remuneration to Directors, KMP and senior managerial personnel of the Company with intent to maintain level and composition of remuneration reasonable and sufficient to retain, motivate and promote talentand to ensure long term sustainability of talented managerial persons and also create competitive advantage. Broad provisions of the Remuneration

28 29Annual Report 2017-18
director during the year, contribution to the Board and Committees and involvement in the decision making.
6 STAKEHOLDERS RELATIONSHIP COMMITTEE
The Stakeholders’ relationship Committee comprises of two directors. The Chairperson of the committee is an Independent Director. During the year under review, the Stakeholders’ Relationship Committee met three times on 23 May 2017, 10 August 2017 and 7 November 2017.
The Composition of the above Committee and the attendance is as under.
Name of Member Category
No. of MeetingsHeld Attended
Mr. Boman Moradian, Chairman
Independent Director
3 3
Mr. Ashok Goel Chairman & Managing Director
3 3
During the year, three investors complaints were received and all the complaints have been resolved. No investors’ complaints were pending as on 31 March 2018.
Terms of Reference and role of the Stakeholders Relationship Committee includes the matters specifiedunder the Act and the Listing Regulations. Broad terms of referenceincludes;toconsiderandresolvethegrievancesof security holders of the Company, to redress the shareholders’ and investors’ complaints such as those relating to transfer of shares, non-receipt of annual reports, etc.
Mr. Suresh Savaliya, Head – Legal and Company Secretary hasbeenappointedascomplianceofficerpursuanttotheListing Regulations. The designated e-mail for investor service and correspondence is [email protected]
7 OTHER COMMITTEESIn addition to the above referred committees, the Board has constituted committees of Directors and executives to look into various business matters. These committee includes corporate social responsibility committee, security and allotment committee and risk management committee. Details relating to corporate social responsibility committee are given in the Board’s report.
8 GENERAL BODY MEETINGSDetails of last three Annual General Meetings (AGM) are given here below.
Year Date Time Venue2014-15 30.06.2015 11.00 a.m Registered office at
P.O. Vasind, Taluka: Shahapur, District: Thane, Maharashtra - 421604, India
2015-16 17.06.2016 11.00 a.m2016-17 12.07.2017 11.00 a.m
The following are the special resolutions passed at the last three AGM.
Date of AGM Summary of special resolution passed17.06.2016 Keeping registers, returns, etc at
registeredoffice/otherplace.12.07.2017 Redesignate Mr. Ashok Goel as Chairman
and Managing Director.
Resolutions passed through postal ballot: The Company has passed following resolution through postal ballot duringthefinancialyear.
1. Special Resolution under section 186 and the other applicable provisions of the Companies Act, 2013 to give loan, provide guarantee, security and/or makeinvestment not exceeding limit of ` 1200 Crores.
a) The Board of Directors of the Company had appointed Mr. Dharmesh Zaveri of D M Zaveri& Co., Practicing Company Secretary, as the scrutinizer for conducting the postal ballot voting process in a fair and transparent manner.
b) The Company had completed the dispatch of the PostalBallotNoticedated12 July2017togetherwith the explanatory statement along with forms and reply envelopes to all the shareholders whose namesappearedontheRegisterofMembers/listofbeneficiariesason5July2017.
c) The voting period under the postal ballot was kept open from 9.00 a.m. on Thursday, 13 July2017 to 5.00 p.m. on Tuesday, 11 August 2017 (either physically or through electronic mode).
d) All postal ballots forms received/receivable onor before of close of working hours of 11 August 2017thelastdateandtimefixedbytheCompanyfor receipt of the forms, had been considered for scrutiny or voting purpose.

30 31Annual Report 2017-18
e) On 12 August 2017 the results of the postal ballot as per the Scrutinizer’s Report was announced and declared that the above resolution was passed with requisite majority.
2. Special Resolution under section 42, 71 and the other applicable provisions of Companies Act, 2013 to raise the funds by way of issue of secured/unsecuredredeemable non-convertible Debentures on private placement basis provided that outstanding amount of debt securities shall not exceed ̀ 200 Crores & Special Resolution under section 14 and other applicable provisions of Companies Act, 2013 to adopt new set of Articles of Association.
a) The Board of Directors of the Company had appointed Mr. Dharmesh Zaveri of D M Zaveri& Co., Practicing Company Secretary, as the scrutinizer for conducting the postal ballot voting process in a fair and transparent manner.
b) The Company had completed the dispatch of the Postal Ballot Notice dated 11 November 2017 together with the explanatory statement along with forms and reply envelopes to all the shareholders whose names appeared on the Register of Members/list of beneficiaries as on 3 November 2017.
c) The voting period under the postal ballot was kept open from 9.00 a.m. on Monday, 13 November 2017 to 5.00 p.m. on Tuesday, 12 December 2017 (either physically or through electronic mode).
d) Allpostalballotsformsreceived/receivableonorbefore of close of working hours of 12 December 2017thelastdateandtimefixedbytheCompanyfor receipt of the forms, had been considered for scrutiny or voting purpose.
e) On 13 December 2017 the results of the postal ballot as per the Scrutinizer’s Report was announced and declared that the above resolution was passed with requisite majority.
9 DISCLOSURES a) During the year, there were no materially
significant transactionswith relatedparties thatmayhavepotentialconflictwiththe interestsofthe Company at large. Related Party transactions havebeendisclosedinthenotestothefinancialstatements and in Board’s Report. Policy on dealing with related party transactions is posted on the website of the Company and can be accessible by following the link: http://www.esselpropack.com/wp-content/uploads/2015/03/Related-PartyTransaction-Policy.pdf.
b) The Company has complied with all applicable provisions of the Listing Regulations and other SEBI Regulations wherever applicable. No penalties have been imposed or stricture issued by SEBI, Stock Exchanges or any statutory authorities on matters relating to capital markets during the last three years.
c) The Company has a Whistle-Blower Policy for establishing a vigil mechanism to report genuine concerns regarding unethical behavior and mismanagement, if any. No employee of the Company was denied access to the Audit Committee. Details relating to vigil mechanism are also mentioned in the Board’s Report.
d) The Company has complied with the mandatory requirements of the Corporate Governance of the Listing Regulations and also followed non-mandatory requirements relating to financialstatements with unmodified audit opinion /withoutqualification
e) The Company is in compliance with the provisions in relation to material subsidiary wherever applicable. Policy for determining ‘material’ subsidiary is posted on the website and can be accessible by following the link: http://www.esselpropack.com/wp-content/uploads/2015/03/Policy-for-determining-material-subsidiary.pdf
f) There were no pecuniary relationships or transactions of non-executive directors vis-à-vis the Company during the year under review, except payment of sitting fees and remuneration.
g) Disclosure of commodity price risks and commodity hedging activities: The Company has price review mechanism to protect against material movement in price of raw materials.
10 MEANS OF COMMUNICATION a) Newspapers: The quarterly, half-yearly and
annual financial results of the Company arepublished in leading newspapers viz. Economics Times, DNA and Maharashtra Times.
b) News Release and Presentation: The Company also regularly releases press release to enable the stakeholders to appreciate the important developments and updates about the Company. News releases, presentations made to media, analysts, institutional investors, transcript of conference call with investors/analysts etc.are displayed on the company’s website www.esselpropack.com.

30 31Annual Report 2017-18
c) Website: The Company’s website www.esselpropack.com contains a separate dedicated section “Investors” and “Press Release” where shareholders information is available. Quarterly and annual financial results, annual report arealso available on the website. Press releases made by the Company from time to time are also displayed on the website.
d) Annual Report: Annual Report containing, inter alia, Board’s report, auditors’ report, audited financial statements and other importantinformation is circulated to members and others entitled thereto. The Annual Report is also available on website of the Company. Verbatim copy of financial statements, reports etc arecirculated in this Report and the same shall be deemed as signed copy.
e) Website of the Stock Exchanges: Disclosures andfilingwiththeBSELimited(BSE)andNationalStock Exchange of India Limited (NSE) by the Company are also hosted on website of the said stock exchanges.
f) Disclosures: The Company also informs by way of intimation to the Stock Exchanges all price sensitive matters or such other matters which in its opinion are material and have relevance to the shareholdes.
11 GENERAL SHAREHOLDERS’ INFORMATION a) Annual General Meeting is scheduled to be held
onWednesday,13June2018at11:00a.m.attheCompany’sregisteredofficeatP.O.Vasind,TalukaShahapur, Thane 421604.
b) Financial Year: The Company follows April to March as its financial year. The results forevery quarter beginning from April are declared tentatively in the month following the quarter or within the time line as per Listing Regulations.
c) Record Date: Record date for the purpose including payment of dividend is given in Notes to Notice convening above mentioned Annual General Meeting.
d) Dividend Payment Date: Dividend will be paid within the stipulated period, after its declaration by the members at the AGM.
Dividend on Equity Shares when declared will be made payable after the AGM to those Shareholders whose names stand in the Company’s Register of Membersonrelevantdatesofrecorddate/book
closure. In respect of shares held in electronic form/ demat, the dividend will be paid on thebasis of beneficial ownership as per detailsfurnished by the depositories for this purpose.
e) Listing on Stock Exchanges: The Company’s equity shares are listed on the following Stock Exchanges.
National Stock Exchange of India Limited (NSE), ExchangePlaza,5thFloor,PlotNo.C/1,GBlock,Bandra Kurla Complex, Bandra (East), Mumbai 400051.
BSELimited(BSE),P.J.Towers,DalalStreet,Fort,Mumbai 400001.
Stock Code/Symbol: BSE - 500135. NSE - ESSELPACK. ISIN: INE255A01020
Debt Securities: Listed on Wholesale Debt Market (WDM) Segment of BSE.
Series: B Scrip Code: 951430, ISIN: INE255A07522 (Redeemed on 18.04.2018)
Scrip Code: 957238, ISIN: INE255A08AV3
Debenture Trustees: Axis Trustee Services Limited, Axis House, 2nd Floor, Bombay Dyeing Mills Compound, Pandurang Budhkar Marg, Worli, Mumbai 400 025. Tel: +91 22 43255231
f) Payment of Listing Fees: The Company has paid annual listing fee for the year 2018-19 to BSE and NSE within time.
g) Market Price Data: The monthly high and low price of shares traded on the National Stock Exchange of India Limited (NSE) and the BSE Limited (BSE) are as follows:
Month & YearBSE (In `) NSE (In `)
High Low High LowApril 2017 259 231.1 259.4 230.55May 2017 276.4 246 275.95 245.95June2017 272.75 238 274.95 238.2July2017 256.25 233.25 257 237.5August 2017 285.6 235.5 285.9 237.05September 2017 273.35 240.9 274.5 240.35October 2017 286 248.7 287 248.15November 2017 317 276.5 315.55 275.1December 2017 305 266.5 299.1 265.05January2018 300 282.3 300 282.3February 2018 293.8 246 293.85 244.05March 2018 278 235.1 270.65 235.1

32 33Annual Report 2017-18
i) Share Transfer System
Applications for transfer of shares in physical form are minimal and processed through the Company’s Registrar & Transfer Agent. The Share Transfer Committee constituted for transfer /transmission of shares, issue of duplicate shares and allied matters The transfers of shares in physical form as and when received are normally processed within 15 days from the date of receipt of documents complete in all respects.
j) Distribution of Shareholding as on 31 March 2018
No. of equity shares
No. of share
holders
% of share
holders
No. of Shares
Held
% of share
Holding1 to 500 28098 85.64 2605753 1.66501 – 1000 2128 6.49 1663246 1.061001 – 5000 2104 6.41 4432177 2.825001 – 10000 243 0.74 1740223 1.1110001 and above
238 0.72 146740265 93.35
Total 32811 100 157181664 100
k) Dematerialization of equity shares and liquidity
As on 31 March 2018, 99.15% of the Equity Shares have been dematerialized.
Equity Shares of the Company are under compulsory demat trading by all investos. Consideringtheadvantagesofscripless/demattrading, shareholders are requested to consider dematerialization of their shares so as to avoid inconvenience in future.
l) Commodity price risk or foreign exchange risk and hedging activities.
Risks are associated with various forex exposures like translation, transaction, economic etc. the Company would have on risk on net import side. Import Exposure includes Acceptances, Trade Payables, Trade Buyer’s Credit, Interest Payable, CAPEX Buyer’s Credit etc. and export exposure includes trade receivable, royalty receivable etc.
There are various financial instruments forhedging available to mitigate these risks like Forward Cover, Options, and Derivative etc. Based on the risks involved in the hedging instrument, the Company is normally using Forward Cover as measure for mitigating the Forex Volatility.
m) Plant Locations: TheCompanyhasplants/unitsat Vasind, Wada, Dhanoli (Vapi), Nalagarh (HP) andGoaasattheendofthefinancialyear.
n) Registrar & Transfer Agent and Address for Communication
Registrar & Share Transfer Agent: Bigshare Services Private Limited, 1st Floor, Bharat Tin works Building, Opp Vasant Oasis, Makwana road, Marol, Andheri (E), Mumbai- 400059. Tel No. 022 62638200, Fax: 022 62638299.
Registered Office: P.O. Vasind, Taluka Shahapur, Thane 421604, Maharashtra, Tel: +91 9673333971/9882CIN:L74950MH1982PLC028947
Corporate Office: Top Floor, Times Tower, Kamala City, Senapati Bapat Marg, Lower Parel, Mumbai 400013. Tel: +91 22 2481 9000/9200.Fax: +91 22 24963137, [email protected], www.esselpropack.com
Investors Service and contact: Mr. Surje Singh, Sr. Manager – Legal & Secretarial at corporate officeasmentionedabove.
In order to facilitate investor servicing, the Company has a designated email id: [email protected] for registering queries by investos.
050100150200250300350
05000
10000150002000025000300003500040000
Apr-
17
May
-17
Jun-
17
Jul-1
7
Aug-
17
Sep-
17
Oct
-17
Nov
-17
Dec
-17
Jan-
18
Feb-
18
Mar
-18
Shar
e Pr
ice
BSE
Sen
sex
BSE Sensex v/s Share price
BSE Sensex Essel Propack
h) Performance of the Company’s stock price vis-a-vis Sensex / Index
0
50
100
150
200
250
300
350
8000
8500
9000
9500
10000
10500
11000
11500
Apr
-17
May
-17
Jun-
17
Jul-1
7
Aug
-17
Sep
-17
Oct
-17
Nov
-17
Dec
-17
Jan
-18
Feb
-18
Mar
-18
Shar
e Pr
ice
NSE
Nift
y
NSE Nifty v/s Share price
NSE Nifty Essel Propack
32 33Annual Report 2017-18
o) Shares in suspense account
The details of unclaimed equity shares and shareholders of the Company in unclaimed suspense account as on 31 March 2018 is mentioned below:
As on 1 April 2017 Shareholder who approached RTA & shares transferred in their favor Balance as on 31 March 2018
No. of Records No. of Shares No. of Records No. of Shares No. of Records No. of Shares1074 3160 -- -- 1074 3160
The voting rights on the shares outstanding in the suspense account shall remain frozen till the rightful owner of such shares claims the shares or as per statutory provisions.
p) Corporate benefits
DetailsofcorporatebenefitsissuedbytheCompanyaregivenbelow:-
Dividend
Year % Year % Year %1990-91 10% 1999-00 (Special) 150% 2007 60%1991-92 15% 1999-00 (Interim) 54% 2008 15%1992-93 20% 2000-01 54% 2009-10 20%1993-94 27% 2001 55% 2010-11 30%1994-95 27% 2002 65% 2011-12 32.50%1995-96 32% 2003 (Interim) 70% 2012-13 37.50%1996-97 (Interim) 15% 2003 (Final) 10% 2013-14 62.50%1996-97 (Final) 30% 2004 (Interim) 80% 2014-15 80.00%1997-98 (Interim) 20% 2004 (Final) 10% 2015-16 110%1997-98 (Final) 32% 2005 (Interim) 100% 2016-17 120%1998-99 (Interim) 20% 2005 (Special) 120%1998-99 (Final) 34% 2006 (Interim)* 100%
* The face value of equity shares was subdivided from `10 to `2witheffectfrom15June2006.
Rights Shares (Price inclusive of premium)
Year Face Value (`) Ratio Price (`)1990 10 1:2 10
1992 10 1:4 50
1995 10 1:3 225
Bonus shares
Year Face Value (`) Ratio1994 10 1:2
2000 10 3:5
For and on behalf of the BoardEssel Propack Limited
Ashok GoelChairman & Managing Director
26 April 2018, Mumbai

34 35Annual Report 2017-18
AUDITOR’S CERTIFICATE ON CORPORATE GOVERNANCE
ToThe Members,Essel Propack Limited
We have examined the compliance of conditions of Corporate Governance by Essel Propack Limited (‘the Company’), for the year ended 31 March 2018 as stipulated in the Securities and Exchange Board of India (Listing Obligations and Disclosure Requirements) Regulations, 2015 (collectively referred to as “SEBI Listing Regulations, 2015”).
The compliance of conditions of Corporate Governance is the responsibility of the Company’s Management. Our examination was limited to procedures and implementation thereof, adopted by the Company for ensuring the complianceoftheconditionsofCorporateGovernance.Itisneitheranauditnoranexpressionofopiniononthefinancialstatements of the Company.
In our opinion and to the best of our information and according to the explanations given to us, we certify that the Company has complied with the conditions of Corporate Governance as stipulated in the SEBI Listing Regulations, 2015.
WestatethatsuchcomplianceisneitheranassuranceastothefutureviabilityoftheCompanynortheefficiencyoreffectivenesswithwhichthemanagementhasconductedtheaffairsoftheCompany.
For Ford Rhodes Parks & Co LLPChartered Accountants
FirmRegistrationNumber102860W/W100089
Ramaswamy SubramanianPartner
26 April 2018, Mumbai Membership Number 016059
DECLARATION IN RESPECT OF CODE OF CONDUCT
InaccordancewiththeSEBI(ListingObligationandDisclosureRequirements)Regulations,2015,Iherebyconfirmanddeclarethat,alltheDirectorsandtheSeniorManagementpersonneloftheCompanyhaveaffirmedcompliancewiththeCodeofConductoftheCompanylaiddownforthemforthefinancialyearended31March2018.
For Essel Propack Limited
Ashok GoelChairman & Managing Director
26 April 2018, Mumbai

34 35Annual Report 2017-18
1. INTRODUCTIONSecurity and Exchange Board of India has issued the SEBI (Listing Obligations and Disclosure Requirements) Regulations, 2015 vide notification dated 2 September2015comingintoeffectfrom1December2015.ThesaidRegulation is in substitute of compliance requirement of listing agreements entered into with recognized Stock Exchanges in India in respect to listing of equity shares, debts and other securities. Said Regulations as amended from time to time inter alia provides for the top fivehundred listed entities based on market capitalization to formulate a dividend distribution policy.
2. PURPOSEThe purpose of this Policy is to outline guiding factors, parameters and procedures in relation to the determining amount of Dividend on equity shares of the Company by the Board and recommend the same for approval of shareholders whenever necessary.
This Policy is intended to provide guidance and approach of the Board of Directors for determining and recommendation on the amount of dividend on equity shares of the Company and process for payment.
To achieve these objectives, maintain decency and to observe applicable regulation, in relation to determining amount of dividend and distribution, the Board of Essel Propack Limited is adopting this Dividend Policy.
3. TITLE, COMMENCEMENT AND EXTENT3.1 This Policy is called the “Dividend Distribution Policy”
or “Dividend Policy” or the “Policy”.
3.2 This Policy has been approved by the Board in its meeting held on 2 February 2017 and the same shall comeintoeffectaccordingly.
4. DEFINITIONS AND INTERPRETATIONIn this Policy, except where the context otherwise requires, the following words and expressions shall have the following meaning.
4.1 “Board” or “Board of Directors” means the Board of Directors of the Company.
4.2 “Company” or “Essel” means the Essel Propack Limited, registered in India under the Companies Act 1956/2013havingCINL74950MH1982PLC028947.
4.3 “Dividend” means annual dividend and also includes interimand/orspecialdividend.
4.4 “Executive Management” means the Managing Director,ChiefOperatingOfficerandChiefFinancialOfficeroftheCompany.
4.5 “Shares” or “Equity Shares” means the exiting equity shares and equity shares as may be allotted by the Company from time to time.
4.6 “Statutory provisions”, “Regulation” or “Listing Regulations” means applicable provisions of the Companies Act 2013, SEBI (Listing Obligations and Disclosure Requirements) Regulations 2015 as amended or reenacted time to time and other applicable law in relation to the Dividend.
4.7 The words importing the singular include the plural and vice varsa and pronouns importing a gender include each of the masculine, feminine and neuter genders and shall be interpreted in the wide sense in spirit of this Code.
5. ESSEL’S DIVIDEND POLICYEssel’s Board adopts the policy of steady and progressive dividenddistributionoutofthenetprofitkeepinginviewthe following factos. The Board believes this will serve the interest of the Shareholders for their regular income and the Company’s business growth.
In determining the amount of dividend on equity shares of the Company for distribution to equity shareholders from time to time, the Board will consider the following guidelines and parameters, keeping in view the audited orreviewedfinancialresultsoftheCompany,asmayberelevant to the financial year and estimates of the nextfinancialyearwhencontextsorequires.
5.1 Financial parameters
TheBoardshallbeguidedby the followingfinancialfactors when recommend the Dividend.
a) To recommend steady dividend payout keeping in view standalone and consolidated net profitoftheCompanyasperauditedfinancialresults,Subjecttofinancial,external,internalandothersfactors.
b) Increase in standalone and consolidated net sales, net profit, cash profit and net worth ascomparedtopreviousfinancialyear.
Annexure 1Dividend Distribution Policy

36 37Annual Report 2017-18
c) Position of debts, interest rate and debt servicing during the financial year and change expectedduringthenextfinancialyear.
d) Other factors would include magnitude of realized profits, operating cash flow, liquidity,capacity to service borrowings, cost of borrowings vis-à-vis cost of capital, sales volume, anticipated expenses,financialratiosetc.
5.2 Internal Factors
a) Cash requirements in short to medium term for capex program, organic and inorganic growth, acquisition, further investment in subsidiaries and joint ventures, surge sustainability in global business markets.
b) Profitability,earningsvariability,liquidityandcashflows,financialleverageandassetcharacteristicssuch as the composition of tangible and intangible assets.
c) Achievement of targets in relation to capacity additions, inventions, new customers, quality excellence, fair inventory levels, sustainable balance between oral, non-oral care and pharma segments, as and when the management has set the targets for all or any of the aforesaid.
d) To consider the proposal, if any, presented by Executive Management in relation to the recommendation of the Dividend.
5.3 External factors
a) Change in statutory provisions, domestic and international taxation aspects, government policies, major accounting adjustments and audit assumptions.
b) Contingent liability and legal disputes expected to tolerate in medium to long term and natural calamity.
c) Material change in technology, market position, statutory restrictions, commercial assumptions andotheraspectswhichisanticipatedtoaffecttothebusinessorprofitabilityof theCompany, itssubsidiaries, joint ventures or major customers.
d) Majorwriteoffofthebaddebts,distressedassetsor investments, bankruptcy of major customers, stricture of public liability and similar aspects affectingtothebusinessorprofitoftheCompanyon standalone and consolidated basis.
In exceptional circumstances, the Board may deviate some parameters in determining the amount of
dividend, if after deliberations in board meeting, it is decided so in interest of the Company, with consent of all the directors present.
6. UTILIZATION OF RETAINED EARNINGIt is intended to use the retained earnings for business growth, capacity additions and general corporate purpose. Considering the cost of the borrowings vis-à-vis available funds (retained earnings), the quantum of reserves and available depreciation fund, the Board may decide to plough back the earnings. Utilization of the retained earnings of the Company shall be inter alia based on the factors includes financial leverage,mitigate dependenceonexternaldebts,expansionanddiversification.
7. CIRCUMSTANCES UNDER WHICH MAY NOT EXPECT DIVIDEND
The Board intends to recommend reasonable dividend everyfinancialyearinnormalbusinessscenariokeepingin view the provisions of this Dividend Policy. However the Board may consider to recommends lesser dividend as compared to previous financial years or may notrecommendDividendforanyoneormorefinancialyearskeepinginviewthepossibleeffectofoneormore“ExternalFactors”tothebusiness,sales,profitorsustainabilityoftheCompany, its subsidiaries or in any other circumstances theBoarddecidesthatdistributionoftheprofitbywayofDividend is not advisable in interest of the Company.
8. POLICY EXCLUSIONThe policy shall not be applicable in the following circumstances.
a) Buyback of shares or securities.
b) Dividend on preference shares.
c) Benefit to shareholders or class of shareholdersby virtue of arrangements as may be approved by National Company Law Tribunal or appropriate authority.
9. INTERIM, SPECIAL OR HIGHER DIVIDENDThe Board may approve Interim Dividend, Special or higher Dividend considering the recommendation from the Executive Management and factors as mentioned in this Policy, keeping in view the financials based onreviewedorauditedfinancialstatementsandasmaybepermitted under the statutory provisions. The Board at its discretion may consider the aforesaid proposal if the Board thinks that the factors as referred in the policy are favorable, available and possible use of cash and other factors as the Board may think relevant.

36 37Annual Report 2017-18
10. PROCEDURE IN RELATING TO THE DIVIDEND AND PAYMENT
a) The Board usually to recommend Dividend annually for financial year based on annual financial results.Recommendation of the Board on annual dividend will be submitted to the shareholders in accordance with the statutory provisions for the adoption of a final decision at the shareholders’ meeting. Theamount of annual dividends shall not exceed the amount recommended by the Board of Directos.
b) Annual Dividend as approved by the Shareholders or interim or special Dividend as approved by the Board will be paid in cash to those who are Shareholders on record date or book closure as may be determined for the purpose.
c) Primary method for the payment of Dividends is the transfer or direct credit of dividend amount in Indian rupee to respective accounts of the shareholders in the Indian Bank details of which is registered with the Company or made available by the Depositories. In absence of correct bank account details, the Company will pay Dividend by way of dispatch of physical dividend instrument or demand drafts.
d) The Company shall follow the statutory provisions as may be applicable from time to time relating to approval, declaration and payment of Dividend.
11. CLARIFICATIONS, AMENDMENT ETCThis Policy has been framed in compliance with the SEBI (Listing Obligations and Disclosure Requirements) Regulations, 2015. In case of any amendment in the Regulations, direction or clarification by SEBI, provisionof this Code shall be read and implemented in context of suchamendedorclarifiedpositions.
This Policy may be modified, amended, clarified orsubstituted by the Board as may be necessary.
This Policy is approved by the Board of Directors and signed for authentication on its behalf as under.
12. CAUTIONARY STATEMENTThePolicyreflectstheintentoftheCompanytorewarditsshareholdersbydistributingaportionof itsprofitsafterretainingsufficientfundsforgrowthoftheCompanyandsubjecttootheraspectsasmentionedinthisPolicyand/or other aspect the Board may think appropriate at its discretion from time to time.

38 39Annual Report 2017-18
[Pursuant to Section 204(1) of the Companies Act, 2013 and rule no. 9 of the Companies (Appointment and Remuneration of Managerial Personnel) Rules, 2014]
To,The Members,Essel Propack Limited
I have conducted the secretarial audit of the compliance of applicable statutory provisions and the adherence to good corporate practices by Essel Propack Limited (hereinafter called ‘the Company’). Secretarial audit was conducted in a manner that provided me a reasonable basis for evaluating the corporate conducts/statutorycompliances and expressing my opinion thereon.
Based onmy verification of the Essel Propack Limited’sbooks, papers, minute books, forms and returns filedand other records maintained by the Company and also the information provided by the Company, its officers,agents and authorized representatives during the conduct of secretarial audit, I hereby report that in my opinion, the Company has, during the audit period covering the Financial year ended on 31st March 2018 complied with the statutory provisions listed hereunder and also that the Company has proper Board-processes and compliance-mechanism in place to the extent, in the manner and subject to the reporting made hereinafter:
I have examined the books, papers, minute books, forms and returns filed and other records maintained by theCompanyforthefinancialyearendedon31stMarch2018according to the provisions of:
(i) The Companies Act, 2013 (the Act) and the rules made thereunder;
(ii) The Securities Contracts (Regulation) Act, 1956 (‘SCRA’) andtherulesmadethereunder;
(iii) The Depositories Act, 1996 and the Regulations and theBye-lawsframedthereunder;
(iv) Foreign Exchange Management Act, 1999 and the rules and regulations made thereunder to the extent of Foreign Direct Investment, Overseas Direct InvestmentandExternalCommercialBorrowings;
(v) The following Regulations and Guidelines prescribed under the Securities and Exchange Board of India Act, 1992 (‘The SEBI’):-
(a) The Securities and Exchange Board of India (Substantial Acquisition of Shares and Takeovers) Regulations,2011;
(b) The Securities and Exchange Board of India (ProhibitionofInsiderTrading)Regulations,2015;
(c) The Securities and Exchange Board of India (Issue of Capital and Disclosure Requirements) Regulations,2009;
(d) The Securities and Exchange Board of India (Share BasedEmployeeBenefits)Regulations,2014;
(e) The Securities and Exchange Board of India (Issue andListingofDebtSecurities)Regulations,2008;
(f) The Securities and Exchange Board of India (Registrars to an Issue and Share Transfer Agents) Regulations, 1993 regarding the Companies Act anddealingwithclient;
(g) The Securities and Exchange Board of India (Delisting of Equity Shares) Regulations, 2009;(Not relevant / applicable, since there is nodelisting of equity shares during the year)
(h) The Securities and Exchange Board of India (Buyback of Securities) Regulations, 1998; (Notrelevant/applicable,sincethereisnobuybackofsecurities during the year)
(i) The Securities and Exchange Board of India (Listing Obligations and Disclosure Requirements) Regulations, 2015
(vi) The following laws are specifically applicable to theCompanyinadditiontolawsmentionedabove;
(a) Factories Act, 1948
(b) Contract Labour (Regulation and Abolition) Act, 1970
I have also examined compliance with the applicable clauses to the following:
(i) Secretarial Standards issued by The Institute of Company Secretaries of India and approved by the Government of India, as applicable under the CompaniesAct,2013;
(ii) The Listing Agreements entered into by the Company with BSE Limited and National Stock Exchange of India Limited in accordance with SEBI (Listing Obligations and Disclosure Requirements) Regulations, 2015
Annexure 2Secretarial Audit Report
Form No. MR-3For the Financial year ended 31st March, 2018

38 39Annual Report 2017-18
During the period under review the Company has complied with the provisions of the Act, Rules, Regulations, Guidelines, Secretarial Standards, etc. mentioned above.
I further report that, the Board of Directors of the Company is duly constituted with proper balance of Executive, Non – Executive Directors and Independent Directos. The changes in the composition of the Board of Directors that took place during the period under review were carried out in compliance with the provisions of the Act.
Adequate notice is given to all the directors to schedule the Board meetings, agenda and detailed notes on agenda were sent at least seven days in advance, and a system exists for seeking and obtaining further information and clarificationsontheagendaitemsbeforethemeetingandfor meaningful participation at the meetings.
All decisions at Board Meetings and Committee Meetings are carried out unanimously as recorded in the minutes of the meetings of the Board of Directors or Committee of the Board, as the case may be.
I further report that, there are adequate systems and processes in the company commensurate with the size and operations of the Company to monitor and ensure compliance with applicable laws, rules, regulations and guidelines. The management has installed IT enabled software called “Legatrix” to manage legal and regulatory compliance. The Legatrix system has been implemented by legal professional and expert service provider Legasis Services Private Limited. We have reviewed the functioning of said system implemented at all plants, registered and corporateofficeoftheCompanyandthesaidsystemsinter alia checks, alters, provide reports, updates and overview compliance management of various laws including laws specifically applicable to the Company viz Factories Act1948, the Contract Labour (Regulation and Abolition) Act, 1970.
I further report that, during the period under review, there were following major actions which have been done incompliancewithapplicablestatutoryprovisions;
1. Pursuant to the Essel Employee Stock Option Scheme 2014 (ESOS 2014) 80,166 Equity shares of face value of ` 2 each of the Company were allotted on 31st August 2017 to those grantee who had exercised their vested Options.
2. The Company has issued and allotted 500 unsecured rated redeemable non-convertible debentures of `10,00,000/-eachaggregatingto` 50 Crores by the way of Private Placement.
3. The Company has redeemed 500 Series A Secured redeemable Non-convertible debentures of ` 10,00,000/- each aggregating to ` 50 Crores on 18 December 2017.
4. The Company had obtained approval of the members by way of Postal Ballot for passing Special resolution to make investment, give loans, guarantees and provide securities not exceeding the limit of `1200 Crores.
5. The Company has obtained approval of the members by way of Postal Ballot for passing Special Resolution toapprovePrivatePlacementofNCD’s and/orDebtsecurities which shall not exceed ` 200 Crores.
6. The Company has obtained approval of the members by way of Postal Ballot for passing Special resolution to approve adoption of new set of regulations of Article of Association pursuant to applicable provisions of Companies Act, 2013.
For D. M. Zaveri & CoCompany Secretaries
Dharmesh Zaveri(Proprietor)
FCS. No.: 5418CP No.: 4363
Place: MumbaiDate:26/04/2018
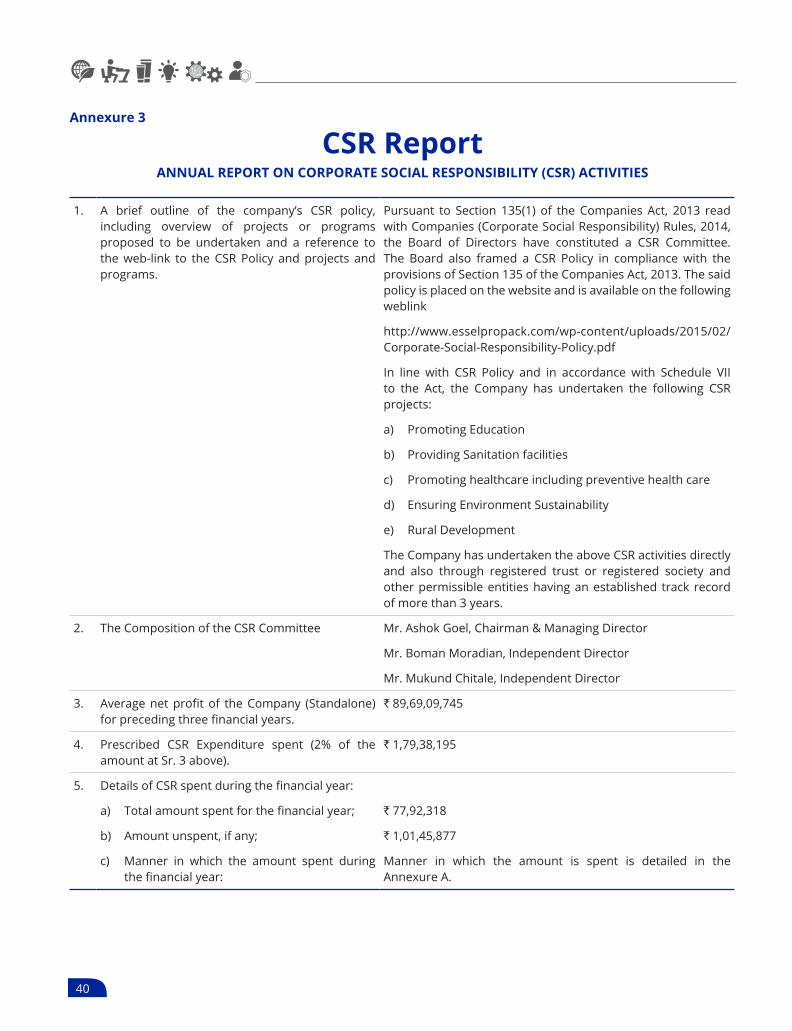
40 41Annual Report 2017-18
1. A brief outline of the company’s CSR policy, including overview of projects or programs proposed to be undertaken and a reference to the web-link to the CSR Policy and projects and programs.
Pursuant to Section 135(1) of the Companies Act, 2013 read with Companies (Corporate Social Responsibility) Rules, 2014, the Board of Directors have constituted a CSR Committee. The Board also framed a CSR Policy in compliance with the provisions of Section 135 of the Companies Act, 2013. The said policy is placed on the website and is available on the following weblink
http://www.esselpropack.com/wp-content/uploads/2015/02/Corporate-Social-Responsibility-Policy.pdf
In line with CSR Policy and in accordance with Schedule VII to the Act, the Company has undertaken the following CSR projects:
a) Promoting Education
b) Providing Sanitation facilities
c) Promoting healthcare including preventive health care
d) Ensuring Environment Sustainability
e) Rural Development
The Company has undertaken the above CSR activities directly and also through registered trust or registered society and other permissible entities having an established track record of more than 3 years.
2. The Composition of the CSR Committee Mr. Ashok Goel, Chairman & Managing Director
Mr. Boman Moradian, Independent Director
Mr. Mukund Chitale, Independent Director
3. Averagenetprofitof theCompany (Standalone)forprecedingthreefinancialyears.
` 89,69,09,745
4. Prescribed CSR Expenditure spent (2% of the amount at Sr. 3 above).
` 1,79,38,195
5. DetailsofCSRspentduringthefinancialyear:
a) Totalamountspentforthefinancialyear; ` 77,92,318
b) Amountunspent,ifany; ` 1,01,45,877
c) Manner in which the amount spent during thefinancialyear:
Manner in which the amount is spent is detailed in the Annexure A.
Annexure 3
CSR ReportANNUAL REPORT ON CORPORATE SOCIAL RESPONSIBILITY (CSR) ACTIVITIES

40 41Annual Report 2017-18
ANNEXURE A TO REPORT ON CSR ACTIVITIES
(1) (2) (3) (4) (5) (6) (7) (8)
Sr No.
CSR project or activity identified
Sector in which the project is covered
Projects or programs (1)
Local area or other (2) Specify the State and
district where projects or Programs
were undertaken.
Amount outlay
(budget) project or programs
wise
Amount spent on
the projects or programs Sub-heads: (1) Direct
expenditure on projects
or programs (2)
Overheads:
Cumulative expenditure
up to the reporting
period
Amount spent Direct or through
implementation agency
1. Expansion of activities and to support project for 24x7 Epilepsy care
Promoting Education
State: Maharashtra Dist. Mumbai
11,00,000 11,00,000 11,00,000 Implementing Agency -Epilepsy Foundation
2. Promoting education by providing benches and improving sanitation facilities by providing toilets to various schools in the vicinity of units of the Company
Promoting Education & Health Care
State: Maharashtra Dist. Thane
21,00,000 21,00,000 32,00,000 Implementing Agency –Vidya Vikas Mandal
3. Improving sanitation facilities by providing toilets to various schools
Promoting Health care
State: Maharashtra Dist. Wada
17,16,920 17,16,920 49,16,920 Direct project
4. Promoting education by contributing class room and other facilities in rural area.
Promoting Education
State: Himachal Pradesh Dist. Solan
8,00,000 8,00,000 57,16,920 Direct project
5. Ensuring Environmental Sustainability by Plantation of trees
Environmental Sustainability
State: Maharashtra Dist. Thane
6,97,500 6,97,500 64,14,420 Implementing Agency - Lahs Pratishthan
6. Contributed toward rural sports development
Promoting rural sports
State: Maharashtra Dist. Palghar
5,00,000 5,00,000 69,14,420 Direct project
7. Improve public issues such as education, rural development for upliftment of the Society.
Promoting Education & Rural development
State: West Bengal Dist. Kolkata
3,00,000 3,00,000 72,14,420 Implementing Agency – Padakshep

42 43Annual Report 2017-18
(1) (2) (3) (4) (5) (6) (7) (8)
Sr No.
CSR project or activity identified
Sector in which the project is covered
Projects or programs (1)
Local area or other (2) Specify the State and
district where projects or Programs
were undertaken.
Amount outlay
(budget) project or programs
wise
Amount spent on
the projects or programs Sub-heads: (1) Direct
expenditure on projects
or programs (2)
Overheads:
Cumulative expenditure
up to the reporting
period
Amount spent Direct or through
implementation agency
8. Promoting Health care
Promoting Health Care
State: Tamil Nadu Dist. Madurai
2,50,000 2,50,000 74,64,420 Direct program
9. Provide Water tanks to Village and to overcome various problems.
Promoting Health Care
State: Maharashtra Dist. Thane
3,27,898 3,27,898 77,92,318 Direct project
Total 77,92,318 77,92,318
The Company has already spent sizable amount towards various CSR activities during the year. The Company is evaluating more CSR programmes, activities and initiatives for further CSR spending. The Company couldn’t spent towards due CSR amountkeepinginviewtomakecontributiontoareaswhereitcanmakeampleimpactandwouldattempttofindoutmoreareasinfuturewherethespendingwouldreallymakeadifference.TheCompanyisalsoindialoguewithsomeCSRagencies and NGOs for implementing of the Company’s CSR policy over a period of time.
Epilepsy Foundation isaNon-profitorganizationestablishedinyear2009aimedtoeradicateepilepsyfromIndia.TheorganizationisdedicatedtocureandrehabilitatepatientssufferingfromEpilepsy,spreadawarenessandeducatepeopleabout Epilepsy.
Vidya Vikas Mandal was set up in 1961, the trust runs a school to provide development of society through proper education to the tribal people living in the village.
Lahs Pratishthan was established in year 2013 aims to facilitate the empowerment of women, girls, children and youth, helping in creating awareness and improving education, health and sanitation, Preserving and conserving the environment, through various programs like integrated village development program, rain water harvesting, Sustainable Agriculture.
PADAKSHEP isanon-profitorganizationanditsprimaryfocusistoprovideeducationandupliftmentoftheruralareasin the two island of Sunderbans. They have also decided to lend stronger support to Vocational Training.
CSRCommitteestatesthattheCSRactivitiesbeingundertaken/proposedwillbeimplementedandmonitoredasperCSR Policy and is in compliance with CSR objectives and policy of the Company.
Boman MoradianIndependent DirectorMember – CSR Committee
Ashok GoelChairman & Managing DirectorChairman – CSR Committee
26 April 2018, Mumbai

42 43Annual Report 2017-18
Ann
exur
e 4(
a)
Part
icul
ars
of E
mpl
oyee
s as
per
Sec
tion
197
(12)
of t
he C
ompa
nies
Act
, 201
3 re
ad w
ith
the
Rule
s re
lati
ng th
eret
o fo
r the
yea
r end
ed o
n 31
Mar
ch 2
018
Top
10 e
mpl
oyee
s in
ter
ms
of r
emun
erat
ion
draw
n an
d em
ploy
ees
in r
ecei
pt o
f rem
uner
atio
n no
t le
ss t
han
` 1.
02 c
rore
s p.
a.
Sr.
No.
Nam
eDe
signa
tion
Natu
re o
f Dut
ies
Qual
ifica
tion
Age
Date
of
Join
ing
Rem
uner
atio
n Re
ceiv
ed (`
)Ex
perie
nce
(in ye
ars)
Part
icula
rs o
f las
t em
ploy
men
t hel
d-
Orga
nisa
tion
& De
signa
tion
1.As
hok G
oel
Chair
man
& M
.D.
B. C
om57
1-7-
1988
7,26,5
1,113
36-
2.M
R R
amas
amy
Chief
Ope
ratin
gOfficer
BE, E
xe. M
BA60
9-3-
1985
2,55,3
0,001
36Ve
nlon
Pol
yste
r Ltd
., Pro
ject E
ngin
eer
3.A
V Ga
napa
thy
Chief
Fina
ncialOfficer
ACA,
ACS
& A
ICW
A59
11-6
-200
72,1
2,53,7
6735
Unile
ver S
rilan
ka Lt
d., C
omm
ercia
l Dire
ctor
4.Dilee
pJoshi
Dire
ctor
- Hu
man
Cap
ital
Post
-Gra
duat
ion
in M
anag
emen
t (H
R)53
12-1
0-20
091,5
5,52,0
0329
Essa
r Shi
ppin
g Por
ts &
Logis
tics L
td., H
ead
HR -
ESPL
Bus
ines
s Gro
up5.
RoyJosep
hRe
giona
l Vice
Pre
siden
t-AM
ESA
Regio
nM
aste
rs in
Man
agem
ent,
BE49
2-11
-201
11,1
6,01,4
8330
AveryD
ennisonIndiaL
td;C
ountryGen
eral
Man
ager
Indi
a6.
Prak
ash
Dhar
man
iCh
iefIn
form
ationOffi
cer
BE (C
hem
ical),
Exec
utive
MBA
4724
-09-
2012
1,04,6
3,613
26Es
sar P
ower
Ltd.
, VP
CIO
7.Vi
nay M
okas
hiFin
ance
Con
trolle
rAI
CWA
& AC
S59
01-0
3-19
9776
,64,76
538
Cora
l Cos
met
ics Lt
d - F
inan
ce M
anag
er &
Co
mpa
ny Se
cret
ary
8.As
hok K
umar
Va
shish
tRe
giona
l Fin
ance
Co
ntro
ller –
AM
ESA
Regio
n
FCM
A (IC
AI), F
CMA
(CIM
A, U
K),
CGM
A (U
K &
US), F
CPA
(Aus
tralia
), DI
P IFR
(ACC
, UK)
, CS,
B.Co
m
4726
-03-
2013
64,48
,969
25SM
A So
lar In
dia P
vt. L
td, H
ead
– Fin
ance
an
d co
mpl
iance
. Glax
osm
ithkli
ne C
onsu
mer
He
althc
are L
td, S
r. M
anag
er –
Finan
ce &
IT9.
AmitJain
Head
Trea
sury
ACA
4526
-10-
2012
64,54
,757
23Ca
dila
Phar
mac
eutic
als Lt
d. G
ener
al M
anag
er10
.De
epak
Gan
joo
Head
- Sa
les &
Key
Ac
coun
tsBa
chelo
r of E
ngin
eerin
g (B.
E.)43
01-0
7-20
0559
,74,98
523
TVS M
otor
s Ltd
. - A
sst.
Man
ager
– Op
erat
ions
.
Empl
oyee
s em
ploy
ed fo
r pa
rt o
f yea
r an
d in
rec
eipt
of r
emun
erat
ion
of n
ot le
ss t
han
` 8.
50 la
khs
p.m
.
Sr.
No.
Nam
eDe
signa
tion
Natu
re o
f Dut
ies
Qual
ifica
tion
Age
Date
of
Join
ing
Rem
uner
atio
n Re
ceiv
ed (`
)Ex
perie
nce
(in ye
ars)
Part
icula
rs o
f las
t em
ploy
men
t hel
d-
Orga
nisa
tion
& De
signa
tion
--
--
--
--
-
Not
es:
1.
Rem
uner
atio
n co
nsis
ts o
f sal
ary,
var
iabl
e pa
y, a
llow
ance
s an
d pe
rqui
site
s as
com
pute
d un
der
the
Inco
me
Tax
Act,
1961
.
2.
Abov
e em
ploy
ees
are
in fu
ll tim
e em
ploy
men
t with
the
Com
pany
and
the
sam
e ca
n be
term
inab
le b
y no
tice
on e
ither
sid
e an
d ar
e go
vern
ed a
s pe
r theterm
sofrespe
ctiveap
pointm
enta
nd/orrules/po
liciesofth
eCo
mpa
ny.
3.
Exce
pt fo
r M
r. A
shok
Goe
l, no
ne o
f the
em
ploy
ees
men
tione
d ab
ove
is r
elat
ed to
any
Dir
ecto
r of
the
Com
pany
.
For
and
on b
ehal
f of t
he B
oard
Esse
l Pro
pack
Lim
ited
Ash
ok G
oel
26 A
pril
2018
. Mum
bai
Chai
rman
& M
anag
ing
Dir
ecto
r

44 45Annual Report 2017-18
Annexure 4(b)
The information on remuneration and other matters as required by sub-section 12 of Section 197 of the Companies Act, 2013 read with Rule 5(1) of the Companies (Appointment and Remuneration of Managerial Personnel) Rules, 2014 is set out in table below:
Sr. No. Name of Director-KMP and Designation
% increase in remuneration in the
FY 2017-18
Ratio of remuneration of each Director to median
remuneration of employees1. Mr Ashok Goel - Chairman & Managing Director Nil 2762. Mr Atul Goel - Director Nil N.A.3. Mr Mukund Chitale - Independent Director Nil 64. Mr Boman Moradian - Independent Director Nil 65. Ms Radhika Pereira - Independent Director Nil 66. MrAVGanapathy-ChiefFinancialOfficer 6.3% N.A.7. Mr Suresh Savaliya - Head- Legal & Company Secretary 7.32% N.A.
Sr. Requirements Disclosure1. The Percentage increase in the median remuneration of
employeesinthefinancialyear.Increase in median remuneration in the financialyear under review was approx 7.25% as compared ofthe immediateprecedingfinancialyearsMedianremuneration for the year under review is approx ` 2.31 lakhs
2. The Number of permanent employees on the rolls of the Company
1163 employees on payroll as on 31 March 2018.
3. Average percentile increase already made in the salaries of employees other than the managerial personnel in the lastfinancial yearand its comparisonwith thepercentileincreaseinthemanagerialremunerationandjustificationthereof and point out if there are any exceptional circumstances for increase in the managerial remuneration.
There was no exceptional circumstance for increase formanagerialpersonnel in the lastfinancial year.The average percentile increase and policy was same for managerial personnel and all the other employees.
4. Affirmation that the remuneration is as per theremuneration policy of the Company.
Yes, the remuneration is as per the remuneration policy of the Company.
For and on behalf of the BoardEssel Propack Limited
Ashok Goel26 April 2018. Mumbai Chairman & Managing Director

44 45Annual Report 2017-18
The Information under Section 134(3)(m) of the Companies Act, 2013 read with Rule 8(3) of the Companies (Accounts) Rules, 2014 for the year ended 31 March 2018 is given here below and forms part of the Board’s Report.
A. CONSERVATION OF ENERGY
(a) Steps taken or impact on conservation of energy:
Your Company is committed to reduce energy consumption at its various plants. Besides sustaining past initiatives, new measures were implemented during the year. Gist of initiatives taken in this regard is as under.
y ImprovedchillerefficiencyatVasindunit from60to80 %. This has resulted in using of 2 chiller in place of 3 earlier. With this power consumption of 40000 units per month.
y At Goa unit, LSL 15 TET Submersible hydraulic pump replaced with lower HP motor coupled with Geared pumptogivesavingsofapprox4500KWH/month.
y Installed active harmonic filter with APFC panel forprinting plant to resolve issue of low PF. Last 10 months PF is Unity. Same has helped us for reduction in Maximum demand.
y Optimization of Compressed Air by arresting leakages. Air audit was done & points were closed accordingly. Hasresultedinapproxsavingsof3000KWH/month.
y Primary chilled water circulation pump optimized for head by replacing with a smaller capacity multi stage Grundfoss pump. Achieved savings of approx 2500 KWH/month
y Condenser cooling water pump optimized for head by replacing with a smaller capacity multistage Grundfoss pump.Achievedsavingsofapprox3500KWH/month.
y AtNalagarhunit, energyefficientair cooling systeminstalled for plant which has reduced power consumption by 2000 units per day.
(b) The steps taken by the company for utilizing alternate sources of energy:
y We are exploring the possibility of installing solar power panels at Bhilad unit and other units wherever it will be feasible.
(c) The capital investment on energy conservation equipment:
y New HVAC system at Nalagarh unit: ` 77 lakhs.
y AMS conversion for HSL1: ` 11 lakhs.
B. TECHNOLOGY ABSORPTION(i) The efforts made towards technology absorption:
a) Worked with a global polymer manufacturer and co-developed a special grade of polymer that has higher mechanical strength, higher chemical product resistance and run at higher tube line speed.
b) Worked with Second global polymer manufacturer and co-developed a special grade of grafted polymer that enhances interlayer adhesion between various polar and non-polar substrates during lamination.
c) Worked with multiple technology partners in Europe and America for joint research and co-developed a particular set of machinery that can separate polymer from aluminum based multilayer laminate. Process of liberation does not require any heat or chemical. Moreover the process is extremely environment friendly.
(ii) The benefits derived like product improvement, cost reduction, product development or import substitution.
a) Commercialized a laminate called ‘Super Titanium’ and being used for Oral, care category but has great potential to go for Home, Food and Oxygen sensitive product formulation.
b) With the help of newly developed Grafted polymer, it is now possible predict improved and consistence interlayer bond between various multilayer substrates.
Annexure 5
Conservation of Energy, Technology Absorption and Foreign Exchange Earnings and Outgo

46 47Annual Report 2017-18
c) Process of liberation between Metal foil and Plastic have been demonstrated positively and set of machinery with auxiliaries have been ordered for full scale commercial production.
(iii) In case of imported technology (imported during the last three years reckoned from the beginning of the financial year) – Nil
(iv) Details of expenditure on Research and Development during the year under review is as under:
(` In lakhs)
a) Capital 0b) Recurring 532.10c) Total expenditure 532.10d) Total expenditure as a % of total
turnover0.62%
C. FOREIGN EXCHANGE EARNINGS AND OUTGO
(` In million)
Particular Year 2017-18
Year 2016-17
Foreign Exchange earned 1225.71 1190.86ForeignExchangeused/outgo
2186.98 2845.60
For and on behalf of the BoardEssel Propack Limited
Ashok GoelChairman & Managing Director
26 April 2018. Mumbai

46 47Annual Report 2017-18
EXTRACT OF ANNUAL RETURN Asonfinancialyearendedon31March2018
[Pursuant to section 92(3) of the Companies Act, 2013 and Rule 12(1) of the Companies (Management and Administration) Rules 2014]
I. REGISTRATION AND OTHER DETAILS1. CIN L74950MH1982PLC0289472. Registration Date 22 December 19823. Name of the Company Essel Propack Limited4. CategoryoftheCompany/
Sub-Category of the CompanyCompany limited by sharesIndian Non-Government Company
5. AddressoftheRegisteredofficeandcontactdetails
P.O.Vasind, Taluka Shahapur, District – Thane, Maharashtra – 421604, India, Tel.: +91 9673333971
6. Whether listed Company Yes, Listed on BSE Limited & National Stock Exchange of India Limited.
7. Name, address and contact details of Registrar and Transfer Agent
BigshareServicesPrivateLimited,E2/3,AnsaIndustrialEstate,Sakivihar Road, Saki Naka, Andheri (E), Mumbai 400072. Maharashtra India. Tel No. 022 62638200, Fax: 022 62638299.
II. PRINCIPAL BUSINESS ACTIVITIES OF THE COMPANY All the business activities contributing 10% or more of the total turnover of the company shall be stated:-
Sr. No.
Name and Description of main products/services
NIC Code of the product/service
% total turnover of the company
1. SaleofcollapsibleLaminated/Plastictubes(Multi-layer collapsible tubes and laminates)
3131, 22201 100%
III. PARTICULARS OF HOLDING, SUBSIDIARY AND ASSOCIATE COMPANIESSr. No.
Name and Address of the Company CIN/GLN Holding/ Subsidiary/ Associate
% of shares held
Applicable section
DIRECT SUBSIDIARIES1. Lamitube Technologies Limited, Mauritius
2nd Floor, Hennessy Tower, Suite 205, Pope Hennessy Street, Republic of Mauritius
Foreign Subsidiary
Wholly owned Subsidiary
100 2(87)
2. Lamitube Technologies (Cyprus) Limited, CyprusTotalserve House, 17, Gr., Xenopoulou Street, 3106, Limassol, Cyprus
Foreign Subsidiary
Wholly owned Subsidiary
100 2(87)
3. Arista Tubes Inc.^, USA187 Cane Creek Blvd, Danville, VA – 24540
Foreign Subsidiary
Wholly owned Subsidiary
100 2(87)
Annexure 6
Form No. MGT 9
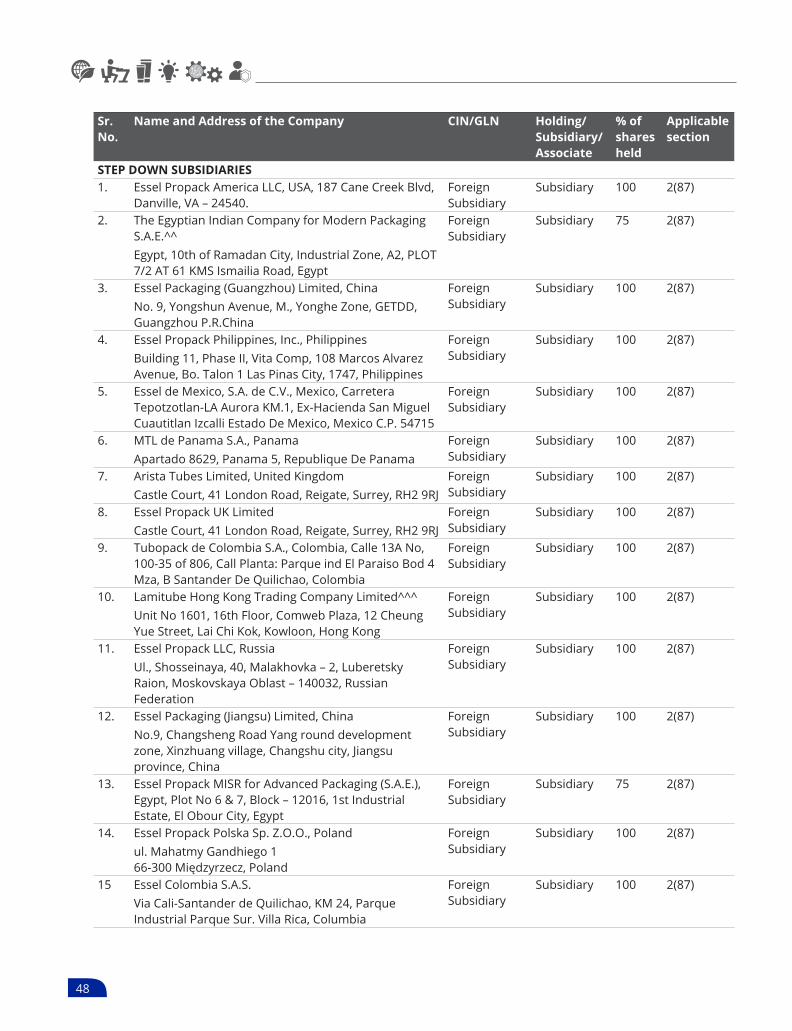
48 49Annual Report 2017-18
Sr. No.
Name and Address of the Company CIN/GLN Holding/ Subsidiary/ Associate
% of shares held
Applicable section
STEP DOWN SUBSIDIARIES1. Essel Propack America LLC, USA, 187 Cane Creek Blvd,
Danville, VA – 24540.Foreign Subsidiary
Subsidiary 100 2(87)
2. The Egyptian Indian Company for Modern Packaging S.A.E.^^Egypt,10thofRamadanCity,IndustrialZone,A2,PLOT7/2AT61KMSIsmailiaRoad,Egypt
Foreign Subsidiary
Subsidiary 75 2(87)
3. Essel Packaging (Guangzhou) Limited, ChinaNo.9,YongshunAvenue,M.,YongheZone,GETDD,Guangzhou P.R.China
Foreign Subsidiary
Subsidiary 100 2(87)
4. Essel Propack Philippines, Inc., PhilippinesBuilding 11, Phase II, Vita Comp, 108 Marcos Alvarez Avenue, Bo. Talon 1 Las Pinas City, 1747, Philippines
Foreign Subsidiary
Subsidiary 100 2(87)
5. Essel de Mexico, S.A. de C.V., Mexico, Carretera Tepotzotlan-LA Aurora KM.1, Ex-Hacienda San Miguel Cuautitlan Izcalli Estado De Mexico, Mexico C.P. 54715
Foreign Subsidiary
Subsidiary 100 2(87)
6. MTL de Panama S.A., PanamaApartado 8629, Panama 5, Republique De Panama
Foreign Subsidiary
Subsidiary 100 2(87)
7. Arista Tubes Limited, United KingdomCastleCourt,41LondonRoad,Reigate,Surrey,RH29RJ
Foreign Subsidiary
Subsidiary 100 2(87)
8. Essel Propack UK LimitedCastleCourt,41LondonRoad,Reigate,Surrey,RH29RJ
Foreign Subsidiary
Subsidiary 100 2(87)
9. Tubopack de Colombia S.A., Colombia, Calle 13A No, 100-35 of 806, Call Planta: Parque ind El Paraiso Bod 4 Mza, B Santander De Quilichao, Colombia
Foreign Subsidiary
Subsidiary 100 2(87)
10. Lamitube Hong Kong Trading Company Limited^^^Unit No 1601, 16th Floor, Comweb Plaza, 12 Cheung Yue Street, Lai Chi Kok, Kowloon, Hong Kong
Foreign Subsidiary
Subsidiary 100 2(87)
11. Essel Propack LLC, RussiaUl., Shosseinaya, 40, Malakhovka – 2, Luberetsky Raion, Moskovskaya Oblast – 140032, Russian Federation
Foreign Subsidiary
Subsidiary 100 2(87)
12. EsselPackaging(Jiangsu)Limited,ChinaNo.9, Changsheng Road Yang round development zone,Xinzhuangvillage,Changshucity,Jiangsuprovince, China
Foreign Subsidiary
Subsidiary 100 2(87)
13. Essel Propack MISR for Advanced Packaging (S.A.E.), Egypt, Plot No 6 & 7, Block – 12016, 1st Industrial Estate, El Obour City, Egypt
Foreign Subsidiary
Subsidiary 75 2(87)
14. EsselPropackPolskaSp.Z.O.O.,Polandul. Mahatmy Gandhiego 1 66-300Międzyrzecz,Poland
Foreign Subsidiary
Subsidiary 100 2(87)
15 Essel Colombia S.A.S.Via Cali-Santander de Quilichao, KM 24, Parque Industrial Parque Sur. Villa Rica, Columbia
Foreign Subsidiary
Subsidiary 100 2(87)

48 49Annual Report 2017-18
Sr. No.
Name and Address of the Company CIN/GLN Holding/ Subsidiary/ Associate
% of shares held
Applicable section
16. Essel Deutschland Gmbh & Co. KG, Dresden, Germany.Manfred-von-Ardenne-Ring 10, 01099 Dresden, Germany Handelsregister: Amtsgericht Dresden, HRA 5605
Foreign Subsidiary
Subsidiary 100 2(87)
17. Essel Deutschland Management GmbH, GermanyManfred-von-Ardenne-Ring 10, 01099 Dresden, Germany Handelsregister: Amtsgericht Dresden, HRA 5605.
Foreign Subsidiary
Subsidiary 100 2(87)
ASSOCIATE COMPANY / JV1. P.TLamipakPrimula,Indonesia,JI,SawunggalingNo
26, Gilang, Taman, Sidoarjo, Indonesia.Foreign entity Associate 30 2(6)
^ Balance 7.35% of Arista Inc, USA is held by Lamitube Technologies (Cyprus) Limited.
^^Subsidiaryisliquidated/closedw.e.f.11February2018.
^^^LamitubeHongKongTradingCompanyLimited,subsidiaryofLamitubeTechnologiesLimited,Mauritius(closed/deregistered/windupduringtheyear).

50 51Annual Report 2017-18
SHARE HOLDING PATTERN (Equity Share Capital Breakup as percentage of Total Equity)i) Category-wise Share Holding
Category of Shareholder No. of Shares held at the beginning of the year
No. of Shares held at the end of the year
% Change during
the yearDemat Physical Total Shares
Total % Demat Physical Total Shares
Total %
(A) Shareholding of Promoter and Promoter Group Indian(a) INDIVIDUAL/HUF 434750 0 434750 0.28 434750 0 434750 0.28 (0.00)
(b) CENTRAL / STATEGOVERNMENT(S)
0 0 0 0.00 0 0 0 0.00 0.00
(c) BODIES CORPORATE 114229 0 114229 0.07 114229 0 114229 0.07 (0.00)
(d) FINANCIAL INSTITUTIONS/BANKS
0 0 0 0.00 0 0 0 0.00 0.00
(e) ANY OTHERS (Specify) 0 0 0 0.00 0 0 0 0.00 0.00(i) TRUST 89139014 0 89139014 56.72 89339014 0 89339014 56.84 0.12(ii) GROUP COMPANIES 0 0 0 0.00 0 0 0 0.00 0.00(iii) DIRECTORS RELATIVES 0 0 0 0.00 0 0 0 0.00 0.00
SUB TOTAL (A)(1) : 89687993 0 89687993 57.07 89887993 0 89887993 57.19 0.12 Foreign(a) BODIES CORPORATE 0 0 0 0.00 0 0 0 0.00 0.00
(b) INDIVIDUAL 0 0 0 0.00 0 0 0 0.00 0.00
(c) INSTITUTIONS 0 0 0 0.00 0 0 0 0.00 0.00
(d) QUALIFIED FOREIGN INVESTOR
0 0 0 0.00 0 0 0 0.00 0.00
(e) ANY OTHERS (Specify) 0 0 0 0.00 0 0 0 0.00 0.00
SUB TOTAL (A)(2) : 0 0 0 0.00 0 0 0 0.00 0.00Total holding for promoters(A)=(A)(1) + (A)(2) 89687993 0 89687993 57.07 89887993 0 89887993 57.19 0.12
(B) Public shareholdingInstitutions(a) CENTRAL/STATE
GOVERNMENT(S)0 0 0 0.00 222962 0 222962 0.14 0.14
(b) FINANCIAL INSTITUTIONS /BANKS
67922 2802 70724 0.05 69780 2 69782 0.04 (0.00)
(c) MUTUALFUNDS/UTI 5958515 20770 5979285 3.80 5628951 75 5629026 3.58 (0.22)(d) VENTURE CAPITAL FUNDS 0 0 0 0.00 0 0 0 0.00 0.00(e) INSURANCE COMPANIES 1655970 0 1655970 1.05 1655970 0 1655970 1.05 (0.00)(f) FII’S/FPI’S 22550814 2000 22552814 14.35 24188633 1200 24189833 15.39 1.04(g) FOREIGN VENTURE
CAPITAL INVESTORS0 0 0 0.00 0 0 0 0.00 0.00
(h) QUALIFIED FOREIGN INVESTOR
0 0 0 0.00 0 0 0 0.00 0.00
(i) ANY OTHERS (Specify) 0 0 0 0.00 0 0 0 0.00 0.00(j) ALTERNATE INVESTMENT
FUND0 0 0 0.00 516268 0 516268 0.33 0.33
SUB TOTAL (B)(1) : 30233221 25572 30258793 19.25 32282564 1277 32283841 20.54 1.29

50 51Annual Report 2017-18
Category of Shareholder No. of Shares held at the beginning of the year
No. of Shares held at the end of the year
% Change during
the yearDemat Physical Total Shares
Total % Demat Physical Total Shares
Total %
NON-INSTITUTIONS(a) BODIES CORPORATE 17826220 136572 17962792 11.43 17745573 3319 17748892 11.29 (0.14)(b) CLEARING MEMBER 138103 0 138103 0.09 56891 0 56891 0.04 (0.05)(c) INDIVIDUAL
(CAPITAL UPTO TO ` 1 LAKH)
11153104 1416814 12569918 8.00 10121772 1147583 11269355 7.17 (0.83)
(CAPITAL GREATER THAN ` 1 LAKH)
5322946 57120 5380066 3.42 4873724 0 4873724 3.10 (0.32)
(d) ANY OTHERS (Specify)(i) TRUSTS 21058 0 21058 0.01 25860 0 25860 0.02 0.00(ii) NON-RESIDENT
INDIANS(NRI)/FOREIGNINDIVIDUALS
916292 222663 1138955 0.72 854462 180506 1034968 0.66 (0.07)
(iii) DIRECTORS RELATIVES 0 0 0 0.00 0 0 0 0.00 0.00(iv) EMPLOYEE 0 0 0 0.00 0 0 0 0.00 0.00(v) OVERSEAS BODIES
CORPORATES0 940 940 0.00 0 140 140 0.00 0.00
(e) QUALIFIED FOREIGN INVESTOR
0 0 0 0.00 0 0 0 0.00 0.00
SUB TOTAL (B)(2) : 35377723 1834109 37211832 23.68 33678282 1331548 35009830 22.27 (1.40)TOTAL PUBLIC SHAREHOLDING(B)=(B)(1) + (B)(2) 65610944 1859681 67470625 42.93 65960846 1332825 67293671 42.81 (0.12)
(C) Shares held by Custodians and against which Depository Receipts have been issued(a) SHARES HELD BY
CUSTODIANS0 0 0 0.00 0 0 0 0.00 0.00
(b) PROMOTER AND PROMOTER GROUP
0 0 0 0.00 0 0 0 0.00 0.00
(c) PUBLIC 0 0 0 0.00 0 0 0 0.00 0.00SUB TOTAL (C)(1) : 0 0 0 0.00 0 0 0 0.00 0.00(C)=(C)(1) 0 0 0 0.00 0 0 0 0.00 0.00GRAND TOTAL (A) + (B) + (C)
155298937 1859681 157158618 100.00 155848839 1332825 157181664 100.00 (0.00)
57,120 equity shares of face value `2/-eachforfeitedbytheBoardofDirectorsoftheCompanyinits’meetingheldon29.01.2015.

52 53Annual Report 2017-18
ii) Shareholding of Promoters
Sr No.
Shareholder’s Name
Shareholding at the beginning of the year Shareholding at the end of the year
No. of Shares
% of total Shares of the company
% of Shares Pledged/encumbered to total shares
No. of Shares
% of total Shares of the company
% of Shares Pledged/encumbered to total shares
% change in share holding during the year
PROMOTERS –INDIVIDUALS1. Ashok Kumar Goel 420760 0.27 0 423760 0.27 0 0.002. Kavita Goel 10990 0.01 0 10990 0.01 0 0.003. Nand Kishore 3000 0.00 0 0 0 0 0.00
Total 434750 0.28 0 434750 0.28 0 0.00PROMOTERS -DOMESTIC COMPANIES1. Ganjam Trading
Company Private Limited
100 0.00 0 100 0.00 0 0.00
2. Rupee Finance And Management Private Limited
88929 0.06 0 88929 0.06 0 0.00
3. Pan India Paryatan Private Limited
25200 0.02 0 25200 0.02 0 0.00
Total 114229 0.07 0 114229 0.07 0 0.00
PROMOTERS – TRUSTS1 Ashok Kumar Goel
(Trustee- Ashok Goel Trust)
89139014 56.72 0 89339014 56.84 0 0.12
Total 89139014 56.72 0 89339014 56.84 0 0.12
(iii) Change in Promoters’ Shareholding (please specify if there is no change)
Sr. No.
Name of the Shareholder
Shareholding Date wise Increase/
Decrease in Shareholding
during the year
No. of Shares
Reason Cumulative Shareholding during
the yearNo. of
Shares at the beginning of the year (01.04.2017)
% of total shares of the
company
No. of shares
% of total shares of the
company
1 Ashok Kumar Goel (Trustee : Ashok Goel Trust)
89139014 56.72 01.09.2017 1,34,004 Market Acquisition
89273018 56.77
08.09.2017 65,996 Market Acquisition
89339014 56.81
31.03.2018 0 0 89139014 56.842 Ashok Kumar
Goel420760 0.27 21.07.2017 3,000 Inter se
transfer423760 0.27
31.03.2018 0 0 423760 0.273 Nand Kishore 3000 0.00 21.07.2017 3,000 Inter se
transfer0 0
31.03.2018 0 0 0 0

52 53Annual Report 2017-18
(iv) Shareholding Pattern of top ten Shareholders (other than Directors, Promoters and Holders of GDRs and ADRs):
Sr. No.
Name of the Shareholder
No. of Shares at the beginning /End of the year
Date Increase/ Decrease in share-holding
Reason Number of Shares
Percentage of total shares of the company
1 NTASAIN DISCOVERY MASTER FUND
4,104,664 31-Mar-17 0 4104664 2.61
7-Apr-17 164000 BUY 4268664 2.7214-Apr-17 25000 BUY 4293664 2.7328-Apr-17 144000 BUY 4437664 2.825-May-17 90000 BUY 4527664 2.88
12-May-17 487000 BUY 5014664 3.1926-May-17 49319 BUY 5063983 3.229-Jun-17 43000 BUY 5106983 3.25
16-Jun-17 62000 BUY 5168983 3.2923-Jun-17 99300 BUY 5268283 3.35
5,268,283 31-Mar-18 0 5268283 3.352 CLAREVILLE CAPITAL
OPPORTUNITIES MASTER FUND LIMITED
4,786,948 31-Mar-17 0 4786948 3.05
4,786,948 31-Mar-18 0 4786948 3.053 GAGANDEEP CREDIT
CAPITAL PVT LTD3,476,686 31-Mar-17 0 3476686 2.21
3,476,686 31-Mar-18 0 3476686 2.214 GOVERNMENT
PENSION FUND GLOBAL
777,416 31-Mar-17 0 777416 0.49
7-Apr-17 210848 BUY 988264 0.6321-Apr-17 15407 BUY 1003671 0.64
19-May-17 96142 BUY 1099813 0.7028-Jul-17 3973 BUY 1103786 0.70
25-Aug-17 712046 BUY 1815832 1.161-Sep-17 53285 BUY 1869117 1.19
15-Sep-17 40070 BUY 1909187 1.2122-Sep-17 217400 BUY 2126587 1.35
9-Feb-18 82000 BUY 2208587 1.4116-Feb-18 547705 BUY 2756292 1.75
2,756,292 31-Mar-18 0 2756292 1.755 FIDELITY ACTIVE
STRATEGY - ASIA FUND
639,814 31-Mar-17 0 639814 0.41
28-Apr-17 34760 BUY 674574 0.4326-May-17 34150 BUY 708724 0.459-Jun-17 35461 BUY 744185 0.47
23-Jun-17 54806 BUY 798991 0.5112-Jul-17 7390 BUY 806381 0.51

54 55Annual Report 2017-18
Sr. No.
Name of the Shareholder
No. of Shares at the beginning /End of the year
Date Increase/ Decrease in share-holding
Reason Number of Shares
Percentage of total shares of the company
14-Jul-17 2165 BUY 808546 0.5121-Jul-17 36442 BUY 844988 0.54
15-Sep-17 73171 BUY 918159 0.5828-Sep-17 18147 BUY 936306 0.6029-Sep-17 1332 BUY 937638 0.60
6-Oct-17 7261 BUY 944899 0.6013-Oct-17 28828 BUY 973727 0.6220-Oct-17 23124 BUY 996851 0.6327-Oct-17 63409 BUY 1060260 0.6731-Oct-17 7548 BUY 1067808 0.68
3-Nov-17 280011 BUY 1347819 0.8610-Nov-17 182784 BUY 1530603 0.9717-Nov-17 128024 BUY 1658627 1.0624-Nov-17 64374 BUY 1723001 1.10
1-Dec-17 -39598 SALE 1683403 1.078-Dec-17 34541 BUY 1717944 1.09
29-Dec-17 -33558 SALE 1684386 1.0712-Jan-18 -49021 SALE 1635365 1.0426-Jan-18 102901 BUY 1738266 1.112-Feb-18 72665 BUY 1810931 1.159-Feb-18 38251 BUY 1849182 1.18
16-Feb-18 -7105 SALE 1842077 1.1723-Feb-18 136116 BUY 1978193 1.269-Mar-18 213480 BUY 2191673 1.39
23-Mar-18 159648 BUY 2351321 1.5030-Mar-18 -24506 SALE 2326815 1.48
2,326,815 31-Mar-18 0 2326815 1.486 WARBURG VALUE
FUND2,212,890 31-Mar-17 0 2212890 1.41
28-Apr-17 -136151 SALE 2076739 1.325-May-17 -107505 SALE 1969234 1.25
12-May-17 -69234 SALE 1900000 1.212-Jun-17 -37300 SALE 1862700 1.199-Jun-17 -62700 SALE 1800000 1.15
16-Jun-17 -16046 SALE 1783954 1.1423-Jun-17 -55252 SALE 1728702 1.104-Aug-17 -1118 SALE 1727584 1.10
11-Aug-17 -925 SALE 1726659 1.1018-Aug-17 -21645 SALE 1705014 1.0825-Aug-17 -64453 SALE 1640561 1.04
1-Sep-17 -98155 SALE 1542406 0.988-Sep-17 -75444 SALE 1466962 0.93
15-Sep-17 -61778 SALE 1405184 0.8922-Sep-17 -44940 SALE 1360244 0.87

54 55Annual Report 2017-18
Sr. No.
Name of the Shareholder
No. of Shares at the beginning /End of the year
Date Increase/ Decrease in share-holding
Reason Number of Shares
Percentage of total shares of the company
28-Sep-17 -1340 SALE 1358904 0.866-Oct-17 -8904 SALE 1350000 0.86
10-Nov-17 -200000 SALE 1150000 0.7324-Nov-17 -8852 SALE 1141148 0.73
1-Dec-17 -567 SALE 1140581 0.7323-Feb-18 -12128 SALE 1128453 0.72
1,128,453 31-Mar-18 0 1128453 0.727 DSP BLACKROCK
SMALL CAP FUND2,086,694 31-Mar-17 0 2086694 1.33
28-Apr-17 6155 BUY 2092849 1.332,092,849 31-Mar-18 0 2092849 1.33
8 SHAMYAK INVESTMENT PRIVATE LIMITED
2,076,329 31-Mar-17 0 2076329 1.32
2,076,329 31-Mar-18 0 2076329 1.329 UTI - CHILDRENS
CAREER BALANCED PLAN
1,900,000 31-Mar-17 0 1900000 1.21
24-Nov-17 -50000 SALE 1850000 1.181-Dec-17 -2492 SALE 1847508 1.188-Dec-17 -36498 SALE 1811010 1.15
15-Dec-17 -73555 SALE 1737455 1.115-Jan-18 -40000 SALE 1697455 1.08
26-Jan-18 -19692 SALE 1677763 1.072-Feb-18 -69327 SALE 1608436 1.02
16-Mar-18 -5625 SALE 1602811 1.021,602,811 31-Mar-18 0 1602811 1.02
10 VEENA INVESTMENTS PRIVATE LIMITED
1,884,255 31-Mar-17 0 1884255 1.20
1,884,255 31-Mar-18 0 1884255 1.20
11 LAXMI NARAIN GOEL 1,884,255 31-Mar-17 0 1884255 1.2020-Oct-17 -84255 SALE 1800000 1.1531-Mar-18 255 BUY 1800255 1.15
1,800,255 31-Mar-18 0 1800255 1.1512 FRANKLIN INDIA
SMALLER COMPANIES FUND
1,655,431 31-Mar-17 0 1655431 1.05
7-Jul-17 14007 BUY 1669438 1.0612-Jul-17 52342 BUY 1721780 1.1014-Jul-17 41604 BUY 1763384 1.1221-Jul-17 12096 BUY 1775480 1.1328-Jul-17 42662 BUY 1818142 1.164-Aug-17 12097 BUY 1830239 1.16
11-Aug-17 1378 BUY 1831617 1.17

56 57Annual Report 2017-18
Sr. No.
Name of the Shareholder
No. of Shares at the beginning /End of the year
Date Increase/ Decrease in share-holding
Reason Number of Shares
Percentage of total shares of the company
18-Aug-17 19484 BUY 1851101 1.181,851,101 31-Mar-18 0 1851101 1.18
13 ZEEENTERTAINMENTENTERPRISES LTD
1,822,000 31-Mar-17 0 1822000 1.16
1,822,000 31-Mar-18 0 1822000 1.16
(v) Shareholding of Directors and Key Managerial Personnel (KMP):
Sr. No.
For Each of the Directors and KMP Shareholding at the beginning of the year
Cumulative Shareholding during the year
No. of Shares
% of total shares of the
company
No. of shares
% of total shares of the
companyi) At the beginning of the year 420760 0.27 420760 0.27ii) DatewiseIncrease/DecreaseinShareholding
during the year specifying the reasons for increase/decrease (e.g. allotment/transfer/bonus/sweatequityetc.):21.07.2017 Inter se Transfer 3000 0.02 423760 0.27
iii) At the end of the year 423760 0.27 423760 0.27
V. INDEBTEDNESS Indebtedness of the Company including interest outstanding / accrued but not due for payment.
(` In lakhs)
Particulars of Indebtedness Secured Loans excluding deposits
Unsecured Loans
Deposit Total Indebtedness
Indebtedness at the beginning of the financial Yeari) Principal Amount 14,558 5,097 - 19,655ii) Interest due but not paid - - - -iii) Interest accrued but not due 43 8 - 51Total (i+ii+iii) 14,601 5,105 - 19,706
Change in Indebtedness during the financial yearAddition - 509 - 509Reduction (781) - - (781)Net Change (781) 509 - (272)
Indebtedness at the end of the financial Yeari) Principal Amount 13,775 5,609 - 19,384ii) Interest due but not paid - - - -iii) Interest accrued but not due 45 5 - 50Total (i+ii+iii) 13,820 5,614 - 19,434

56 57Annual Report 2017-18
VI. REMUNERATION OF DIRECTORS AND KEY MANAGERIAL PERSONNEL A. Remuneration to Managing Director, Whole-time Directors and / or Manager
(` in lakhs)
Sl. No.
Particulars of Remuneration Name of MD/WTD/Manager
Total
Mr. Ashok Goel Chairman & Managing
Director1 Gross Salary
(a) Salaryasperprovisionscontainedinsection17(1)oftheIncomeTax Act, 1961
457 457
b)Valueofperquisitesu/s17(2)oftheIncome-TaxAct,1961 0 0c)Profitsinlieuofsalaryundersection17(3)oftheIncometaxAct,1961
- -
2 Stock Option - -3 Sweat Equity - -4 Commission
-asa%ofprofit
- others (Variable Pay)
153 153
5 Others, please specify
Provident fund, LTA and others
37 37
Total 647 647Ceiling as per the Act: Totalmanagerial remuneration iswithin the limitof10%of theprofitof theCompany as per section 198 of the Companies Act 2013.
‘0’ zero denotes less than lakh.
B. Remuneration to other Directors:
(` In lakhs)Sr. No.
Particulars of Remuneration
Name of Directors Total AmountMr Atul Goel Mr. Boman
MoradianMr. Mukund
M. ChitaleMs. Radhika
Pereira1. Independent Directors
• Feeforattendingboard/committeemeetings
• Commission• Others,pleasespecify
-
--
2.40
15.00-
2.20
15.00-
2.00
15.00-
6.60
45.00
Total (1) - 17.40 17.20 17.00 51.60Other Non-Executive Directors• Feesforattending
board/committeemeetings
• Commission• Others,pleasespecify
-
--
-
--
-
--
-
--
-
--
Total (2) - - - - -Total (B) = (1+2)Total Managerial Remuneration
- 17.40 17.20 17.00 51.60
OverallCeilingaspertheaboveCommissioniswithinthelimitof1%ofthenetprofitoftheCompanies.Act

58 59Annual Report 2017-18
C. Remuneration to Key Managerial Personnel other than MD/Manager/WTD(` In lakhs)
Sr. No.
Particulars of Remuneration Name of Key Managerial PersonnelHead – Legal &
Company SecretaryChief Financial
OfficerTotal
1 Gross Salarya) Salary as per provisions contained in section
17(1) of the Income Tax Act, 196142 204 246
b) Valueofperquisitesu/s17(2)oftheIncome-Tax Act, 1961
0 0 0
c) Profitsinlieuofsalaryundersection17(3)ofthe Income tax Act, 1961
- - -
2 Stock Option -3 Sweat Equity - - -4 Commission
-asa%ofprofit - others, specify
--
--
--
5 Others (Provident fund, LTA, etc.) 2 8 10
Total 44 212 256
‘0’ zero denotes less than lakh
Abovedoesnotincludevariablepay/PLIfortheFY2017-18,sincetheappraisalisinprocess.KMPsareentitledtootherbenefits,facilitiesetcasperpolicyoftheCompany.ESOSentitlementisaspertheSchemeand/orasmaybeapprovedbytheBoard/Committeetimetotime.
VII. PENALTIES / PUNISHMENT / COMPOUNDING OF OFFENCES:Type Section of the
Companies ActBrief
DescriptionDetails of Penalty /
Punishment/ Compounding fees imposed
Authority [RD/NCLT/
COURT]
Appeal made if any (give
details)
A. COMPANYPenalty
NILPunishmentCompounding
B. DIRECTORSPenalty
NILPunishmentCompounding
C. OTHER OFFICERS IN DEFAULTPenalty
NILPunishmentCompounding
For and on behalf of the Board Essel Propack Limited
Ashok Goel26 April 2018, Mumbai Chairman & Managing Director
58 59Annual Report 2017-18
Annexure 7
Business Responsibility Reporting[Pursuant to Regulation 34 of the SEBI (Listing Obligations & Disclosure Requirements) Regulations 2015]
SECTION A: GENERAL INFORMATION ABOUT THE COMPANY1 Corporate Identity Number (CIN) of the Company:
L74950MH1982PLC028947
2 Name of the Company: Essel Propack Limited
3 Registered address: P.O. Vasind, Taluka: Shahapur, District: Thane, Maharashtra 421604
4 Website: www.esselpropack.com
5 Emailid:[email protected]
6 Financial Year Reported: 1 April 2017 to 31 March 2018
7 Sectors that the Company is engaged in (industrial activity code-wise): The Company is mainly engaged in the business of manufacturing of collapsible laminated and plastic tubes and providing packaging solutions. NIC Code 3131, 22201.
8 List three key products/services that the Companymanufactures/provides (as in balance sheet): TheCompany is mainly engaged in the business of manufacturing of collapsible laminated and plastic tubes and providing packaging solutions. As a part of the said business, the Company also earns revenue from providing packaging solution, royalty and other ancillary services and business. Additional details are mentionedinthefinancialstatementsinthisAnnualReport.
9 Total number of locations where business activity is undertaken by the Company: the Company is having manufacturing facilities at Vasind, Wada in Maharashra, Nalagarh in Himchal Pradesh, Bhilad in Gujarat and Goa.
Company’s international business operations are carried out by various direct and indirect subsidiaries overseas and the major ones are in Mauritius, United Kingdom, China, Poland, Germany, Colombia, USA etc. Further details of the Subsidiaries are referred in the Board’s Report, MDA and annexures thereto.
10 Markets served by the Company: The Company is in B2B business and serves various markets including FMCG, Beauty & Cosmetics, Pharma & Health, Food, Home and Oral.
SECTION B: FINANCIAL DETAILS OF THE COMPANYFinancialdetailsincludingpaid-upcapital,turnoverprofitafter tax and others are given in financial statementcontained in this Annual Report.1 Total spending on Corporate Social Responsibility
(CSR)asapercentageofprofitaftertax(%):Duringtheyear, the Company has spent amount towards various CSR activities as mentioned in detail in the CSR Report which forms a part of Board Report and this Annual Report.
2 List of activities in which expenditure in 4 above has been incurred: Please refer the report on CSR activities contained in this Annual Report.
SECTION C: OTHER DETAILS1 Does the Company have any Subsidiary Company/
Companies? The Company has various direct and indirect
subsidiaries. Further details in this respect are mentionedintheBoard’sReportandMGT9/annualreturn contained in this Annual Report.
2 Do the subsidiary companies participate in the BR initiatives of the parent company? If yes, then indicate the number of such subsidiary companies: No
3 Doanyotherentity/entities(e.g.suppliers,distributorsetc.) that the Company does business with, participate in the BR initiatives of the Company? If yes, then indicatethepercentageofsuchentity/entities?[Lessthan 30%, 30-60%, More than 60%] - No
SECTION D: BR INFORMATION1 Details of Directors/Directors responsible for BR a) Detailsof theDirector/Directors responsible for
implementationoftheBRpolicy/policies. Corporate Policies including the Business
Responsibility Policies of the Company are engrained in day-to-day business operations of the Company are implemented by the management and it is responsibility of concerned functionary or head of the department incharge of the relevant functions at various offices /manufacturing facilities of the Company. Mr. Ashok Goel, Chairman and Managing Director of the Company oversees the implementation of the BR policies keeping in view the executives feedback and reporting.
b) Details of BR Head: Mr. Ashok Goel, Chairman & Managing Director, DIN 00025350, Tel: 022 24819000 / 9200, [email protected].

60 61Annual Report 2017-18
2 Principle-wise (as per NVGS) BR Policy/policiesa) Details of compliance (Reply in Y/N)
Sr. Questions P1 P2 P3 P4 P5 P6 P7 P8 P9Business
ethicsProduct Respo.
Emp. wellbeing
Shareholders Eng.
Human Rights
Env. protection
Pub. & regulatory
CSR Customer relations
1 Doyouhavepolicy/policiesfor yes yes yes yes yes yes yes yes yes2 Has the policy being
formulated in consultation with the relevant stakeholders
yes yes yes yes yes yes yes yes yes
3 Does the policy conform to any national/internationalstandards? If yes, specify?
NA yes NA NA yes yes NA yes NA
4 Has the policy being approved by the Board?If yes, has it been signed by MD/owner/CEO/appropriateBoard Director?
Most of the corporate policies are approved by the Board. Policies mainly relating to business process, operations, HR etc are reviewed / approved by COO/CFO/Director – Human Capital and signed /authenticated by respective owner or functional heads.
5 Does the company have a specified committee of theBoard/Director/Official tooversee the implementation of the policy?
yes yes yes yes yes yes yes yes yes
6 Indicate the link for the policy to be viewed online?
Most of the policies are disseminated for relevant stakeholders on the Company’s website. Policies relating to HR and mean for internal use are available on internal web portal.
7 Has the policy been formally communicated to all relevant and external stakeholders?
yes yes yes yes yes yes yes yes yes
8 Does the company have in-house structure to implement thepolicy/policies?
Policies are engrained in day-to-day business operations of the Company and are implemented by the concernedfunctionaryorheadofthedepartmentinchargeoftherelevantfunctionsatvariousofficesandlevel and monitored by the management.
9 Does the Company have a grievance redressal mechanism related to the policy/policies.
Yes. Wherever relevant, the Company has grievance redressal mechanism or practice.
10 Has the company carries out independent audit/evaluationof the working of this policy by an internal or external agency?
Policies are evaluated periodically or as may be appropriate depending upon the nature of policies by the MD,COOand/orrespectiveseniorexecutives.
b) If answer to the question at serial number 1 against any principle, is ‘No’, please explain why.
Sr. Questions P1 P2 P3 P4 P5 P6 P7 P8 P91 The company has not understood the
PrinciplesWithintheoverallguidanceoftheCOO/MDandBoardwheneveritisnecessary,theCorporatePoliciesareframed/modifiedfromtime to time. Policies or practices in connection with Business Operations and matter relating thereto been are followed over a period of time as per industry norms or best practices. The Company also follows the best practices in relation to some business areas and human capital, although no written policies. The Company will frame further policies, whenever the management thinks it relevant at appropriate time.
2 The company is not at a stage where it finds itself in a position to formulateand implement the policies on specifiedprinciples
3 The company does not have financial ormanpower resources available for the task
4 It is planned to be done within next 6 months
5 It is planned to be done within the next 1 yearAny other reason (please specify)

60 61Annual Report 2017-18
3 Governance related to BR
a) Indicate the frequency with which the Board of Directors, Committee of the Board or CEO to assess BR performance of the Company. Within 3 months, 3-6 months, Annually, more than 1 year.
The assessment of BR performance is done on periodically basis by the COO / MD or seniormanagement of the Company.
b) Does the Company publish a BR or a Sustainability Report? What is the hyperlink for viewing this report? How frequently it is published.
The Company has started publishing BR report from financial year 2016-17 annually. The BRReports is available on the Company’s website www.esselpropack.com as a part of the annual report.
SECTION E: PRINCIPLE-WISE PERFORMANCEPrinciple 1: Business should conduct and govern themselves with ethics, transparency and accountability.
1 Does the policy relating to ethics, bribery and corruption cover only the company? Yes/No. Doesit extend to the Group/Joint Ventures/Suppliers/Contractors/NGOs/Others?
The Company considers Corporate Governance as an integral part of management. The Company has a Code of Conduct that is approved by the Board of Directors and this code is applicable to all Board Members and employees and endeavor it to extend this code to its overseas group entities. The code is available on the Company’s website www.esselpropack.com. The said Codeincludes;ethicsatworkplace,restraininggivingandreceivingofgiftsandotherbenefitsinthecourseof business relationship, maintain confidentiality,anti-bribery policy, conflict of interest, dealing withcompetitors and other relevant aspects.
Though the Company’s code of conduct currently do not apply to external stakeholders including suppliers, contractors, NGOs etc, the Company follows zero tolerance on any acts of bribery, corruption etc by such agencies during their dealings with the Company.
2 How many stakeholder complaints have been received in the past financial year andwhat percentagewassatisfactorily resolved by the management? If so, provide details thereof, in about 50 words or so.
Details relating to complaints from investors during the financial years and redressal thereof is givenin Corporate Governance Report contained in
this Annual Report. Additionally, the complaints, grievances or views from other stakeholders are dealt with by respective functions within the Company.
Principle 2: Businesses should provide goods and services that are safe and contribute to sustainability throughout their life cycle.
1 List up to 3 of your products or service whose design has incorporated social or environmental concerns, risksand/oropportunities.
Essel Propack is committed to the Go Green Initiatives and focused on delivering sustainable solutions. The Company’s businesses of manufacturing tubes are in compliance with applicable laws and rules relating to environments. The Company’s invention towards ‘Go Green – Green Maple Leaf (GML)’ is a product with recyclable all plastic laminate, thus reducing its carbon foot print and making it extremely eco-friendly. GML supports and strengthen Essel’s Go Green Initiatives, ensuring that we are leading the way in making meaningful contributions for a greener, better, healthier planet. GML tubes have the ability to retain their shape even after repeated use and product dispensation and are available in two specifications with custom theme printing. Settinga new curve in packaging innovation GML is aimed at markets demanding sustainability and replacing EVOH tubes as it has equivalent product stability and shelf life properties, excellent tube resilience and feel. Produced with fully recyclable thermoplastic polymers, GML helps customers and society to achieve their sustainability goal.
2 For each such product, provide the following details in respect of resource use (energy, water, raw material etc.) per unit of product (optional).
The Company is conscious about judicious use of water, energy and resources in course of production and manufacturing activities. Additional details relating to energy and others are given in the annexure to the Board Report contained in this Annual Report.
3 Does the Company have procedures in place for sustainable sourcing (including transportation)? If yes, what percentage of your inputs was sourced sustainably?
The Company maintains a healthy relationship with its supplier, vendors and other service providers and the business practice of the Company include them in its growth. The process of vendor registration lays emphasis on safe working conditions, prevention of child labour, business ethics and general housekeeping by the vendor.

62 63Annual Report 2017-18
4 Has the company taken any steps to procure goods or services from local & small producers, including communities surrounding their place of work? If yes, what steps have been taken to improve their capacity and capability of local and small vendors?
The Company, wherever possible, procures goods and services from vendors in surrounding locality of manufacturing facilities including transportation and labours / staffs. Wherever possible, the Companyprefers to support and encourage employment among communities surrounding its place of works.
5 Does the company have a mechanism to recycle products and waste? If yes what is the percentage of recycling of products and waste (separately as <5%, 5-10%, >10%). Also, provide details thereof, in about 50 words or so.
Waste generated in course of manufacturing activities is not material. The Company disposes the waste throughregistered/appropriateagenciesinvolvedinproperdisposal/recycling.
Essel is planning for a major step forward in its commitment to improve sustainability announced as Project “Liberty”which is a first-of-its-kind and pathbreaking attempt to recycle multilayer laminates which consists aluminium in the structure, by separating aluminium and polymer into two distinct and reusable streams without the use of chemicals or heat. With intent to help various stakeholders and greenenvironmentefforts,Esselhascollaboratedwithmultiple major technical partners across the globe and co-developed a solid-state environmental friendly processtoliberatealuminumfromthelaminate/tubes.Essel uses two basic structures to make laminated tubes: (a) Plastic Barrier Laminate (PBL) tubes –made of all plastic layers and are easily recyclable and (b) Aluminum Barrier Laminate (ABL) tubes –made with combination of polymers and has aluminium foil as the barrier layer. ABL poses challenges in recycling and the company has been working relentlessly over 4 years on developing a solution to separate the polymer and aluminium. With Project ‘Liberty’ the polymer fraction can be recovered from ABL tubes and the same can be recycled to various packaging applications. The recovered aluminium metal also shall be reused, making every single tube recyclable.
Principle 3: Business should promote the well-being of all employees.
The Company’s belief is that its personnel are its key success factor, and over a period of time the Company has initiated various policies and practices to improve
employees wellbeing and engagement. The Company hasaspiration tooffer fully integratedHumanResourceManagement System (HRMS). The Company has launched the ePrism –Human Resource Information System for employees. Amongst a few of many advantage, ePrism offersasingleplatformtoemployees toaccess,control,monitor entire lifecycle in EP – from hire to retire i.e. recruitment, selection, induction, learning & development, performance and reward, career movements and others.
1 Please indicate the total no. of employees: Details relating to employees are mentioned in MDA or Board Report contained in this Annual Report.
2 Please indicate the total number of employees hired ontemporary/contractual/casualbasis:1421
3 Please indicate the Number of permanent women employee: 38
4 Please indicate the number of permanent employees with disabilities: 1
5 Do you have an employee association that is recognized by the management: No employees association exist. However employees have access to management to raise their concerns without any fear and its always endeavor of the management to resolve the issues satisfactorily. Wherever the workers unions exist at some manufacturing facilities, the Company cooperates with such union keeping in view larger interest of society, workers and stakeholders.
6 What percentage of your permanent employee is members of this recognized employee association: N.A.
7 Please indicate the Number of complaints relating to child labour, forced labour, involuntary labour, sexual harassmentinthelastfinancialyearandpending,asontheendoffinancialyear.
Sr. Category No. of complaints filed during
the financial year
No. of complaints pending as on end of
the financial year
1 Childlabour/forcedlabour/involuntary labour
Nil Nil
2 Sexual harassment
Nil Nil
3 Discriminatory employment
Nil Nil

62 63Annual Report 2017-18
8 What percentage of your under mentioned employees were given safety and skill up-gradation training in the last year.
The Company impart training relating to safety and skill upgradation to its employees including casual, temporary and contractual and its always endeavor of the management to cover maximum in the training programmes. The Company organizes various training sessions in-house. The Company has software based module for online survey of employee engagement and employee development plan.
Principle 4: Businesses should respect interest of, and be responsive towards all stakeholders, especially those who are disadvantaged, vulnerable and marginalized.
1 Has the company mapped its internal and external stakeholders?Yes/No
The Company has mapped its internal and external stakeholders, the major or key categories include Governments / regulatory authorities. However theprocess of mapping of stakeholders is an ongoing effortofupdation.
2 Out of the above, has the company identifiedthe disadvantaged, vulnerable & marginalized stakeholders.
TheCompanyisinprocesstofinalize.
3 Are there any special initiatives taken by the company to engage with the disadvantaged, vulnerable & marginalized stakeholders. If so, provide details thereof, in about 50 words or so.
As a part of its business operations, the Company supports various initiatives to create a greener and safer world. The Company’s initiative about Go Green is given in this Report. Further details of CSR initiatives by the Company are included in a report on CSR activities forming part of this Annual Report.
Principle 5: Business should respect and promote human rights.
1 Does the policy of the Company on human rights coveronlytheCompanyorextendtotheGroup/Jointventures/suppliers/contractors/NGOs/Others?
Essel Propack believes that an organization rests on a foundation of business ethics and valuing of human rights. Essel adheres to all statutes which embody the principles of human rights such as prevention of child labour, women empowerment, anti-sexual harassment of women etc. the Company promotes
awareness of the importance of human rights within its value chain and discourages instances of any abuse.
2 How many stakeholder complaints have been received inthepastfinancialyearandwhatpercentwas satisfactorily resolved by the Management?
There were no complaints reported on violation of anyHumanrightsduringthefinancialyear.
Principle 6: Business should respect, protect, and make efforts to restore the environment.
1 Does the policy related to principle 6 cover only the Company or extend to the Group/Joint ventures/suppliers/contractors/NGOS/Others?
Nurturing and safeguarding the environment for long term sustainability is of prime importance. The Company has undertaken green initiatives during the year.
2 Does the Company have strategies/initiatives toaddress global environmental issues such as climate change,globalwarming,etc?Y/N. Ifyes,pleasegivehyperlink for webpage etc: No
3 Does the company identify and assess potential environmentalrisks?Y/N
No. the Company’s manufacturing facility is largely machine based and do not emit or pollute the environment.
4 Does the company have any project related to Clean Development Mechanism? If so, provide details thereof, in about 50 words or so. Also, if yes, whether anyenvironmentalcompliancereportisfiled?(pleaseconfirm)
The Company does not have specific cleandevelopment mechanism. However the Company promotes clean environment initiatives. Company’s initiative about ‘Go Green’ is described in this report.
5 Has the company undertaken any other initiatives on – clean technology, energy efficiency, renewableenergy,etc.Y/N.Ifyes,pleasegivehyperlinkforwebpage etc.
Details relating to energy conservation is given in annexure to the Board report contained in this Report.
6 AretheEmissions/WastegeneratedbythecompanywithinthepermissiblelimitsgivenbyCPCB/SPCBforthefinancialyearbeingreported?:Yes
7 Number of show cause/legal notices received fromCPCB/SPCB which are pending (i.e. not resolved tosatisfaction)asonendoffinancialyear:Nil

64 65Annual Report 2017-18
Principle 7: Business, when engaged in influencing public and regulatory policy, should do so in a responsible manner
1 Is your company a member of any trade and chamber or association? If Yes, Name only those major ones that your business deals with.
The Company is member / associated with variousassociations including Organization of Plastics Processors of India (OPPI), Confederation of India Industry (CII), Federation of Indian Chambers of Commerce & Industry (FICCI), Indo-American Chambers of Commerce, Indo-German Chambers of Commerce, All India Association of Industries (AIAA), Bombay Chambers of Commerce and Industry, and Maharashtra Economic Development Council
2 Have you advocated/lobbied through aboveassociations for the advancement or improvement ofpublicgood?Yes/No;Ifyesspecifythebroadareas(drop box: Governance and Administration, Economic Reforms, Inclusive Development Policies, Energy security, Water, Food Security, Sustainable Business Principles, Others)
The Company extends its support to various business associations and supports / advocates on variousissues, whenever necessary, keeping in view the interest of various stakeholders.
Principle 8: Businesses should support inclusive growth and equitable development
1 Does the company have specified programme/initiatives/projects inpursuitof thepolicy related toPrinciple 8? If yes details thereof.
Relevant details of CSR initiatives are included in the Annual Report on CSR forming part of this Annual Report.
2 Are the programmes/projects undertaken throughin-house team/own foundation/external NGO/Governmentstructures/anyotherorganization?
The Company generally undertakes CSR projects through various agencies. Requisite details of entities through which CSR initiatives were undertaken included in the Annual Report on CSR forming part of this Annual Report. The Company also undertakes CSR activities mainly relating to providing benches, toilets and sanitary measures at various schools.
3 Have you done any impact assessment of your initiative?
The CSR team of the Company periodically does impact assessment of various initiatives undertaken by the Company.
4 What is your company’s direct contribution to community development projects – Amount in INR and the details of projects undertaken.
Refer details of CSR contributions in the Annual report on CSR forming part of this Annual Report.
5 Have you taken steps to ensure that this community development initiative is successfully adopted by the community? Please explain in 50 words or so.
Yes.
Principle 9: Business should engage with and provide value to their customers and consumers in a responsible manner
1 Whatpercentageof customer complaints/consumercasesarependingasontheendoffinancialyear.
There are no material consumer cases / customercomplaintsoutstandingasattheendoffinancialyear.
2 Does the company display product information on the product label, over and above what is mandated as per local laws? Yes/No/N.A./Remarks (additionalinformation): Not applicable
3 Is there any case filed by any stakeholder againstthe company regarding unfair trade practices, irresponsible advertising and/or anti-competitivebehaviorduringthelastfiveyearsandpendingasonendoffinancialyear.Ifso,providedetailsthereof,inabout 50 words or so: Nil
4 Did your company carry out any consumer survey/consumer satisfaction trends?
Customer service team and other management members whenever necessary, visit the customers to discuss and receive feedback and identifying consumers viewing behavior and emerging trends on consumer preferences. The Company has Creativity and Innovation Department with competent professionals to carry out research and development to cater needs of the customers. To match the expectation of the Company’s multinational and domestic customers, Essel continuously develop andofferadiverse rangeofprintingandpackagingsolutions.

64 65Annual Report 2017-18
Five Years’ Summary of Selected Financial Data (India)
(` in lakhs)Particulars As per previous GAAP As per IND AS*
2014 2015 2016 2017 2018Sales and other income 74,028 83,022 83,917 90,068 87,429 Profitbeforedepreciation,amortisation,financecostsandtax
15,600 16,199 22,075 17,770 21,174
Depreciation/Amortisation 3,665 4,575 5,063 6,021 6,866 Profitbeforetax 7,563 7,531 14,425 9,427 12,168 Profitaftertax 5,449 5,653 11,250 6,511 8,118 Dividends (including dividend tax) 2,298 3,015 4,158 4,538 4,548 Cashprofit 9,113 10,228 16,313 12,532 14,984 Book value per share 46.63 30.56 38.09 39.59 41.63 Basic earnings per share - ` 3.47 3.60 7.16 4.15 5.17 Dividend per share - ` 1.25 1.60 2.20 2.40 2.40 Closing share price on BSE at year end (` per share)
57.80 124.70 161.05 237.05 240.45
Market capitalisation (As at year end) 90,805 195,834 252,920 372,545 377,943 ASSETS LESS CURRENT LIABILITIESFixed assets (Net) 31,450 33,039 33,843 37,922 37,120 Non-current investments 56,996 29,091 22,038 22,060 21,894 Other Non-current assets, loans and advances
4,619 4,341 2,979 3,917 3,525
Current assets 33,440 32,408 32,594 31,823 36,480 126,505 98,879 91,454 95,722 99,019
Current liabilities (23,839) (18,196) (12,424) (14,758) (23,146)Net Assets 102,666 80,683 79,030 80,964 75,873 FINANCED BYShare capital ** 3,141 3,142 3,142 3,143 3,145 Reserves 70,109 47,822 56,696 59,066 62,326 Net Worth 73,250 50,964 59,838 62,209 65,471 Deferred tax balances 2,276 1,667 1,551 1,904 1,255 Non-current liabilities 27,140 28,052 17,641 16,851 9,147 Capital employed 102,666 80,683 79,030 80,964 75,873 FINANCIAL RETURNS AND STATISTICS Profitaftertaxasapercentofsalesandother income
7.4% 6.8% 13.4% 7.2% 9.3%
Profitbeforedepreciation,financecostsand tax as a percent of sales and other income
21.1% 19.5% 26.3% 19.7% 24.2%
Return on capital employed ^ 10.0% 12.0% 15.4% 14.3% 17.7%Returnonnetworth%(PAT/Networth) 7.4% 11.1% 18.8% 10.5% 12.4%Non-current liability as a percent of total year end Shareholders’ Fund
37% 55% 29% 27% 14%
Financial costs cover (Times) 2.65 2.84 6.58 5.06 6.69 (Profitbeforefinancialcostsandtaxationdividedbyfinancecosts)Number of equity shares outstanding (in lakhs) **
1,571 1,571 1,571 1,572 1,573
Cashprofittosalesandotherincome 12.3% 12.3% 19.4% 13.9% 17.1%
* The Company had transitioned to Indian Accounting Standards (Ind AS) w.e.f. 1st April 2016. Numbers for FY 16, FY 17 and FY 18 numbers are as per Ind AS. Hence not strictly comparable with earlier years presented under previous GAAP.** Refer Note 19^ Considering shareholder’s fund and total loan funds including short-term borrowings and current maturities of long-term borrowings.

66 PBAnnual Report 2017-18
Five Years’ Summary of Selected Financial Data (Consolidated)
(` in lakhs)Particulars As per previous GAAP As per IND AS**
2014 2015 2016 2017 2018Sales and other income 214,900 234,392 222,944 242,324 247,279 Profit before depreciation, amortisation,financecostsandtax
37,651 41,172 42,760 45,660 49,112
Depreciation and amortisation expense 12,576 13,179 12,316 14,148 16,707 Profitbeforeexceptionalitemsandtax 16,937 20,057 24,353 25,759 26,914 ProfitaftertaxattributabletoEquityholdersof the parent
10,783 14,063 17,010 19,032 17,160
Proposed Dividend 1,964 2,513 3,455 3,770 3,772 CashProfit 23,359 27,242 29,326 33,180 33,867 Basic earnings per share - ` 6.87 8.95 10.83 12.12 10.92 Dividend per share - ` 1.25 1.60 2.20 2.40 2.40 ASSETS LESS CURRENT LIABILITIESGoodwill - - - 1,423 1,423 Fixed assets (net) 93,368 97,600 98,127 118,456 121,159 Non current investments 4,544 4,575 3,038 1,526 1,310 Other non current assets, loans and advances
6,849 6,514 8,560 8,067 8,169
Current assets 104,503 102,306 92,166 96,398 113,399 209,264 210,995 201,891 225,870 245,460
Current liabilities (71,841) (64,730) (44,268) (54,497) (69,124)Net Assets 137,423 146,265 157,623 171,373 176,336 FINANCED BYShare capital 3,141 3,142 3,142 3,143 3,145 Reserves and surplus 67,444 75,155 93,336 100,756 121,914 Net Worth 70,585 78,297 96,478 103,899 125,059 Non controlling interest 755 808 814 572 430 Deferred tax balances 445 1,373 3,047 4,076 3,566
71,785 80,478 100,339 108,547 129,055 Non current liabilities 65,638 65,787 57,284 62,826 47,281 Capital employed 137,423 146,265 157,623 171,373 176,336 FINANCIAL RETURNS AND STATISTICSProfit after tax as a percent of Sales andother income
5.0% 6.0% 7.6% 7.9% 6.9%
Profit before depreciation, amortisation,financecostsandtaxasapercentofSalesand other income
17.5% 17.6% 19.2% 18.8% 19.9%
Return on Capital Employed (Profit beforeFinanceCostsandTax/AvgCapitalEmployed)(With Goodwill) ^
13.7% 16.4% 18.3% 17.7% 16.8%
Return on Net worth (PAT/Avg Net worth)(With Goodwill)
13.1% 18.9% 19.7% 19.0% 15.0%
Non current liabilities as a percentage of Shareholders’ funds
93% 84% 59% 60% 38%
Finance Costs Cover (Times) (Profit beforeFinanceCostsandTaxation/FinanceCosts)
3.1 3.5 5.1 5.5 5.9
Cashprofittosalesandotherincome 10.9% 11.6% 13.2% 13.7% 13.7%**TheCompany’sfinancialsforFY16,FY17andFY18presentedaboveareasperIndAS.Hencenotstrictlycomparablewith earlier years presented under previous GAAP.^ Considering shareholder’s funds and total loan funds including short-term borrowings and current maturities of long-term borrowings.

67Annual Report 2017-18
Independent Auditor’s ReportTo
The Members of
Essel Propack Limited
1. Reportonthestandalonefinancialstatements
We have audited the accompanying standalone financial statements of Essel Propack Limited (‘the Company’), which comprise the balance sheet as at 31 March 2018, the statement of profit and loss (including other comprehensive income), the statement of cash flows and the statement of changes in equity for the year then ended and a summary of the significant accounting policies and other explanatory information (herein after referred to as “standalone financial statements”).
2. Management’s responsibility for the standalone financialstatements
The Company’s Board of Directors is responsible for the matters stated in Section 134 (5) of the Companies Act, 2013 (“ the Act”) with respect to the preparation of these standalone financial statements that give a true and fair view of the financial position, financial performance including other comprehensive income, cash flows and changes in equity of the Company in accordance with the accounting principles generally accepted in India, including the Indian Accounting Standards (Ind AS) prescribed under Section 133 of the Act read with the Companies (Indian Accounting Standards) Rules, 2015, as amended.
This responsibility also includes maintenance of adequate accounting records in accordance with the provisions of the Act for safeguarding the assets of the Company and for preventing and detecting frauds and other irregularities; selection and application of appropriate accounting policies; making judgments and estimates that are reasonable and prudent; and design, implementation and maintenance of adequate internal financial controls, that were operating effectively for ensuring the accuracy and completeness of the accounting records, relevant to the preparation and presentation of the standalone financial statements that give a true and fair view and are free from material misstatement, whether due to fraud or error.
3. Auditor’s responsibility
Our responsibility is to express an opinion on these standalone financial statements based on our audit. While conducting the audit, we have taken into account the provisions of the Act, the Accounting and Auditing Standards and matters which are required to be included in the audit report under the provisions of the Act and the Rules made thereunder.
We conducted our audit of the standalone financial statements in accordance with the Standards on Auditing specified under Section 143(10) of the Act. Those Standards require that we comply with ethical requirements and plan and perform the audit to obtain reasonable assurance about whether the standalone financial statements are free from material misstatement.
An audit involves performing procedures to obtain audit evidence about the amounts and disclosures in the standalone financial statements. The procedures selected depend on the auditor’s judgment, including the assessment of the risks of material misstatement of the standalone financial statements, whether due to fraud or error. In making those risk assessments, the auditor considers internal financial control relevant to the Company’s preparation of the standalone financial statements that give a true and fair view in order to design audit procedures that are appropriate in the circumstances. An audit also includes evaluating the appropriateness of the accounting policies used and the reasonableness of the accounting estimates made by the Company’s Directors, as well as evaluating the overall presentation of the standalone financial statements.
We believe that the audit evidence we have obtained is sufficient and appropriate to provide a basis for our audit opinion on the standalone financial statements.
4. Opinion
In our opinion and to the best of our information and according to the explanations given to us, the aforesaid standalone financial statements give the information required by the Act in the manner so required and give a true and fair view in conformity with the accounting principles generally accepted

68
in India, of the state of affairs of the Company as at 31 March 2018, and its profit, total comprehensive income, its cash flows and the changes in equity for the year ended on that date.
5. Other Matters
The comparative financial information of the Company for the year ended 31 March 2017 included in these standalone financial statements have been audited by the predecessor auditor. The report of the predecessor auditor on the comparative financial information dated 23 May 2017 expressed an unmodified opinion, which has been relied upon by us.
6. Report on other Legal and Regulatory requirements
I. As required by the Companies (Auditor’s Report) Order, 2016 issued by the Central Government of India in terms of section 143(11) of the Act (“the Order”), and on the basis of such checks of the books and records of the Company as we considered appropriate and according to the information and explanations given to us, we give in the Annexure A, a statement on the matters specified in the paragraph 3 and 4 of the Order.
II. As required by Section143 (3) of the Act, we report that:
a) We have sought and obtained all the information and explanations which to the best of our knowledge and belief were necessary for the purposes of our audit;
b) In our opinion, proper books of account as required by law have been kept by the Company so far as it appears from our examination of those books;
c) The balance sheet, the statement of profit and loss (including other comprehensive income), the statement of cash flows and the statement of changes in equity dealt with by this Report are in agreement with the books of account;
d) In our opinion, the aforesaid standalone financial statements comply with the
Indian Accounting Standards specified under Section 133 of the Act read with the Companies (Indian Accounting Standards) Rules, 2015, as amended;
e) On the basis of written representations received from the directors of the Company as on 31 March 2018 and taken on record by the Board of Directors, none of the directors is disqualified as on 31 March 2018 from being appointed as a director in terms of Section 164 (2) of the Act;
f) With respect to the adequacy of the internal financial controls over financial reporting of the Company and the operating effectiveness of such controls, refer to our separate Report in “Annexure B”; and
g) With respect to the other matters to be included in the Auditor’s Report in accordance with Rule 11 of the Companies (Audit and Auditors) Rules, 2014, in our opinion and to the best of our information and according to the explanations given to us:
i. The Company has disclosed the impact of pending litigations on its financial position in its standalone financial statements;
ii. The Company did not have any long-term contracts including derivative contracts having any material foreseeable losses; and
iii. There has been no delay in transferring amounts, required to be transferred, to the Investor Education and Protection Fund by the Company.
For Ford Rhodes Parks & Co. LLPChartered Accountants
Firm Registration Number: 102860W/W100089
Ramaswamy SubramanianPartner
Membership Number 016059Mumbai, 26 April 2018

69Annual Report 2017-18
Annexure A to the Independent Auditor’s Report
Annexure referred to in paragraph 6(I) under “Report on other Legal and Regulatory requirements” of our report of even date to the members of Essel Propack Limited on the standalone financial statements forthe year ended 31 March 2018
i. (a) The Company has maintained proper records showing full particulars, including quantitative details and situation of fixed assets.
(b) The Company has a regular programme of physical verification of its fixed assets by which all fixed assets are verified in a phased manner over a period of three years. In our opinion, this periodicity of physical verification is reasonable having regard to the size of the Company and the nature of its assets. In accordance with this programme, certain fixed assets were physically verified by the management during the year. As informed to us, no material discrepancies were noticed on such verification.
(c) According to the information and explanations given to us and on the basis of our examination of the records of the Company, the title deeds of immovable properties are held in the name of the Company.
ii. Inventories, except for goods-in-transit and stocks lying with third parties have been physically verified by the management. For stocks lying with third parties at the year end, these have been confirmed by them. In our opinion, the frequency of such verification is reasonable. Discrepancies noticed on such verification between physical stocks and the book records were not material and these have been properly dealt with in the books of account.
iii. The Company had granted unsecured loan of ` 9,607 lakhs to a company covered in the register maintained under Section 189 of the Act;
a) In our opinion, the rate of interest and other terms and conditions on which the loan had been granted to the company listed in the register maintained under Section 189 of the Act is prima facie not prejudicial to the interest of the Company.
b) The aforesaid loan granted is repayable on demand and the borrower is regular in payment of interest as stipulated except for minor delay.
c) There is no amount of interest overdue for more than 90 days as at 31 March 2018.
iv. In our opinion and according to the information and explanations given to us, the Company has complied with the provisions of Section 185 and 186 of the Act, in respect of loans/ guarantees given, investments made and securities provided by it.
v. The Company has not accepted any deposits from the public within the meaning of Sections 73 to 76 of the Act.
vi. We have broadly reviewed the cost records maintained by the Company prescribed by the Central Government under Section 148(1) of the Act and are of the opinion that prima facie the prescribed accounts and records have been made and maintained. We have however not made a detailed examination of such records with a view to determine whether they are accurate or complete.
vii. According to the records of the Company examined by us and information and explanations given to us:
a) Undisputed statutory dues including provident fund, employees’ state insurance, income tax, sales tax, service tax, duty of customs, duty of excise, value added tax, goods and services tax, cess and others as applicable have generally been regularly deposited with the appropriate authorities except delay in few cases. There are no undisputed amounts payable in respect of aforesaid dues outstanding as at 31 March 2018 for a period of more than six months from the date they became payable.
b) There are no dues of service tax and duty of customs which have not been deposited on account of any dispute. The disputed dues of income tax, sales tax, duty of excise and value added tax which have not been deposited are as under:

70
Name of the Statute
Nature of the Dues
` in lakhs
Period to which the amount relate
Forum where dispute is pending
Central Excise Act, 1944
Duty of Excise
151 FY 2001-2002 to FY 2005-2006, FY 2009-2010 and FY 2010-2011
Tribunal CESTAT
101 FY 2009-2010 to FY 2010-2011 and FY 2013-2014 to FY 2014-2015
Commissioner of Central Excise (Appeals)
Maharashtra Value Added Tax Act, 2002
Value added tax
76 FY 2005-2006 Maharashtra Sales Tax Tribunal
5 FY 2013-2014 Commissioner of Sales Tax
Himachal Pradesh Value Added Tax Act, 2005
Value added tax
3 FY 2008-2009 Additional Excise and Taxation Commissioner
Central Sales Tax Act, 1956
Central sales tax
861 FY 2002-2003, FY 2005-2006, FY 2006-2007, FY 2007-2008 and 2008-2009
Maharashtra Sales Tax Tribunal
228 FY 2002-2003 to FY 2004-2005 Commissioner of VAT-Dadra and Nagar Haveli
248 FY 2002-2003, FY 2008-2009 and FY 2011-2012
Deputy Commissioner of Sales Tax (Appeals)
573 FY 2001-2002, FY 2003-2004, FY 2005-2006, FY 2012-2013 and FY 2013-2014
Joint Commissioner of Sales Tax (Appeals)
29 FY 2009-2010, FY 2011-2012, FY 2012-2013 and FY 2013-2014
Assistant Commissioner of Commercial Taxes
The Income Tax Act, 1961
Income tax– Penalty
55 FY 2006-2007 Income Tax Appellate Tribunal
797 FY 2007-2008, FY 2011-2012 and FY 2012-2013
Commissioner of Income Tax (Appeals)
Income tax 830 FY 2006-2007, FY 2011-2012, FY 2012-2013 and FY 2013-2014
Commissioner of Income Tax (Appeals)
viii. According to the records of the Company examined by us and the information and explanations given to us, the Company has not defaulted in repayment of loans or borrowings to financial institutions, banks, government or dues to debenture holders.
ix. In our opinion and according to the information and explanations given to us, the Company has not raised any money by way of initial public offer or further public offer (including debt instruments) and term loans during the year.
x. During the course of our examination of the books and records of the Company, carried out in accordance with the generally accepted auditing practices in India, and according to the information and explanations given to us, we have neither come across any instance of material fraud by the Company or on the Company by its officers or employees, noticed or reported
during the year, nor have been informed of any such case by the Management.
xi. According to the records of the Company examined by us, and information and explanations given to us, the Company has paid/provided for managerial remuneration in accordance with the requisite approvals mandated by the provisions of Section 197 read with Schedule V to the Act.
xii. In our opinion and according to the information and explanations given to us, the Company is not a Nidhi company and the Nidhi Rules, 2014 are not applicable to it.
xiii. According to the information and explanations given to us and based on our examination of the records of the Company, transactions with the related parties are in compliance with Sections 177 and 188 of the

71Annual Report 2017-18
Act where applicable and details of such transactions have been disclosed in the standalone financial statements as required by the applicable Indian Accounting Standards.
xiv. According to the records of the Company examined by us, and information and explanations given to us, the Company has not made any preferential allotment or private placement of shares or fully or partly convertible debentures during the year.
xv. According to the records of the Company examined by us, and information and explanations given to us, the Company has not entered into non-cash transactions with directors or persons connected with him.
xvi. The Company is not required to be registered under Section 45-IA of the Reserve Bank of India Act, 1934.
For Ford Rhodes Parks & Co. LLPChartered Accountants
Firm Registration Number: 102860W/W100089
Ramaswamy SubramanianPartner
Membership Number 016059Mumbai, 26 April 2018

72
Annexure B to the Independent Auditor’s Report
Report on the Internal Financial Controls under Clause (i) of Sub-section 3 of Section 143 of the Companies Act, 2013 (“the Act”) as referred to in paragraph 6(II)(f) under “Report on other Legal and Regulatory requirements” of our report of even date to the members of Essel Propack Limited on the standalone financial statements for the year ended 31 March 2018
We have audited the internal financial controls over financial reporting of Essel Propack Limited (“the Company”) as of 31 March 2018 in conjunction with our audit of the standalone financial statements of the Company for the year ended on that date.
Management’s Responsibility for Internal Financial Controls
The Company’s management is responsible for establishing and maintaining internal financial controls based on the internal control over financial reporting criteria established by the Company considering the essential components of internal control stated in the Guidance Note on Audit of Internal Financial Controls Over Financial Reporting (the “Guidance Note”) issued by the Institute of Chartered Accountants of India (ICAI). These responsibilities include the design, implementation and maintenance of adequate internal financial controls that were operating effectively for ensuring the orderly and efficient conduct of its business, including adherence to company’s policies, the safeguarding of its assets, the prevention and detection of frauds and errors, the accuracy and completeness of the accounting records, and the timely preparation of reliable financial information, as required under the Act.
Auditor’s Responsibility
Our responsibility is to express an opinion on the Company’s internal financial controls over financial reporting based on our audit. We conducted our audit in accordance with the Guidance Note on “Audit of Internal Financial Controls over Financial Reporting” (the “Guidance Note”) issued by the Institute of Chartered Accountants of India and the Standards on Auditing prescribed under Section 143(10) of the Companies Act, 2013, to the extent applicable to an audit of internal financial controls. Those Standards and the Guidance Note require that we comply with ethical requirements and plan and perform the audit to obtain reasonable assurance about whether adequate internal financial controls over financial reporting was established and maintained and if such controls operated effectively in all material respects.
Our audit involves performing procedures to obtain audit evidence about the adequacy of the internal financial controls system over financial reporting and their operating effectiveness. Our audit of internal financial controls over financial reporting included obtaining an understanding of internal financial controls over financial reporting, assessing the risk that a material weakness exists, and testing and evaluating the design and operating effectiveness of internal control based on the assessed risk. The procedures selected depend on the auditor’s judgment, including the assessment of the risks of material misstatement of the standalone financial statements, whether due to fraud or error.
We believe that the audit evidence we have obtained is sufficient and appropriate to provide a basis for our audit opinion on the Company’s internal financial controls system over financial reporting.
Meaning of Internal Financial Controls over Financial Reporting
A company’s internal financial control over financial reporting is a process designed to provide reasonable assurance regarding the reliability of financial reporting and the preparation of financial statements for external purposes in accordance with generally accepted accounting principles. A company’s internal financial control over financial reporting includes those policies and procedures that (1) pertain to the maintenance of records that, in reasonable detail, accurately and fairly reflect the transactions and dispositions of the assets of the company; (2) provide reasonable assurance that transactions are recorded as necessary to permit preparation of financial statements in accordance with generally accepted accounting principles, and that receipts and expenditures of the company are being made only in accordance with authorisations of management and directors of the company; and (3) provide reasonable assurance regarding prevention or timely detection of unauthorised acquisition, use, or disposition of the company’s assets that could have a material effect on the financial statements.
Inherent Limitations of Internal Financial Controls Over Financial Reporting
Because of the inherent limitations of internal financial controls over financial reporting, including the possibility of collusion or improper management override of controls, material misstatements due to error or fraud may occur

73Annual Report 2017-18
and not be detected. Also, projections of any evaluation of the internal financial controls over financial reporting to future periods are subject to the risk that the internal financial control over financial reporting may become inadequate because of changes in conditions, or that the degree of compliance with the policies or procedures may deteriorate.
Opinion
In our opinion, the Company has, in all material respects, an adequate internal financial controls system over financial reporting and such internal financial controls over financial reporting were operating effectively as at 31 March 2018, based on the internal control over financial reporting criteria established by the Company considering
the essential components of internal control stated in the Guidance Note issued by the Institute of Chartered Accountants of India.
For Ford Rhodes Parks & Co. LLPChartered Accountants
Firm Registration Number: 102860W/W100089
Ramaswamy SubramanianPartner
Membership Number 016059Mumbai, 26 April 2018

74
Balance Sheet as at 31 March 2018
(` in lakhs)Note 2018 2017
AssetsNon-current assets(a) Property, plant and equipment 4 34,160 35,159 (b) Capital work-in-progress 4 1,723 1,532 (c) Intangible assets 5 276 442 (d) Intangible assets under development 5 961 789 (e) Financial assets (i) Investments 6 21,894 22,060 (ii) Loans 7 571 1,697 (iii) Others 8 20 29 (f) Non-current tax assets (net) 9 523 458 (g) Other non-current assets 10 2,411 1,733 Total non-current assets 62,539 63,899 Current assets(a) Inventories 11 8,305 6,673 (b) Financial assets (i) Trade receivables 12 12,913 10,376 (ii) Cash and cash equivalents 13 717 41 (iii) Bank balances other than cash and cash equivalents 14 99 77 (iv) Loans 15 11,122 11,139 (v) Others 16 470 376 (c) Current tax assets (net) 17 - 151 (d) Other current assets 18 2,854 2,990 Total current assets 36,480 31,823 Total assets 99,019 95,722 Equity and liabilitiesEquity(a) Equity share capital 19 3,145 3,143 (b) Other equity 20 62,326 59,066 Total equity 65,471 62,209 LiabilitiesNon-current liabilities(a) Financial liabilities Borrowings 21 7,262 15,045 (b) Provisions 22 1,885 1,806 (c) Deferred tax liabilities (net) 39 1,255 1,904 Total non-current liabilities 10,402 18,755 Current liabilities(a) Financial liabilities (i) Borrowings 23 5,699 1,795 (ii) Trade payables 24 5,408 4,681 (iii) Others 25 10,812 6,872 (b) Other current liabilities 26 418 499 (c) Provisions 27 431 421 (d) Current tax liabilities (net) 28 378 490 Total current liabilities 23,146 14,758 Total equity and liabilities 99,019 95,722 Notes forming part of the financial statements 1 - 61
As per our attached report of even date For and on behalf of the Board
For Ford Rhodes Parks & Co. LLP Chartered AccountantsFirm Registration Number 102860W/W100089
Ashok GoelChairman & Managing Director
A.V. GanapathyChief Financial Officer
Boman Moradian
DirectorsRamaswamy SubramanianPartnerMembership Number 016059
Mukund M. Chitale Suresh SavaliyaCompany Secretary & Head - LegalRadhika Pereira
Atul Goel
Place: MumbaiDate: 26 April 2018
{

75Annual Report 2017-18
StatementofProfitandLossfor the year ended 31 March 2018
As per our attached report of even date For and on behalf of the Board
For Ford Rhodes Parks & Co. LLP Chartered AccountantsFirm Registration Number 102860W/W100089
Ashok GoelChairman & Managing Director
A.V. GanapathyChief Financial Officer
Boman Moradian
DirectorsRamaswamy SubramanianPartnerMembership Number 016059
Mukund M. Chitale Suresh SavaliyaCompany Secretary & Head - LegalRadhika Pereira
Atul Goel
Place: MumbaiDate: 26 April 2018
{(` in lakhs)
Particulars Notes 2018 2017Income
Revenue from operations 29 85,225 88,105 Other income 30 960 500Interest income 31 1,244 1,463
Total income 87,429 90,068Expenses
Cost of materials consumed 32 36,598 35,411 Changes in inventories of finished goods and goods-in-process 33 (350) 140 Excise duty on sale of goods 59 2,254 8,565 Employee benefits expense 34 8,570 8,382 Finance costs 35 2,140 2,322 Depreciation and amortisation expense 36 6,866 6,021 Other expenses 37 19,183 19,800
Total expenses 75,261 80,641 Profitbeforetax 12,168 9,427 Tax expense 39
Current tax 4,660 2,911 Deferred tax charge/(credit) (610) 5
Total tax expense 4,050 2,916 Profitfortheyear 8,118 6,511 Other comprehensive incomeItems that will not be reclassified to profit or loss - Remeasurement gains/(losses) on defined benefit plan 44 (113) (182) Income tax effect on above 39 39 63 Other comprehensive income/(loss) for the year (74) (119)Total comprehensive income for the year 8,044 6,392 Earnings per equity share of ` 2 each fully paid up 38
Basic (`) 5.17 4.15 Diluted (`) 5.16 4.13
Notesformingpartofthefinancialstatements 1 - 61

76
Statement of changes in equity for the year ended 31 March 2018
A Equity share capital(` in lakhs)
NoteBalance as at 1 April 2016 * 19 3,142 Changes in equity share capital 1 Balance as at 31 March 2017 19 3,143 Changes in equity share capital 2 Balance as at 31 March 2018 19 3,145 * Including forfeited shares of ` 1 lakh [Refer note 19 (h)]
B Other equity(` in lakhs)
NoteCapital reserve
Securities premium
reserve
Debenture redemption
reserve
Share options outstanding
account
General reserve
Retained earnings
Total other
equityBalance as at 1 April 2016 3,983 10,893 1,500 722 12,541 27,057 56,696 Profit for the year - - - - - 6,511 6,511 Other comprehensive income/(loss) for the year - - - - - (119) (119)Total comprehensive income for the year - - - - - 6,392 6,392 Pursuant to the scheme of amalgamation 58 996 - - - - 39 1,035 Expenses incurred in connection with the scheme of amalgamation
58 (996) - - - - - (996)
Share options exercised during the year 20 & 43 - 69 - - - - 69 Amount transferred from share options outstanding account on exercise of options
20 & 43 - 25 - (25) - - -
Share based payments 20 & 43- Share based payment expense (net) - - - 6 - - 6 - Options granted to employees of subsidiaries - - - 22 - - 22 Transfer to debenture redemption reserve 20 - - 750 - - (750) - Equity dividend 45 - - - - - (3,455) (3,455)Tax on equity dividend 45 - - - - - (703) (703)Balance as at 31 March 2017 3,983 10,987 2,250 725 12,541 28,580 59,066
Balance as at 1 April 2017 3,983 10,987 2,250 725 12,541 28,580 59,066 Profit for the year - - - - - 8,118 8,118 Other comprehensive income/(loss) for the year - - - - - (74) (74)Total comprehensive income for the year - - - - - 8,044 8,044 Share options exercised during the year 20 & 43 - 96 - - - - 96 Transferred from share options outstanding account on exercise of options
20 & 43 - 35 - (35) - - -
Share based payments 20 & 43- Share based payment credit (net) - - - (176) - - (176)- Options granted/(forfeited) to employees of
subsidiaries - - - (166) - - (166)
- Transferred to retained earnings on forfeiture of vested options
- - - (15) - 15 -
Equity dividend 45 - - - - - (3,770) (3,770)Tax on equity dividend 45 - - - - - (768) (768)Balance as at 31 March 2018 3,983 11,118 2,250 333 12,541 32,101 62,326 As per our attached report of even date For and on behalf of the Board
For Ford Rhodes Parks & Co. LLP Chartered AccountantsFirm Registration Number 102860W/W100089
Ashok GoelChairman & Managing Director
A.V. GanapathyChief Financial Officer
Boman Moradian
DirectorsRamaswamy SubramanianPartnerMembership Number 016059
Mukund M. Chitale Suresh SavaliyaCompany Secretary & Head - LegalRadhika Pereira
Atul Goel
Place: MumbaiDate: 26 April 2018
{

Notes forming part of the financial statements
77Annual Report 2017-18
1 Corporate information
Essel Propack Limited (hereinafter referred to as ‘EPL’ or ‘the Company’ or ‘the parent company’) is domiciled and incorporated in India and its shares are publicly traded on the National Stock Exchange (NSE) and Bombay Stock Exchange (BSE) in India. The Company’s registered office is located at P.O. Vasind , Taluka : Shahpur District: Thane, Maharashtra - 421604 , India. The Company is engaged in manufacture of plastic packaging material in the form of multilayer collapsible tubes and laminates used primarily for packaging of consumer products in the Beauty & Cosmetics, Health & Pharmaceuticals, Food, Home and Oral care categories.
The separate financial statements (hereinafter referred to as ”Financial Statements”) of the Company for the year ended 31 March 2018 were authorised for issue by the Board of Directors at their meeting held on 26 April 2018.
2 Basisofpreparationoffinancialstatements
a) The financial statements have been prepared to comply in all material respects with the Indian Accounting Standards (Ind AS) notified under Section 133 of Companies Act, 2013 (the Act) read with Companies (Indian Accounting Standards) Rules, 2015 (as amended) and other relevant provisions of the Act and rules framed thereunder and guidelines issued by Securities and Exchange Board of India (SEBI).
These financial statements have been prepared under the historical cost convention and on accrual basis, except for certain financial assets and liabilities (including derivative instruments), defined benefit plan assets and liabilities and share based payments being measured at fair value.
Fair value is the price that would be received to sell an asset or paid to transfer a liability in an orderly transaction between market participants at the measurement date, regardless of whether that price is directly observable or estimated using another valuation technique. In estimating the fair value of an asset or a liability, the Company takes into account the characteristics of the asset or liability if market participants would take those characteristics into account when pricing the asset or a liability at the measurement date.
The financial statements are presented in Indian Rupees (‘INR’) with values rounded off to the nearest lakhs (00,000), except otherwise indicated. Zero ‘0’ denotes amount less than a lakh.
b) Currentandnon-currentclassification
Assets and liabilities are classified as current if expected to realise or settle within twelve months after the balance sheet date. Deferred tax assets and liabilities are classified as non-current assets and liabilities.
3 (A)Significantaccountingpolicies
a) Investment in subsidiaries
Investments in subsidiaries are accounted at cost in accordance with Ind AS 27 “Separate financial statements”. Refer note 6 for the list of significant investments.
b) Property, plant and equipment
(i) Free hold land is carried at cost. Other property, plant and equipment are stated at original cost of acquisition/installation (net of goods and service tax / cenvat credit availed) less accumulated depreciation and impairment loss, if any. Cost includes cost of acquisition, construction and installation, taxes, duties, freight and other incidental expenses that are directly attributable to bringing the asset to its working condition for the intended use and estimated cost for decommissioning of an asset. Further, in respect of accounting periods commencing on or after 7 December, 2006, exchange differences arising on reporting of long-term foreign currency monetary items which are recognised in the financial statements till the period ending 31 March 2016 at rates different from those at which they were initially recorded during the period, or reported in the previous financial statements are added to or deducted from the cost of the assets and depreciated over the balance life of the asset, where these monetary items pertain to the acquisition of depreciable property, plant and equipment.

Notes forming part of the financial statements
78
(ii) Capital work-in-progress comprises cost of property, plant & equipment and related expenses that are not yet ready for their intended use at the reporting date.
(iii) On transition to Ind AS, the Company had elected to continue with the carrying value of all of its property, plant and equipment recognised as at 1 April 2015 measured as per the previous GAAP and use that carrying value as the deemed cost of the property, plant and equipment.
Depreciation on property, plant and equipment
i) Depreciation on property, plant and equipment is provided to the extent of depreciable amount on straight-line method over the useful life of asset as specified in Part-C of Schedule II to the Act. Depreciation is charged on pro-rata basis for asset purchased / sold during the year. Depreciation on the following assets is provided considering a shorter useful life as compared to Schedule II useful life, based on management estimate in view of possible technology obsolescence and product life cycle implications.
Assets Useful lifeTooling, Moulds, Dies 7 years
Hydraulic works, Pipelines and Slucies (HWPS) 10 years
Overhauling of plant and machinery 5 years
Property, plant and equipment acquired under finance leases is depreciated over the asset’s useful life or over the shorter of the asset’s useful life and the lease term if there is no reasonable certainty that the Company will obtain ownership at the end of the lease term.
ii) Premium on leasehold land and leasehold improvements are amortised over the normal period of lease.
c) Intangible assets
i) Intangible assets are stated at cost of acquisition less accumulated amortisation. Intangible assets with finite lives are amortised on a straight-line basis over the useful economic life and assessed for impairment whenever there is an indication that the intangible asset may be impaired. The amortisation expense on intangible assets with finite lives is recognised in the statement of profit and loss.
ii) On transition to Ind AS, the Company had elected to continue with the carrying value of all of its intangible assets recognised as at 1 April 2015 measured as per the previous GAAP and use that carrying value as the deemed cost of the intangible assets.
iii) Intangibles assets with finite lives are amortised as follows:
- Softwares : ERP software 10 years and others 3 years
- Patents : 10 years
d) Impairmentofnon-financialassets
The carrying amounts of non-financial assets are reviewed at each balance sheet date if there is any indication of impairment based on internal / external factors. An asset is treated as impaired when the carrying amount exceeds its recoverable value. The recoverable amount is the greater of the asset’s net selling price and value in use. In assessing value in use, the estimated future cash flows are discounted to the present value using a pre-tax discount rate that reflects current market assessment of the time value of money and risks specific to the assets. An impairment loss is charged to the statement of profit and loss in the year in which an asset is identified as impaired. After impairment, depreciation / amortisation is provided on the revised carrying amount of the asset over its remaining useful life. The impairment loss recognised in prior accounting periods is reversed by crediting the statement of profit and loss if there has been a change in the estimate of recoverable amount.
e) Borrowing costs
Borrowing costs that are attributable to the acquisition or construction of qualifying assets are capitalised as part of the cost of such assets. A qualifying asset is one that necessarily takes substantial period of time to get

Notes forming part of the financial statements
79Annual Report 2017-18
ready for intended use. Ancillary costs incurred in connection with the arrangement of borrowings are amortised over the tenure of such borrowings. All other borrowing costs are charged to the statement of profit and loss as finance costs. Borrowing costs also include exchange differences to the extent regarded as an adjustment to the borrowing costs under Ind AS 23.
f) Financial assets
i) Recognition and measurement
The Company at initial recognition measures a financial asset at its fair value plus transaction costs that are directly attributable to it’s acquisition. However, transaction costs relating to financial assets to be subsequently valued at fair value through profit or loss (FVTPL) are expensed in the statement of profit and loss for the year.
The Company subsequently recognises its financial assets either at FVTPL, fair value through other comprehensive income (FVOCI) or at amortised cost, based on the Company’s business model for managing the financial assets and their contractual cash flows. This has been explained below separately for debt instruments and equity instruments.
Debt instruments
Amortised cost: Assets that are held for collection of contractual cash flows where those cash flows represent solely payments of principal and interest are measured at amortised cost. A gain or loss on such instruments is recognised in the statement of profit and loss when the asset is derecognised or impaired. Interest income from these financial assets is included in interest income using the effective interest rate method (EIR).
Fair value through other comprehensive income (FVOCI): Assets that are held for collection of contractual cash flows and for selling the financial assets, where the assets’ cash flows represent solely payments of principal and interest, are measured at fair value through other comprehensive income (FVOCI). Movements in the carrying amount are taken through OCI, except for the recognition of impairment gains or losses, interest income and foreign exchange gains and losses which are recognised in the statement of profit and loss. When the financial asset is derecognised, the cumulative gain or loss previously recognised in OCI is reclassified from equity to statement of profit and loss. Interest income from these financial assets is included in interest income using the effective interest rate method (EIR).
Fairvaluethroughprofitorloss(FVTPL): Assets that do not meet the criteria for amortised cost or fair value through other comprehensive income (FVOCI) are measured at fair value through profit or loss. Gain and losses on fair value of such instruments are recognised in the statement of profit and loss. Interest income from these financial assets is included in other income.
Equity instruments
The Company subsequently measures all equity instruments (other than investments in subsidiaries) at fair value. Where the Company’s management has elected to present fair value gains and losses on equity instruments in other comprehensive income, there is no subsequent reclassification of fair value gains and losses to the statement of profit and loss in the event of de-recognition. Dividends from such instruments are recognised in the statement of profit and loss as other income when the Company’s right to receive payments is established. Changes in the fair value of financial assets at fair value through profit or loss are recognised in the statement of profit and loss. Impairment losses (and reversal of impairment losses) on equity instruments measured at FVOCI are not reported separately from other changes in fair value.
ii) Impairmentoffinancialassets
The Company assesses on a forward looking basis the expected credit losses associated with its assets carried at amortised cost and FVOCI debt instruments. The impairment methodology applied depends on whether there has been a significant increase in credit risk.

Notes forming part of the financial statements
80
iii) De-recognitionoffinancialassets
A financial asset is derecognised only when
The Company has transferred the rights to receive cash flows from the financial asset or
retains the contractual rights to receive the cash flows of the financial asset, but assumes a contractual obligation to pay the cash flows to one or more recipients.
Where the entity has transferred an asset, the Company evaluates whether it has transferred substantially all risks and rewards of ownership of the financial asset. In such cases, the financial asset is derecognised. Where the entity has not transferred substantially all risks and rewards of ownership of the financial asset, the financial asset is not derecognised.
Where the entity has neither transferred a financial asset nor retains substantially all risks and rewards of ownership of the financial asset, the financial asset is derecognised if the Company has not retained control of the financial asset. Where the Company retains control of the financial asset, the asset is continued to be recognised to the extent of continuing involvement in the financial asset.
g) Derivatives and embedded derivatives
i) The Company enters into certain derivative contracts (mainly foreign exchange forward contracts) to hedge risks, which are not designated as hedges. Such contracts are accounted for at fair value through profit or loss and are recognised in the statement of profit and loss.
ii) Derivatives embedded in a host contract that are assets within the scope of Ind AS 109 or are closely related to the host contract, are not separated. Derivatives embedded in all other host contracts are separated only if the economic characteristics and risks of the embedded derivative are not closely related to the economic characteristics and risks of the host, and are measured at fair value through profit or loss.
h) Borrowingsandotherfinancialliabilities
i) Borrowings and other financial liabilities are initially recognised at fair value net of transaction costs incurred that are directly attributable to the acquisition of the financial liability.
ii) Subsequently recognition is done at amortised cost using the effective interest rate (EIR) method. Gains and losses are recognised in the statement of profit and loss when the liabilities are derecognised as well as through the EIR amortisation process. The EIR amortisation is included in finance costs in the statement of profit and loss.
iii) Borrowings and other financial liabilities are derecognised when the obligation specified in the contract is discharged, cancelled or expired. The difference between the carrying amount of a financial liability that has been extinguished or transferred to another party and the consideration paid, including any non-cash assets transferred or liabilities assumed, is recognised in the statement of profit and loss.
i) Employeebenefits
i) Short-termbenefits
Short-term employee benefits are recognised as an expense at the undiscounted amount in the statement of profit and loss for the year in which the related services are rendered.
ii) Definedbenefitplans
a) Post-employment and other long-term employee benefits are recognised as an expense in the statement of profit and loss for the year in which the employee has rendered services. The expense is recognised at the present value of the amount payable determined using actuarial valuation techniques.
b) Re-measurement of the net defined benefit liability, which comprises of actuarial gains and losses, the return on plan assets (excluding interest) and the effect of the asset ceiling (if any, excluding interest) are recognised in other comprehensive income in the period in which they occur.

Notes forming part of the financial statements
81Annual Report 2017-18
iii) Definedcontributionplans
Payments to defined contribution retirement benefit schemes are charged to the statement of profit and loss of the year when the contribution to the respective funds are due. There are no other obligations other than the contribution payable to the fund.
j) Share based payments
Equity settled share based compensation benefits are provided to employees under the Essel Employee Stock Option Scheme 2014. The fair value of options granted under the Essel Employee Stock Option Scheme 2014 is recognised as an employee benefits expense with a corresponding increase in equity as “Share options outstanding account”. The total amount to be recognised is determined by reference to the fair value of the options granted:
including any market performance conditions (e.g. the entity’s share price)
excluding the impact of any service and non-market performance vesting conditions (e.g. profitability, sales growth targets and remaining an employee of the entity over a specified time period), and
including the impact of any non-vesting conditions (e.g. the requirement for employees holdings shares for a specific period of time).
The total expenses are amortised over the vesting period, which is the period over which all of the specified vesting conditions are to be satisfied.
At the end of each period, the entity revises its estimates of the number of options that are expected to vest based on the service and non-market performance vesting conditions. It recognises the impact of the revision to original estimates, if any, in the statement of profit and loss, with a corresponding adjustment to equity. In case vested options forfeited or expires unexercised, the related balance standing to the credit of the “Share options outstanding account” is transferred to “Retained earnings”. In case of equity settled share based payments to employees of subsidiaries, in the separate financial statements, the parent company recognises the impact in the investment in the subsidiaries.
k) Revenue recognition
i) Revenue is measured at the fair value of consideration received or receivable. Revenue is recognised only when it can be reliably measured and it is probable that future economic benefits will flow to the Company.
ii) Revenue from operations includes sale of goods, scrap, export incentives and income from royalty and service charges:
- Revenue from sale of goods is recognised when significant risk and rewards of ownership of the goods have passed to the customer. Amounts disclosed as revenue are inclusive of excise duty (upto 30 June 2017) and net of returns, quality claims, discounts and value added tax/sales tax/goods and service tax (w.e.f. 1 July 2017).
- Income from royalty and service charges is recognised as per the agreement terms.
- Export incentives / benefits are accounted on accrual basis.
iii) Dividend income is recognised when the right to receive the payment is established by the balance sheet date.
iv) Interest income for all debt instruments, measured at amortised cost or fair value through other comprehensive income, is recognised using the effective interest rate method and shown under interest income in the statement of profit and loss.
Notes forming part of the financial statements
82
l) Government grants
i) Grants from the government are recognised at their fair value where there is a reasonable assurance that the grant will be received and the Company will comply with all attached conditions.
ii) Government grants relating to income are deferred and recognised in the statement of profit and loss over the period necessary to match them with the costs that they are intended to compensate and presented within other income.
iii) Government grants relating to the purchase of property, plant and equipment are included in non-current liabilities as deferred income and are credited to the statement of profit and loss on a straight-line basis over the expected lives of the related assets and presented within other income.
m) Inventories
i) Inventories are valued at lower of cost and estimated net realisable value.
ii) Cost of raw materials, packing material and stores and spares are determined on moving average cost method.
iii) Cost of finished goods and goods-in-process includes cost of direct materials, labour and other manufacturing overheads.
n) Foreign currency transactions
i) The functional currency of the Company is Indian rupee (` or INR) which is also the presentation currency. All other currencies are accounted for as foreign currency.
ii) Transactions denominated in foreign currencies are initially recorded in the functional currency at the exchange rate prevailing at the date of transaction.
iii) Monetary items denominated in foreign currencies at the year-end are restated at the closing rates. Non-monetary items which are carried in terms of historical cost denominated in a foreign currency are reported using the exchange rate at the date of transaction.
iv) Exchange differences, in respect of accounting periods commencing on or after 7 December 2006, arising on reporting of long-term foreign currency monetary items which are recognised in the financial statements till the period ending 31 March 2016 at rates different from those at which they were initially recorded or reported in previous Financial Statements, in so far as they relate to the acquisition of a depreciable capital asset, are added to or deducted from the cost of the asset and are depreciated over the balance life of the asset. Any other income or expense on account of exchange difference either on settlement or on translation is recognised in the statement of profit and loss.
o) Income taxes
i) The income tax expense or credit for the period is the tax payable on the current period’s taxable income based on the applicable income tax rate adjusted by changes in deferred tax assets and liabilities attributable to temporary differences and to unused tax losses.
ii) The current tax charge is calculated on the basis of the tax laws enacted or substantively enacted at the end of the reporting period.
iii) Deferred tax is provided in full, using the balance sheet approach, on temporary differences arising between the tax bases of assets and liabilities and their carrying amounts in the financial statements. However, deferred tax liabilities are not recognised if they arise from the initial recognition of goodwill. Deferred tax is also not accounted for if it arises from initial recognition of an asset or liability in a transaction other than a business combination that at the time of the transaction affects neither accounting profit nor taxable profit (tax loss). Deferred tax is determined using tax rates (and laws) that have been enacted or substantively enacted by the end of the reporting period and are expected to apply when the related deferred tax asset is realised or the deferred tax liability is settled.
Notes forming part of the financial statements
83Annual Report 2017-18
iv) Deferred tax assets are recognised for all deductible temporary differences and unused tax losses only if it is probable that future taxable amounts will be available to utilise those temporary differences and losses.
v) Deferred tax assets and liabilities are offset when there is a legally enforceable right to offset current tax assets and liabilities and when the deferred tax balances relate to the same taxation authority. Current tax assets and tax liabilities are offset where the entity has a legally enforceable right to offset and intends either to settle on a net basis, or to realise the asset and settle the liability simultaneously.
vi) Current and deferred tax is recognised in the statement of profit and loss, except to the extent that it relates to items recognised in other comprehensive income or directly in equity. In this case, the tax is also recognised in other comprehensive income or directly in equity, respectively.
vii) Minimum Alternate Tax (MAT) credit is recognised as deferred tax asset only when and to the extent there is convincing evidence that the Company will pay normal income tax during the specified period. Such asset is reviewed at each balance sheet date and the carrying amount of the MAT credit asset is written down to the extent there is no longer a convincing evidence to the effect that the Company will pay normal income tax during the specified period.
p) Leases
Leases where the Company is a lessee and has substantially all the risks and rewards of ownership are classified as finance leases. Finance leases are capitalised at the lease’s inception at the fair value of the leased property or, if lower, the present value of the minimum lease payments. The corresponding rental obligations, net of finance charges, are included in borrowings or other financial liabilities as appropriate. Each lease payment is allocated between the liability and finance cost. The finance cost is charged to the statement of profit and loss over the lease period so as to produce a constant periodic rate of interest on the remaining balance of the liability for each period.
Leases in which a significant portion of the risks and rewards of ownership are not transferred to the Company as lessee are classified as operating leases. Payments made under operating leases (net of any incentives received from the lessor) are charged to the statement of profit and loss on a straight-line basis over the period of the lease unless the payments are structured to increase in line with expected general inflation to compensate for the lessor’s expected inflationary cost increases.
q) Earnings per share
Basic earnings per share are calculated by dividing the net profit or loss (excluding other comprehensive income) for the year attributable to equity shareholders by the weighted average number of equity shares outstanding during the year. The weighted average number of equity shares outstanding during the year is adjusted for events such as bonus issue, bonus element in a right issue, shares split and reserve share splits (consolidation of shares) that have changed the number of equity shares outstanding, without a corresponding change in resources. For the purpose of calculating diluted earnings per share, the net profit or loss (excluding other comprehensive income) for the year attributable to equity share holders and the weighted average number of shares outstanding during the year are adjusted for the effects of all dilutive potential equity shares.
r) Provisions, contingent liabilities and contingent assets
i) Provisions are recognised when there is a present legal or constructive obligation as a result of past events and it is probable that an outflow of resources will be required to settle the obligation and the amount can be reliably estimated. Provisions are not recognised for future operating losses.
Provisions are measured at the present value of management’s best estimate of the expenditure required to settle the present obligation at the end of the reporting period. The discount rate used to determine the present value is a pre-tax rate that reflects current market assessments of the time value of money and the risks specific to the liability. The increase in the provision due to the passage of time is recognised as interest expense.

Notes forming part of the financial statements
84
ii) A contingent liability is a possible obligation that arises from past events whose existence will be confirmed by the occurrence or non-occurrence of one or more uncertain future events beyond the control of the Company or a present obligation that is not recognised because it is not probable that an outflow of resources will be required to settle the obligation or the amount of the obligation cannot be measured with sufficient reliability. The Company does not recognize a contingent liability but discloses its existence in the financial statements.
iii) A contingent asset is a possible asset that arises from past events and whose existence will be confirmed only by the occurrence or non-occurrence of one or more uncertain future events not wholly within the control of the Company. Contingent assets are not recognized, but its existence is disclosed in the financial statements.
s) Business combinations
Business combinations are accounted for using the acquisition method as per Ind AS 103, Business Combinations. The cost of an acquisition is measured at the fair value of the assets transferred, equity instruments issued and liabilities incurred or assumed at the date of acquisition, which is the date on which control is transferred to the Company. The cost of acquisition also includes the fair value of any contingent consideration. Identifiable assets acquired and liabilities and contingent liabilities assumed in a business combination are measured initially at their fair value on the date of acquisition. Business combinations between entities under common control is accounted for at carrying value. Transaction costs that the Company incurs in connection with a business combination such as finder’s fees, legal fees, due diligence fees, and other professional and consulting fees are expensed as incurred.
t) Dividend
Provision is made for the amount of any dividend declared on or before the end of the reporting period but remaining undistributed at the end of the reporting period, where the same has been appropriately authorised and is no longer at the discretion of the Company.
u) Contributed equity
Equity shares are classified as equity. Post transition to Ind AS with effect from 1 April 2015, incremental costs directly attributable to the issue of new shares or options are shown in equity as a deduction, net of tax, from the proceeds.
v) Cash and cash equivalents
i) Cash and cash equivalents in the balance sheet comprise cash at bank and on hand and short-term deposit with original maturity upto three months, which are subject to insignificant risk of changes in value.
ii) For the purpose of presentation in the statement of cash flows, cash and cash equivalents consists of cash and short-term deposit, as defined above, net of outstanding bank overdraft but including other short-term, highly liquid investments with original maturities of three months or less that are readily convertible to known amounts of cash and which are subject to an insignificant risk of changes in value.
w) Exceptional items
Certain occasions, the size, type, or incidences of the item of income or expenses pertaining to the ordinary activities of the Company is such that its disclosure improves the understanding of the performance of the Company, such income or expenses is classified as an exceptional item and accordingly, disclosed in the financial statements.
3 (B) Recent accounting pronouncements
In March 2018, the Ministry of Corporate Affairs issued the Companies (Indian Accounting Standards) Amendment Rules, 2018, notifying Indian Accounting Standard (Ind AS) 115 “Revenue from Contracts with Customers”; notifying amendments to Ind AS 12 “Income Taxes” and Ind AS 21 “The Effects of Changes in Foreign Exchange Rates”. Ind AS 115, amendments to the Ind AS 12 and Ind AS 21 are applicable to the Company w.e.f. 1 April 2018.

Notes forming part of the financial statements
85Annual Report 2017-18
i) Ind AS 115 “Revenue from Contracts with Customers”
The core principle of Ind AS 115 is that an entity should recognize revenue to depict the transfer of promised goods or services to customers in an amount that reflects the consideration to which the entity expects to be entitled in exchange for those goods or services. Further this standard requires enhanced disclosures about the nature, amount, timing and uncertainty of revenue and cash flows arising from the entity’s contracts with customers. The standard permits two possible methods of transition:a) Retrospective approach - Under this approach the standard will be applied retrospectively to each prior reporting period presented in accordance with Ind AS 8 - “Accounting Policies, Changes in Accounting Estimates and Errors”. b) Retrospectively with cumulative effect of initially applying the standard recognised at the date of initial application (Cumulative catch - up approach). The Company will adopt the standard on 1 April 2018 by using the cumulative catch-up transition method and accordingly comparatives for the year ending or ended 31 March 2018 will not be retrospectively adjusted. The effect on adoption of Ind AS 115 is expected to be insignificant.
ii) Amendments to Ind AS
a) Ind AS 12 “Income Taxes”
The amendment considers that tax law determines which deductions are offset against taxable income and that no deferred tax asset is recognised if the reversal of the deductible temporary difference will not lead to tax deductions.
Accordingly, segregating deductible temporary differences in accordance with tax law and assessing them on entity basis or on the basis of type of income is necessary to determine whether taxable profits are sufficient to utilise deductible temporary differences.
b) IndAS21“TheEffectsofChangesinForeignExchangeRates”
The amendment to this Ind AS requires foreign currency consideration paid or received in advance of an item of asset, expense or income, resulting in recognition of a non-monetary prepayment asset or deferred income liability, to be recorded in the Company’s functional currency by applying the spot exchange rate on the date of transaction.
The date of transaction which is required to determine the spot exchange rate for translation of such items would be earlier of:
- the date of initial recognition of the non-monetary prepayment asset or deferred income liability, and
- the date on which the related item of asset, expense or income is recognised in the financial statements.
If the transaction is recognised in stages, then a spot exchange rate for each transaction date would be applied to translate each part of the transaction.
The Company has evaluated the impact of the above amendments on the financial statements and the impact is not material.
3 (C) Significantestimates,judgementsandassumptions
The preparation of financial statements in conformity with Ind AS requires the management to make estimates, assumptions and exercise judgement in applying the accounting policies that affect the reported amount of assets, liabilities and disclosure of contingent liabilities at the date of financial statements and the reported amounts of income and expenses during the year.
The Management believes that these estimates are prudent and reasonable and are based on the Management’s best knowledge of current events and actions. Actual results could differ from these estimates and differences between actual results and estimates are recognised in the periods in which the results are known or materialised.
This note provides an overview of the areas that involves a higher degree of judgement or complexity, and of items which are more likely to be materially adjusted due to estimates and assumptions turning out to be different than those originally assessed.
Notes forming part of the financial statements
86
i) Definedbenefitobligation
The cost of post-employment and other long term benefits is determined using actuarial valuations. An actuarial valuation involves making various assumptions that may differ from actual developments in the future. These include determination of discount rates, expected rate of return on assets, future salary increases and mortality rates. Due to the complexities involved in the valuation and its long term nature, a defined benefit obligation is highly sensitive to changes in these assumptions. All assumptions are reviewed at each reporting date. The assumptions used are disclosed in note 44.
ii) Fairvalueoffinancialinstruments
The fair value of financial instruments that are not traded in an active market is determined using valuation techniques. In applying the valuation techniques, management makes maximum use of market inputs and uses estimates and assumptions that are, as far as possible, consistent with observable data that market participants would use in pricing the instrument. Where applicable data is not observable, management uses its best estimate about the assumptions that market participants would make. These estimates may vary from the actual prices that would be achieved in an arm’s length transaction at the reporting date. For details of the key assumptions used and the impact of changes to these assumptions refer note 40.
iii) Share-based payments
Estimating fair value for share-based payment requires determination of the most appropriate valuation model. The estimate also requires determination of the most appropriate inputs to the valuation model including the expected life of the option, volatility and dividend yield and making assumptions about them. The assumptions and models used for estimating fair value for share-based payment transactions are disclosed in note 43.
iv) Impairmentofnon-financialassets
Impairment exists when the carrying value of an asset or cash generating unit (CGU) exceeds its recoverable amount, which is the higher of its fair value less costs of disposal and its value in use. The fair value less costs of disposal calculation is based on available data from binding sales transactions, conducted at arm’s length, for similar assets or observable market prices less incremental costs for disposing of the asset. The value in use calculation is based on a DCF model. The cash flows are derived from the budget for the future years and do not include restructuring activities that the Company is not yet committed to or significant future investments that will enhance the asset’s performance of the CGU being tested. The recoverable amount is sensitive to the discount rate used for the DCF model as well as the expected future cash-inflows and the growth rate.
v) Impairmentoffinancialassets
The impairment provisions for financial assets disclosed are based on assumptions about risk of default and expected loss rates. The Company uses judgement in making these assumptions and selecting the inputs to the impairment calculation, based on the Company’s past history, existing market conditions as well as forward looking estimates at the end of each reporting period.
vi) Taxes
The Company periodically assesses its liabilities and contingencies related to income taxes for all years open to scrutiny based on latest information available. The Company records its best estimates of the tax liability in the current tax provision. The management believes that they have adequately provided for the probable outcome of these matters.
Deferred tax assets are recognised for unused tax losses to the extent that it is probable that taxable profit will be available against which the losses can be utilised. Significant management judgement is required to determine the amount of deferred tax assets that can be recognised, based upon the likely timing and the level of future taxable profits.

Notes forming part of the financial statements
87Annual Report 2017-18
4
Prop
erty
, pla
nt a
nd e
quip
men
t
(` In
lakh
s)
Des
crip
tion
of a
sset
s G
ross
car
ryin
g am
ount
D
epre
ciat
ion
Net
car
ryin
g am
ount
A
s at
1
Apr
il 20
17
Add
itio
ns
Dis
posa
ls
As
at 3
1 M
arch
20
18
Upt
o 31
M
arch
20
17
For
the
year
D
ispo
sals
U
pto
31
Mar
ch
2018
As
at 3
1 M
arch
20
18
As
at 3
1 M
arch
20
17
Free
hold
land
5
17
- -
517
-
- -
- 5
17
517
Le
aseh
old
land
1
5 -
- 1
5 -
- -
- 1
5 1
5 Le
aseh
old
impr
ovem
ents
5
86
247
-
833
4
2 8
1 -
123
7
10
544
Build
ings
4
,046
6
03
87
4,5
62
455
2
12
5
662
3
,900
3
,591
Pl
ant
and
mac
hine
ry
- O
wne
d 3
5,47
6 4
,505
2
6 3
9,95
5 8
,919
5
,638
9
1
4,54
8 2
5,40
7 2
6,55
7 -
Leas
ed
1,9
14
- -
1,9
14
568
2
84
- 8
52
1,0
62
1,3
46
Equi
pmen
ts
- O
wne
d 2
,066
3
56
2
2,4
20
399
2
95
1
693
1
,727
1
,667
-
Leas
ed
103
-
- 1
03
46
23
- 6
9 3
4 5
7 Fu
rnitu
re a
nd fi
xtur
es
1,0
50
45
1
1,0
94
185
1
22
1
306
7
88
865
TO
TAL(
A)
45,
773
5,7
56
116
5
1,41
3 1
0,61
4 6
,655
1
6 1
7,25
3 3
4,16
0 3
5,15
9 Ca
pita
l wor
k-in
-pr
ogre
ss
1,7
23
1,5
32
5
Inta
ngib
le a
sset
s
(`
In la
khs)
Des
crip
tion
of a
sset
s G
ross
car
ryin
g am
ount
Am
orti
sati
on N
et c
arry
ing
amou
ntA
s at
1
Apr
il 20
17
Add
itio
nsD
ispo
sals
As
at 3
1 M
arch
20
18
Upt
o 31
M
arch
20
17
For
the
year
Dis
posa
lsU
pto
31
Mar
ch
2018
As
at 3
1 M
arch
20
18
As
at 3
1 M
arch
20
17So
ftw
are
764
45
- 8
09 3
94 2
03 -
597
212
370
Pate
nts
81
- -
81
9 8
- 1
7 6
4 7
2TO
TAL(
B) 8
45 4
5 -
890
403
211
- 6
14 2
76 4
42
TOTA
L(A
+B)
46,
618
5,8
01 1
16 5
2,30
3 1
1,01
76,
866
16
17,
868
34,
436
35,
601
Inta
ngib
le a
sset
s un
der
deve
lopm
ent
961
789
Not
es:
(i)
Build
ings
incl
ude
road
s, r
esid
entia
l flat
s, tu
bew
ell,
wat
erta
nks
and
shar
e in
co-
oper
ativ
e so
ciet
y.
(ii)
Addi
tions
to p
lant
and
mac
hine
ry a
nd c
apita
l wor
k in
pro
gres
s in
clud
es e
xcha
nge
diff
eren
ce o
f ` 1
98 la
khs
capi
talis
ed d
urin
g fin
anci
al y
ear
2017
-18.
(iii)
For
det
ails
of p
rope
rty,
pla
nt a
nd e
quip
men
t ple
dged
as
secu
rity
, ref
er n
ote
46.

Notes forming part of the financial statements
88
4
Prop
erty
, pla
nt a
nd e
quip
men
t
(` In
lakh
s)
Des
crip
tion
of a
sset
s G
ross
car
ryin
g am
ount
D
epre
ciat
ion
Net
car
ryin
g am
ount
As
at
1 A
pril
2016
Add
itio
ns
Dis
posa
ls
As
at 3
1 M
arch
20
17
Upt
o 31
M
arch
20
16
For
the
ye
ar
D
ispo
sals
U
pto
31
Mar
ch
2017
As
at 3
1 M
arch
20
17
Free
hold
land
5
17
- -
517
-
- -
- 5
17
Leas
ehol
d la
nd
15
- -
15
- -
- -
15
Leas
ehol
d im
prov
emen
ts
1
585
-
586
-
42
- 4
2 5
44
Build
ings
4
,002
4
4 -
4,0
46
224
2
31
- 4
55
3,5
91
Plan
t an
d m
achi
nery
-
- O
wne
d 2
8,61
3 7
,135
2
72
35,
476
4,0
90
4,8
88
59
8,9
19
26,
557
- Le
ased
1
,914
-
- 1
,914
2
84
284
-
568
1
,346
Eq
uipm
ents
-
Ow
ned
894
1
,173
1
2
,066
1
76
224
0
3
99
1,6
67
- Le
ased
1
03
- -
103
2
3 2
3 -
46
57
Furn
iture
and
fixt
ures
4
47
603
-
1,0
50
60
125
-
185
8
65
TOTA
L(A
) 3
6,50
6 9
,540
2
73
45,
773
4,8
57
5,8
17
59
10,
614
35,
159
Capi
tal w
ork-
in-p
rogr
ess
1,5
32
5
Inta
ngib
le a
sset
s
(` In
lakh
s)
Des
crip
tion
of a
sset
s G
ross
car
ryin
g am
ount
Am
orti
sati
on N
et c
arry
ing
amou
ntA
s at
1
Apr
il 20
16
Add
itio
ns
Dis
posa
ls
As
at 3
1 M
arch
20
17
Upt
o 31
M
arch
20
16
For
the
year
D
ispo
sals
U
pto
31
Mar
ch
2017
As
at 3
1 M
arch
20
17
Sof
twar
e 6
19
145
-
764
1
97
197
-
394
3
70
Pate
nts
42
39
- 8
1 2
7
-
9
72
TO
TAL(
B)
661
1
84
- 8
45
199
2
04
- 4
03
442
TOTA
L(A
+B)
37,
167
9,7
24
273
4
6,61
8 5
,056
6,
021
59
11,
017
35,
601
Inta
ngib
le a
sset
s un
der
deve
lopm
ent
789
Not
es:
(i)
Build
ings
incl
ude
road
s, r
esid
entia
l flat
s, tu
bew
ell,
wat
erta
nks
and
shar
e in
co-
oper
ativ
e so
ciet
y.
(ii)
Addi
tions
to p
lant
and
mac
hine
ry a
nd c
apita
l wor
k in
pro
gres
s in
clud
es e
xcha
nge
diff
eren
ce o
f ` 3
34 la
khs
capi
talis
ed d
urin
g fin
anci
al y
ear
2016
-17.
(iii)
For
det
ails
of p
rope
rty,
pla
nt a
nd e
quip
men
t ple
dged
as
secu
rity
, ref
er n
ote
46.

Notes forming part of the financial statements
89Annual Report 2017-18
( ` In lakhs)2018 2017
6 Non-current investments (At cost)(A) Investments in equity shares of wholly owned subsidiaries -
Unquoted 830,000 (31 March 2017: 830,000) of US$ 10 each of Lamitube
Technologies Limited, Mauritius 8,994 8,994
1,261 (31 March 2017: 1,261) of no par value of Arista Tubes Inc., USA* 7,443 7,443 1,600 (31 March 2017: 1,600) of US$ 1000 each of Lamitube Technologies
(Cyprus) Limited, Cyprus 720 720
17,157 17,157 (B) Investments in preference shares of wholly owned subsidiaries -
Unquoted 10,400 (31 March 2017: 10,400) Non-cumulative optionally convertible
redeemable preference shares of US$ 1000 each of Lamitube Technologies (Cyprus) Limited, Cyprus with fixed rate of dividend of US$ 110 per share
4,535 4,535
4,535 4,535
(C) Value of stock options granted to employees of subsidiaries As per last balance sheet 368 346 Add/(Less): Options granted / (forfeited) during the year (Refer note 43) (166) 22
202 368
Total (A + B + C) 21,894 22,060
Aggregate book value of unquoted investments 21,894 22,060 Aggregate amount of impairment in value of investment - -
(All the above securities are fully paid up)* 7.35% is held through Lamitube Technologies (Cyprus) Limited
( ` In lakhs)2018 2017
7 Non-currentfinancialassets-Loans (Unsecured, considered good) Security deposits - Related parties (Refer note 54) 471 1,610 - Others 92 79 Loans and advances to employees 8 8 Total 571 1,697
Security deposits are interest free non-derivative financial assets carried at amortised cost. These primarily include deposits given against rented premises and various deposits with government authorities. The carrying value may be affected by changes in the credit risk of the counterparties.

Notes forming part of the financial statements
90
( ` In lakhs)2018 2017
8 Othernon-currentfinancialassetsDeposits with banks having original maturity period of more than twelve months* (Refer note 14)
20 29
Total 20 29
* Deposited with / lien in favour of various Government authorities / banks.
( ` In lakhs)2018 2017
9 Non-current tax assetsBalances with government authorities - Direct tax (net of provisions) 523 458 Total 523 458
( ` In lakhs)2018 2017
10 Other non-current assetsCapital advances 1,551 999 Prepaid expenses 398 319 Balances with Government authorities - Indirect tax 462 415 Total 2,411 1,733
( ` In lakhs)2018 2017
11 InventoriesRaw materials (Including goods-in-transit 31 March 2018: ` 576 lakhs, 31 March 2017: ` 194 lakhs)
3,087 2,250
Goods-in-process 2,861 2,695 Finished goods (Including goods-in-transit 31 March 2018: ` 248 lakhs, 31 March 2017: ` 64 lakhs)
248 64
Stores and spares 2,029 1,586 Packing materials 80 78 Total 8,305 6,673
Inventories were written down to net realisable value by ` 40 lakhs (31 March 2017 ` 78 lakhs). This amount is recognised as an expense during the year and included in “Changes in inventories of finished goods and goods-in-process” in the statement of profit and loss.

Notes forming part of the financial statements
91Annual Report 2017-18
( ` In lakhs)2018 2017
12 Trade receivables (Unsecured)Considered good- Related parties (Refer note 54) 470 481 - Others 12,443 9,895 Considered doubtful - Others 553 551
13,466 10,927 Less: Allowance for bad and doubtful debts (553) (551)Total 12,913 10,376
Trade receivables are non-interest bearing and credit terms are generally 30 to 90 days. The Company’s exposure to credit and currency risks related to trade receivables is disclosed in note 41.
( ` In lakhs)2018 2017
13 Cash and cash equivalentsBalance with banks in Current accounts 364 33 Cheques on hand/ Remittances in transit 353 8 Total 717 41
( ` In lakhs)2018 2017
14 Bank balances other than cash and cash equivalentsUnclaimed dividend accounts 87 73 Deposits with bank having original maturity period of more than twelve months*
32 33
Less: Disclosed under "Other non-current financial assets" (Refer note 8) (20) (29)Total 99 77
* Deposited with / lien in favour of various Government authorities / banks.
( ` In lakhs)2018 2017
15 Currentfinancialassets-LoansUnsecured, considered goodSecurity deposits - Others 447 433 Loans and advances to - Related party (Refer note 54) 10,629 10,674 - Employees 46 32 Total 11,122 11,139

Notes forming part of the financial statements
92
( ` In lakhs)2018 2017
16 OthercurrentfinancialassetsInsurance claim receivable (Refer note 48) 193 193 Derivative instruments at fair value through profit or loss - Foreign exchange forward contracts 38 2 Other receivables from - Subsidiaries (Refer note 54) 234 176 - Others 5 5 Total 470 376
( ` In lakhs)2018 2017
17 Current tax assetsBalances with government authorities - Direct tax (net of provisions) - 151 Total - 151
( ` In lakhs)2018 2017
18 Other current assetsAdvances against goods and services 514 93 Prepaid expenses 314 368 Balances with government authorities - Indirect tax (net) 1,962 2,485 Export benefits receivable 64 44 Total 2,854 2,990
( ` In lakhs)2018 2017
19 Equity share capitalAuthorised250,050,000 (31 March 2017: 250,050,000) equity shares of ` 2 each 5,001 5,001
Issued157,238,784 (31 March 2017: 157,158,618) equity shares of ` 2 each 3,145 3,143 Subscribed and paid up157,181,664 (31 March 2017: 157,101,498) equity shares of ` 2 each fully paid up (Refer note (a) below)
3,144 3,142
Add: 57,120 equity shares of ` 2 each forfeited (Refer note (h) below) 1 1 Total 3,145 3,143

Notes forming part of the financial statements
93Annual Report 2017-18
a) Reconciliation of number of shares outstanding (excluding forfeited shares)2018 2017
Number of equity shares (` in lakhs) Number of
equity shares (` in lakhs)
At the beginning of the year 157,101,498 3,142 157,044,165 3,141 Add/(less): Changes during the year Allotted pursuant to the scheme of amalgamation (Refer note 58)
- 88,917,843 1,778
Cancelled pursuant to the scheme of amalgamation (Refer note 58)
- - (88,917,843) (1,778)
Alloted on exercise of employee share options 80,166 2 57,333 1 Outstanding at the end of the year 157,181,664 3,144 157,101,498 3,142
b) Terms/ rights attached to equity shares
The Company has only one class of equity shares having a par value of ` 2 per share. Each holder of equity shares is entitled to one vote per share. The Company declares and pays dividend in Indian rupees. The final dividend proposed by the Board of Directors is subject to the approval of the shareholders in the ensuing Annual General Meeting.
In the event of liquidation of the Company, the holders of the equity shares will be entitled to receive remaining assets of the Company, after distribution of preferential amount. The distribution will be in proportion to the number of equity shares held by the shareholders.
c) Details of shares held by holding company and ultimate holding company
Name of Shareholder 2018 2017Number of
equity sharesPercentage of holding
Number of equity shares
Percentage of holding
Whitehills Advisory Services Private Limited (Holding company)*
- - - -
Rupee Finance and Management Private Limited (Ultimate holding company)*
- - - -
* During the previous year, all the shares held by Whitehills Advisory Services Private Limited have been transferred to Ashok Goel Trust pursuant to a scheme of amalgamation (Refer note 58). As such, there is no holding company or ultimate holding Company w.e.f. 6 October 2016.
d) Details of shareholder holding more than 5% equity shares
Name of Shareholder 2018 2017Number of
equity sharesPercentage of holding
Number of equity shares
Percentage of holding
Whitehills Advisory Services Private Limited (Holding company)*
- - - -
Ashok Kumar Goel (Trustee - Ashok Goel Trust)* 89,339,014 56.84% 89,139,014 56.72%* During the previous year, all the shares held by Whitehills Advisory Services Private Limited have been transferred to Ashok Goel Trust pursuant to a scheme of amalgamation (Refer note 58). As such, there is no holding company w.e.f. 6 October 2016.

Notes forming part of the financial statements
94
e) No bonus shares have been issued and no shares bought back during five years preceding 31 March 2018.
f) For details of shares reserved for issue under the employee share based payment plan of the Company (Refer note 43).
g) 500,155 equity shares of ` 2 each fully paid up were allotted on 14 September 2012 for consideration other than cash, pursuant to the Scheme of Merger of Ras Propack Lamipack Limited and Ras Extrusions Limited with the Company.
h) Forfeited shares consist of 35,725 partly paid up equity shares and 21,395 fully paid up bonus shares forfeited during earlier year. The amount of ` 1 Lakh in relation to the forfeiture will be transferred to reserves upon cancellation of these shares.
(` In lakhs)2018 2017
20 Other equitya) Capital reserve
As per last balance sheet 3,983 3,983 Add/(less): Pursuant to the scheme of amalgamation (Refer note 58) - 996 Expenses incurred in connection with the scheme of amalgamation (Refer note 58)
- (996)
3,983 3,983 b) Securities premium reserve
As per last balance sheet 10,987 10,893 Add: Amount received during the year on exercise of options 96 69 Transferred from share options outstanding account on
exercise of options 35 25
11,118 10,987 c) Other reservesi) Debenture redemption reserve
As per last balance sheet 2,250 1,500 Add: Transferred from retained earnings - 750
2,250 2,250
ii) Share options outstanding account (Refer note 43)As per last balance sheet 725 722 Add/(less): Share based payment expense / (credit) (net) (176) 6 Options granted /(forfeited) to employees of subsidiaries (166) 22 Transferred to retained earnings on forfeiture of vested options (15) - Transferred to securities premium on exercise of options (35) (25)
333 725 iii) General reserve
As per last balance sheet 12,541 12,541

Notes forming part of the financial statements
95Annual Report 2017-18
(` In lakhs)2018 2017
iv) Retained earningsAs per last balance sheet 28,580 27,057 Add/(Less): Taken over pursuant to the scheme of amalgamation (Refer note 58) - 39 Profit for the year 8,118 6,511 Item of other comprehensive income recognised directly in retained earnings - Remeasurement gains/(losses) on defined benefit plan (net of
tax) (74) (119)
Debenture redemption reserve - (750)Transferred from share options outstanding account on forfeiture of vested options
15 -
Equity dividend paid (3,770) (3,455)Tax on equity dividend paid (768) (703)
32,101 28,580 Total 62,326 59,066
Nature and purpose of reserves
i) Capital reserve
Capital reserve represents capital surplus and not normally available for distribution as dividend.
ii) Securities premium
Securities premium is used to record the premium received on issue of shares. The reserve is utilised in accordance with the provisions of the Companies Act, 2013.
iii) Debenture redemption reserve (DRR)
The Company had issued redeemable non-convertible debentures and accordingly DRR is required to be created pursuant to the Companies (Share capital and Debentures) Rules 2014. DRR is required to be created, out of profits of the Company available for payment of dividend, upto an amount which is equal to 25% of the total value of the debentures issued.
iv) Share options outstanding account
Represent the fair value at respective grant dates of options granted and outstanding for vesting/exercise, under Essel Employee Stock Option Scheme 2014. This balance will be transferred to share capital and security premium account as and when the options get exercised from time to time or to retained earnings in the event of forfeiture, non-vesting or lapse.
v) General reserve
The reserve is a distributable reserve maintained by the Company out of transfers made from annual profits.
vi) Retained earnings
Retained earnings represent the accumulated earnings net of losses, if any, made by the Company over the years.

Notes forming part of the financial statements
96
vii) Other comprehensive income
Other comprehensive income comprises of re-measurement gains/(losses) of defined benefit obligations.
(` in lakhs)2018 2017
21 Non-current borrowings Secured 400 (900) units of redeemable non-convertible debentures of face value of ` 1,000,000 each (Refer note (a) below)
4,013 8,969
Buyers credit from banks (Refer note (b) below) - 2,512 Finance Lease Obligations (Refer note (c) below ) 183 526
4,196 12,007 Unsecured 500 (Nil) units of redeemable non-convertible debentures of face value of ` 1,000,000 each (Refer note (d) below)
5,099 -
Buyers credit from banks (Refer note (e) below) 3,433 4,396 Deferred sales tax loan (Refer note (f) below) 879 1,139
9,411 5,535 Total 13,607 17,542 Less: Current maturities disclosed under Other current financial liabilities (Refer note 25)
6,345 2,497
Total 7,262 15,045
Nature of security and terms of repayments for long-term borrowings
a) Listed redeemable non-convertible debentures Series (A) of ` Nil (31 March 2017: ` 4,983 lakhs) and Series (B) of ` 4,013 lakhs (31 March 2017: ` 3,986 lakhs) are secured by pari passu first charge on all fixed assets of the Company (except all fixed assets situated at chakan and land and building situated at Goa and Murbad). These debentures are further secured by way of security provided by a related party*.
These debentures carry interest rate at SBI Base Rate + 145 bps p.a. and are redeemable at par in 3 annual instalments commencing from 25 April 2019 in the ratio of 30:30:40 with a put/call option at the end of 3 years from date of issue in case of Series (A) and 3 1/2 years from the date of issue in case of Series (B), and on each anniversary thereafter until redemption, and put option in the event of downgrade of credit rating to BBB+ or below. Series (A) debentures are redeemed during the year exercising the call option in accordance with the terms of the issue. Further in case of Series (B) debentures the call option has been exercised during the year.
b) Buyers credit from banks of ` Nil (31 March 2017: ` 2,512 lakhs) are secured by pari passu first charge on all fixed assets of the Company (except all fixed assets situated at chakan). These buyers credit from banks are further secured by way of security provided by a related party*.
Buyers credit from banks are fully repaid during the year.
c) Finance lease obligations are secured by related leased assets.
Leases carry interest rate ranging from 12.36% to 13.50% p.a and are repayable in monthly installments.

Notes forming part of the financial statements
97Annual Report 2017-18
d) Listed redeemable non-convertible debentures of ` 5,099 lakhs (31 March 2017: ` Nil) are unsecured.
These debentures carry interest rate at 1 year Treasury Bill YTM rate + 145 bps p.a. payable annually and are redeemable at par at the end of 3 years from the date of issue. The interest is reset at each anniversary of the issue.
e) Buyers credit from banks ` 2,281 lakhs (31 March 2017: ` 2,284 lakhs) are against security provided and guarantee issued by a related party and ` 1,152 lakhs (31 March 2017: ` 2,112 lakhs) are against security provided by a related party*.
Buyers credit from banks carry interest rate ranging from 0.20% to 2.10% p.a. based on prevailing benchmark rates and are repayable in maximum period of three years from the date of transaction.
f) Deferred sales tax interest free loans are repayable after a period of 10 to 14 years from the date of loan upto 2024-25.
*Related party i.e. Aqualand (India) Limited
(` in lakhs)2018 2017
22 Non-current provisionsEmployee benefits 1,300 1,208 Provision for contingency 585 598 Total 1,885 1,806
(` in lakhs)2018 2017
23 Currentfinancialliabilities-BorrowingsSecured (Refer note below)Working capital loan from banks 2,738 701 Buyers credit from banks - 1,040
2,738 1,741
UnsecuredWorking capital loan from banks - 54 Commercial Paper 2,961 -
2,961 54 Total 5,699 1,795
Short-term borrowings of ` 2,738 lakhs (31 March 2017: ` 1,741 lakhs) are secured by first pari-passu charge on current assets and second pari-passu charge on all fixed assets of the company (except all fixed assets situated at chakan).
(` in lakhs)2018 2017
24 Trade payablesAcceptances 2,179 2,183 Others (for Micro, Small and Medium Enterprises - Refer note 53) 3,229 2,498 Total 5,408 4,681

Notes forming part of the financial statements
98
(` in lakhs)2018 2017
25 OthercurrentfinancialliabilitiesCurrent maturities of long-term borrowings (Refer note 21) 6,162 2,152 Current maturities of long-term finance lease obligations (Refer note 21) 183 345 Unclaimed dividend (Refer note 55) 87 73 Payable for capital goods 269 266 Employee benefits payable 1,284 1,322 Derivative instruments at fair value through profit or loss- Foreign exchange forward contracts - 423 Other payables 2,827 2,291 Total 10,812 6,872
(` in lakhs)2018 2017
26 Other current liabilitiesTrade advances 124 44 Statutory dues 294 455 Total 418 499
(` in lakhs)2018 2017
27 Current provisionsEmployee benefits 431 421 Total 431 421
(` in lakhs)2018 2017
28 Current tax liabilitiesDirect tax payable (net) 378 490 Total 378 490
(` in lakhs)2018 2017
29 Revenue from operations (Refer note 59)Sales of products 81,504 84,673 Other operating revenuesRoyalty/Service charges 3,011 2,765 Sale of scrap 391 473 Export and other incentives 319 194 Total 85,225 88,105

Notes forming part of the financial statements
99Annual Report 2017-18
(` in lakhs)2018 2017
30 Other incomeInterest on income tax refund 323 - Net gain on disposal of property, plant and equipment 197 38 Gain on sale of current investments 7 3 Miscellaneous income 433 459Total 960 500
(` in lakhs)2018 2017
31 Interest incomeInterest income on financial assets at amortised cost- Loans 1,136 1,258 - Deposits 19 22 Unwinding of discount on security deposits 89 183 Total 1,244 1,463
(` in lakhs)2018 2017
32 Cost of materials consumedInventory at the beginning of the year 2,250 2,151 Add: Purchases (net) 37,435 35,510
39,685 37,661 Less: Inventory at the end of the year 3,087 2,250 Total 36,598 35,411
(` in lakhs)2018 2017
33 Changesininventoriesoffinishedgoodsandgoods-in-processInventory at the end of the year Goods-in-process 2,861 2,695 Finished goods 248 64
3,109 2,759 Inventory at the beginning of the year Goods-in-process 2,695 2,868 Finished goods 64 31
2,759 2,899 Total (350) 140

Notes forming part of the financial statements
100
(` in lakhs)2018 2017
34 EmployeebenefitsexpenseSalaries, wages and bonus 7,470 7,203 Contribution to provident and other funds 433 401 Gratuity 84 66 Share based payment (credit)/expense (net) (Refer note 43) (176) 6 Staff welfare expenses 759 706 Total 8,570 8,382
(` in lakhs)2018 2017
35 Finance costsInterest expense- Borrowings 1,328 1,354 - Defined benefit obligation 76 59 - Others 7 16 Exchange differences regarded as an adjustment to borrowing costs 111 180 Other borrowing costs 618 713 Total 2,140 2,322
(` in lakhs)2018 2017
36 Depreciation and amortisation expenseDepreciation on property, plant and equipment 6,655 5,817 Amortisation of intangible assets 211 204 Total 6,866 6,021

Notes forming part of the financial statements
101Annual Report 2017-18
(` in lakhs)2018 2017
37 Other expensesStores and spares 2,236 2,350 Packing materials 2,534 2,345 Power and fuel 3,729 3,947 Job work / labour charges 2,710 2,834 Other manufacturing expenses 196 234 Lease rent- Factory premises 623 775 - Plant and equipment 850 964 Repairs and maintenance- Buildings 61 60 - Plant and machinery 472 572 - Others 159 148 Rent 644 553 Rates and taxes 125 123 Insurance 71 95 Directors' sitting fees 7 9 Travelling and conveyance expenses 254 318 Professional and consultancy charges 622 675 Communication charges 95 116 Exchange differences (net) 88 117 Payment to auditors (Refer details below) 35 58 Corporate social responsibility (Refer note 56) 78 42 Freight and forwarding expenses 1,662 1,676 Bad and doubtful debts (net of provision) 187 60 Miscellaneous expenses 1,745 1,729 Total 19,183 19,800 Payment to auditors for:Audit fees 21 27 Tax audit - 4 Tax representations and others - 12 Certifications (including fees for limited reviews) 14 13 Reimbursement of expenses 0 2 Total 35 58
2018 201738 Earnings per share
Profit after tax (` in lakhs) 8,118 6,511 Weighted average number of basic equity shares (Nos.) 15,71,48,280 15,70,53,275 Weighted average number of diluted equity shares (Nos.) 15,74,15,373 15,75,40,510 Nominal value of equity shares (`) 2.00 2.00 Basic earnings per share (`) 5.17 4.15 Diluted earnings per share (`) 5.16 4.13
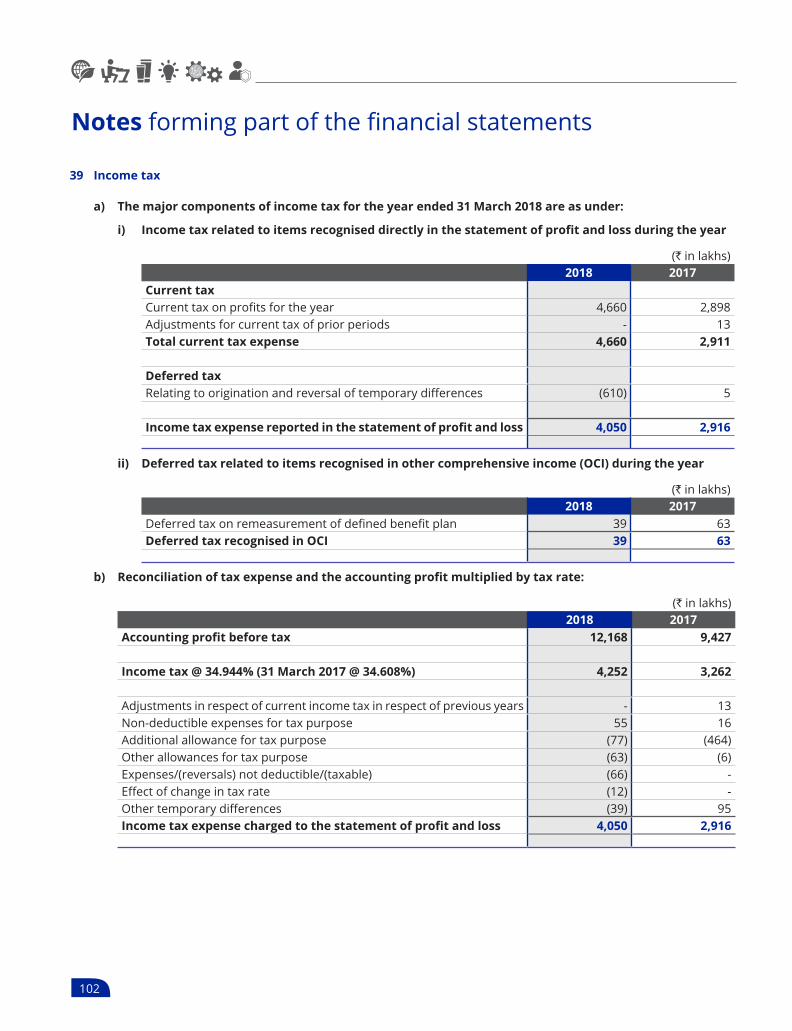
Notes forming part of the financial statements
102
39 Income tax
a) The major components of income tax for the year ended 31 March 2018 are as under:
i) Incometaxrelatedtoitemsrecogniseddirectlyinthestatementofprofitandlossduringtheyear
(` in lakhs)2018 2017
Current taxCurrent tax on profits for the year 4,660 2,898 Adjustments for current tax of prior periods - 13 Total current tax expense 4,660 2,911
Deferred taxRelating to origination and reversal of temporary differences (610) 5
Incometaxexpensereportedinthestatementofprofitandloss 4,050 2,916
ii) Deferred tax related to items recognised in other comprehensive income (OCI) during the year
(` in lakhs)2018 2017
Deferred tax on remeasurement of defined benefit plan 39 63 Deferred tax recognised in OCI 39 63
b) Reconciliationoftaxexpenseandtheaccountingprofitmultipliedbytaxrate:
(` in lakhs)2018 2017
Accountingprofitbeforetax 12,168 9,427
Income tax @ 34.944% (31 March 2017 @ 34.608%) 4,252 3,262
Adjustments in respect of current income tax in respect of previous years - 13 Non-deductible expenses for tax purpose 55 16 Additional allowance for tax purpose (77) (464)Other allowances for tax purpose (63) (6)Expenses/(reversals) not deductible/(taxable) (66) - Effect of change in tax rate (12) - Other temporary differences (39) 95 Incometaxexpensechargedtothestatementofprofitandloss 4,050 2,916

Notes forming part of the financial statements
103Annual Report 2017-18
c) Deferred tax relates to the following:
(` in lakhs)
Balance sheetRecognised in the statementofprofit
and lossRecognised in OCI
2018 2017 2018 2017 2018 2017a)TaxabletemporarydifferencesDepreciation on property, plant, equipment and intangible assets
2,174 2,699 (525) 108 - -
Unamortised ancillary borrowing costs 10 33 (23) (9) - - Total (a) 2,184 2,732 (548) 99 - - b)DeductibletemporarydifferencesEmployee benefits / expenses allowable on payment basis
637 589 (9) (59) (39) (63)
Allowance for bad and doubtful debts 193 191 (2) (4) - - Other deductible temporary differences 99 48 (51) (31) - - Total (b) 929 828 (62) (94) (39) (63)
Net deferred tax (assets)/liabilities (a-b) 1,255 1,904 Deferred tax charge/(credit) (a+b) (610) 5 (39) (63)
d) The Company has brought forward long term capital losses of ` 2,714 lakhs (31 March 2017 ` 2,714 lakhs) that are available for offsetting for eight years against future taxable long term capital gains till FY 2023-2024. Deferred tax assets of ` 632 lakhs (31 March 2017 ` 615 lakhs) have not been recognised in respect of these losses in view of uncertainty of future taxable long term capital gains.
40 Fair value measurements i) Financial instruments by category:
(` in lakhs)2018 2017
FVTPL Amortised cost FVTPL Amortised costFinancial assets (other than investment in subsidiaries)Non current assetsLoans - 571 - 1,697 Current assets Trade receivables - 12,913 - 10,376 Cash and bank balances* - 836 - 147 Loans - 11,122 - 11,139 Derivative instruments 38 - 2 - Other financial assets - 433 - 374 Totalfinancialassets 38 25,875 2 23,733 Financial liabilities Non-current liabilities Borrowings - 7,262 - 15,045 Current liabilities Borrowings - 5,699 - 1,795 Trade payables - 5,408 - 4,681 Derivative instruments - - 423 - Other financial liabilities - 10,812 - 6,449 Totalfinancialliabilities - 29,181 423 27,970
* Including deposits with banks having original maturity period of more than twelve months of ` 20 lakhs (31 March 2017 ` 29 lakhs) shown under other non-current financial assets.

Notes forming part of the financial statements
104
ii) Fair value hierarchy
The fair values of the financial assets and liabilities are the amount that would be received to sell an asset or paid to transfer a liability in an orderly transaction between market participants at the measurement date. This section explains the judgements and estimates made in determining the fair values of the financial instruments that are (a) recognised and measured at fair value and (b) measured at amortised cost and for which fair values are disclosed in the financial statements. To provide an indication about the reliability of the inputs used in determining fair value, the Company has classified its financial instruments into three levels prescribed under the Indian Accounting Standards. An explanation for each level is given below.
Level 1: Level 1 hierarchy includes financial instruments measured using quoted prices.
Level 2: The fair value of financial instruments that are not traded in an active market is determined using valuation techniques which maximise the use of observable market data and rely as little as possible on entity-specific estimates. If all significant inputs required to fair value an instrument are observable, the instrument is included in level 2. Instruments in the level 2 category for the Company include foreign exchange forward contracts.
Level 3: If one or more of the significant inputs is not based on observable market data, the instrument is included in this level.
iii) Financial assets (other than investment in subsidiaries) and liabilities measured at fair value through profitorlossateachreportingdate
(` in lakhs)2018 2017
Level 1 Level 2 Level 3 Level 1 Level 2 Level 3Financial assets measured at FVTPLDerivative instruments - foreign exchange forward contracts
- 38 - - 2 -
Total - 38 - - 2 - Financial liabilities measured at FVTPLDerivative instruments - foreign exchange forward contracts
- - - - 423 -
Total - - - - 423 -
iv) Non-currentfinancialassets(otherthaninvestmentinsubsidiaries)andliabilitiesmeasuredatamortisedcost at each reporting date
(` in lakhs)2018 2017
Level 3 Carrying amount Level 3 Carrying
amountNon-currentfinancialassets Loans 602 571 1,744 1,697 Other financial assets 17 20 24 29 Non-currentfinancialliabilities Borrowings 7,262 7,262 15,045 15,045
a) The Company’s borrowings have been contracted at floating rates of interest, which resets at short intervals. Accordingly, the carrying value of such borrowings (including interest accrued but not due) approximates fair value.

Notes forming part of the financial statements
105Annual Report 2017-18
b) The fair values for “Other non-current financial assets “ comprising of lease rental deposits and bank deposits (due for maturity after twelve months from the reporting date) are based on discounted cash flows using a current lending rate. They are classified as level 3 fair values in the fair value hierarchy due to the use of unobservable inputs including counterparty credit risk.
c) The carrying amounts of trade receivables, cash and cash equivalents, bank balances other than cash and cash equivalents, current loans, other current financial assets, current borrowings, trade payables and other financial liabilities approximates the fair values due to the short-term maturities of these financial assets / liabilities.
d) There have been no transfers between level 1, level 2 and level 3 for the years ended 31 March 2018 and 31 March 2017.
v) Valuationtechniquesusedtodeterminefairvalueandsignificantestimatesandjudgementsmadein: The fair value of foreign exchange forward contracts is determined using forward exchange rates at the balance
sheet date. The fair values of the remaining financial instruments is determined using discounted cash flow method.
41 Financial risk management The Company has exposure to the following risks arising from financial instruments:
- Credit risk;
- Liquidity risk;
- Market risk - Foreign currency; and
- Market risk - Interest rate
A. Credit risk Credit risk is the risk of financial loss to the Company if a customer or counter party to a financial instrument fails
to meet its contractual obligations.
The Company is exposed to credit risk from its operating activities (primarily trade receivables), lease rental deposits, deposits with banks and other financial instruments. Credit risk arises from the possibility that counter party may not be able to settle their obligations as agreed.
i) Trade receivables The Company extends credit to customers in the normal course of business. The Company considers factors
such as financial conditions / market practices, credit track record in the market, analysis of historical bad debts and past dealings for extension of credit to customers. Individual credit limits are set accordingly. The Company monitors the payment track record of the customers and ageing of receivables. Outstanding customer receivables are regularly monitored. The Company considers the concentration of risk with respect to trade receivables as low, as its customers are located in several jurisdictions and industries and operate in largely independent markets. The Company has also taken advances and security deposits from some of its customers, which mitigate the credit risk to an extent.
ii) The ageing analysis of the trade receivables (other than due from related parties) has been considered from the date the invoice falls due.
(` in lakhs)2018 2017
Up to 3 months 12,088 9,663 3 to 6 months 246 136 More than 6 months 109 96 Total 12,443 9,895

Notes forming part of the financial statements
106
iv) The following table summarizes the change in the allowances for bad and doubtful debts:
(` in lakhs)2018 2017
As at beginning of the year 551 540 Add/(less):Provided during the year 171 170 Amounts written off (142) (49)Reversals of provision (27) (110)As at end of the year 553 551
The Company uses provision matrix whereby trade receivables are considered impaired based on past trends where such receivables are outstandings for more than one year. The allowance for lifetime expected credit loss on customer balances for the year ended 31 March 2018 and 31 March 2017 is not material and the same has not been recognised. The reversal for lifetime expected credit loss on customer balances for the year ended 31 March 2018 is ` Nil ( 31 March 2017 : ` Nil ).
v) Otherfinancialinstruments The Company considers factors such as track record, size of the institution, market reputation, financial
strength/rating and service standards to select the banks with which balances and deposits are maintained. Generally, the balances are maintained with the institutions from whom the Company has also availed borrowings. Security deposits against leasing of premises/equipments are refundable upon closure of the lease and hence credit risk associated with such deposits is relatively low.
B Liquidity risk i) Liquidity risk is defined as the risk that the Company will not be able to settle or meet its obligations on
time or at a reasonable price. For the Company, liquidity risk arises from obligations on account of financial liabilities – borrowings, trade payables, derivative instruments and other financial liabilities.
The Company’s approach to managing liquidity is to ensure, as far as possible, that it will always have sufficient liquidity to meet its liabilities when due, under both normal and stressed conditions, without incurring unacceptable losses or risking damage to the Company’s reputation. The Company manages liquidity risk by maintaining adequate reserves, by continuously monitoring forecast and actual cash flows and matching the maturity profiles of the financial assets and liabilities. It maintains adequate sources of financing including loans, debt and overdraft from banks. It also enjoys strong access to domestic capital markets across various debt instruments.
ii) Exposure to liquidity risk The following are the remaining contractual maturities of financial liabilities at the reporting date. The
contractual cash flow amounts are gross and undiscounted.
As at 31 March 2018 (` in lakhs)Less than
1 yearBetween 1 and
5 yearsBeyond 5 years Total
Maturities of non – derivative financialliabilitiesLong-term borrowings 6,227 7,208 70 13,505 Short-term borrowings 5,736 - - 5,736 Interest payable 431 674 - 1,105 Trade payables 5,408 - - 5,408 Other financial liabilities 4,467 - - 4,467 Total 22,269 7,882 70 30,221

Notes forming part of the financial statements
107Annual Report 2017-18
As at 31 March 2017 (` in lakhs)Less than
1 yearBetween
1 and 5 yearsBeyond 5 years Total
Maturities of non – derivative financialliabilitiesLong-term borrowings 2,476 14,956 160 17,592 Short-term borrowings 1,792 - - 1,792 Interest payable 1,247 2,229 - 3,476 Trade payables 4,681 - - 4,681 Other financial liabilities 3,952 - - 3,952 Total 14,148 17,185 160 31,493 Maturities of derivative financialliabilitiesForeign exchange forward contracts
423 - - 423
Total 423 - - 423
C Market risk
Market risk is the risk that changes in market prices, such as foreign exchange rates, interest rates and equity prices will affect the Company’s income or the value of its holdings of financial instruments. The objective of market risk management is to manage and control market risk exposures within acceptable parameters, while optimising the return. The sensitivity analysis excludes the impact of movements in market variables on the carrying value of post-employment benefit obligations provisions and on the non-financial assets and liabilities. The sensitivity of the relevant profit and loss item is the effect of the assumed changes in respective market risks.
The Company’s activities expose it to risks on account of changes in foreign currency exchange rates and interest rates. The Company uses derivative financial instruments such as foreign exchange forward contracts of varying maturity depending upon the underlying contract as a risk management strategy to manage its exposures to foreign exchange fluctuations and interest rate.
i Foreign currency risk
Currency risk is the risk that the fair value or future cash flows fluctuate because of changes in market prices. The Company is exposed to foreign exchange risk on their receivables, payables and foreign currency loans which are mainly held in the United State Dollar (“USD”), the Euro (“EUR”), the Swiss Franc (“CHF”) and the Chinese Yuan (“CNY”). Consequently, the Company is exposed primarily to the risk that the exchange rate of the Indian Rupees (“INR”) relative to the USD, the EUR, the CHF, and the CNY may change in a manner that has a material effect on the reported values of the Company’s assets and liabilities that are denominated in these foreign currencies.
The Company evaluates exchange rate exposure arising from foreign currency transactions and follows established risk management policies, including minimising cross currency transactions, using natural hedge and the use of derivatives like foreign exchange forward contracts to minimise the impact to results of the exchange rate movements. the unhedged exposures are maintained and kept to minimum feasible.

Notes forming part of the financial statements
108
The Company’s exposure to foreign currency risk at the end of the reporting period are as under -
(` in lakhs)
2018 2017USD EUR CHF CNY Others USD EUR CHF CNY Others
Financial assetsTrade receivables 1,287 37 - - 4 454 92 - - - Others 254 56 - 183 - 221 52 - 172 - Derivative assetsForeign exchange forward contracts
- - - - - (649) - - - -
Net exposure to foreign currency risk
1,541 93 - 183 4 26 144 - 172 -
Financial liabilitiesBorrowings 370 - 1,245 - - 1,406 - 1,302 - - Trade payables 1,271 70 - - - 2,069 83 142 - 6 Others 7 - 3 - - 10 0 4 - - Derivative liabilitiesForeign exchange forward contracts
(533) - (1,245)
- - (3,443)
- (1,302)
- -
Net exposure to foreign currency risk
1,115 70 3 - - 42 83 146 - 6
The above table excludes foreign currency exposures (financial liabilities) of ` 1,829 lakhs (31 March 2017: ` 5,255 lakhs) denominated primarily in USD and CHF currencies for which the exchange differences (net) are being capitalised to cost of property, plant and equipment. Accordingly the corresponding foreign exchange forward contracts against these financial liabilities amounting to ` 1,829 lakhs (31 March 2017: ` 4,828 lakhs) have been excluded.
Sensitivity to foreign currency risk
The following table demonstrates the sensitivity in the USD, EUR, CHF, CNY and other currencies with all other variables held constant. The below impact on the Company’s profit before tax is based on changes in the fair value of unhedged foreign currency monetary assets and liabilities at balance sheet date:
(` in lakhs)
Currencies / Sensitivity2018 2017
Increase by 5% Decrease by 5% Increase by 5% Decrease by 5%(Loss) / Gain (Loss) / Gain
USD 21.31 (21.31) (0.72) 0.72 EUR 1.15 (1.15) 3.04 (3.04)CHF 0.41 (0.41) (7.28) 7.28 CNY 9.14 (9.14) 8.61 (8.61)Others 0.20 (0.20) (0.31) 0.31
ii Interest rate risk
This refers to risk to Company’s cash flow and profits on account of movement in market interest rates.
For the Company the interest risk arises mainly from interest bearing borrowings which are at floating interest rates. To mitigate interest rate risk, the Company closely monitors market interest and as appropriate makes use of hedged products optimised borrowing mix / composition etc.

Notes forming part of the financial statements
109Annual Report 2017-18
a) Interest rate risk exposure
(` in lakhs)2018 2017
Variable rate borrowings 18,180 17,718 Fixed rate borrowings 1,061 1,665 Total borrowings 19,241 19,383
b) Interest rate sensitivity
The following table illustrates the sensitivity of profit and equity to a reasonably possible change in interest rate of 50 basis point increase or decrease. The calculations are based on the variable rate borrowings outstanding at balance sheet date. All other parameters are held constant.
(` in lakhs)
Impactonprofitaftertax(Loss) / Gain
2018 2017Interest rates - increase by 50 basis points (91) (90)Interest rates - decrease by 50 basis points 91 90
42 Capital Management
Risk management
The Company manages its capital structure and makes necessary adjustments in light of changes in economic conditions and the requirement of financial covenants. To maintain or adjust the capital structure, the Company may adjust the dividend payment to shareholders, return capital to shareholders, issue new shares or raise / retire debt. The primary objective of the Company’s capital management is to maximise the shareholders’ value.
For the purpose of the Company’s capital management, equity includes issued capital, securities premium and other reserves. Net debt includes loans less cash and bank balances. The Company manages capital by monitoring gearing ratio which is net debt divided by equity plus net debt.
(` in lakhs)The capital composition is as follows: 2018 2017Gross debt (inclusive of long term and short term borrowing) 19,241 19,384 Less: - Cash and bank balances* 836 147 Net debt 18,405 19,237 Total equity 65,471 62,209 Total capital 83,876 81,446 Gearing Ratio 22% 24%
* Including deposits with banks having original maturity period of more than twelve months of ` 20 lakhs (31 March 2017 ` 29 lakhs) shown under other non current financial assets.
Loan covenants
Borrowings contain certain debt covenants relating to limitation on indebtedness, debt-equity ratio, debt to EBITDA ratio, interest service coverage ratio and debt service coverage ratio. The limitation on indebtedness covenant gets suspended once the Company meets certain prescribed criteria. The debt covenant related to limitation on indebtedness remained suspended as of the date of adoption of the consolidated financial statements. The Company has also satisfied all other debt covenants prescribed in the respective sanction of bank loan. The deferred sales tax loans and finance leases do not carry any debt covenant.

Notes forming part of the financial statements
110
43 Share-based payments
Employee stock option plan
a) During the year 2014-15, the Company had instituted an Essel Employee Stock Option Scheme 2014 (”the Scheme”) as approved by the Board of Directors for issuance of stock options to the eligible employees of the Company and of its subsidiaries, other than directors, promoters or person belonging to promoter group.
Subject to terms and conditions of the Scheme, the said options will vest on each of 1 July 2016, 1 July 2017 and 1 July 2018 to the extent mentioned in the letter of grant and can be exercised within a maximum period of four years from the date of vesting. When exercisable, each option is convertible into one equity share of ` 2 each fully paid up.
b) Summary of options granted under the Scheme
(` in lakhs)2018 2017
Average exercise price
per share option (`)
Number of options
Average exercise price
per share option (`)
Number of options
Opening balance 127.83 19,20,842 123.97 29,92,535 Granted during the year - - 203.56 1,52,507 Exercised during the year (Refer Note (i) below)
121.65 (80,166) 121.65 (57,333)
Forfeited during the year- Non-vested options (Refer
Note (ii) below) 134.96 (10,39,514) 126.06 (11,66,867)
- Vested options (Refer Note (iii) below)
121.65 (34,334) - -
Closing balance 7,66,828 19,20,842 Vested and exercisable 121.65 7,66,828 121.65 8,81,328
c) Expiry date and exercise prices of the share options outstanding at the end of the year:
Grant date Expiry date Exercise price (`)
Share options2018 2017
19 March 2015 30 June 2020 121.65 7,66,828 8,81,328 19 March 2015 30 June 2022 121.65 - 8,41,339 29 October 2015 30 June 2022 161.00 - 45,668 17 June 2016 30 June 2022 196.40 - 1,13,096 01 September 2016 30 June 2022 224.10 - 39,411 Total 7,66,828 19,20,842 Weighted average remaining contractual life of options outstanding at end of period
2.25 4.33

Notes forming part of the financial statements
111Annual Report 2017-18
d) The fair value of each option granted is estimated on the date of grant using the black scholes model with the following assumptions
Scheme A B C DGrant date 19-Mar-2015 29-Oct-2015 17-Jun-2016 01-Sep-2016Weighted average fair value of options granted (`)
49.20 59.58 75.34 81.78
Exercise price (`) 121.65 161.00 196.40 224.10Share price at the grant date (`) 116.50 160.00 194.75 222.70Expected volatility 47.55% 37.90% 40.24% 39.46%Risk free interest rate 7.64% 7.52% 7.28% 6.87%Dividend yield 1.28% 1.28% 0.93% 0.93%Expected life of the options (years) 3.29 to 5.29 3.67 to 4.67 4.04 3.83
The expected price volatility is based on the historic volatility (based on the remaining life of the options), adjusted for any expected changes to future volatility due to publicly available information.
e) Expense arising from share based payments transactions
(` in lakhs)2018 2017
Expense / (credit) arising from share based payments (net) (342) 28 Less: Options granted/(forfeited) to/(from) employees of subsidiaries recognised as deemed investment in subsidiaries
(166) 22
Employee share based payment expense /(credit) recognised in the statementofprofitandloss(net)(Refernote34)
(176) 6
Notes:
(i) The weighted average share price at the date of exercise of options exercised during the year ended 31 March 2018 was `277.77 (31 March 2017: ` 249.39).
(ii) Forfeited on account of non-market performance vesting conditions not achieved.
(iii) Forfeited on account of employees resigned without exercising
44 Gratuityandotherlong-termbenefitplans
The disclosures of employee benefits as defined in the Ind AS 19 - ”Employee Benefits” are given below:
a. The Company makes annual contributions to the employees’ gratuity fund scheme, a funded defined benefit plan which is managed by the LIC of India and HDFC Bank. The present value of obligation is determined based on actuarial valuation using the projected unit credit method, which recognizes each period of service as giving rise to additional unit of employee benefit entitlement and measures each unit separately to build up the final obligation.
b. Leave encashment is a non-funded defined benefit scheme. The obligation for leave encashment is recognised in the same manner as gratuity.

Notes forming part of the financial statements
112
c. Details of post retirement gratuity plan are as follows:-
i. Netexpensesrecognisedduringtheyearinthestatementofprofitandloss
(` in lakhs)2018 2017
Current service cost 84 66 Interest cost (net) 76 59 Benefits paid by employer - 1 Netexpensesrecognisedinthestatementofprofitandloss 160 126
ii. Net expenses recognised during the year in other comprehensive income (OCI)
(` in lakhs)2018 2017
Actuarial (gains) / losses arising from changes in demographic assumptions
(6) 1
Actuarial (gains) / losses arising from changes in financial assumptions 83 101 Actuarial (gains) / losses arising from changes in experience assumptions
38 86
Expected return on plan assets excluding interest (2) (6)Net expenses recognised in (OCI) 113 182
iii. Net liability recognised in the balance sheet
(` in lakhs)2018 2017
Present value of obligation 1,569 1,304 Less: Fair value of plan assets 559 324 Net liability recognised in balance sheet 1,010 980
iv. Reconciliationofopeningandclosingbalancesofdefinedbenefitobligation
(` in lakhs)2018 2017
Defined benefit obligation as at the beginning of the year 1,304 1,105 Current service cost 84 66 Interest cost 100 87 Actuarial (gain) / loss on obligation 115 188 Liability transferred in/ (paid) - (18)Benefits paid (34) (124)Definedbenefitobligationattheendoftheyear 1,569 1,304

Notes forming part of the financial statements
113Annual Report 2017-18
v. Reconciliation of opening and closing balance of fair value of plan assets
(` in lakhs)2018 2017
Fair values of plan assets at the beginning of the year 324 353 Interest income 24 28 Return on plan assets, excluding interest income 2 6 Employer contribution 243 61 Benefits paid (34) (124)Fair value of plan assets at year end 559 324
vi. Reconciliationofopeningandclosingbalanceofnetdefinedbenefitobligation
(` in lakhs)2018 2017
Netdefinedbenefitobligationasatthebeginningoftheyear 980 752 Current service cost 84 66 Interest cost (net) 76 59 Actuarial (gain) / loss on obligation 115 188 Liability transferred in/ (paid) - (18)Return on plant assets, excluding interest income (2) (6)Employer contribution (243) (61)Benefits paid - - Netdefinedbenefitobligationattheendoftheyear 1,010 980
vii. Investment details
(` in lakhs)2018 2017
Insurer Managed Funds 559 324
viii. Actuarial assumptions
2018 2017Mortality Table Indian Assured
Lives mortality (2006-08) Ultimate
Indian Assured Lives mortality
(2006-08) Ultimate
Discount rate(per annum) 7.87% 7.71%Expected rate of return on plan assets (per annum) 7.87% 7.71%Rate of escalation in salary (per annum) 6.00% 5.00%Attrition rate Service 4 years
and below - 10%, others - 1%
Service 4 years and below - 5%,
others - 1%

Notes forming part of the financial statements
114
ix. Quantitative sensitivity analysis
(` in lakhs)2018 2017
Projected benefit obligation on current assumptions 1,569 1,304 Increase by 1% in discount rate (96) (41)Decrease by 1% in discount rate 111 45 Increase by 1% in rate of salary increase 112 45 Decrease by 1% in rate of salary increase (99) (43)Increase by 1% in rate of employee turnover 15 10 Decrease by 1% in rate of employee turnover (17) (10)
x. Maturityanalysisofprojectedbenefitobligation:fromthefund
(` in lakhs)2018 2017
Projected benefits payable in future years from the date of reporting1st Following Year 239 221 2nd Following Year 33 26 3rd Following Year 524 30 4th Following Year 49 505 5th Following Year 61 43 Sum of years 6 to 10 460 350 Sum of Years 11 and above 1,916 1,475
Notes:
1 Amounts recognised as an expense and included in the Note 34 “Employee benefits expense” are gratuity ` 84 lakhs (31 March 2017 ` 66 lakhs) and leave encashment ` 153 lakhs (31 March 2017 ` 241 lakhs). Net interest cost on defined benefit obligation recognised in Note 35 under “Finance costs” is ` 76 lakhs (31 March 2017 ` 59 lakhs).
2 The estimate of future salary increases considered in the actuarial valuation takes into account the rate of inflation, seniority, promotion and other relevant factors, such as supply and demand in the employment market.
3 “Contribution to provident and other funds” which is a defined contribution plan is recognised as an expense in Note 34 of the financial statements.
45 Dividends paid and proposed
(` in lakhs)2018 2017
a. Dividends on equity shares declared and paidFinal dividend paid in current year for the year ended 31 March 2017 ` 2.40 per share (paid in previous year for the year ended 31 March 2016: ` 2.20 per share)
3,770 3,455
Dividend distribution tax on above 768 703b. Proposed dividends on equity shares
Final dividend proposed for the year ended 31 March 2018 ` 2.40 per share (31 March 2017: ` 2.40 per share)
3,772 3,770
Dividend distribution tax on above 775 768
Proposed dividends on equity shares are subject to approval of shareholders at the annual general meeting and are not recognised as a liability (including dividend distribution tax thereon) as at the reporting date.

Notes forming part of the financial statements
115Annual Report 2017-18
46 Collateral / security pledged
The carrying amount of assets pledged as security for current and non-current borrowings of the Company and for a loan of USD 11.50 Million (31 March 2017: USD 12.50 Million) availed by a subsidiary are as under:
(` in lakhs)2018 2017
Property, plant and equipment 34,652 36,087 Inventories 8,305 6,673 Other current and non-current assets excluding investments 31,700 29,065 Total assets pledged 74,657 71,825
47 Contingent liabilities and commitments (to the extent not provided for)
i) Contingent liabilities
(` in lakhs)2018 2017
A. Claims against the Company not acknowledged as debt(a) Disputed indirect taxes 2,991 2,340 (b) Disputed direct taxes 3,809 3,023 (c) Deferred sales tax liability assigned 340 474 (d) Other claims not acknowledged as debts 50 50
(` in lakhs)2018 2017
B. GuaranteesexcludingfinancialguaranteesBank guarantees given by the Company 278 271
(` in lakhs)2018 2017
C. Other money for which the Company is contingently liable(a) Unexpired letters of credit (net of liability provided) 40 25 (b) Duty benefit availed under EPCG scheme, pending export
obligations 2,831 3,012
(` in lakhs)2018 2017
D. Capital commitmentsEstimated amount of contracts remaining to be executed on capital account, not provided for (net of advances)
2,178 1,676
(` in lakhs)2018 2017
E. Financial guarantees provided Corporate guarantees and letter of comfort given for loans taken by subsidiaries. Loans outstanding against these guarantees and letter of comfort is ` 40,553 lakhs (31 March 2017: ` 46,332 lakhs)
52,775 60,194
48 Insurance claim receivable of ` 193 lakhs (31 March 2017: ` 193 lakhs) is in respect of transit damage to certain plant and machinery, which is under litigation before National Consumer Dispute Rederssal Commission, New Delhi (Refer Note 16).

Notes forming part of the financial statements
116
49 Leases
a. Finance Lease
The Company has acquired plant and machinery and equipment under finance lease which are capitalised under property, plant and equipment. The minimum lease payments required under the finance lease that have initial or remaining non-cancellable lease terms in excess of one year as at 31 March 2018 and their present value are as follows:
(` in lakhs)2018 2017
Minimum lease payment as at 31 MarchNot later than one year 188 395 Later than one year but not later than five years - 189 Total minimum lease payments 188 584 Less: Amount representing finance charges 5 58 Present value of minimum lease payments as at 31 March 183 526 Not later than one year 183 345 Later than one year but not later than five years - 181
b. Operating Lease
The Company has taken office and factory units, residential facilities, plant and machinery (including equipment), IT assets, vehicles, etc. under cancellable/ non-cancellable operating lease agreements that are renewable on a periodic basis at the option of both the lessor and the lessee. The initial tenure of these leases varies from eleven to one hundred and eight months. The rental obligations are as follows:
(` in lakhs)2018 2017
Lease rental charges for the year 2,107 2,355 Future lease rental obligation payable (under non-cancellable leases) as at 31 MarchNot later than one year 1,679 1,913 Later than one year but not later than five years 4,962 4,121 Later than five years 2,039 2,141 Total 8,680 8,175
50 Segment information
The financial statements of the Company contain both the consolidated financial statements as well as the separate financial statements. Hence, the Company has presented segment information on the basis of the consolidated financial statements as permitted by Ind AS 108 “Operating Segments.” The Company has only one major identifiable business segment viz. Plastic Packaging Material.
51 Information required under Section 186(4) of the Companies Act, 2013
a. Loans given
(` in lakhs)Name of the Party 2017 Given Repaid 2018
Sprit Infrapower & Multiventures Private Limited* (excluding interest receivable)
9,607 - - 9,607
* Name changed from Sprit Textiles Private Limited w.e.f. 2 November, 2017.
b. Investments made
There are no investments other than disclosed in Note 6 - Non-current investments.

Notes forming part of the financial statements
117Annual Report 2017-18
c. Corporate guarantees and letter of confort given on behalf of subsidiaries(` in lakhs)
Name of the Subsidiary 2018 2017i. Lamitube Technologies Limited , Mauritius 33,892 46,102 ii. Essel Propack Polska Sp. Z.O.O., Poland 11,552 12,633 iii. Essel Propack LLC, USA 7,331 1,459
52,775 60,194
d. Security provided for loan availed by the subsidiary(` in lakhs)
Name of the Subsidiary 2018 2017Lamitube Technologies Limited, Mauritius 8,147 8,106
Notes
i. All the loans/guarantees and security given are for general business purposes.
ii. The loan is interest bearing and is at arm’s length.
iii. Security provided by the Company in clause (d) above is collateral to the corporate guarantee given in clause c (i) above.
iv. The outstanding loan amount availed by the subsidiaries against the corporate guarantees/ letter of comfort given and security provided by the Company is ` 40,553 lakhs (31 March 2017 ` 46,332 lakhs).
v. Amounts disclosed in (c) and (d) are translated at respective year-end foreign exchange rates.
52 Disclosure as required by Schedule V (A)(2) of the SEBI (Listing Obligations and Disclosure Requirements) Regulations, 2015:
Investments by Loanee in the equity shares of the Company as at 31 March 2018
Name of the SubsidiaryNumber of fully paid up equity
shares2018 2017
Sprit Infrapower & Multiventures Private Limited 7,84,025 7,84,025
53 Micro, Small and Medium Enterprises
Disclosure required under the Micro, Small and Medium Enterprises Development Act, 2006 (“The Act”) are given as follows:
(` in lakhs)Name of the Subsidiary 2018 2017
i. Principal amount payable to suppliers under the Act- For capital goods - - - For Others 408 299
ii. Principal amount due to suppliers under the Act - - iii. Interest accrued and due to suppliers under the Act, on the above
amount - -
iv. Payment made to suppliers (Other than interest) beyond the appointed day, during the year
3,670 2,856
v. Interest paid to suppliers under the Act - - vi. Interest due and payable to suppliers under the Act, for payments
already made 7 8
vii. Interest accrued and remaining unpaid at the end of the year under the Act
33 26
Note: The information has been given in respect of such vendors to the extent they could be identified as “Micro and Small” enterprises on the basis of information available with the Company.

Notes forming part of the financial statements
118
54 Related party disclosures
a. List of related parties
i. Ultimate holding company
Rupee Finance and Management Private Limited (ceased to be ultimate holding company w.e.f. 6 October 2016 pursuant to the scheme of amalgamation -Refer note 58)
ii. Holding company
Whitehills Advisory Services Private Limited (ceased to be holding company w.e.f. 6 October 2016 pursuant to the scheme of amalgamation - Refer note 58)
iii. Subsidiary companies
Name of the subsidiary
Proportion of interest (including beneficialinterest)/voting
power (either directly / indirectly through subsidiaries)
Country of Incorporation
2018 2017Direct subsidiariesArista Tubes Inc. * 100% 100% United States of
AmericaLamitube Technologies (Cyprus) Limited 100% 100% CyprusLamitube Technologies Limited 100% 100% MauritiusStep down subsidiariesThe Egyptian Indian Company for Modern Packaging S.A.E. #
- 75% Egypt
Essel Propack MISR for Advanced Packaging S.A.E. 75% 75% EgyptLamitube Hong Kong Trading Company Limited # - 100% Hong KongEssel Packaging (Guangzhou) Limited 100% 100% ChinaEssel Packaging (Jiangsu) Limited 100% 100% ChinaEssel Propack Philippines, Inc 100% 100% PhilippinesMTL de Panama S.A. 100% 100% PanamaArista Tubes Limited 100% 100% United KingdomEssel Propack UK Limited 100% 100% United KingdomEssel de Mexico, S.A. de C.V. 100% 100% MexicoTubopack de Colombia S.A. 100% 100% Colombia Essel Propack LLC 100% 100% RussiaEssel de Colombia S.A.S. 100% 100% Colombia Essel Propack Polska Sp. Z.O.O. 100% 100% PolandEssel Deutschland GmbH & Co.,KG Dresden ## 100% 100% GermanyEssel Deutschland Management GmbH ## 100% 100% GermanyEssel Propack America, LLC 100% 100% United States of
America * 7.35% is held through Lamitube Technologies (Cyprus) Limited # Liquidated / de-registered during the year. ## Ceased to be joint ventures and became wholly owned subsidiaries w.e.f. 30 September 2016 (Refer note
(v) below)

Notes forming part of the financial statements
119Annual Report 2017-18
iv. Associate company
Name of CompanyExtent of Holding Country of
Incorporation2018 2017P.T. Lamipak Primula 30% 30% Indonesia
v. Joint ventures
Name of CompanyExtent of Holding Country of
Incorporation2018 2017Essel Deutschland Management GmbH ## -- -- GermanyEssel Deutschland GmbH & Co. KG, Dresden ## -- -- Germany
## Ceased to be joint ventures (extent of holding 24.9%) and became wholly owned subsidiaries w.e.f. 30 September 2016
vi. Other related parties with whom transactions have taken place during the year and balances outstanding at the year-end
Other related parties
Aqualand (India) Limited, Ayepee Lamitubes Limited, Ganjam Trading Company Private Limited, Pan India Paryatan Private Limited, Sprit Infrapower & Multiventures Private Limited (formerly Sprit Textiles Private Limited), ITZ Cash Card Limited, Shrotra Enterprises Private Limited.
vii. Key management personnel / Directors
Executive director Mr. Ashok Goel (Chairman and Managing Director)
Independent director Mr. Boman Moradian
Independent director Mr. Mukund M. Chitale
Independent director Ms. Radhika Pereira
Non-executive director Mr. Atul Goel
viii. Transactions with related parties
(` in lakhs)(I) Transactions 2018 2017a) Sales to and recoveries from
Subsidiaries 1,772 2,550 Essel Propack Polska Sp.Z.O.O. 435 455 Essel Propack America, LLC 66 80 Essel Propack MISR for Advanced Packaging S.A.E. 402 648 Essel Packaging (Guangzhou) Limited 128 229 Essel Propack Russia, LLC 277 446 Essel Deutschland GmbH & Co., KG Dresden 336 490 Others 128 202 Joint ventures / Associate - 105 Essel Deutschland GmbH & Co., KG Dresden - 91 P.T. Lamipack Primula - 14 Other related parties 21 - Shrotra Enterprises Private Limited 21 -

Notes forming part of the financial statements
120
(` in lakhs)(I) Transactions 2018 2017b) Royalty/Service charges income
Subsidiaries 1,462 1,347 Essel Packaging (Guangzhou) Limited 894 888 Essel Propack MISR for Advanced Packaging S.A.E. 234 253 Essel Propack Polska Sp.Z.O.O. 36 37 Essel Propack America, LLC 27 29 Essel Deutschland GmbH & Co., KG Dresden 210 105 Others 61 35 Joint ventures / Associate - 110 Essel Deutschland GmbH & Co., KG Dresden - 110
c) Guarantee commission income Subsidiaries 433 449 Lamitube Technologies Limited 331 330 Essel Propack Polska Sp.Z.O.O. 100 113 Others 2 6
d) Sale of property, plant and equipment Subsidiaries - 315 Essel de Columbia S.A.S. - 54 Essel Packaging (Guangzhou) Limited - 261
e) Purchase of goods and services Subsidiaries 14 42 Essel Propack America, LLC 1 31 Essel Propack Polska Sp. Z.O.O. 2 4 Essel Packaging (Guangzhou) Limited 4 3 Others 7 4 Other related parties 53 21 ITZ Cash Card Limited 53 21
f) Purchase of property, plant and equipment Subsidiaries 1 1,532 Essel Propack America, LLC 1 1 Essel Deutschland GmbH & Co., KG Dresden - 472 Essel Propack Polska Sp. Z.O.O. - 1,026 Others - 33
g) Rent expenses Other related parties 1,017 934 Ayepee Lamitubes Limited 10 40 Ganjam Trading Company Private Limited 1,007 875 Others - 19
h) Guarantee commission paid 449 513 Aqualand (India) Limited 449 513
i) Loans/deposits given Other related parties - 550 Ganjam Trading Company Private Limited - 550
j) Repayment of loans/deposits given Other related parties 1,250 975 Ayepee Lamitubes Limited 1,250 - Ganjam Trading Company Private Limited * - 975

Notes forming part of the financial statements
121Annual Report 2017-18
(` in lakhs)(I) Transactions 2018 2017k) Interest income on loans given
Other related parties 1,136 1,297 Ganjam Trading Company Private Limited * - 111 Sprit Infrapower & Multiventures Private Limited 1,136 1,186
l) Remuneration paid/provided 640 717 Mr. Ashok Goel 640 717
m) Commission to directors 45 45 Mr. Boman Moradian 15 15 Mr. Mukund M. Chitale 15 15 Ms. Radhika Pereira 15 15
n) Sitting fees 7 9 Mr. Boman Moradian 3 4 Mr. Mukund M. Chitale 2 3 Ms. Radhika Pereira 2 2
* Repayment received of loan taken over in books pursuant to scheme of amalgamation (Refer note 58) and interest thereon.
(` in lakhs)(II) Balances outstanding 2018 2017a) Trade receivables
Subsidiaries 470 480 Essel Propack America, LLC 4 4 Essel Packaging (Guangzhou) Limited 182 182 Essel Propack MISR for Advanced Packaging S.A.E. 53 98 Essel Propack Russia, LLC 130 74 Essel Deutschland Gmbh & Co., KG Dresden 58 26 Essel Columbia SAS 5 53 Essel Propack Polska Sp. Z.O.O. 38 - Others - 43 Other related parties - 1 Shrotra Enterprises Private Limited - 1
b) Loans / deposits given (including interest receivable) Other related parties 11,479 12,774 Ayepee Lamitubes Limited - 1,250 Sprit Infrapower & Multiventures Private Limited 10,629 10,674 Others 850 850
c) Other receivables Subsidiaries 234 176 Essel Propack America, LLC 29 23 Essel Propack MISR for Advanced Packaging S.A.E. 52 23 Essel Packaging (Guangzhou) Limited 60 61 Essel Propack Polska Sp.Z.O.O. 29 36 Others 64 33

Notes forming part of the financial statements
122
(` in lakhs)(II) Balances outstanding 2018 2017d) Trade and other payables
Subsidiaries 15 58 Essel Propack America, LLC 7 12 Essel Propack Polska Sp.Z.O.O. 2 42 Others 6 4 Other related parties 38 - Ganjam Trading Company Private Limited 35 - Ayepee Lamitubes Limited 3 -
e) Investments in equity/preference shares Subsidiaries 21,692 21,692 Lamitube Technologies Limited 8,994 8,994 Lamitube Technologies (Cyprus) Limited 5,255 5,255 Arista Tubes Inc. 7,443 7,443
f) Guarantees and letter of comfort provided for loans availed by subsidiaries Subsidiaries 52,775 60,194 Lamitube Technologies Limited 33,892 46,102 Essel Propack Polska Sp. Z.O.O. 11,552 12,633 Essel Propack America, LLC 7,331 1,459
g) Guarantees / securities provided on Company's behalf Other related parties 16,000 25,400 Aqualand (India) Limited 16,000 25,400 Loan outstanding ` 7,440 lakhs (31 March 2017: ` 15,557 lakhs )
h) Remuneration payable (Performance bonus) 153 233 Mr. Ashok Goel 153 233
i) Commission payable (gross) 45 45 Mr. Boman Moradian 15 15 Mr. Mukund M. Chitale 15 15 Ms. Radhika Pereira 15 15
Notes: i) All transactions with related parties are made on arm’s length basis in the ordinary course of business.
The outstanding balances at year end are unsecured due to be settled for consideration in cash.
ii) The above disclosures are excluding Ind AS adjustments.
ix. Break up of remuneration of key management personnel of the Company
(` in lakhs)2018 2017
Chairman and Managing directori. Salaries, allowances and perquisites ^ 450 448 ii. Contribution to provident and other funds 37 36 iii. Performance bonus * 153 233
Total 640 717

Notes forming part of the financial statements
123Annual Report 2017-18
^ Excludes leave encashment and gratuity liability provided in the books on the basis of actuarial valuation on an overall Company basis. Further the Essel Employee Stock Option Scheme 2014 does not extend to chairman and managing director, hence there is no share based compensation benefit.
* The performance bonus for the current year has been provided in the accounts as recommended by the nomination and remuneration committee and approved by the Board of Directors. The total remuneration to Managing Director computed as per the Companies Act, 2013 is within limits prescribed u/s 197 of the Companies Act, 2013.
55 Dividend of ` 3 lakhs (31 March 2017 ` 2 lakhs) unclaimed for a period of more than seven years is transferred to Investor Education and Protection Fund during the year. There is no amount due and outstanding to be credited to Investor Educaton and Protection Fund as at 31 March 2018.
56 Corporate Social Responsibility (CSR) During the year, the Company has towards various CSR initiatives spent ` 78 lakhs (31 March 2017 ` 42 lakhs) as
against ` 179 lakhs (31 March 2017 ` 165 lakhs) as required by Section 135 read with Schedule VII of the Companies Act 2013. CSR spend has been charged to the statement of profit and loss under “Other expenses” in line with ICAI guidance note issued in May 2015.
57 Research and Development expenditure (R&D) During the year, the Company has incurred total R & D expenditure of ` 532 lakhs (31 March 2017 ` 562 lakhs)
including capital expenditure of ` Nil (31 March 2017 ` 66 lakhs), out of which the company has claimed weighted tax deduction on eligible R & D expenditure of ` 440 lakhs (31 March 2017 ` 470 lakhs) including capital expenditure of ` Nil (31 March 2017 ` 66 lakhs) under section 35(2AB) of the Income Tax Act, 1961.
58 Scheme of Amalgamation
i A Scheme of Amalgamation of the holding company Whitehills Advisory Services Private Limited (“transferor company”) with Essel Propack Limited (“transferee company”) and their respective shareholders (the Scheme) was sanctioned by the Hon’ble High Court of Judicature at Mumbai vide its order dated 1 September 2016. The Scheme became effective on 6 October 2016 and consequently all assets, liabilities and reserves of transferor company vested with the Company on the appointed date i.e. 1 November 2015 at their respective book values. Accordingly, the financial statements for the year ended 31 March 2017 includes the transactions of the transferor company.
ii Pursuant to the Scheme:-
a. 88,829,014 and 88,829 equity shares of ̀ 2 each fully paid up of the Company were allotted to the participating preference shareholders and equity shareholders respectively of the transferor company and equivalent number of equity shares of ` 2 each fully paid up held by the transferor company were cancelled. There was no change in the paid up equity share capital of the Company post allottment of the above equity shares.
b. The net assets taken over were credited to capital reserve and expenses incurred in relation to and in connection with the Scheme were debited to capital reserve as detailed below:
Assets and Liabilities ` in lakhs ` in lakhsCash and bank balances 30Long term loans and advances 975Current assets 2Current liabilities (11)Net assets taken over 996 Credited to capital reserve 996 Less: Expenses incurred in connection with the Scheme debited to capital reserve
(996)
-

Notes forming part of the financial statements
124
As per our attached report of even date For and on behalf of the Board
For Ford Rhodes Parks & Co. LLP Chartered AccountantsFirm Registration Number 102860W/W100089
Ashok GoelChairman & Managing Director
A.V. GanapathyChief Financial Officer
Boman Moradian
DirectorsRamaswamy SubramanianPartnerMembership Number 016059
Mukund M. Chitale Suresh SavaliyaCompany Secretary & Head - LegalRadhika Pereira
Atul Goel
Place: MumbaiDate: 26 April 2018
{59 Goods and Services tax
Following the commencement of Goods and Services Tax (GST) with effect from 1 July 2017, Revenue from operations for the period beginning 1 July 2017 is reported net of GST recovered, as required by Ind AS. However, prior to GST regime excise duty recovered was included as part of Revenue from operations for the reporting period till 30 June 2017 as required by Ind AS. Accordingly, the revenue from operations for the year ended 31 March 2018 are not comparable with the corresponding previous years presented in the financial results. To facilitate comparison, the following additional information is being provided:
(` in lakhs)2018 2017
Revenue from operations as reported* 85,225 88,105 Excise duty included in above (till 30 June 2017) 2,254 8,565 Revenue from operations excluding excise duty 82,971 79,540
* Effective 1 July 2017 following transition to GST, revenue is reported net of GST recovered.
60 Reconciliationbetweenopeningandclosingbalancesinthebalancesheetforliabilitiesarisingfromfinancingactivities as required by Ind AS 7 “Statement of Cash Flows” is as under:
(` in lakhs)
As at 31 March 2017
Cash inflows
Cash outflows
Non-cash changesAs at
31 March 2018Interest accured
Other changes
Equity share capital 3,143 2 - - - 3,145 Securities premium 10,987 96 - - 35 11,118 Non-convertible debentures (including current maturities)
8,969 5,000 (5,000) 154 (11) 9,112
Long-term borrowings (including current maturities)
8,047 - (3,742) 7 - 4,312
Finance lease (including current maturities)
526 - (343) - - 183
Short-term borrowings 1,795 16,330 (12,443) 17 - 5,699
61 Prior period comparatives
Previous year’s figures have been regrouped / reclassified wherever necessary to correspond with current year’s classifications / disclosures.

125Annual Report 2017-18
(` in lakhs) 2018 2017
A CashflowfromoperatingactivitiesProfitbeforetax 12,168 9,427 Adjustments for:Depreciation and amortisation expense 6,866 6,021 Share-based payment (credit)/expense (net) (Refer Note 43) (176) 6 Interest expense 1,335 1,370 Interest income (1,478) (1,280)Unwinding of discount on security deposits (89) (183)Net gain on disposal of property, plant and equipment (197) (38)Gain on sale of current investments (7) (3)Bad and doubtful debts (net of provision) 187 60 Remeasurement gain/(loss) on defined benefit plan (113) (182)Deferred rent amortisation 95 179 Amortisation of ancillary borrowing costs 56 26 Exchange adjustments (net) 40 90 Operatingprofitbeforeworkingcapitalchanges 18,687 15,493 Adjustments for:(Increase) / decrease in trade and other receivables (1,673) (1,557)(Increase) / decrease in inventories (1,632) (140)Increase / (decrease) in trade and other payables 824 925 Cash generated from operations 16,206 14,721 Direct taxes paid (net of refunds) (4,362) (2,045)Net cash from operating activities (A) 11,844 12,676
B CashflowfrominvestingactivitiesPurchase of property, plant and equipment (including capital work-in-progress)
(6,714) (10,474)
Sale of property, plant and equipment 299 315 Decrease in other bank balances (13) (26)Repayment received of loan taken over pursuant to scheme of amalgamation (Refer note 58)
- 975
Purchase of current investments (17,205) (4,551)Sale of current investments 17,212 4,554 (Increase)/decrease in other receivables of subsidiaries (net) (58) 186 Interest received 1,197 2,854 Net cash from/ (used in) Investing activities (B) (5,282) (6,167)
Statementofcashflowsfor the year ended 31 March 2018

126
(` in lakhs) 2018 2017
C CashflowfromfinancingactivitiesProceeds from issue of equity shares [including securities premium of ` 96 lakhs (31 March 2017: ` 69 lakhs)]
98 70
Proceeds from issue of non-convertible debentures 5,000 - Redemption of non-convertible debentures (5,000) - Proceeds from long-term borrowings - 1,368 Repayment of long-term borrowings (3,742) (1,886)Proceeds from short-term borrowings 14,349 9,554 Repayment of short-term borrowings (12,443) (9,500)Increase in other borrowings (net) 1,981 494 Principal payment under finance lease (343) (302)Interest paid (1,252) (1,370)Ancillary borrowing costs incurred (10) - Dividend paid (including tax) (4,524) (4,142)Expenses incurred pursuant to the scheme of amalgamation (Refer note 58) - (996)Netcashusedinfinancingactivities(C) (5,886) (6,710)Net changes in cash and cash equivalents (A+B+C) 676 (201)Cash and cash equivalents at the beginning of the year 41 212 Cash and cash equivalents acquired pursuant to the scheme of amalgamation (Refer note 58)
- 30
Cash and cash equivalents at the end of the year 717 41
Notes:
1 As required by Ind AS 7 “Statement of Cash Flows”, a reconciliation between opening and closing balances in the balance sheet for liabilities arising from financing activities is given in note 60 of the financial statements.
2 Previous year figures are regrouped / reclassified wherever necessary.
Statementofcashflowsfor the year ended 31 March 2018
As per our attached report of even date For and on behalf of the Board
For Ford Rhodes Parks & Co. LLP Chartered AccountantsFirm Registration Number 102860W/W100089
Ashok GoelChairman & Managing Director
A.V. GanapathyChief Financial Officer
Boman Moradian
DirectorsRamaswamy SubramanianPartnerMembership Number 016059
Mukund M. Chitale Suresh SavaliyaCompany Secretary & Head - LegalRadhika Pereira
Atul Goel
Place: MumbaiDate: 26 April 2018
{

127Annual Report 2017-18
Independent Auditor’s ReportToThe Members ofEssel Propack Limited
1. Reportontheconsolidatedfinancialstatements
We have audited the accompanying consolidated financial statements of Essel Propack Limited (“the Holding Company”) and its subsidiaries (the Holding Company and its subsidiaries together referred to as “the Group”) and its associate which comprise the consolidated balance sheet as at 31 March 2018, the consolidated statement of profit and loss (including other comprehensive income), the consolidated statement of cash flows and the consolidated statement of changes in equity for the year then ended and a summary of the significant accounting policies and other explanatory information (hereinafter referred to as “the consolidated financial statements”).
2. Management’s responsibility for the consolidated financialstatements
The Holding Company’s Board of Directors is responsible for the preparation of these consolidated financial statements in terms of the requirements of the Companies Act, 2013 (hereinafter referred to as “the Act”) that give a true and fair view of the consolidated financial position, consolidated financial performance including other comprehensive income, consolidated cash flows and consolidated changes in equity of the Group including its associate in accordance with the accounting principles generally accepted in India, including the Indian Accounting Standards (Ind AS) prescribed under Section 133 of the Act read with the Companies (Indian Accounting Standards) Rules, 2015, as amended.
The respective Board of Directors of the companies included in the Group and of its associate are responsible for maintenance of adequate accounting records in accordance with the provisions of the Act for safeguarding the assets of the Group and its associate and for preventing and detecting frauds and other irregularities; the selection and application of appropriate accounting policies; making judgments and estimates that are reasonable and prudent; and the design, implementation and maintenance of adequate internal financial controls, that were operating effectively for ensuring the accuracy and completeness of the accounting records, relevant to the preparation and presentation of the consolidated
financial statements that give a true and fair view and are free from material misstatement, whether due to fraud or error, which have been used for the purpose of preparation of the consolidated financial statements by the Directors of the Holding Company, as aforesaid.
3. Auditors’ responsibility
Our responsibility is to express an opinion on these consolidated financial statements based on our audit. While conducting the audit, we have taken into account the provisions of the Act, the accounting and auditing standards and matters which are required to be included in the audit report under the provisions of the Act and the Rules made thereunder.
We conducted our audit of the consolidated financial statements in accordance with the Standards on Auditing specified under section 143(10) of the Act. Those standards require that we comply with ethical requirements and plan and perform the audit to obtain reasonable assurance about whether the consolidated financial statements are free from material misstatement.
An audit involves performing procedures to obtain audit evidence about the amounts and the disclosures in the consolidated financial statements. The procedures selected depend on the auditor’s judgment, including the assessment of the risks of material misstatement of the consolidated financial statements, whether due to fraud or error. In making those risk assessments, the auditor considers internal financial control relevant to the Holding Company’s preparation of the consolidated financial statements that give a true and fair view in order to design audit procedures that are appropriate in the circumstances. An audit also includes evaluating the appropriateness of the accounting policies used and the reasonableness of the accounting estimates made by the Holding Company’s Board of Directors, as well as evaluating the overall presentation of the consolidated financial statements.
We believe that the audit evidence obtained by us and the audit evidence obtained by the other auditors in terms of their reports referred to in sub-paragraph 5 of the Other matters paragraph below, is sufficient and appropriate to provide a basis for our audit opinion on the consolidated financial statements.

128
4. Opinion
In our opinion and to the best of our information and according to the explanations given to us and based on the consideration of reports of the other auditors on separate financial statements and on the other financial information of subsidiaries referred to below in the Other matters paragraph, the aforesaid consolidated financial statements give the information required by the Act in the manner so required and give a true and fair view in conformity with the accounting principles generally accepted in India, of the consolidated state of affairs of the Group and its associate as at 31 March 2018 and their consolidated profit, consolidated total comprehensive income, their consolidated cash flows and the consolidated changes in equity for the year ended on that date.
5. Other matters
(a) We did not audit the financial statements of nineteen subsidiaries (including one subsidiary liquidated during the year) whose financial statements reflect total assets of ` 296,175 lakhs as at 31 March 2018, total revenues of ` 188,335 lakhs, total net profit after tax of ` 20,541 lakhs, total comprehensive income of ` 20,880 lakhs and total cash inflows of ` 4,385 lakhs for the year ended on that date, as considered in the consolidated financial statements. These financial statements have been audited by other auditors whose reports have been furnished to us by the management and our opinion on the consolidated financial statements in so far as it relates to the amounts and disclosures included in respect of these subsidiaries and our report in terms of Section 143(3) of the Act, in so far as it relates to these subsidiaries, is based solely on the reports of the other auditors.
(b) The consolidated financial statements include Group’s share of net loss after tax of ` 104 lakhs for the year ended 31 March 2018, as considered in these consolidated financial statements, in respect of an associate whose financial statements have not been audited by us. These financial statements are unaudited and have been furnished to us by the management and our opinion on the consolidated financial statements, in so far as it relates to the aforesaid associate and our report in terms of Section 143(3) of the Act, in so far as it relates to the aforesaid associate, is based solely on such unaudited financial statements.
Our opinion on the consolidated financial statements and our Report on Other Legal and Regulatory Requirements below is not modified in respect of the above matters with respect to our reliance on the work done and the reports of the other auditors and the financial statements certified by the management.
(c) The comparative financial information of the Group and its associate for the year ended 31 March 2017 included in these consolidated financial statements, have been audited by the predecessor auditor. The report of the predecessor auditor on the comparative financial information dated 23 May 2017 expressed an unmodified opinion which has been relied upon by us.
6. Report on Other Legal and Regulatory Requirements
As required by Section 143(3) of the Act, we report, that:
(a) We have sought and obtained all the information and explanations which to the best of our knowledge and belief were necessary for the purposes of our audit of the aforesaid consolidated financial statements;
(b) In our opinion, proper books of account as required by law relating to the preparation of the aforesaid consolidated financial statements have been kept so far as it appears from our examination of those books;
(c) The consolidated balance sheet, the consolidated statement of profit and loss (including other comprehensive income), the consolidated statement of cash flows and the consolidated statement of changes in equity dealt with by this Report are in agreement with the relevant books of account maintained for the purpose of preparation of the consolidated financial statements;
(d) In our opinion, the aforesaid consolidated financial statements comply with the Indian Accounting Standards specified under Section 133 of the Act read with the Companies (Indian Accounting Standards) Rules, 2015, as amended;
(e) On the basis of written representations received from the Directors of the Holding Company as on 31 March 2018 and taken on record by the Board of Directors of the Holding Company, none of the

129Annual Report 2017-18
Directors of the Holding Company is disqualified as on 31 March 2018 from being appointed as a director in terms of Section 164(2) of the Act; and
(f) With respect to the other matters to be included in the Auditor’s Report in accordance with Rule 11 of the Companies (Audit and Auditors) Rules, 2014, in our opinion and to the best of our information and according to the explanations given to us:
i. The consolidated financial statements disclose the impact of pending litigations on the consolidated financial position of the Group;
ii. The Group did not have any long-term contracts including derivative contracts
having any material foreseeable losses; and
iii. There has been no delay in transferring the amounts, required to be transferred, to the Investor Education and Protection Fund by the Holding Company.
For Ford Rhodes Parks & Co. LLPChartered Accountants
Firm Registration Number 102860W/W100089
Ramaswamy SubramanianPartner
Membership Number 016059
Mumbai, 26 April 2018

130
Consolidated Balance Sheet as at 31 March 2018
As per our attached report of even date For and on behalf of the Board
For Ford Rhodes Parks & Co. LLP Chartered AccountantsFirm Registration Number 102860W/W100089
Ashok GoelChairman & Managing Director
A.V. GanapathyChief Financial Officer
Boman Moradian
DirectorsRamaswamy SubramanianPartnerMembership Number 016059
Mukund M. Chitale Suresh SavaliyaCompany Secretary & Head - LegalRadhika Pereira
Atul Goel
Place: MumbaiDate: 26 April 2018
{(` in lakhs)
Note 2018 2017AssetsNon-current assets(a) Property, plant and equipment 4(a) 112,343 111,668(b) Capital work-in-progress 4(b) 3,205 1,144(c) Goodwill 1,423 1,423(d) Other intangible assets 4(c) 4,650 4,855(e) Intangible assets under development 4(d) 961 789
122,582 119,879(f) Investments accounted for using the equity method 5 1,310 1,526(g) Financial assets
(i) Loans 6 1,358 2,453(ii) Others 7 20 29
1,378 2,482(h) Deferred tax assets (net) 56 (c) 543 904(i) Non-current tax assets (net) 8 2,123 2,107(j) Other non-current assets 9 4,125 2,574Total non-current assets 132,061 129,472
Current assets(a) Inventories 10 28,639 24,598(b) Financial assets
(i) Trade receivables 11 45,904 37,662(ii) Cash and cash equivalents 12 11,574 8,203(iii) Bank balances other than cash and cash equivalents 13 5,784 2,081(iv) Loans 14 11,278 11,198(v) Others 15 239 200
(c) Current tax assets (net) 16 78 262(d) Other current assets 17 9,903 12,194Total current assets 113,399 96,398
Total assets 245,460 225,870
Equity and liabilitiesEquity(a) Equity share capital 18 3,145 3,143(b) Other equity 19 121,914 100,756(c) Non-controlling interest 430 572Total equity 125,489 104,471
LiabilitiesNon-current liabilities(a) Financial liabilities Borrowings 20 44,922 60,496(b) Provisions 21 2,359 2,330(c) Deferred tax liabilities (net) 56 (c) 3,566 4,076Total non-current liabilities 50,847 66,902
Current liabilities(a) Financial liabilities
(i) Borrowings 22 14,505 8,688(ii) Trade payables 23 18,842 14,732(iii) Others 24 29,504 25,944
(b) Other current liabilities 25 3,214 2,822(c) Provisions 26 592 644(d) Current tax liabilities (net) 27 2,467 1,667Total current liabilities 69,124 54,497
Total equity and liabilities 245,460 225,870Notes forming part of the consolidated financial statements 1 - 62

131Annual Report 2017-18
ConsolidatedStatementofProfitandLoss for the year ended 31 March 2018
(` in lakhs) Note 2018 2017
IncomeRevenue from operations 28 244,642 238,794 Other income 29 1,318 2,033 Interest income 30 1,319 1,497 Total income 247,279 242,324
ExpensesCost of materials consumed 31 105,341 101,213 Changes in inventories of finished goods and goods-in-process 32 (1,681) (424)Excise duty on sale of goods 51 2,254 8,565 Employee benefits expense 33 43,390 40,521 Finance costs 34 5,491 5,812 Depreciation and amortisation expense 35 16,707 14,148 Other expenses 36 48,863 46,730 Total expenses 220,365 216,565
Profitbeforeshareofprofit/(loss)ofanassociate/jointventuresand exceptional items
26,914 25,759
Share of profit /(loss) of an associate and joint ventures (104) 105 Profitbeforeexceptionalitemsandtax 26,810 25,864 Exceptional items (net) 44 498 (1,565)Profitbeforetax 26,312 27,429 Tax expense 56Current tax 9,124 7,084 Deferred tax charge/(credit) (233) 785 Total tax expense 8,891 7,869
Profitfortheyear 17,421 19,560
Othercomprehensiveincome(OCI)Itemsthatwillnotbereclassifiedtoprofitorloss- Remeasurement gains/(losses) on defined benefit plan 52 (75) (222) Income tax effect on above 29 75 - Capital reserve on bargain purchase 54 - 7 - Share of OCI of associate (36) (11) Income tax effect on above 7 3
(75) (148)ItemsthatwillbereclassifiedtoprofitorlossExchange differences on translation of - Financial statements of foreign operations 8,873 (7,991)- Share of associate 2 (2)
8,875 (7,993)
Othercomprehensiveincome/(loss)fortheyear 8,800 (8,141)
Total comprehensive income for the year 26,221 11,419

132
(` in lakhs) Note 2018 2017
Total comprehensive income attributable to: Owners of the parent 25,942 11,442 Non-controlling interest 279 (23)
Of the total comprehensive income above,profit for the year attributable to: Owners of the parent 17,160 19,032 Non-controlling interest 261 528
Of the total comprehensive income above, other comprehensive income / (loss) for the year attributable to: Owners of the parent 8,782 (7,590) Non-controlling interest 18 (551)
Earnings per equity share of ` 2 each fully paid up 45Basic (`) 10.92 12.12 Diluted (`) 10.89 12.05
Notes forming part of the consolidated financial statements 1 - 62
As per our attached report of even date For and on behalf of the Board
For Ford Rhodes Parks & Co. LLP Chartered AccountantsFirm Registration Number 102860W/W100089
Ashok GoelChairman & Managing Director
A.V. GanapathyChief Financial Officer
Boman Moradian
DirectorsRamaswamy SubramanianPartnerMembership Number 016059
Mukund M. Chitale Suresh SavaliyaCompany Secretary & Head - LegalRadhika Pereira
Atul Goel
Place: MumbaiDate: 26 April 2018
{
ConsolidatedStatementofProfitandLoss for the year ended 31 March 2018

133Annual Report 2017-18
Consolidated Statement of changes in equity for the year ended 31 March 2018
A Eq
uity
shar
e cap
ital
(` in
lakh
s)No
teBa
lanc
e as a
t 1 A
pril
2016
*18
3,
142
Chan
ges i
n eq
uity
shar
e cap
ital
1
Bala
nce a
s at 3
1 Mar
ch 20
17 3,
143
Chan
ges i
n eq
uity
shar
e cap
ital
2
Bala
nce a
s at 3
1 Mar
2018
18
3,14
5 * i
nclu
ding
forfe
ited
shar
es o
f ` 1
lakh
[Ref
er n
ote 1
8(h)
]
B Ot
her e
quity
(` in
lakh
s)
Note
Capi
tal
rese
rve
Capi
tal
rese
rve o
n Co
nsol
idat
ion
Secu
ritie
s pr
emiu
m
rese
rve
Debe
ntur
e re
dem
ptio
n re
serv
e
Lega
l re
serv
e
Shar
e op
tions
ou
tsta
ndin
g ac
coun
t
Gene
ral
rese
rve
Reta
ined
ea
rnin
gs
Fore
ign
curr
ency
tr
ansla
tion
rese
rve
Attr
ibut
able
to
ow
ners
of
the p
aren
t
Non
cont
rolli
ng
inte
rest
Tota
l
Bala
nce a
s at 1
Apr
il 20
16 4,
012
55,3
14 10
,893
1,50
0 1,
598
722
545
18,5
55 19
7 93
,336
814
94,1
50Pr
ofit f
or th
e yea
r -
- -
- -
- -
19,0
32 -
19,0
32 5
28 1
9,560
Othe
r com
preh
ensiv
e in
com
e 7
- -
- -
- -
(155
) (7
,442)
(7,59
0) (5
51)
(8,14
1)
Tota
l com
preh
ensiv
e in
com
e for
the y
ear
7 -
- -
- -
- 18
,877
(7,442
) 11
,442
(23)
11,4
19
Purs
uant
to th
e sch
eme o
f am
algam
atio
n41
996
- -
- -
- -
39
- 1
,035
- 1
,035
Expe
nses
incu
rred
in
conn
ectio
n wi
th th
e sch
eme
of am
algam
atio
n
41 (9
96)
- -
- -
- -
- -
(996
) -
(996
)
Shar
e opt
ions
exer
cised
19 &
53
- -
69
- -
- -
- -
69
- 6
9
Shar
e bas
ed p
aym
ents
ex
pens
e (ne
t)19
&
53 -
- -
- -
28
- -
- 2
8 -
28
Tran
sferre
d fro
m sh
are
optio
ns o
utst
andi
ng ac
coun
t on
exer
cise o
f opt
ion
19 &
53
- -
25
- -
(25)
- -
- -
- -
Tran
sfer t
o de
bent
ure
rede
mpt
ion
rese
rve
19 -
- -
750
- -
- (7
50)
- -
- -
Tran
sfer t
o leg
al re
serv
e19
- -
- -
607
- -
(607
) -
- -
-Eq
uity
divi
dend
48 -
- -
- -
- -
(3,45
5) -
(3,45
5) -
(3,45
5)Ta
x on
equi
ty d
ivide
nd48
- -
- -
- -
- (7
03)
- (7
03)
- (7
03)
Divid
end
to n
on-co
ntro
lling
inte
rest
- -
- -
- -
- -
- -
(219
) (2
19)
Bala
nce a
s at 3
1 Mar
ch
2017
4,01
9 55
,314
10,9
87 2,
250
2,20
5 72
5 54
5 31
,956
(7,245
) 10
0,75
6 57
2 10
1,32
8

134
(` in
lakh
s)
Note
Capi
tal
rese
rve
Capi
tal
rese
rve o
n Co
nsol
idat
ion
Secu
ritie
s pr
emiu
m
rese
rve
Debe
ntur
e re
dem
ptio
n re
serv
e
Lega
l re
serv
e
Shar
e op
tions
ou
tsta
ndin
g ac
coun
t
Gene
ral
rese
rve
Reta
ined
ea
rnin
gs
Fore
ign
curr
ency
tr
ansla
tion
rese
rve
Attr
ibut
able
to
ow
ners
of
the p
aren
t
Non
cont
rolli
ng
inte
rest
Tota
l
Profi
t for
the y
ear
- -
- -
- -
- 1
7,160
- 1
7,160
261
17,4
21Ot
her c
ompr
ehen
sive
inco
me
- -
- -
- -
- (7
5) 8
,359
8,28
4 1
8 8
,302
Exch
ange
loss
recla
ssifi
ed to
th
e con
solid
ated
stat
emen
t of
pro
fit an
d lo
ss o
n liq
uida
tion
of su
bsid
iary
44 -
- -
- -
- -
- 4
98 4
98 -
498
Tota
l com
preh
ensiv
e in
com
e for
the y
ear
- -
- -
- -
- 17
,085
8,85
7 25
,942
279
26,2
21
On ac
coun
t of l
iqui
datio
n of
su
bsid
iary
- -
- -
- -
- -
- -
(167
) (1
67)
Shar
e opt
ions
exer
cised
19 &
53
- -
96
- -
- -
- -
96
- 9
6
Shar
e bas
ed p
aym
ents
: -
- -
- -
- -
- -
Sh
are b
ased
pay
men
t cr
edit
(net
) -
- (3
42)
- (3
42)
(342
)
Tr
ansfe
rred
to
reta
ined
earn
ings
on
forfe
iture
of v
este
d op
tions
19 &
53
- -
- -
- (1
5) -
15
- -
- -
Tran
sferre
d fro
m sh
are
optio
ns o
utst
andi
ng ac
coun
t on
exer
cise o
f opt
ion
19 &
53
- -
35
- -
(35)
- -
- -
- -
Tran
sfer t
o leg
al re
serv
e19
- -
- -
649
- -
(649
) -
- -
Equi
ty d
ivide
nd48
- -
- -
- -
- (3
,770)
- (3
,770)
- (3
,770)
Tax o
n eq
uity
divi
dend
48 -
- -
- -
- -
(768
) -
(768
) -
(768
)Di
viden
d to
non
-cont
rollin
g in
tere
st -
- -
- -
- -
- -
- (2
54)
(254
)
Balan
ce as
at 31
Mar
ch 20
18 4,
019
55,3
14 11
,118
2,25
0 2,
854
333
545
43,8
69 1,
612
121,
914
430
122,
344
Consolidated Statement of changes in equity
for the year ended 31 March 2018
As p
er o
ur a
ttac
hed
repo
rt o
f eve
n da
teFo
r an
d on
beh
alf o
f the
Boa
rd
For
Ford
Rho
des
Park
s &
Co.
LLP
Ch
arte
red
Acco
unta
nts
Firm
Reg
istr
atio
n N
umbe
r 10
2860
W/W
1000
89
Ash
ok G
oel
Chai
rman
& M
anag
ing
Dir
ecto
rA
.V. G
anap
athy
Chie
f Fin
anci
al O
ffice
r
Bom
an M
orad
ian
Dir
ecto
rsRa
mas
wam
y Su
bram
ania
nPa
rtne
rM
embe
rshi
p N
umbe
r 01
6059
Muk
und
M. C
hita
leSu
resh
Sav
aliy
aCo
mpa
ny S
ecre
tary
& H
ead
- Leg
alRa
dhik
a Pe
reir
aA
tul G
oel
Plac
e: M
umba
iD
ate:
26
Apri
l 201
8
{
Notes forming part of the consolidated financial statements
135Annual Report 2017-18
1 Corporate information
Essel Propack Limited (hereinafter referred to as “EPL” or the “Company” or the “parent company”) is domiciled and incorporated in India and its shares are publicly traded on the National Stock Exchange (NSE) and Bombay Stock Exchange (BSE) in India. The Company’s registered office is located at P.O. Vasind, Taluka: Shahapur, District: Thane, Maharashtra - 421604, India.
The Company alongwith its subsidiaries (the “Group”), joint ventures (upto 30 September 2016) and associate is engaged in manufacture of plastic packaging material in the form of multilayer collapsible tubes and laminates used primarily for packaging of consumer products in the Beauty & Cosmetics, Health & Pharmaceuticals, Food, Home and Oral care categories.
The Consolidated Financial Statements (hereinafter referred to as ‘CFS’) of the group, its joint ventures (upto 30 September 2016) and associate for the year ended 31 March 2018 were authorised for issue by the Board of Directors at their meeting held on 26 April 2018.
2 Basisofpreparationofconsolidatedfinancialsstatements
a) The CFS have been prepared to comply in all material respects with the Indian Accounting Standards (Ind AS) notified under Section 133 of Companies Act, 2013 (the Act) read with Companies (Indian Accounting Standards) Rules, 2015 (as amended) and other relevant provisions of the Act and rules framed thereunder and guidelines issued by Securities and Exchange Board of India (SEBI).
The CFS have been prepared under the historical cost convention and on accrual basis, except for certain financial assets and liabilities (including derivative instruments), defined benefit plan assets and liabilities, and share based payments being measured at fair value.
Fair value is the price that would be received to sell an asset or paid to transfer a liability in an orderly transaction between market participants at the measurement date, regardless of whether that price is directly observable or estimated using another valuation technique. In estimating the fair value of an asset or a liability, the Company takes into account the characteristics of the asset or liability if market participants would take those characteristics into account when pricing the asset or a liability at the measurement date.
The CFS are presented in Indian Rupees (‘INR’) with values rounded off to the nearest lakhs (00,000), except otherwise indicated. ‘’0” Zero denotes amount less than a lakh.
b) Currentandnon-currentclassification
Assets and liabilities are classified as current if expected to realise or settle within twelve months after the balance sheet date. Deferred tax assets and liabilities are classified as non-current assets and liabilities.
3 (A) Principlesofconsolidationandequityaccounting
i) Subsidiaries
a) The consolidated financial statements incorporate the financial statements of EPL and its subsidiaries.
b) Subsidiaries are all entities over which the group has control. The group controls an entity when the group is exposed to, or has rights to, variable returns from its involvement with the entity and has the ability to affect those returns through its power to direct the relevant activities of the entity. Subsidiaries are fully consolidated from the date on which control is transferred to the group. They are deconsolidated from the date on which control ceases.
c) The group combines the financial statements of the parent and its subsidiaries line by line adding together like items of assets, liabilities, equity, income and expenses. Intercompany transactions, balances and unrealised gains on transactions between group companies are eliminated. Unrealised losses are also eliminated unless the transaction provides evidence of an impairment of the transferred asset. The financial

Notes forming part of the consolidated financial statements
136
statements of the parent company and its subsidiaries have been consolidated using uniform accounting policies. When necessary, adjustments are made to the financial statements of the subsidiaries to bring their accounting policies in line with the Group’s accounting policies. The financial statements of the subsidiary companies used in the consolidation are drawn upto the same reporting date as that of the parent i.e. year ended 31 March 2018.
d) Non-controlling interests in the results and equity of subsidiaries are shown separately in the consolidated statement of profit and loss, consolidated statement of changes in equity and consolidated balance sheet respectively.
e) Listed below are the subsidiaries considered in the CFS. Subsidiaries are consolidated from the date on which effective control is acquired and are excluded from the date that control ceases.
Name of the Subsidiaries
Proportionofinterest(includingbeneficialinterest)/votingpower(eitherdirectly/indirectlythrough
subsidiaries)
Country of incorporation
Direct Subsidiaries 2018 2017Arista Tubes, Inc. * 100% 100% United States of
AmericaLamitube Technologies (Cyprus) Limited 100% 100% CyprusLamitube Technologies Limited 100% 100% MauritiusStep down SubsidiariesEgyptian Indian Company for Modern Packaging S.A.E.#
--- 75% Egypt
Essel Propack Misr for Advanced Packaging S.A.E.
75% 75% Egypt
Lamitube Hongkong Trading Company Limited #
--- 100% Hong Kong
Essel Packaging (Guangzhou) Limited 100% 100% ChinaEssel Packaging (Jiangsu) Limited 100% 100% ChinaEssel Propack Philippines, Inc. 100% 100% PhilippinesMTL de Panama, S.A. 100% 100% PanamaArista Tubes Limited 100% 100% United KingdomEssel Propack UK Limited 100% 100% United KingdomEssel Deutschland Management GmbH ## 100% 100% GermanyEssel Deutschland GmbH & Co. KG ## 100% 100% GermanyEssel de Mexico, S.A. de C.V. 100% 100% MexicoTubopack de Colombia S.A.S. 100% 100% ColombiaEssel Colombia S.A.S. 100% 100% ColombiaEssel Propack LLC 100% 100% RussiaEssel Propack Polska sp. z.o.o. 100% 100% PolandEssel Propack America, LLC 100% 100% United States of
America
* 7.35% is held through Lamitube Technologies (Cyprus) Limited
# Liquidated / deregistered during the year.
## Ceased to be Joint ventures and became wholly owned subsidiaries w.e.f. 30 September 2016 (Refer note 3A(ii)(d))

Notes forming part of the consolidated financial statements
137Annual Report 2017-18
ii) AssociateandJointventures
a) Associate is an entity over which the group has significant influence but not control or joint control. This is generally the case where the group holds between 20% and 50% of the voting rights. Investment in associate is accounted for using the equity method of accounting, after initially being recognised at cost.
b) Under Ind AS 111 “Joint Arrangements”, investments in joint arrangements are classified as either joint operations or joint ventures. The classification depends on the contractual rights and obligations of each investor, rather than the legal structure of the joint arrangement. The group had interest in joint ventures (upto 30 September 2016) that were accounted for using the equity method after initially being recognised at cost in the consolidated balance sheet.
c) Under the equity method of accounting, the investments are initially recognised at cost and adjusted thereafter to recognise the group’s share of the post-acquisition profits or losses of the investee in profit and loss, and the group’s share of other comprehensive income of the investee in other comprehensive income. Dividends received or receivable from associates and joint ventures are recognised as a reduction in the carrying amount of investments.
When the group’s share of losses in an equity-accounted investment equals or exceeds its interest in the entity, including any other unsecured long-term receivables, the group does not recognise further losses, unless it has incurred obligations or made payments on behalf of the other entity.
Unrealised gains on transactions between the group and its associates and joint ventures are eliminated to the extent of the group’s interest in these entities. Unrealised losses are also eliminated unless the transaction provides evidence of an impairment of the asset transferred. Accounting policies of equity accounted investees have been changed where necessary to ensure consistency with the policies adopted by the group.
The carrying amount of equity accounted investments are tested for impairment.
d) List of investments in associate and joint ventures accounted for using “Equity method” is as under:
NameoftheJointVenture/Associate Extent of holding Relationship Country of
Incorporation2018 2017
Essel Deutschland Management GmbH ##
--- --- Joint Venture Germany
Essel Deutschland GmbH & Co. KG ## --- --- Joint Venture GermanyP.T. Lamipak Primula 30.0% 30.0% Associate Indonesia
## Ceased to be joint ventures (extent of holding 24.9%) and became wholly owned subsidiaries w.e.f. 30 September 2016
3 (B) Significantaccountingpolicies
a. Property, plant and equipment
i) Free hold land is carried at cost. Other property, plant and equipment are stated at original cost of acquisition / installation (net of Goods and Services Tax / cenvat credit availed) less accumulated depreciation and impairment loss, if any. Cost includes cost of acquisition, construction and installation, taxes, duties, freight and other incidental expenses that are directly attributable to bringing the asset to its working condition for the intended use and estimated cost for decommissioning of an asset. Further, in respect of accounting periods commencing on or after 7 December 2006, exchange differences arising on revaluation of long-term foreign currency monetary items recognised in the consolidated financial statements till the period ending 31 March 2016 at rates different from those at which they were initially recorded during the period

Notes forming part of the consolidated financial statements
138
or reported in the previous financial statements, are added to or deducted from the cost of the assets and depreciated over the balance life of the asset, where these monetary items pertain to the acquisition of depreciable property, plant and equipment.
ii) Capital work-in-progress comprises cost of property, plant and equipment and related expenses that are not yet ready for their intended use at the reporting date.
iii) On transition to Ind AS, the group had elected to continue with the carrying value of all of its property, plant and equipment recognised as at 1 April 2015 measured as per the previous GAAP and use that carrying value as the deemed cost of the property, plant and equipment.
Depreciation on property, plant and equipment
i) In case of parent company
Depreciation on property, plant and equipment is provided to the extent of depreciable amount on straight-line method over the useful life of asset as specified in Part-C of Schedule II to the Act. Depreciation is charged on pro-rata basis for asset purchased / sold during the year. Depreciation on the following assets is provided considering a shorter useful life as compared to Schedule II useful life, based on the management estimate in view of possible technology obsolescence and product life cycle implications.
Assets Useful LifeTooling, Moulds, Dies 7 YearsHydraulic works, Pipelines and Slucies (HWPS) 10 YearsOverhauling of plant and machinery 5 Years
ii) Incaseofsubsidiaries,associateandjointventures
Depreciation on property, plant and equipment is provided at the rates adopted in the accounts of respective subsidiaries, associate and joint ventures as permissible under local laws on straight line basis from the time they are available for use, so as to write off their cost over the estimated useful life of the assets.
iii) Property, plant and equipment acquired under finance leases is depreciated over the asset’s useful life or over the shorter of the asset’s useful life and the lease term if there is no reasonable certainty that the group will obtain ownership at the end of the lease term.
iv) Premium on leasehold land and leasehold improvements are amortised over the normal period of lease.
b. Intangible assets
i) Intangible assets are stated at cost of acquisition less accumulated amortisation. The useful lives of intangible assets are assessed as either finite or indefinite. Intangible assets with finite lives are amortised on a straight-line basis over the useful economic life and assessed for impairment whenever there is an indication that the intangible asset may be impaired. The amortisation expense on intangible assets with finite lives is recognised in the consolidated statement of profit and loss.
ii) On transition to Ind AS, the group had elected to continue with the carrying value of all of its intangible assets recognised as at 1 April 2015 measured as per the previous GAAP and use that carrying value as the deemed cost of the intangible assets.
iii) Intangibles assets with finite lives are amortised as follows:
- Softwares : ERP software 10 years and others 3 years
- Patents and commercial rights : 10 years

Notes forming part of the consolidated financial statements
139Annual Report 2017-18
c. Impairmentofnon-financialassets
i) Goodwill is not subject to amortisation and is tested annually for impairment, or more frequently if events or change in circumstances indicate that they might be impaired.
ii) The carrying amounts of other non-financial assets are reviewed at each balance sheet date if there is any indication of impairment based on internal / external factors. An asset is treated as impaired when the carrying amount exceeds its recoverable value. The recoverable amount is the greater of the asset’s net selling price and value in use. In assessing value in use, the estimated future cash flows are discounted to the present value using a pre-tax discount rate that reflects current market assessment of the time value of money and risks specific to the assets. An impairment loss is charged to the consolidated statement of profit and loss in the year in which an asset is identified as impaired. After impairment, depreciation / amortisation is provided on the revised carrying amount of the asset over its remaining useful life. The impairment loss recognized in prior accounting periods is reversed by crediting the consolidated statement of profit and loss if there has been a change in the estimate of recoverable amount.
d. Borrowing costs
Borrowing costs that are attributable to the acquisition or construction of qualifying assets are capitalised as part of the cost of such assets. A qualifying asset is one that necessarily takes substantial period of time to get ready for intended use. Ancillary costs incurred in connection with the arrangement of borrowings are amortised over the tenure of such borrowings. All other borrowing costs are charged to the consolidated statement of profit and loss as finance costs. Borrowing costs also include exchange differences to the extent regarded as an adjustment to the borrowing costs, in terms of Ind AS 23.
e. Financial assets
i) Recognition and measurement
The group at initial recognition measures a financial asset at its fair value plus transaction costs that are directly attributable to it’s acquisition. However, transaction costs relating to financial assets to be subsequently valued at fair value through profit or loss (FVTPL) are expensed in the consolidated statement of profit and loss for the year.
The group subsequently recognises its financial assets either at FVTPL, fair value through other comprehensive income (FVOCI) or at amortised cost, based on the group’s business model for managing the financial assets and their contractual cash flows. This has been explained below separately for debt instruments and equity instruments.
Debt instruments
Amortised cost: Assets that are held for collection of contractual cash flows where those cash flows represent solely payments of principal and interest are measured at amortised cost. A gain or loss on such instruments is recognised in the consolidated statement of profit and loss when the asset is derecognised or impaired. Interest income from these financial assets is included in interest income using the effective interest rate method.
Fairvaluethroughothercomprehensiveincome(FVOCI): Assets that are held for collection of contractual cash flows and for selling, where the assets’ cash flows represent solely payments of principal and interest, are measured at fair value through other comprehensive income (FVOCI). Movements in the carrying amount are taken through OCI, except for the recognition of impairment gains or losses, interest revenue and foreign exchange gains and losses which are recognised in the consolidated statement of profit and loss. When the financial asset is derecognised, the cumulative gain or loss previously recognised in OCI is reclassified from equity to consolidated statement of profit and loss. Interest income from these financial assets is included in interest income using the effective interest rate method.

Notes forming part of the consolidated financial statements
140
Fairvaluethroughprofitorloss(FVTPL): Assets that do not meet the criteria for amortised cost or fair value through other comprehensive income (FVOCI) are measured at fair value through profit or loss. Gain and losses on fair value of such instruments are recognised in the consolidated statement of profit and loss. Interest income from these financial assets is included in other income.
Equity instruments
The group subsequently measures all equity instruments (other than investment in associate) at fair value. Where the group’s management has elected to present fair value gains and losses on equity instruments in other comprehensive income, there is no subsequent reclassification of fair value gains and losses to the consolidated statement of profit and loss in the event of de-recognition. Impairment losses (and reversal of impairment losses) on equity instruments measured at FVOCI are not reported separately from other changes in fair value. Dividends from such investments are recognised in the consolidated statement of profit and loss as other income when the group’s right to receive payments is established. Changes in the fair value of financial assets at fair value through profit or loss are recognised in the consolidated statement of profit and loss.
ii) Impairmentoffinancialassets
The group assesses on a forward looking basis the expected credit losses associated with its assets carried at amortised cost and FVOCI debt instruments. The impairment methodology applied depends on whether there has been a significant increase in credit risk.
iii) De-recognitionoffinancialassets
A financial asset is derecognised only when
• The group has transferred the rights to receive cash flows from the financial asset or
• retains the contractual rights to receive the cash flows of the financial asset, but assumes a contractual obligation to pay the cash flows to one or more recipients.
Where the entity has transferred an asset, the group evaluates whether it has transferred substantially all risks and rewards of ownership of the financial asset. In such cases, the financial asset is derecognised. Where the entity has not transferred substantially all risks and rewards of ownership of the financial asset, the financial asset is not derecognised.
Where the entity has neither transferred a financial asset nor retains substantially all risks and rewards of ownership of the financial asset, the financial asset is derecognised if the group has not retained control of the financial asset. Where the group retains control of the financial asset, the asset is continued to be recognised to the extent of continuing involvement in the financial asset.
f. Derivatives and embedded derivatives
i) The group enters into certain derivative contracts (mainly foreign exchange forward contracts) to hedge risks, which are not designated as “hedges”. Such contracts are accounted for at fair value through profit or loss and are recognised in the consolidated statement of profit and loss.
ii) Derivatives embedded in a host contract that are assets within the scope of Ind AS 109 or are closely related to the host contract, are not separated. Derivatives embedded in all other host contracts are separated only if the economic characteristics and risks of the embedded derivative are not closely related to the economic characteristics and risks of the host and are measured at fair value through profit or loss.
g. Borrowingsandotherfinancialliabilities
i) Borrowings and other financial liabilities are initially recognised at fair value net of transaction costs incurred that are directly attributable to the acquisition of the financial liability.

Notes forming part of the consolidated financial statements
141Annual Report 2017-18
ii) Subsequently recognition is done at amortised cost using the effective interest rate (EIR) method. Gains and losses are recognised in the statement of profit and loss when the liabilities are derecognised as well as through the EIR amortization process. The EIR amortisation is included in finance costs in the consolidated statement of profit and loss.
iii) Borrowings and other financial liabilities are derecognised when the obligation specified in the contract is discharged, cancelled or expired. The difference between the carrying amount of a financial liability that has been extinguished or transferred to another party and the consideration paid, including any non-cash assets transferred or liabilities assumed, is recognised in the consolidated statement of profit and loss.
h. Employeebenefits
i) Short-termbenefits
Short-term employee benefits are recognized as an expense at the undiscounted amount in the consolidated statement of profit and loss for the year in which the related services are rendered.
ii) Definedbenefitplans
a) Post-employment and other long-term employee benefits are recognised as an expense in the consolidated statement of profit and loss for the year in which the employee has rendered services. The expense is recognised at the present value of the amount payable determined using actuarial valuation techniques.
b) Re-measurement of the net defined benefit liability, which comprises of actuarial gains and losses, the return on plan assets (excluding interest) and the effect of the asset ceiling (if any, excluding interest) are recognised in other comprehensive income in the period in which they occur.
iii) Definedcontributionplans
Payments to defined contribution retirement benefit schemes are charged to the consolidated statement of profit and loss of the year when the contribution to the respective funds are due. There are no other obligations other than the contribution payable to the fund.
i. Share based payments
Equity settled share based compensation benefits are provided to employees under the Essel Employee Stock Option Scheme 2014. The fair value of options granted under the Essel Employee Stock Option Scheme 2014 is recognised as an employee benefits expense with a corresponding increase in equity as “Share options outstanding account”. The total amount to be recognised is determined by reference to the fair value of the options granted:
- including any market performance conditions (e.g., the entity’s share price)
- excluding the impact of any service and non-market performance vesting conditions (e.g. profitability, sales growth targets and remaining an employee of the entity over a specified time period), and
- including the impact of any non-vesting conditions (e.g. the requirement for employees to hold shares for a specific period of time).
The total expenses are amortised over the vesting period, which is the period over which all of the specified vesting conditions are to be satisfied.
At the end of each period, the entity revises its estimates of the number of options that are expected to vest based on the service and non-market performance vesting conditions. It recognises the impact of the revision to original estimates, if any, in the consolidated statement of profit and loss, with a corresponding adjustment to equity. In case vested options are forfeited / expires unexercised, the related balance standing to the credit of the “Share options outstanding account” is transferred to ”Retained earnings”.

Notes forming part of the consolidated financial statements
142
j. Revenuerecognition
i) Revenue is measured at the fair value of consideration received or receivable. Revenue is recognised only when it can be reliably measured and it is probable that future economic benefits will flow to the group.
ii) Revenue from operations includes sale of goods, scrap, export incentives and income from royalty and service charges:
- Revenue from sale of goods is recognised when significant risk and rewards of ownership of the goods have passed to the customer. Amounts disclosed as revenue are inclusive of excise duty and net of returns, quality claims, discounts and value added tax / sales tax / goods and services tax.
- Income from royalty and service charges is recognised as per the agreed terms.
- Export incentives / benefits are accounted on accrual basis.
iii) Dividend income is recognised when right to receive the payment is established by the balance sheet date.
iv) Interest income for all debt instruments, measured at amortised cost or fair value through other comprehensive income, is recognised using the effective interest rate method and shown under interest income in the consolidated statement of profit and loss.
k. Government grants
i) Grants from the government are recognised at their fair value where there is a reasonable assurance that the grant will be received and the group will comply with all attached conditions.
ii) Government grants relating to income are deferred and recognised in the consolidated statement of profit and loss over the period necessary to match them with the costs that they are intended to compensate, and presented within other income.
iii) Government grants relating to the purchase of property, plant and equipment are included in non-current liabilities as deferred income and are credited to the consolidated statement of profit and loss on a straight-line basis over the expected lives of the related assets, and presented within other income.
l. Inventories
i) Inventories are valued at lower of cost or estimated net realisable value.
ii) Cost of raw materials, packing material and stores and spares are determined on moving average cost method.
iii) Cost of finished goods and goods-in-process includes cost of direct materials, labour and other manufacturing overheads.
m. Foreign currency transactions
i) Items included in the financial statements of each of the group’s entities are measured using the currency of the primary economic environment in which the entity operates (‘the functional currency’). The consolidated financial statements are presented in Indian rupee (INR), which is Essel Propack Limited’s functional and presentation currency.
Transactions denominated in foreign currencies are initially recorded in the functional currency at the exchange rate prevailing at the date of transaction.
ii) Monetary items denominated in foreign currencies at the year-end are restated at the closing rates. Non-monetary items which are carried in terms of historical cost denominated in a foreign currency are reported using the exchange rate at the date of transaction.

Notes forming part of the consolidated financial statements
143Annual Report 2017-18
iii) Exchange differences, in respect of accounting periods commencing on or after 7 December 2006, arising on reporting of long-term foreign currency monetary items recognised in the consolidated financial statements till the period ending 31 March 2016 at rates different from those at which they were initially recorded or reported in previous CFS, in so far as they relate to the acquisition of a depreciable capital asset, are added to or deducted from the cost of the asset and are depreciated over the balance life of the asset. Any other income or expense on account of exchange difference either on settlement or on restatement is recognised in the consolidated statement of profit and loss.
iv) The results and financial position of foreign operations (none of which has the currency of a hyperinflationary economy) that have a functional currency different from the presentation currency are translated into the presentation currency as follows:
- assets and liabilities are translated at the closing rate at the date of the balance sheet;
- income and expenses are translated at average exchange rates (unless this is not a reasonable approximation of the cumulative effect of the rates prevailing on the transaction dates, in which case income and expenses are translated at the dates of the transactions), and
- All resulting exchange differences are recognised in other comprehensive income.
v) When a foreign operation is sold, the associated exchange differences are reclassified to consolidated statement of profit and loss, as part of the gain or loss on sale.
vi) Fair value adjustments arising on the acquisition of a foreign operation are treated as assets and liabilities of the foreign operation and translated at the closing rate.
n. Income taxes
i) The income tax expense or credit for the period is the tax payable on the current period’s taxable income based on the applicable income tax rate adjusted by changes in deferred tax assets and liabilities attributable to temporary differences and to unused tax losses.
The current income tax charge is calculated on the basis of the tax laws enacted or substantially enacted at the end of the reporting period in the countries where the parent company and it’s subsidiaries, associate and joint ventures operate and generate taxable income.
ii) Deferred tax is provided in full, using the balance sheet approach, on temporary differences arising between the tax bases of assets and liabilities and their carrying amounts in the financial statements. However, deferred tax liabilities are not recognised if they arise from the initial recognition of goodwill. Deferred tax is also not accounted for if it arises from initial recognition of an asset or liability in a transaction other than a business combination that at the time of the transaction affects neither accounting profit nor taxable profit (tax loss). Deferred tax is determined using tax rates (and laws) that have been enacted or substantially enacted by the end of the reporting period and are expected to apply when the related deferred tax asset is realised or the deferred tax liability is settled.
iii) Deferred tax assets are recognised for all deductible temporary differences and unused tax losses only if it is probable that future taxable amounts will be available to utilise those temporary differences and losses.
iv) Deferred tax liabilities are not recognised for temporary differences between the carrying amount and tax bases of investments in subsidiaries, associate and joint ventures where the group is able to control the timing of the reversal of the temporary differences and it is probable that the differences will not reverse in the foreseeable future.
v) Deferred tax assets are not recognised for temporary differences between the carrying amount and tax bases of investments in subsidiaries, associate and joint ventures where it is not probable that the differences will reverse in the foreseeable future and taxable profit will not be available against which the temporary difference can be utilised.

Notes forming part of the consolidated financial statements
144
vi) Deferred tax assets and liabilities are offset when there is a legally enforceable right to offset current tax assets and liabilities and when the deferred tax balances relate to the same taxation authority. Current tax assets and tax liabilities are offset where the entity has a legally enforceable right to offset and intends either to settle on a net basis, or to realise the asset and settle the liability simultaneously.
vii) Current and deferred tax is recognised in the consolidated statement of profit and loss, except to the extent that it relates to items recognised in other comprehensive income or directly in equity. In this case, the tax is also recognised in other comprehensive income or directly in equity, respectively.
viii) Minimum Alternate Tax credit is recognised as deferred tax asset only when and to the extent there is convincing evidence that the Group will pay normal income tax during the specified period. Such asset is reviewed at each balance sheet date and the carrying amount of the MAT credit asset is written down to the extent there is no longer a convincing evidence to the effect that the Group will pay normal income tax during the specified period.
o. Leases
Leases where the group is a lessee and has substantially all the risks and rewards of ownership are classified as finance leases. Finance leases are capitalised at the lease’s inception at the fair value of the leased property or, if lower, the present value of the minimum lease payments. The corresponding rental obligations, net of finance charges, are included in borrowings or other financial liabilities as appropriate. Each lease payment is allocated between the liability and finance cost. The finance cost is charged to the consolidated statement of profit and loss over the lease period so as to produce a constant periodic rate of interest on the remaining balance of the liability for each period.
Leases in which a significant portion of the risks and rewards of ownership are not transferred to the group as lessee are classified as operating leases. Payments made under operating leases (net of any incentives received from the lessor) are charged to the consolidated statement of profit and loss on a straight-line basis over the period of the lease unless the payments are structured to increase in line with expected general inflation to compensate for the lessor’s expected inflationary cost increases.
p. Business combinations
Business combinations are accounted for using the acquisition method as per Ind AS 103, “Business Combinations”. The cost of an acquisition is measured at the fair value of the assets transferred, equity instruments issued and liabilities incurred or assumed at the date of acquisition, which is the date on which control is transferred to the group. The cost of acquisition also includes the fair value of any contingent consideration. Identifiable assets acquired and liabilities and contingent liabilities assumed in a business combination are measured initially at their fair value on the date of acquisition. Business combinations between entities under common control is accounted for at carrying value. Transaction costs that the group incurs in connection with a business combination such as finder’s fees, legal fees, due diligence fees, and other professional and consulting fees are expensed as incurred.
q. Earnings per share
Basic earnings per share are calculated by dividing the net profit or loss (excluding other comprehensive income) for the year attributable to owners of the parent by the weighted average number of equity shares outstanding during the year. The weighted average number of equity shares outstanding during the year is adjusted for events such as bonus issue, bonus element in a right issue, shares split and reserve share splits (consolidation of shares) that have changed the number of equity shares outstanding, without a corresponding change in resources. For the purpose of calculating diluted earnings per share, the net profit or loss (excluding other comprehensive income) for the year attributable to owners of the parent and the weighted average number of shares outstanding during the year are adjusted for the effects of all dilutive potential equity shares.

Notes forming part of the consolidated financial statements
145Annual Report 2017-18
r. Provisions, contingent liabilities and contingent assets
i) Provisions are recognised when there is a present legal or constructive obligation as a result of past events and it is probable that an outflow of resources will be required to settle the obligation and the amount can be reliably estimated. Provisions are not recognised for future operating losses.
Provisions are measured at the present value of management’s best estimate of the expenditure required to settle the present obligation at the end of the reporting period. The discount rate used to determine the present value is a pre-tax rate that reflects current market assessments of the time value of money and the risks specific to the liability. The increase in the provision due to the passage of time is recognised as interest expense.
ii) A contingent liability is a possible obligation that arises from past events whose existence will be confirmed by the occurrence or non-occurrence of one or more uncertain future events beyond the control of the group or a present obligation that is not recognized because it is not probable that an outflow of resources will be required to settle the obligation or the amount of the obligation cannot be measured with sufficient reliability. The group does not recognize a contingent liability but discloses its existence in the consolidated financial statements.
iii) A contingent asset is a possible asset that arises from past events and whose existence will be confirmed only by the occurrence or non-occurrence of one or more uncertain future events not wholly within the control of the group. The group does not recognize a contingent asset but discloses its existence in the consolidated financial statements.
s. Dividend
Provision is made for the amount of any dividend declared on or before the end of the reporting period but remaining undistributed at the end of the reporting period, where the same has been appropriately authorised and is no longer at the discretion of the entity.
t. Contributed equity
Equity shares are classified as equity. Post transition to Ind AS with effect from 1 April 2015, incremental costs directly attributable to the issue of new shares or options are shown in equity as a deduction, net of tax, from the proceeds.
u. Cash and cash equivalents
Cash and cash equivalent in the balance sheet comprise cash at bank and on hand and short term deposit with original maturity upto three months, which are subject to insignificant risk of changes in value.
For the purpose of presentation in the consolidated statement of cash flows, cash and cash equivalents consists of cash and short term deposit, as defined above, net of outstanding bank overdraft but including other short-term, highly liquid investments with original maturities of three months or less that are readily convertible to known amounts of cash and which are subject to an insignificant risk of changes in value.
v. Exceptional items
Certain occasions, the size, type, or incidences of the item of income or expenses pertaining to the ordinary activities of the Group is such that its disclosure improves the understanding of the performance of the group, such income or expenses is classified as an exceptional item and accordingly, disclosed in the consolidated financial statements.
3 (C) Significantestimates,judgementsandassumptions
The preparation of CFS in conformity with Ind AS requires the management to make estimates, assumptions and exercise judgement in applying the accounting policies, that affect the reported amount of assets, liabilities and disclosure of contingent liabilities at the date of financial statements and the reported amounts of income and expenses during the year.

Notes forming part of the consolidated financial statements
146
The management believes that these estimates are prudent and reasonable and are based on the management’s best knowledge of current events and actions. Actual results could differ from these estimates and differences between actual results and estimates are recognised in the periods in which the results are known or materialised.
This note provides an overview of the areas that involved a higher degree of judgement or complexity, and of items which are more likely to be materially adjusted due to estimates and assumptions turning out to be different than those originally assessed.
i) Definedbenefitobligation The cost of post-employment and other long-term benefits is determined using actuarial valuations. An
actuarial valuation involves making various assumptions that may differ from actual developments in the future. These include determination of discount rates, expected rate of return on assets, future salary increases and mortality rates. Due to the complexities involved in the valuation and its long-term nature, a defined benefit obligation is highly sensitive to changes in these assumptions. All assumptions are reviewed at each reporting date. The assumptions used are disclosed in note 52.
ii) Fairvalueoffinancialinstruments The fair value of financial instruments that are not traded in an active market is determined using valuation
techniques. In applying the valuation techniques, management makes maximum use of market inputs and uses estimates and assumptions that are, as far as possible, consistent with observable data that market participants would use in pricing the instrument. Where applicable data is not observable, management uses its best estimate about the assumptions that market participants would make. These estimates may vary from the actual prices that would be achieved in an arm’s length transaction at the reporting date. For details of the key assumptions used and the impact of changes to these assumptions refer note 59.
iii) Share-basedpayments Estimating fair value for share-based payment requires determination of the most appropriate valuation
model. The estimate also requires determination of the most appropriate inputs to the valuation model including the expected life of the option, volatility and dividend yield and making assumptions about them. The assumptions and models used for estimating fair value for share-based payment transactions are disclosed in note 53.
iv) Impairmentofnon-financialassets Impairment exists when the carrying value of an asset or cash generating unit (CGU) exceeds its recoverable
amount, which is the higher of its fair value less costs of disposal and its value in use. The fair value less costs of disposal calculation is based on available data from binding sales transactions, conducted at arm’s length, for similar assets or observable market prices less incremental costs for disposing of the asset. The value in use calculation is based on a DCF model. The cash flows are derived from the budget for the future years and do not include restructuring activities that the group is not yet committed to or significant future investments that will enhance the asset performance of the CGU being tested. The recoverable amount is sensitive to the discount rate used for the DCF model as well as the expected future cash-inflows and the growth rate.
v) Impairmentoffinancialassets The impairment provisions for financial assets disclosed are based on assumptions about risk of default and
expected loss rates. The group uses judgement in making these assumptions and selecting the inputs to the impairment calculation, based on the group’s past history, existing market conditions as well as forward looking estimates at the end of each reporting period.
vi) Taxes The group periodically assesses its liabilities and contingencies related to income taxes for all years open
to scrutiny based on latest information available. The group records its best estimates of the tax liability in the current tax provision. The management believes that they have adequately provided for the probable outcome of these matters.

Notes forming part of the consolidated financial statements
147Annual Report 2017-18
Deferred tax assets are recognised for unused tax losses to the extent that it is probable that taxable profit will be available against which the losses can be utilised. Significant management judgement is required to determine the amount of deferred tax assets that can be recognised, based upon the likely timing and the level of future taxable profits.
3 (D) Recentaccountingpronouncements
In March 2018, the Ministry of Corporate Affairs issued the Companies (Indian Accounting Standards) Amendment Rules, 2018, notifying Indian Accounting Standard (Ind AS) 115 “Revenue from Contracts with Customers”; notifying amendments to Ind AS 12 “Income Taxes” and Ind AS 21 “The Effects of Changes in Foreign Exchange Rates”. Ind AS 115, amendments to the Ind AS 12 and Ind AS 21 are applicable to the Company w.e.f. 1 April 2018.
i) IndAS115“RevenuefromContractswithCustomers”
The core principle of Ind AS 115 is that an entity should recognize revenue to depict the transfer of promised goods or services to customers in an amount that reflects the consideration to which the entity expects to be entitled in exchange for those goods or services. Further this standard requires enhanced disclosures about the nature, amount, timing and uncertainty of revenue and cash flows arising from the entity’s contracts with customers. The standard permits two possible methods of transition:a) Retrospective approach - Under this approach the standard will be applied retrospectively to each prior reporting period presented in accordance with Ind AS 8 - “Accounting Policies, Changes in Accounting Estimates and Errors”. b) Retrospectively with cumulative effect of initially applying the standard recognized at the date of initial application (Cumulative catch - up approach). The Company will adopt the standard on 1 April 2018 by using the cumulative catch-up transition method and accordingly comparatives for the year ending or ended 31 March 2018 will not be retrospectively adjusted. The effect on adoption of Ind AS 115 is expected to be insignificant.
ii) AmendmentstoIndAS
a) IndAS12“IncomeTaxes”
The amendment considers that tax law determines which deductions are offset against taxable income and that no deferred tax asset is recognised if the reversal of the deductible temporary difference will not lead to tax deductions.
Accordingly, segregating deductible temporary differences in accordance with tax law and assessing them on entity basis or on the basis of type of income is necessary to determine whether taxable profits are sufficient to utilise deductible temporary differences.
b) IndAS21“TheEffectsofChangesinForeignExchangeRates”
The amendment to this Ind AS requires foreign currency consideration paid or received in advance of an item of asset, expense or income, resulting in recognition of a non-monetary prepayment asset or deferred income liability, to be recorded in the Company’s functional currency by applying the spot exchange rate on the date of transaction.
The date of transaction which is required to determine the spot exchange rate for translation of such items would be earlier of:
- the date of initial recognition of the non-monetary prepayment asset or deferred income liability, and
- the date on which the related item of asset, expense or income is recognised in the financial statements.
If the transaction is recognised in stages, then a spot exchange rate for each transaction date would be applied to translate each part of the transaction.
The group has evaluated the impact of the above amendments on the consolidated financial statements and the impact is not material.

Notes forming part of the consolidated financial statements
148
4(a)Prope
rty,plantand
equ
ipmen
t
(` in
lakh
s)
Desc
riptio
n of
as
sets
Gros
s car
ryin
g am
ount
Depreciatio
n/A
mortis
ation
Net c
arry
ing
amou
nt
As a
t 1 A
pril
2017
Addi
tions
Disp
osal
sTr
ansla
tion
adjustmen
tAs
at
31 M
arch
2018
Upto
31
Mar
ch 20
17
For
the
year
Disp
osal
sTr
ansla
tion
adjustmen
tUp
to
31 M
arch
2018
As a
t 31
Mar
ch 20
18
Free
hold
land
1,43
0-
-14
31,
573
--
--
-1,5
73Le
aseh
old
land
276
--
2630
214
7-
324
278
Leas
ehol
d im
prov
emen
ts2,
129
416
-13
62,
681
706
532
-92
1,330
1,351
Build
ings
- Own
ed14
,633
616
961,2
6616
,419
2,408
682
1128
13,3
6013
,059
- Lea
sed
4,396
--
224,4
1824
912
4-
337
64,0
42Pl
ant a
nd
mac
hine
ry- O
wned
117,2
628,1
4911
38,3
2913
3,627
30,84
113
,213
362,9
6746
,985
86,64
2- L
ease
d2,4
29-
517
21,9
141,0
5528
449
03
852
1,062
Equi
pmen
ts- O
wned
5,254
631
641
46,2
932,2
4975
11
298
3,297
2,996
- Lea
sed
103
--
-10
345
23-
-68
35Fu
rnitu
re an
d fix
ture
s2,1
4816
12
155
2,462
825
238
210
31,1
641,2
98
Vehi
cles
87
-1
168
--
19
7To
tal(A)
150,
068
9,98
073
410
,494
169,
808
38,4
0015
,854
540
3,75
157
,465
112,
343
4(b)Cap
ital
wor
k-in
- pr
ogre
ss
3,20
5
4(c)Other
inta
ngib
le
asse
tsSo
ftwar
e2,4
3440
6-
190
3,030
1,253
470
-11
81,8
411,1
89Pa
tent
s and
Co
mm
ercia
l rig
hts
3,865
--
209
4,074
191
383
-39
613
3,461
Total(B)
6,29
940
6-
399
7,10
41,
444
853
-15
72,
454
4,65
0Gr
and
Tota
l (A+B
)15
6,36
710
,386
734
10,8
9317
6,91
239
,844
16,7
0754
03,
908
59,9
1911
6,99
3
4(d)In
tang
ibleassetsu
nderdev
elop
men
t96
1N
otes
:(i)
Bu
ildin
gs in
clud
e ro
ads,
res
iden
tial fl
ats,
tube
wel
l, w
ater
tank
s an
d sh
are
in c
o-op
erat
ive
soci
ety.
(ii)
Addi
tions
to p
lant
and
mac
hine
ry in
clud
es e
xcha
nge
diff
eren
ce o
f ` 2
14 la
khs
capi
talis
ed d
urin
g th
e ye
ar.
(iii)
For
det
ails
of p
rope
rty,
pla
nt a
nd e
quip
men
t ple
dged
as
secu
rity
, ref
er n
ote
40.

Notes forming part of the consolidated financial statements
149Annual Report 2017-18
4(a)Prope
rty,plantand
equ
ipmen
t
(` in
lakh
s)
Desc
riptio
n of
as
sets
Gros
s car
ryin
g am
ount
Depreciatio
n/A
mortis
ation
Net
carr
ying
am
ount
As at
1 A
pril
2016
Acqu
ired
durin
g the
ye
ar
(Refernote
(iii)be
low)
Addi
tions
Disp
osal
sTr
ansla
tion
adjustmen
t
As at
31
Mar
ch
2017
Upto
31
Mar
ch
2016
Acqu
ired
durin
g the
ye
ar
(Refernote
(iii)be
low)
For t
he
year
Disp
osal
sTr
ansla
tion
adjustmen
t
Upto
31
Mar
ch
2017
As at
31
Mar
ch
2017
Free
hold
land
897
605
--
(72)
1,430
--
--
--
1,430
Leas
ehol
d lan
d30
3-
--
(27)
276
11-
7-
(4)
1426
2Le
aseh
old
impr
ovem
ents
1,269
-96
6-
(106
)2,1
2927
1-
481
-(4
6)70
61,4
23
Build
ings
- Own
ed11
,312
4,152
60-
(891
)14
,633
615
1,313
657
-(1
77)
2,408
12,22
5- L
ease
d4,4
91-
--
(95)
4,396
128
-12
9-
(8)
249
4,147
Plan
t and
m
achi
nery
- Own
ed80
,225
22,75
722
,234
1,020
(6,93
4)11
7,262
9,896
11,86
411
,134
59(1
,994)
30,84
186
,421
- Lea
sed
2,440
--
-(1
1)2,4
2953
3-
536
-(1
4)1,0
551,3
74Eq
uipm
ents
- Own
ed1,5
652,2
091,7
4716
(251
)5,2
5430
81,6
1249
1-
(162
)2,2
493,0
05- L
ease
d10
3-
--
-10
323
-23
-(1
)45
58Fu
rnitu
re an
d fix
ture
s52
91,0
2369
410
(88)
2,148
7662
019
28
(55)
825
1,323
Vehi
cles
10-
--
(2)
85
-4
-(1
)8
-To
tal(A)
103,1
4430
,746
25,70
11,0
46(8,47
7)15
0,068
11,86
615
,409
13,65
467
(2,46
2)38
,400
111,6
684(b)Cap
ital
work
-in-
prog
ress
1,144
4(c)Ot
her
inta
ngib
le
asse
tsSo
ftwar
e1,5
1685
320
2-
(137
)2,4
3441
648
442
6-
(73)
1,253
1,181
Pate
nts a
nd
Com
mer
cial
right
s
421,3
622,5
62-
(101
)3,8
653
134
68-
(14)
191
3,674
Total(B)
1,558
2,215
2,764
-(238
)6,2
9941
961
849
4-
(87)
1,444
4,855
Gran
d To
tal
(A+B
)10
4,702
32,96
128
,465
1,046
(8,71
5)15
6,367
12,28
516
,027
14,14
867
(2,54
9)39
,844
116,5
23
4(d)In
tang
ibleas
setsund
erdev
elop
men
t78
9N
otes
:(i)
Bu
ildin
gs in
clud
e ro
ads,
res
iden
tial fl
ats,
tube
wel
l, w
ater
tank
s an
d sh
are
in c
o-op
erat
ive
soci
ety.
(ii)
Addi
tions
to p
lant
and
mac
hine
ry in
clud
e ex
chan
ge d
iffer
ence
of `
315
Lak
hs c
apita
lised
dur
ing
the
finan
cial
yea
r 20
16-1
7.(ii
i) Th
e as
sets
acq
uire
d du
ring
the
yea
r en
ded
31 M
arch
201
7 as
a r
esul
t of
acq
uisi
tion
of c
ontr
ol in
Ess
el D
euts
chla
nd G
mbH
& C
o. K
G,
Ger
man
y on
30
Sept
embe
r 20
16 a
re s
how
n in
sep
arat
e co
lum
n tit
led
“Acq
uire
d du
ring
the
year
”.(iv
) Fo
r de
tails
of p
rope
rty,
pla
nt a
nd e
quip
men
t ple
dged
as
secu
rity
, ref
er n
ote
40.

Notes forming part of the consolidated financial statements
150
(` in lakhs)2018 2017
5 Investments accounted for using the equity method (Refer note 55)(A) Unquotedi) Associate company
2,100 (31 March 2017 - 2,100) equity shares of USD 350 each of PT Lamipak Primula Indonesia (Extent of holding 30%)
508 508
Goodwill 514 514 Share of accumulated profits (including other comprehensive income) 504 456 Share of profit/(loss) for the year (104) 58 Share of other comprehensive income/(loss) for the year (27) (10)Dividend received (85) -
1,310 1,526 ii) Investmentinjointventuresa) Nil (31 March 2017 - Nil) Equity Shares of EURO 50 each of Essel Deutschland
GmbH & Co. KG, Dresden (Extent of holding 24.9%) - 1,548
Share of profit for the year - 47 Dividend received - (172)Share of other comprehensive income/(loss) for the year - (143)
- 1,280 Less: Transferred on acquisition (Refer note 54) - (1,280)
- -b) Nil (31 March 2017 - Nil) Equity Shares of EURO 50 each of Essel Deutschland
Management GmbH (Extent of holding 24.9%) - 12
Share of profit for the year - 0 - 12
Less: Transferred on acquisition (Refer note 54) - (12) - -
Total 1,310 1,526
(` in lakhs)2018 2017
6 Non-currentfinancialassets-Loans(Unsecured, considered good)Security deposits - Related parties (Refer note 46) 471 1,609 - Others 879 835 Loans and advances to employees 8 9 Total 1,358 2,453
Security deposits are interest free non-derivative financial assets carried at amortised cost. These primarily include deposits given against rented premises and various deposits with government authorities. The carrying value may be affected by changes in the credit risk of the counter parties.

Notes forming part of the consolidated financial statements
151Annual Report 2017-18
(` in lakhs)2018 2017
7 Othernon-currentfinancialassetsDeposits with banks having original maturity period of more than twelve months* (Refer note 13)
20 29
Total 20 29
* Deposited with / lien in favour of various Government authorities / banks.
(` in lakhs)2018 2017
8 Non-current tax assetsBalances with government authorities- Direct tax (net of provision) 2,123 2,107 Total 2,123 2,107
(` in lakhs)2018 2017
9 Other non-current assetsCapital advances 3,266 1,840 Prepaid expenses 397 319 Balances with Government authorities - Indirect taxes 462 415 Total 4,125 2,574
(` in lakhs)2018 2017
10 InventoriesRaw materials (includes goods in transit ` 1644 lakhs, 31 March 2017 ` 719 lakhs)
10,071 9,211
Goods-in-process 6,394 5,682 Finished goods (includes goods in transit ` 247 lakhs, 31 March 2017 ` 64 lakhs)
5,345 4,376
Stores and spares 6,339 4,897 Packing materials 490 432 Total 28,639 24,598
Inventories were written down to net realisable value by ` 131 lakhs (31 March 2017 ` 238 lakhs). This amount is recognised as an expense during the year and included in “Changes in inventories of finished goods and goods-in-process” in the consolidated statement of profit and loss.

Notes forming part of the consolidated financial statements
152
(` in lakhs)2018 2017
11 Tradereceivables(Unsecured)Considered good 45,904 37,662 Considered doubtful 651 650
46,555 38,312 Less: Allowance for bad and doubtful debts 651 650 Total 45,904 37,662
Trade receivables are non-interest bearing and credit terms are generally 30 to 120 days. The Group’s exposure to credit and currency risks related to trade receivables is disclosed in note 57.
(` in lakhs)2018 2017
12 Cash and cash equivalentsBalance with banks in current accounts 10,629 7,617 Cheques/drafts on hand 543 67 Deposits with banks having original maturity period upto three months 384 507 Cash on hand 18 12 Total 11,574 8,203
(` in lakhs)2018 2017
13 Bank balances other than cash and cash equivalentsUnclaimed dividend accounts 87 73 Deposits with banks having original maturity period of upto twelve months*
5,684 2,005
Deposits with banks having original maturity period of more than twelve months*
33 32
5,804 2,110 Disclosed under "Other non-current financial assets" (Refer note 7) (20) (29)Total 5,784 2,081
* Deposited with / lien in favour of various Government authorities / banks.
(` in lakhs)2018 2017
14 Currentfinancialassets-Loans(Unsecured, considered good)Security deposits 532 476 Loans and advances to- Related party (Refer note 46) 10,629 10,674 - Employees 117 48 Total 11,278 11,198

Notes forming part of the consolidated financial statements
153Annual Report 2017-18
(` in lakhs)2018 2017
15 OthercurrentfinancialassetsInsurance claim receivable (Refer note 42) 193 193 Derivative instruments at fair value through profit or loss - Foreign exchange forward contracts 41 2 Other receivables 5 5 Total 239 200
(` in lakhs)2018 2017
16 Current tax assetsBalances with Government authorities - Direct tax (net of provision) 78 262 Total 78 262
(` in lakhs)2018 2017
17 Other current assetsAdvances against goods and services 3,941 6,059 Prepaid expenses 1,411 1,266 Balances with government authorities - Indirect taxes (net) 4,473 4,815 Export benefits receivable 78 54 Total 9,903 12,194
(` in lakhs)2018 2017
18 Equity share capitalAuthorised250,050,000 (31 March 2017: 250,050,000) equity shares of ` 2 each 5,001 5,001 Issued157,238,784 (31 March 2017: 157,158,618) equity shares of ` 2 each 3,145 3,143 Subscribed and paid up157,181,664 (31 March 2017: 157,101,498) equity shares of ` 2 each fully paid up (Refer note (a) below)
3,144 3,142
Add: 57,120 equity shares of ` 2 each forfeited (Refer note (h) below) 1 1 Total 3,145 3,143

Notes forming part of the consolidated financial statements
154
a) Reconciliationofnumberofsharesoutstanding(excludingforfeitedshares)2018 2017
Number of equity shares (`inlakhs) Number of
equity shares (`inlakhs)
At the beginning of the year 157,101,498 3,142 157,044,165 3,141
Add/less: Changes during the year
Allotted pursuant to the scheme of amalgamation (Refer note 41)
- - 88,917,843 1,778
Cancelled pursuant to the scheme of amalgamation (Refer note 41)
- - (88,917,843) (1,778)
Allotted on exercise of employee share option 80,166 2 57,333 1Outstanding at the end of the year 157,181,664 3,144 157,101,498 3,142
b) Terms/rightsattachedtoequityshares
The Company has only one class of equity shares having a par value of ` 2 per share. Each holder of equity shares is entitled to one vote per share. The Company declares and pays dividend in Indian rupees. The final dividend proposed by the Board of Directors is subject to the approval of the shareholders in the ensuing Annual General Meeting.
In the event of liquidation of the Company, the holders of the equity shares will be entitled to receive remaining assets of the Company, after distribution of preferential amount. The distribution will be in proportion to the number of equity shares held by the shareholders.
c) Detailsofsharesheldbyholdingcompanyandultimateholdingcompany
Name of Shareholder 2018 2017Number of
equity sharesPercentage of holding
Number of equity shares
Percentage of holding
Whitehills Advisory Services Private Limited (Holding company)*
- - - -
Rupee Finance and Management Private Limited (Ultimate holding company) *
- - - -
* During the previous year, all the shares held by Whitehills Advisory Services Private Limited have been transferred to Ashok Goel Trust pursuant to a scheme of amalgamation (Refer note 41). As such, there is no holding company or ultimate holding Company w.e.f. 6 October 2016.
d) Detailsofshareholderholdingmorethan5%equityshares
Name of Shareholder 2018 2017Number of
equity sharesPercentage of holding
Number of equity shares
Percentage of holding
Whitehills Advisory Services Private Limited (Holding company)*
- - - -
Ashok Kumar Goel (Trustee - Ashok Goel Trust)* 89,339,014 56.84% 89,139,014 56.72%* During the previous year, all the shares held by Whitehills Advisory Services Private Limited have been transferred to Ashok Goel Trust pursuant to a scheme of amalgamation (Refer note 41). As such, there is no holding company w.e.f. 6 October 2016.
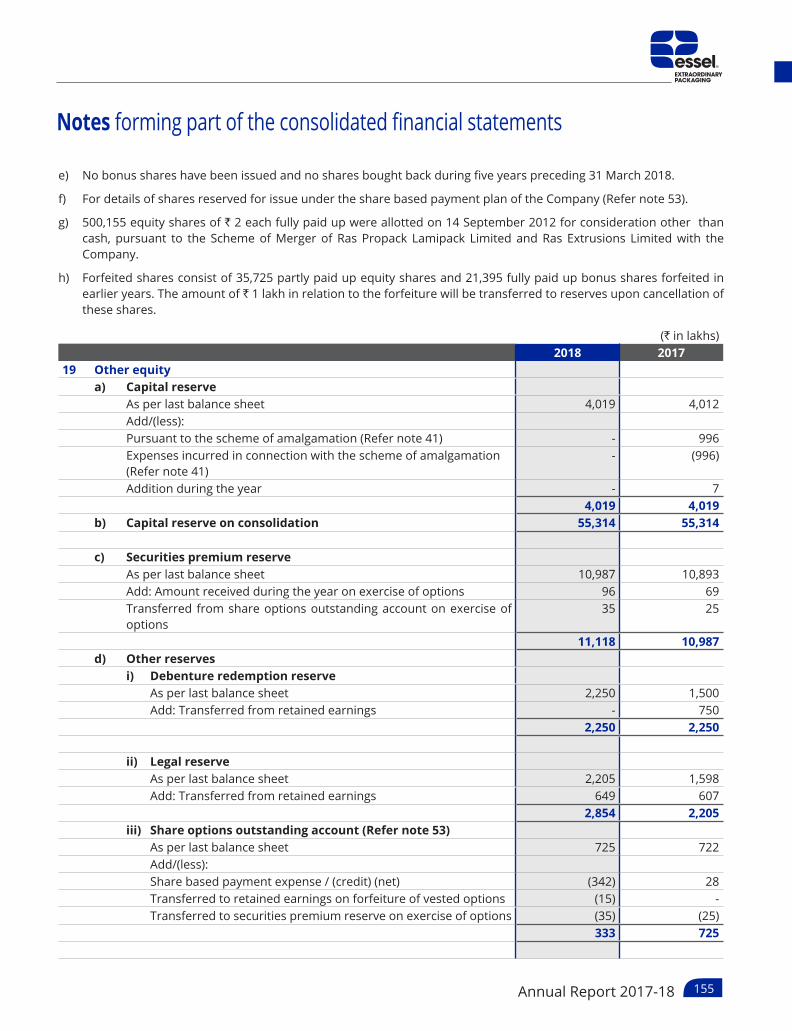
Notes forming part of the consolidated financial statements
155Annual Report 2017-18
e) No bonus shares have been issued and no shares bought back during five years preceding 31 March 2018.
f) For details of shares reserved for issue under the share based payment plan of the Company (Refer note 53).
g) 500,155 equity shares of ` 2 each fully paid up were allotted on 14 September 2012 for consideration other than cash, pursuant to the Scheme of Merger of Ras Propack Lamipack Limited and Ras Extrusions Limited with the Company.
h) Forfeited shares consist of 35,725 partly paid up equity shares and 21,395 fully paid up bonus shares forfeited in earlier years. The amount of ` 1 lakh in relation to the forfeiture will be transferred to reserves upon cancellation of these shares.
(` in lakhs)2018 2017
19 Other equitya) Capital reserve
As per last balance sheet 4,019 4,012 Add/(less):Pursuant to the scheme of amalgamation (Refer note 41) - 996 Expenses incurred in connection with the scheme of amalgamation (Refer note 41)
- (996)
Addition during the year - 7 4,019 4,019
b) Capital reserve on consolidation 55,314 55,314
c) Securities premium reserveAs per last balance sheet 10,987 10,893 Add: Amount received during the year on exercise of options 96 69 Transferred from share options outstanding account on exercise of options
35 25
11,118 10,987 d) Other reserves
i) Debentureredemptionreserve As per last balance sheet 2,250 1,500 Add: Transferred from retained earnings - 750
2,250 2,250
ii) Legal reserve As per last balance sheet 2,205 1,598 Add: Transferred from retained earnings 649 607
2,854 2,205 iii) Shareoptionsoutstandingaccount(Refernote53) As per last balance sheet 725 722 Add/(less): Share based payment expense / (credit) (net) (342) 28 Transferred to retained earnings on forfeiture of vested options (15) - Transferred to securities premium reserve on exercise of options (35) (25)
333 725

Notes forming part of the consolidated financial statements
156
(` in lakhs)2018 2017
iv) Generalreserve As per last balance sheet 545 545
v) Retainedearnings As per last balance sheet 31,956 18,555 Add/(Less): Taken over pursuant to the Scheme of Amalgamation (Refer note
41) - 39
Profit for the year 17,160 19,032 Item of other comprehensive income recognised directly in
retained earnings - Remeasurement gains/(losses) on defined benefit plan (net of
tax) (75) (155)
Debenture redemption reserve - (750) Legal reserve (649) (607) Transferred from share options outstanding account on forfeiture
of vested options 15 -
Equity dividend paid (3,770) (3,455) Tax on equity dividend paid (768) (703)
43,869 31,956 Other comprehensive incomevi) Foreign currency translation reserve As per last balance sheet (7,245) 197
Add / (Less) : Loss /(gain) reclassified to consolidated statement of profit and loss on liquidation of subsidiary
498 -
Gain / (loss) during the year 8,359 (7,442)
1,612 (7,245) Total 121,914 100,756
Nature and purpose of reserves
i) Capitalreserve
Capital reserve represents capital surplus and not normally available for distribution as dividend.
ii) Securitiespremium
Securities premium is used to record the premium received on issue of shares. The reserve is utilised in accordance with the provisions of the Companies Act, 2013.
iii) Debentureredemptionreserve(DRR)
The Company had issued redeemable non-convertible debentures and accordingly DRR is required to be created pursuant to the Companies (Share capital and Debentures) Rules 2014. DRR is required to be created, out of profits of the Company available for payment of dividend, upto an amount which is equal to 25% of the value of the debentures issued.

Notes forming part of the consolidated financial statements
157Annual Report 2017-18
iv) Shareoptionsoutstandingaccount
Represent the fair value at respective grant dates of options granted and outstanding for vesting/exercise, under Essel Employee Stock Option Scheme 2014. This balance will be transferred to share capital and security premium account as and when the options get exercised from time to time or to retained earnings in the event of forfeiture, non-vesting or lapse.
v) Generalreserve
The reserve is a distributable reserve maintained by the Company out of transfers made from annual profits.
vi) Retainedearnings
Retained earnings represent the accumulated earnings net of losses if any made by the group over the years.
vii) Othercomprehensiveincome
Other comprehensive income comprises of re-measurement gains/(losses) of defined benefit obligations, exchange differences on translation of financial statements of foreign operations, etc.
(` in lakhs)2018 2017
20 Non-current borrowingsSecuredDebentures400 (900) units of Redeemable non-convertible debentures of ` 1,000,000 each (Refer note [a (i)] below)
4,013 8,969
Term loansTerm loan from banks {Refer note [b (i)] below} 39,119 46,965 Buyers credit from banks (Refer note [(a)(ii)] below) - 2,512 Finance lease obligations [Refer note [a (iii)] and [b (ii)] below] 4,885 5,450
48,017 63,896 Unsecured 500 (Nil) units of Redeemable non-convertible debentures of face value of ` 1,000,000 each (Refer note [a (iv)] below)
5,099 -
Term loan from banks (Refer note [b (iii)] below) 1,471 1,716 Buyers credit from banks (Refer note [a (v)] below) 3,433 4,396 Deferred sales tax loan (Refer note [a (vi)] below) 879 1,139
10,882 7,251 58,899 71,147
Less: Current maturities disclosed under “Other current financial liabilities” (Refer note 24)
13,977 10,651
Total 44,922 60,496

Notes forming part of the consolidated financial statements
158
Nature of security and terms of repayments for long-term borrowings
a) InParentCompany
i) Listed redeemable non-convertible debentures Series (A) of ` Nil (31 March 2017: ` 4,983 lakhs) and Series (B) of ` 4,013 lakhs (31 March 2017: ` 3,986 lakhs) are secured by pari passu first charge on all fixed assets of the Company (except all fixed assets situated at chakan and land and building situated at Goa and Murbad). These debentures are further secured by way of security provided by a related party*.
These debentures carry interest rate at SBI Base Rate + 145 bps p.a. and are redeemable at par in 3 annual instalments commencing from 25 April 2019 in the ratio of 30:30:40 with a put/call option at the end of 3 years from date of issue in case of Series (A) and 3 1/2 years from the date of issue in case of Series (B), and on each anniversary thereafter until redemption, and put option in the event of downgrade of credit rating to BBB+ or below. Series (A) debentures are redeemed during the year exercising the call option in accordance with the terms of the issue. Further in case of Series (B) debentures the call option has been exercised during the year.
ii) Buyers credit from bank of ̀ Nil (31 March 2017: ̀ 2,512 lakhs) is secured by pari passu first charge on all fixed assets of the Company (except all fixed assets situated at Chakan). These buyers credit are further secured by way of security provided by a related party*.
Buyers credit from bank is fully paid during the year.
iii) Finance lease obligations are secured by related leased assets.
Leases carry interest rate ranging from 12.36% to 13.50% p.a and are repayable in monthly instalments thereafter.
iv) Listed redeemable non-convertible debentures of ` 5,099 Lakhs (31 March 2017: ` Nil) are unsecured
These debentures carry interest rate at 1 year Treasury Bill YTM rate + 145 bps p.a. payable annually and are redeemable at par at the end of 3 years from the date of issue.
v) Buyers credit from banks ` 2,281 lakhs (31 March 2017: ` 2,284 lakhs) are against security provided and guarantee issued by a related party and ` 1,152 lakhs (31 March 2017: ` 2,112 lakhs) are against security provided by a related party*.
Buyers credit from banks carry interest rate ranging from 0.20% to 2.10% p.a. based on prevailing benchmark rates and are repayable in maximum period of three years from the date of transaction.
vi) Deferred sales tax interest free loans are repayable after a period of 10 to 14 years from the date of loan upto 2024-25.
*Related party i.e. Aqualand (India) Limited

Notes forming part of the consolidated financial statements
159Annual Report 2017-18
b)InSubsidiaries
i) Term loans from banks of ` 39,119 lakhs (31 March 2017: ` 46,965 lakhs) in different currencies are variously secured by way of charge over fixed assets (excluding leased assets) and / or exclusive charge on the asset financed under the particular loan, inventory, book debts and other current assets of the respective subsidiary company, dividend escrow account, pledge of shares of the overseas subsidiaries, subservient charge on moveable fixed assets and current assets of the Parent Company, corporate guarantee / letter of comfort of the parent Company / affiliate.
Repayable in specified instalments (Monthly, Quarterly, Half yearly and Yearly) repayable by 2024-25. Interest rate for USD denominated loans are ranging from 4.52% to 5.63% p.a. and EUR denominated loans are ranging from 1.00% to 2.95% p.a. linked to prevailing benchmark rates of respective currencies.
ii) Finance lease obligations are secured against the assets leased.
USD denominated lease carry interest rate at 6.00% p.a. and COP denominated lease carry interest rate at 12.90% p.a. All leases are repayable in monthly instalments.
iii) Term loan from banks of ̀ 1,471 lakhs (31 March 2017: ` 1,716 lakhs) are unsecured.
EURO denominated term loan from banks carry interest rate 1.20% and COP denominated term loan carry interest rate 10.59% p.a. and is repayable in quarterly / half yearly instalments by 2019-20.
(` in lakhs)2018 2017
21 Non-current provisionsEmployee benefits 1,374 1,332 Provision for contingency 985 998 Total 2,359 2,330
(` in lakhs)2018 2017
22 Currentfinancialliabilities-BorrowingsSecured {Refer note [(a) and (b)] below}Working capital loan from banks 8,137 4,930 Buyers credit from banks - 1,040
8,137 5,970 UnsecuredShort-term loan from banks 3,314 2,048 Working capital loan from banks 93 670 Commercial Paper 2,961 -
6,368 2,718 Total 14,505 8,688

Notes forming part of the consolidated financial statements
160
Nature of security:Of the total secured short term borrowingsa) InParentCompany ` 2,738 lakhs (31 March 2017: ` 1,741 lakhs) are secured by first pari-passu charge on current assets and second
pari-passu charge on all fixed assets of the company (except all fixed assets situated at Chakan).
b) InSubsidiaries ` 5,399 lakhs (31 March 2017: ` 4,229 lakhs) are secured variously by way of charge over fixed assets (excluding
leased assets), inventory, book debts and other current assets of the respective subsidiary companies, corporate guarantee / letter of comfort of the parent Company, and pledge of shares of overseas subsidiary companies.
(` in lakhs)2018 2017
23 Trade payablesAcceptances 2,229 2,259 Others 16,613 12,473 Total 18,842 14,732
(` in lakhs)2018 2017
24 OthercurrentfinancialliabilitiesCurrent maturities of long term borrowings (Refer note 20) 13,562 10,051 Current maturities of long term finance lease obligations (Refer note 20) 415 600 Unclaimed dividend (Refer note 47) 87 73 Payable for capital goods 354 363 Employee benefits payable 2,627 2,547 Grant received in advance 1,769 1,952 Derivative instruments at fair value through profit or loss- Foreign exchange forward contracts 5 440 - Interest rate swaps - 8 Other payables 10,685 9,910 Total 29,504 25,944
(` in lakhs)2018 2017
25 Other current liabilitiesTrade advances 315 137 Statutory dues 2,899 2,685 Total 3,214 2,822
(` in lakhs)2018 2017
26 Current provisionsEmployee benefits 592 644 Total 592 644

Notes forming part of the consolidated financial statements
161Annual Report 2017-18
(` in lakhs)2018 2017
27 Current tax liabilitiesDirect tax payable (net) 2,467 1,667 Total 2,467 1,667
(` in lakhs)2018 2017
28 Revenue from operations (Refer note 51)Sale of products 241,370 234,588 Other operating revenues- Royalty / Service charges 2,100 2,775 - Sale of scrap 853 1,237 - Export and other incentives 319 194 Total 244,642 238,794
(` in lakhs)2018 2017
29 Other incomeInterest on income tax refund 323 - Grant income 527 350 Net gain on disposal of property, plant and equipment 115 1,387 Gain on sale of current investments 7 3 Miscellaneous income 346 293 Total 1,318 2,033
(` in lakhs)2018 2017
30 Interest incomeInterest income on financial assets at amortised cost- Loans 1,136 1,258 - Deposits 94 56 Unwinding of discount on security deposits 89 183 Total 1,319 1,497

Notes forming part of the consolidated financial statements
162
(` in lakhs)2018 2017
31 Cost of materials consumedInventories at the beginning of the year 9,211 7,572Add: Inventories from acquisition during the year - 1,462 Purchases (net) 106,201 101,390
115,412 110,424 Less: Inventory at the end of the year 10,071 9,211 Total 105,341 101,213
(` in lakhs)2018 2017
32 Changesininventoriesoffinishedgoodsandgoods-in-processInventories at the end of the year Goods-in-process 6,394 5,682Finished goods 5,345 4,376Total(A) 11,739 10,058
Inventories from acquisition during the yearGoods-in-process - 269 Finished goods - 1,845 Total(B) - 2,114
Inventories at the beginning of the year Goods-in-process 5,682 5,181 Finished goods 4,376 2,339 Total(C) 10,058 7,520 Total(B+C-A) (1,681) (424)
(` in lakhs)2018 2017
33 EmployeebenefitsexpenseSalaries, wages and bonus 36,128 33,658 Contribution to provident and other funds 3,591 3,409 Gratuity 197 92 Share based payment (credit) / expense (net)(Refer note 53) (342) 28 Staff welfare expenses 3,816 3,334 Total 43,390 40,521

Notes forming part of the consolidated financial statements
163Annual Report 2017-18
(` in lakhs)2018 2017
34 Finance costsInterest expense - Borrowings 3,997 4,138 - Defined benefit obligation 76 59 - Others 7 16 Exchange differences regarded as an adjustment to borrowing costs 111 180 Other borrowing costs 1,300 1,419 Total 5,491 5,812
(` in lakhs)2018 2017
35 Depreciation and amortisation expenseDepreciation on property, plant and equipment 15,854 13,654 Amortisation of intangible assets 853 494 Total 16,707 14,148

Notes forming part of the consolidated financial statements
164
(` in lakhs)2018 2017
36 Other expensesStores and spares 5,289 4,979 Packing materials 8,333 7,596 Power and fuel 6,595 6,884 Job work / Labour charges 3,790 3,828 Lease rent- Factory premises 1,377 1,543 - Plant and equipment 948 984 Other manufacturing expenses 2,045 1,893 Repairs and maintenance- Buildings 210 226 - Plant and machinery 2,110 2,298 - Others 1,084 858 Rent 1,047 916 Rates and taxes 923 986 Insurance 368 375 Directors' sitting fees 10 14 Travelling and conveyance expenses 1,353 1,442 Professional and consultancy charges 1,458 1,564 Communication charges 426 501 Exchange difference (net) 800 294 Payment to auditors (Refer details below) 35 58 Bad and doubtful debts (net of provision) 187 141 Corporate social responsibility expense (Refer note 49) 78 42 Donation 20 14 Freight and forwarding expenses 7,774 6,687 Commission 97 90 Miscellaneous expenses 2,506 2,517 Total 48,863 46,730
Payment to auditors for:Audit fees 21 27 Tax audit - 4 Tax representations and others - 13 Certifications (including fees for limited reviews) 14 12 Reimbursement of expenses 0 2 Total 35 58

Notes forming part of the consolidated financial statements
165Annual Report 2017-18
37 Finance lease
The group has acquired plant and machinery and equipments under finance lease which are capitalized under property, plant and equipment. The minimum lease payments required under the finance lease that have initial or remaining non-cancellable lease terms in excess of one year as at 31 March 2018 and their present value are as follows:
(` in lakhs)2018 2017
Minimum lease payment as at 31 MarchNot later than one year 727 974 Later than one year but not later than five years 1,962 2,291 Later than five years 5,097 5,454 Total minimum lease payments 7,786 8,719 Less: Amount representing finance charges 2,901 3,269 Present value of minimum lease payments as at 31 March 4,885 5,450 Not later than one year 415 600 Later than one year but not later than five years 973 1,211 Later than five years 3,497 3,639
38 Operating lease
The group has taken factory and office premises, residential facilities, plant and machinery (including equipments) IT assets, vehicles etc. under cancellable / non-cancellable operating lease agreements that are renewable on a periodic basis at the option of both the lessor and the lessee. The initial tenure of these leases varies from eleven to one hundred and eight months. The rental obligations are as follows:
(` in lakhs)2018 2017
Lease rental charges for the year 3,355 3,507Futureleaserentalobligationpayable(undernon-cancellableleases)asat 31 MarchNot later than one year 1,794 2,014Later than one year but not later than five years 5,440 4,205Later than five years 2,038 2,141Total 9,272 8,360
39 Contingentliabilitiesandcommitments(totheextentnotprovidedfor)
a) Contingentliabilities
(` in lakhs)2018 2017
A Claims against the group not acknowledged as debts(i) Disputed indirect taxes 2,991 2,340 (ii) Disputed direct taxes 3,809 3,023 (iii) Deferred sales tax liability assigned 340 474 (iv) Other claims not acknowledged as debts 50 50

Notes forming part of the consolidated financial statements
166
(` in lakhs)2018 2017
B. GuaranteesexcludingfinancialguaranteesBank guarantees given by the group 278 271
(` in lakhs)2018 2017
C Other money for which the group is contingently liable(i) Unexpired letters of credit (net of liability provided) 40 25 (ii) Duty benefit availed under EPCG scheme, pending export
obligations 2,831 3,012
b) Commitments
(i) Capitalcommitments
(` in lakhs)2018 2017
Estimated amount of contracts remaining to be executed on capital account, not provided for (net of advances)
2,578 2,650
(ii) Othercommitments
(` in lakhs)2018 2017
Estimated amount of contracts remaining to be executed other than on capital account, not provided for (net of advances)
2,640 843
40 Collateral/securitypledged
The carrying amount of assets pledged as security for current and non-current borrowings of the group are as under:
(` in lakhs)2018 2017
Property, plant and equipment 74,998 73,648 Inventories 11,650 11,349 Other current and non-current assets excluding investments 46,981 52,888 Total assets charged 133,629 137,885
41 Scheme of amalgamation
i) A Scheme of Amalgamation of the holding company Whitehills Advisory Services Private Limited (“transferor company”) with Essel Propack Limited (“transferee company”) and their respective shareholders (the Scheme) was sanctioned by the Hon’ble High Court of Judicature at Mumbai vide its order dated 1 September 2016. The Scheme became effective on 6 October 2016 and consequently all assets, liabilities and reserves of transferor company vested with the Company on the appointed date i.e. 1 November 2015 at their respective book values. Accordingly, the consolidated financial statements for the year ended 31 March 2017 includes the transactions of the transferor company.
ii) Pursuant to the Scheme
a. 88,829,014 and 88,829 equity shares of ̀ 2 each fully paid up of the Company were allotted to the participating preference shareholders and equity shareholders respectively of the transferor company and equivalent number of equity shares of ` 2 each fully paid up held by the transferor company were cancelled. There was no change in the paid up equity share capital of the Company post allotment of the above equity shares.

Notes forming part of the consolidated financial statements
167Annual Report 2017-18
b. The net assets taken over were credited to capital reserve and expenses incurred in relation to and in connection with the Scheme were debited to capital reserve as detailed below:
(` in lakhs)Assets and LiabilitiesCash and bank balances 30 Long term loans and advances 975 Current assets 2 Current liabilities (11)Net assets taken over 996
Credited to capital reserve 996 Less: Expenses incurred in connection with the scheme debited to capital reserve
(996)
-
42 Insurance claim receivable of ̀ 193 lakhs (31 March 2017 : ̀ 193 Lakhs) is in respect of transit damage to certain plant and machinery, which is under litigation before National Consumer Dispute Redressal Commission, New Delhi (Refer Note 15).
43 Additional information pursuant to Para 2 of General instructions for the preparation of consolidated financialstatements
(` in lakhs)Sr. No.
Name of the entity Net Assets, i.e., total assets minus total
liabilities
ShareinProfitorLossfor the year
Share in Other ComprehensiveIncome/
(loss)fortheyear
Share in Total ComprehensiveIncome/
(loss)fortheyear%of
consolidated net assets
Amount %ofconsolidated
Profit
Amount %ofconsolidated
Other Comprehensive
Income
Amount %ofconsolidated
total comprehensive
income
Amount
I Parent -Essel Propack Limited 52% 65,470 47% 8,118 -1% (74) 31% 8,044
II Subsidiaries - Foreign1 Essel Propack America,
LLC25% 31,753 19% 3,265 2% 179 13% 3,444
2 Lamitube Technologies Limited
43% 54,285 12% 2,116 7% 582 10% 2,697
3 Lamitube Technologies (Cyprus) Limited
3% 3,390 4% 723 0% 14 3% 737
4 Essel Packaging (Guangzhou) Limited
34% 42,224 36% 6,212 36% 3,167 36% 9,379
5 Essel Propack Philippines, Inc
1% 1,348 3% 461 0% (36) 2% 425
6 MTL de Panama, S.A 2% 2,831 4% 734 0% (9) 3% 725 7 Arista Tubes Limited -2% (2,167) 0% 14 -3% (241) -1% (227)8 Essel Propack UK
Limited1% 1,600 3% 580 2% 140 3% 720
9 Essel de Mexico, S.A. de C.V.
2% 2,625 4% 721 1% 72 3% 793
10 Tubopack de Columbia S.A.S.
1% 924 1% 132 0% 24 1% 156

Notes forming part of the consolidated financial statements
168
(` in lakhs)Sr. No.
Name of the entity Net Assets, i.e., total assets minus total
liabilities
ShareinProfitorLossfor the year
Share in Other ComprehensiveIncome/
(loss)fortheyear
Share in Total ComprehensiveIncome/
(loss)fortheyear%of
consolidated net assets
Amount %ofconsolidated
Profit
Amount %ofconsolidated
Other Comprehensive
Income
Amount %ofconsolidated
total comprehensive
income
Amount
11 Essel Colombia, S.A.S. 0% (48) -3% (447) 0% 14 -2% (434)12 Essel Propack LLC
(Russia)1% 1,125 -1% (123) 0% (22) -1% (144)
13 Essel Propack Polska Sp. z.o.o.
12% 14,433 3% 496 22% 1,943 9% 2,439
14 Arista Tubes, Inc 17% 21,164 19% 3,263 -1% (53) 12% 3,211 15 Essel Packaging
(Jiangsu) Limited5% 6,795 0% 0 7% 620 2% 620
16 Lamitube Hongkong Trading Company Limited
0% - 0% - 0% 0 0% 0
17 Egyptian Indian Company for Modern Packaging S.A.E. (75%)
0% - 0% (12) 0% 15 0% 3
18 Essel Propack Misr for Advanced Packaging S.A.E. (75%)
1% 1,385 5% 833 0% 40 3% 873
19 Essel Deutschland GmbH & Co. KG
6% 7,354 7% 1,266 24% 2,146 13% 3,412
20 Essel Deutschland Management GmbH
0% 52 0% 1 0% 7 0% 8
III Minority InterestsEssel Propack Misr for Advanced Packaging S.A.E (25%)
0% 462 2% 278 0% 13 1% 291
IV AssociateForeignPT Lamipak Primula (30%)
2% 1,894 -1% (239) 0% - 0% -
Note:
Net assets / share of profit or loss of subsidiaries and associate are considered based on the respective audited / unaudited standalone financial statements without considering elimination / consolidation adjustments.

Notes forming part of the consolidated financial statements
169Annual Report 2017-18
44 Exceptionalitems(net)
Exceptional items includes :
I) Foryearended31March2018
a) ` 489 lakhs being exchange difference arising on translation of foreign operations of a subsidiary in Egypt earlier carried in consolidated equity, now reclassified to the consolidated statement of profit and loss, following liquidation of the said company in the current year, in accordance with the requirements of Ind AS 21 “The Effects of Changes in Foreign Exchange Rates”.
b) ` 9 lakhs being loss incurred on liquidation of the above subsidiary.
II) Foryearended31March2017
a) ` 338 lakhs exchange loss due to the Government of Egypt moved out of administered exchange rate mechanism to full float of Egyptian Pound (EGP) thereby devaluing EGP from 8.8799 to 16.00 per USD on 3 November 2016
b) ` 461 lakhs trade tax assessed on subsidiary in Germany on account of change in it’s ownership following acquisition of 100% stake by the group
c) Gain of ` 2,364 lakhs (net of related costs) determined as difference between the acquisition date fair value of the group’s previously held 24.9% equity interest in the joint ventures in Germany and its related carrying amount in the books, following acquisition of 100% stake in the said joint ventures
45 Earningspershare(EPS)
2018 2017Profit for the year attributable to owners of the parent (` in lakhs) 17,160 19,032Weighted average number of shares for Basic EPS (Nos.) 157,148,280 157,053,275 Weighted average number of shares for Diluted EPS (Nos.) 157,563,299 157,999,500 Nominal value of equity shares (`) 2.00 2.00 Earnings per shareBasic EPS (`) 10.92 12.12 Diluted EPS (`) 10.89 12.05
46 Related party disclosures
a. List of related parties
i) Ultimateholdingcompany
Rupee Finance and Management Private Limited (ceased to be ultimate holding company w.e.f. 6 October 2016 pursuant to the scheme of amalgamation - Refer note 41)
ii) Holdingcompany
Whitehills Advisory Services Private Limited (ceased to be holding company w.e.f. 6 October 2016 pursuant to the scheme of amalgamation - Refer note 41)
iii) Jointventures/Associate(Refer note 3A(ii)(d))
Joint ventures** - Essel Deutschland GmbH & Co. KG, Essel Deutschland Management GmbH
Associate - P.T. Lamipak Primula
**Ceased to be joint ventures (extent of holding 24.9%) and became wholly owned subsidiaries w.e.f. 30 September 2016

Notes forming part of the consolidated financial statements
170
iv) Other related parties with whom transactions have taken place during the year and balancesoutstanding at the year end
Aqualand (India) Limited, Ayepee Lamitubes Limited, Ganjam Trading Company Private Limited, Pan India Paryatan Private Limited, Sprit Infrapower & Multiventures Private Limited (formerly Sprit Textiles Private Limited), ITZ Cash Card Limited, Shrotra Enterprises Private Limited.
v) Keymanagementpersonnel/Directors
Executive director Mr. Ashok Goel (Chairman and Managing Director)Independent director Mr. Boman MoradianIndependent director Mr. Mukund M. ChitaleIndependent director Ms. Radhika PereiraNon - executive director Mr. Atul Goel
b. Transactions with related parties
(A)Transactionsduringtheyear(` in lakhs)
2018 2017a. Sales to and recoveries from Jointventures/Associate - 450 Essel Deutschland GmbH & Co. KG - 436 P. T Lamipak Primula - 14 Other related parties 21 - Shrotra Enterprises Private Limited 21 - b. Royalty income Jointventures/Associate - 142 Essel Deutschland GmbH & Co. KG - 142 c. Purchase of goods and services Other related parties 53 21 ITZ Cash Card Limited 53 21 d. Rent expenses Other related parties 1,017 934 Ayepee Lamitubes Limited 10 40 Ganjam Trading Company Private Limited 1,007 875 Others - 19 e. Guarantee commission paid Other related parties 449 513 Aqualand (India) Limited 449 513 f. Deposits given Other related parties - 550 Ganjam Trading Company Private Limited - 550 g. Repaymentofloans/depositsgiven Other related parties 1,250 975 Ayepee Lamitubes Limited 1,250 - Ganjam Trading Company Private Limited * - 975

Notes forming part of the consolidated financial statements
171Annual Report 2017-18
(` in lakhs)2018 2017
h. Interest income on loans given Other related parties 1,136 1,297 Ganjam Trading Company Private Limited * - 111 Sprit Infrapower & Multiventures Private Limited 1,136 1,186 i. Remunerationpaid/provided 640 717 Mr. Ashok Goel 640 717 j. Commissiontodirectors 45 45 Mr. Boman Moradian 15 15 Mr. Mukund M. Chitale 15 15 Ms. Radhika Pereira 15 15 k. Sittting fees 7 9 Mr. Boman Moradian 3 4 Mr. Mukund M. Chitale 2 3 Ms. Radhika Pereira 2 2
* Repayment received of loan taken over pursuant to the scheme of amalgamation (Refer note 41) and interest thereon
(B)Balanceoutstanding
(` in lakhs)2018 2017
a. Trade and other receivables Other related parties - 1 Shrotra Enterprises Private Limited - 1 Ayepee Lamitubes Limited - 0 b. Loans/depositsgiven(includinginterestreceivable) Other related parties 11,479 12,774 Ayepee Lamitubes Limited - 1,250 Sprit Infrapower & Multiventures Private Limited 10,629 10,674 Others 850 850 c. Trade and other payables Other related parties 38 - Ganjam Trading Company Private Limited 35 - Ayepee Lamitubes Limited 3 - d. Guarantees/securityprovidedongroup’sbehalf Other related parties 16,000 25,400 Aqualand (India) Limited 16,000 25,400 [Loan outstanding ̀ 7,440 lakhs (31 March 2017 : ̀ 15,557 lakhs)]e. Remuneration payable 153 233 Mr. Ashok Goel 153 233 f. Commissionpayable(Gross) 45 45 Mr. Boman Moradian 15 15 Mr. Mukund M. Chitale 15 15 Ms. Radhika Pereira 15 15
Notes:
i) All transactions with related parties are made on arm’s length basis in the ordinary course of business. The outstanding balances at year end are unsecured due to be settled for consideration in cash.
ii) Transactions with Joint ventures have been reported at proportionate value.
iii) The above disclosures are excluding Ind AS adjustments

Notes forming part of the consolidated financial statements
172
c. Break up of remuneration of key management personnel of the Company
(` in lakhs)2018 2017
Chairman and Managing directori. Salaries, allowances and perquisites ^ 450 448ii. Contribution to provident and other funds 37 36iii. Performance bonus * 153 233
Total 640 717
^ Excludes leave encashment and gratuity liability provided on the basis of actuarial valuation on an overall Company basis. Further the Essel Employee Stock Option Scheme 2014 does not extend to chairman and managing director, hence there is no share based compensation benefit.
* The performance bonus for the current year has been provided in the accounts as recommended by the nomination and remuneration committee and approved by the Board of Directors. The total remuneration to Managing Director on this basis as computed as per the Companies Act, 2013 is within limits prescribed u/s 197 of the Companies Act, 2013.
47 Dividend of ` 3 lakhs (31 March 2017 : ` 2 lakhs) unclaimed for a period of more than seven years is transferred to Investor Education and Protection Fund during the year. There is no amount due and outstanding to be credited to Investor Education and Protection Fund as at 31 March 2018.
48 Dividends paid and proposed
(` in lakhs)2018 2017
a. Dividends on equity shares declared and paidFinal dividend paid in current year for the year ended 31 March 2017 ` 2.40 per share (Paid in previous year for the year ended 31 March 2016 : `. 2.20 per share)
3,770 3,455
Dividend distribution tax on above 768 703 b. Proposed dividends on equity shares
Final dividend proposed for the year ended 31 March 2018 ` 2.40 per share (31 March 2017 : ` 2.40 per share)
3,772 3,770
Dividend distribution tax on above 775 768
Proposed dividends on equity shares are subject to approval of shareholders at the annual general meeting and are not recognised as a liability (including dividend distribution tax thereon) as at the reporting date.
49 CorporateSocialResponsibility(CSR)
During the year, the Company has towards various CSR initiatives spent ` 78 lakhs (31 March 2017 : ` 42 lakhs) as against ` 179 lakhs (31 March 2017 : ` 165 lakhs) as required by Section 135 read with Schedule VII of the Companies Act 2013. CSR spend has been charged to the consolidated statement of profit and loss under “Other expenses” in line with ICAI guidance note issued in May 2015.
50 ResearchandDevelopmentexpenditure(R&D)
During the year, the Company has incurred total R & D expenditure of ` 532 lakhs (31 March 2017 : ` 562 lakhs) including capital expenditure of ` Nil (31 March 2017 : ` 66 lakhs), out of which the Company has claimed weighted tax deduction on eligible R & D expenditure of ` 440 lakhs (31 March 2017 : ` 470 lakhs) including capital expenditure of ` Nil (31 March 2017 : ` 66 lakhs) under section 35(2AB) of the Income Tax Act, 1961.

Notes forming part of the consolidated financial statements
173Annual Report 2017-18
51 Goods and Services Tax
Following the commencement of Goods and Services Tax (GST) with effect from 1 July 2017, revenue from operations for the period beginning 1 July 2017 is reported net of GST recovered, as required by Ind AS in case of parent company. However, prior to GST regime, excise duty recovered was included as part of revenue from operations for the reporting period till 30 June 2017 as required by Ind AS. Accordingly, the revenue from operations for the year ended 31 March 2018 are not comparable with the corresponding previous year figures presented in the consolidated financial statements. To facilitate comparison, the following additional information is being provided:
(` in lakhs)2018 2017
Revenue from operations as reported* 244,642 238,794 Excise duty included in above (till 30 June 2017) 2,254 8,565 Revenue from operations excluding excise duty 242,388 230,229
*Effective from 1 July 2017 following transition to GST, revenue is reported net of GST recovered.
52. Gratuityandotherpostemploymentbenefitplans
The disclosures of employee benefits as defined in the Ind AS 19 - ”Employee Benefits” are given below:
a. The Company makes annual contributions to the employees’ gratuity fund scheme, a funded defined benefit plan which is managed by the LIC of India and HDFC Bank. The present value of obligation is determined based on actuarial valuation using the projected unit credit method, which recognizes each period of service as giving rise to additional unit of employee benefit entitlement and measures each unit separately to build up the final obligation.
b. Leave encashment is a non-funded defined benefit scheme. The obligation for leave encashment is recognized in the same manner as gratuity.
c. Details of post retirement gratuity plan for India are as follows:-
i. Expensesrecognisedduringtheyearintheconsolidatedstatementofprofitandloss
(` in lakhs)2018 2017
Current service cost 84 66 Interest cost 76 59 Benefits paid by employer - 1 Net expenses 160 126
ii Expensesrecognisedduringtheyearinothercomprehensiveincome(OCI)
(` in lakhs)2018 2017
Actuarial (gains) / losses arising from changes in demographic assumptions
(6) 1
Actuarial (gains) / losses arising from changes in financial assumptions 83 101 Actuarial (gains) / losses arising from changes in experience assumptions
38 86
Expected return on plan assets excluding interest (2) (6)Net expenses recognised in OCI 113 182

Notes forming part of the consolidated financial statements
174
iii Net liability recognised in the consolidated balance sheet
(` in lakhs)2018 2017
Present value of obligation 1,569 1,304 Less: Fair value of plan assets 559 324 Liability recognized in consolidated balance sheet 1,010 980
iv. Reconciliationofopeningandclosingbalancesofdefinedbenefitobligation
(` in lakhs)2018 2017
Definedbenefitobligationasatthebeginningoftheyear 1,304 1,105 Current service cost 84 66 Interest cost 100 87 Actuarial (gain) / loss on obligation 115 188 Liability transferred in/ (paid) - (18)Benefits paid (34) (124)Definedbenefitobligationattheendoftheyear 1,569 1,304
v Reconciliation of opening and closing balance of fair value of plan assets
(` in lakhs)2018 2017
Fair values of plan assets at the beginning of the year 324 353 Interest income 24 28 Return on plan assets, excluding interest income 2 6 Employer contribution 243 61 Benefits paid (34) (124)Fair value of plan assets at year end 559 324
vi Reconciliationofopeningandclosingbalanceofnetdefinedbenefitobligation
(` in lakhs)2018 2017
Definedbenefitobligationasatthebeginningoftheyear 980 752 Current service cost 84 66 Interest cost (net) 76 59 Actuarial (gain) / loss on obligation 115 188 Liability transferred in/ (paid) - (18)Return on plan assets, excluding interest income (2) (6)Employer contribution (243) (61)Benefits paid - 0 Netdefinedbenefitobligationattheendoftheyear 1,010 980

Notes forming part of the consolidated financial statements
175Annual Report 2017-18
vii. Investment details
(` in lakhs)2018 2017
Insurer Managed Funds 559 324
viii. Actuarial assumptions
2018 2017Mortality Table Indian Assured
Lives mortality(2006-08) Ultimate
Indian Assured Lives mortality
(2006-08) Ultimate
Discount rate(per annum) 7.87% 7.71%Expected rate of return on plan assets (per annum) 7.87% 7.71%Rate of escalation in salary (per annum) 6.00% 5.00%Attrition rate Service 4 years
and below - 10%, others - 1%
Service 4 years and below - 5%,
others - 1%
ix. Quantitative sensitivity analysis
(` in lakhs)2018 2017
Projectedbenefitobligationoncurrentassumptions 1,569 1,304 Increase by 1% in discount rate (96) (41)Decrease by 1% in discount rate 111 45 Increase by 1% in rate of salary increase 112 45 Decrease by 1% in rate of salary increase (99) (43)Increase by 1% in rate of employee turnover 15 10 Decrease by 1% in rate of employee turnover (17) (10)
x. Maturityanalysisofprojectedbenefitobligationfromthefund
(` in lakhs)2018 2017
Projected benefits payable in future years from the date ofreporting1st Following Year 239 221 2nd Following Year 33 26 3rd Following Year 524 30 4th Following Year 49 505 5th Following Year 61 43 Sum of years 6 to 10 460 350 Sum of years 11 and above 1,916 1,475
Notes:
1 Amounts recognized as an expense and included in the Note 33 “Employee benefits expense” are gratuity ` 84 lakhs (31 March 2017 : ` 66 lakhs) and leave encashment ` 153 lakhs (31 March 2017 : ` 241 lakhs). Net interest cost on defined benefit obligation recognised in Note 34 under “Finance costs” is ` 76 Lakhs (31 March 2017 : ` 59 Lakhs).

Notes forming part of the consolidated financial statements
176
2 The estimate of future salary increases considered in the actuarial valuation takes into account the rate of inflation, seniority, promotion and other relevant factors, such as supply and demand in the employment market.
3 Contribution to provident and other funds” which is a defined contribution plan is recognized as an expense in Note 33 of the consolidated financial statements.
d. Details of post retirement gratuity plan in respect of a subsidiary in Philippines are as follows:- The Company has a funded, noncontributory defined benefit pension plan covering substantially all its regular
employees (main plan) and an unfunded, noncontributory defined benefit pension plan covering officers (supplemental plan). The benefits are based on the years of service and compensation of the employees. The tables below summarize the components of net pension benefits cost recognized in profit or loss and the funding status and amounts recognized in the balance sheets for the respective pension plans.
i. Expensesrecognisedduringtheyearinthestatementofprofitandloss
(` in lakhs)2018 2017
Current service cost 25 23 Interest cost 11 13 Benefits paid by employer (8) (10)Net expenses 28 26
ii. Expensesrecognisedduringtheyearinothercomprehensiveincome(OCI)
(` in lakhs)2018 2017
Net actuarial (gain) / loss transferred to OCI (38) 43
iii. Net liability recognised in the consolidated balance sheet
(` in lakhs)2018 2017
Fair value of plan assets 137 128 Present value of obligation 174 202 Liability recognized in the consolidated balance sheet 37 74
iv. Reconciliationofopeningandclosingbalancesofdefinedbenefitobligation
(` in lakhs)2018 2017
Definedbenefitobligationasatthebeginningoftheyear 202 224 Current service cost 25 23 Interest cost 11 13 Actuarial (gain) / loss on obligation (26) (2)Liability transferred in/ (paid) (9) 40 Benefits paid (21) (76)Exchange Adjustments (8) (20)Definedbenefitobligationattheendoftheyear 174 202

Notes forming part of the consolidated financial statements
177Annual Report 2017-18
v. Reconciliation of opening and closing balance of fair value of plan assets
(` in lakhs)2018 2017
Fair values of plan assets at the beginning of the year 128 198 Interest income - - Return on plan assets, excluding interest income 8 10 Employer contribution 25 13 Benefits paid (19) (77)Exchange Adjustments (5) (16)Fair value of plan assets at year end 137 128
vi Reconciliationofopeningandclosingbalanceofnetdefinedbenefitobligation
(` in lakhs)2018 2017
Definedbenefitobligationasatthebeginningoftheyear 74 26 Current service cost 25 23 Interest cost (net) 11 13 Actuarial (gain) / loss on obligation (26) (2)Liability transferred in/ (paid) (9) 40 Return on plan assets, excluding interest income (8) (10)Employer contribution (25) (13)Benefits paid (2) 1 Exchange Adjustments (3) (4)Netdefinedbenefitobligationattheendoftheyear 37 74
vii. Actuarial assumptions
2018 2017Discount rate(per annum) 7.39% 5.44%Expected rate of return on plan assets (per annum) 5.23% 5.00%Rate of escalation in salary (per annum) 7.00% 6.00%
viii. Quantitative sensitivity analysis
(` in lakhs)2018 2017
Projectedbenefitobligationoncurrentassumptions 174 202 Increase by 0.5% in Discount rate 173 189 Decrease by 0.5% in Discount rate 175 217 Increase by 0.5% in Rate of Salary Increase 175 217 Decrease by 0.5% in Rate of Salary Increase 173 188 Increase by 0.5% in Rate of Employee Turnover 173 200 Decrease by 0.5% in Rate of Employee Turnover 175 204
Notes: 1 Amounts recognized as an expense and included in the consolidated statement of profit and loss ` 28
lakhs (31 March 2017 : ` 26 lakhs).
2 The estimate of future salary increases considered in the actuarial valuation, taking into account the rate of inflation, seniority, promotion and other relevant factors, such as supply and demand in the employment market.

Notes forming part of the consolidated financial statements
178
53 Share-based payments
Employee stock option plan
a) During the year 2014-15, the parent company had instituted an Essel Employee Stock Option Scheme 2014 (“the Scheme”) as approved by the Board of Directors for issuance of stock options to the eligible employees of the Company and of its subsidiaries, other than directors, promoters or person belonging to promoter group.
Subject to terms and conditions of the Scheme, the said options will vest on each of 1 July 2016, 1 July 2017 and 1 July 2018 to the extent mentioned in the letter of grant and can be exercised within a maximum period of four years from the date of vesting. When exercisable, each option is convertible into one equity share of ` 2 each fully paid up.
b) SummaryofoptionsgrantedundertheScheme
2018 2017Average
exercise price per share option(`)
Number of options
Average exercise price
per share option(`)
Number of options
Opening balance 127.83 1,920,842 123.97 2,992,535 Granted during the year - - 203.56 152,507 Exercised during the year (Refer note (i) below)
121.65 (80,166) 121.65 (57,333)
Forfeited during the year- Non-vested options (Refer
Note (ii) below) 134.96 (1,039,514) 126.06 (1,166,867)
- Vested options (Refer Note (iii) below)
121.65 (34,334) - -
Closing balance 766,828 1,920,842 Vested and exercisable 121.65 766,828 121.65 881,328
c) Expirydateandexercisepricesoftheshareoptionsoutstandingattheendoftheyear:
Grant date Expiry date Exercise price (`)
Share options2018 2017
19 March 2015 30 June 2020 121.65 766,828 881,328 19 March 2015 30 June 2022 121.65 - 841,339 29 October 2015 30 June 2022 161.00 - 45,668 17 June 2016 30 June 2022 196.40 - 113,096 1 September 2016 30 June 2022 224.10 - 39,411 Total 766,828 1,920,842 Weighted average remaining contractual life of options outstanding at end of period
2.25 4.33
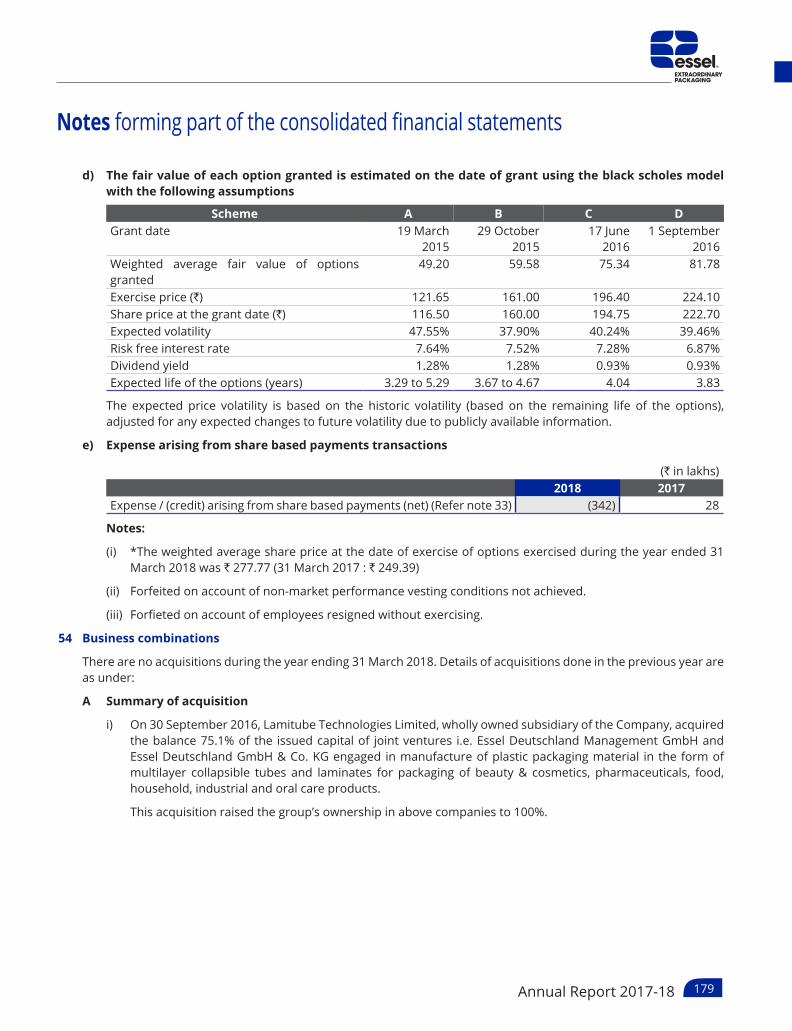
Notes forming part of the consolidated financial statements
179Annual Report 2017-18
d) Thefairvalueofeachoptiongrantedisestimatedonthedateofgrantusingtheblackscholesmodelwith the following assumptions
Scheme A B C DGrant date 19 March
201529 October
201517 June
20161 September
2016Weighted average fair value of options granted
49.20 59.58 75.34 81.78
Exercise price (`) 121.65 161.00 196.40 224.10Share price at the grant date (`) 116.50 160.00 194.75 222.70Expected volatility 47.55% 37.90% 40.24% 39.46%Risk free interest rate 7.64% 7.52% 7.28% 6.87%Dividend yield 1.28% 1.28% 0.93% 0.93%Expected life of the options (years) 3.29 to 5.29 3.67 to 4.67 4.04 3.83
The expected price volatility is based on the historic volatility (based on the remaining life of the options), adjusted for any expected changes to future volatility due to publicly available information.
e) Expensearisingfromsharebasedpaymentstransactions
(` in lakhs)2018 2017
Expense / (credit) arising from share based payments (net) (Refer note 33) (342) 28
Notes:
(i) *The weighted average share price at the date of exercise of options exercised during the year ended 31 March 2018 was ` 277.77 (31 March 2017 : ` 249.39)
(ii) Forfeited on account of non-market performance vesting conditions not achieved.
(iii) Forfieted on account of employees resigned without exercising.
54 Business combinations
There are no acquisitions during the year ending 31 March 2018. Details of acquisitions done in the previous year are as under:
A Summary of acquisition
i) On 30 September 2016, Lamitube Technologies Limited, wholly owned subsidiary of the Company, acquired the balance 75.1% of the issued capital of joint ventures i.e. Essel Deutschland Management GmbH and Essel Deutschland GmbH & Co. KG engaged in manufacture of plastic packaging material in the form of multilayer collapsible tubes and laminates for packaging of beauty & cosmetics, pharmaceuticals, food, household, industrial and oral care products.
This acquisition raised the group’s ownership in above companies to 100%.

Notes forming part of the consolidated financial statements
180
Summaryofassetsacquiredandliabilitiesassumedasattheacquisitiondate(30September2016):
The fair values of the identifiable assets and liabilities of the above joint ventures at the date of acquisition are as under:
(` in lakhs)Essel
Deutschland Management
GmbH
Essel Deutschland
GmbH&Co.KGTotal
AssetsTrade and other receivables (Current) - 2,086 2,086 Inventories - 3,640 3,640 Cash and bank balances 52 2,099 2,151 Other assets 1 983 984 Intangible assets - customer contract / concessions
- 45 45
Property, plant and equipment - 16,934 16,934 Totalassets(A) 53 25,787 25,840 Less: LiabilitiesBorrowings - 3,711 3,711 Current liabilities 6 4,831 4,837 Non-current liabilities - 1,989 1,989 Totalliabilities(B) 6 10,531 10,537 Netidentifiableassetsacquired(A-B) 47 15,256 15,303
ii) Purchaseconsideration
(` in lakhs)Essel
Deutschland Management
GmbH
Essel Deutschland
GmbH&Co.KGTotal
Cash paid 28 12,880 12,908 Total purchase consideration 28 12,880 12,908
iii) Acquisitiondatefairvalueofthepreviouslyheldequityinterest
(` in lakhs)Essel
Deutschland Management
GmbH
Essel Deutschland
GmbH&Co.KGTotal
Fair value of the previously held equity interest 12 3,799 3,811 Acquisition date fair value of the previously held equity interest
12 3,799 3,811

Notes forming part of the consolidated financial statements
181Annual Report 2017-18
iv) Computationofgoodwill
(` in lakhs)Essel
Deutschland Management
GmbH
Essel Deutschland
GmbH&Co.KG
Consideration transferred 28 12,880 Acquisition date fair value of the previously held equity interest 12 3,799 Less: Net assets acquired (47) (15,256)Goodwill/(capitalreserve)arisingonacquisition (7) 1,423
v) The group previously held 24.9% in both the joint ventures. The same was accounted as per equity method till 30 September 2016. Gain recognised in the previous year ended 31 March 2017 as a result of remeasuring this equity interest in the acquiree at fair value is transferred to the consolidated statement of profit and loss as detailed in (vi) below.
vi) Gainrecognisedinthepreviousyearasaresultofremeasuringtheequityinterestintheacquireeatfair value
(` in lakhs)Essel
Deutschland Management
GmbH
Essel Deutschland
GmbH&Co.KGTotal
Acquisition date fair value of the previously held equity interest
12 3,799 3,811
Add: Foreign currency translation reserve - 142 142 Less: Carrying value of the previously held equity interest
(12) (1,423) (1,435)
Gainrecognisedasexceptionalitem(Refernote44)
- 2,518 2,518
B Purchaseconsideration-cashoutflow
(` in lakhs)2017
Outflow of cash to acquire subsidiaries, net of cash acquiredCash consideration 12,908 Less: Acquired on acquisitionCash and bank balances 2,151 Netoutflowofcash-investingactivities 10,757

Notes forming part of the consolidated financial statements
182
55 InterestinAssociateandJointventures
a) InterestinAssociate
The group has 30% interest in PT Lamipack Primula (associate) having its operations in Indonesia. The group’s interest in the associate is accounted for using the equity method in the consolidated financial statements. Summarised financial information of the group’s investment in the associate is as under :
i) Summarisedbalancesheetisasunder:
(` in lakhs)2018 2017
Current assets 9,627 9,643 Non-current assets* 7,648 7,896 Current liabilities (10,532) (8,018)Non-current liabilities (4,091) (6,143)Equity 2,652 3,378 Proportion of the Company’s ownership (%) 30% 30%Proportion of the Company’s ownership (`) 796 1,012 Add: Goodwill 514 514 Carryingamountoftheinvestments(Refernote5) 1,310 1,526
*Non-current assets is net of adjustment for policy difference and is after excluding the effect of revaluation of property, plant and equipment done by the associate amounting to ̀ 2,612 lakhs as at 31 March 2018 and ` 2,723 lakhs as 31 March 2017 to align with the Group’s policy.
ii) Summarisedstatementofprofitandlossisasunder:
(` in lakhs)2018 2017
Total revenue 16,339 16,585 Profit for the year (795) 193 Other comprehensive income for the year (119) (32)Total comprehensive income (914) 161 Group's share of profit for the year (30%) (239) 58 Group's share of Other comprehensive income (30%) (36) (10)
iii) Dividendreceived:
(` in lakhs)2018 2017
Dividend received from Associate 85 -
b) InterestinJointventures
i) Thegrouphadinterestinfollowingjointventureswhichwasaccountedforusingtheequitymethodin the CFS :
Name of entity Place of business %ofownershipinterest
Relationship
Essel Deutschland Management Gmbh** Germany 24.9% Joint ventureEssel Deutschland GmbH & Co. KG** Germany 24.9% Joint venture
** Ceased to be joint ventures and became wholly owned subsidiaries w.e.f. 30 September 2016 [Refer note 3A(ii)(d)]

Notes forming part of the consolidated financial statements
183Annual Report 2017-18
ii) Summarisedbalancesheetisasunder:
(` in lakhs)
EsselDeutschlandGmbH&Co.KG* As at 30 September 2016
Current assetsCash and cash equivalents 910 Other assets 5,282 Total Current assets 6,192 Total non-current assets 9,113
Current liabilitiesFinancial liabilities (excluding trade payables) (2,418)Other liabilities (4,171)Total current liabilities (6,589)Non-current liabilitiesFinancial liabilities (excluding trade payables) (3,521)Other liabilities (54)Total non-current liabilities (3,575)
Equity 5,141 Proportion of the Company’s ownership 24.9%Carrying amount of the investment 1,280 Less: Transferred on acquisition (1,280)Net amount -
(` in lakhs)
EsselDeutschlandManagementGmbH* As at 30 September 2016
Current assetsCash and cash equivalents 52 Other assets 1 Total current assets 53 Total non-current assets -
Current liabilitiesFinancial liabilities (excluding trade payables) - Other liabilities (5)Total current liabilities (5)
Equity 48 Proportion of the Company’s ownership 24.9%Carrying amount of the investment 12 Less: Transferred on acquisition (12)Net amount -

Notes forming part of the consolidated financial statements
184
iii) Summarisedstatementofprofitandlossisasunder:
(` in lakhs)
EsselDeutschlandGmbH&Co.KG* Halfyearended 30 September 2016
Revenue from operations 12,228 Other income 237 Cost of raw material and components (7,051)Depreciation (829)Finance costs (52)Other expenses (4,304)Profitbeforetax 229 Less: Income tax expense (39)Profit/(loss)fortheyear 190 Add: Other comprehensive income - Total comprehensive income 190 Group’s share of profit for the year (24.9%) 47 Group’s share of Other comprehensive income (24.9%) -
(` in lakhs)
EsselDeutschlandManagementGmbH* Halfyearended 30 September 2016
Revenue from operations 44 Other income - Cost of raw material and components - Depreciation - Finance costs - Other expenses (43)Profitbeforetax 1 Less: Income tax expense 1 Profit/(loss)fortheyear - Add: Other comprehensive income - Total comprehensive income - Group's share of profit for the year (24.9%) - Group's share of Other comprehensive income (24.9%) -
* Accounted as wholly owned subsidiaries effective from 30 September 2016

Notes forming part of the consolidated financial statements
185Annual Report 2017-18
56 Income tax
a) Themajorcomponentsofincometaxfortheyearended31March2018areasunder:
i) Income tax related to items recogniseddirectly in the consolidated statementofprofitand lossduring the year
(` in lakhs)2018 2017
Current taxCurrent tax on profits for the year 9,342 7,175 Adjustments for current tax of prior periods (218) (91)Total current tax expense 9,124 7,084
Deferred taxRelating to origination and reversal of temporary differences (233) 785
Income tax expense reported in the consolidated statement of profitandloss
8,891 7,869
ii) DeferredtaxrelatedtoitemsrecognizedinOtherComprehensiveIncome(OCI)duringtheyear
(` in lakhs)2018 2017
Deferred tax on remeasurements of the defined benefit plans 29 75 Deferred tax on share of OCI of associate 7 3 Deferred tax recognised in OCI 36 78
b) Reconciliationoftaxexpenseandtheaccountingprofitfortheyearisasunder:
(` in lakhs)2018 2017
Profitbeforetax 26,312 27,429
Income tax expense calculated at corporate tax rate* 9,194 9,493
Adjustments in respect of current income tax in respect of previous years (115) 13 Utilisation of unrecognised deferred tax assets on unused tax losses (208) (241)Tax effect on non-deductible expenses 1,859 1,102 Additional allowance for tax purpose (1,180) (756)Effect of income that is exempted from tax (171) (342)Effect of different tax rates (449) (1,327)Other temporary differences (39) (73)Incometaxexpensechargedtotheconsolidatedstatementofprofitandloss 8,891 7,869
* The tax rate used for reconciliation above is the corporate tax rate of 34.944% (31 March 2017 : 34.608%) payable by parent entity in India on taxable profits under Indian tax law.

Notes forming part of the consolidated financial statements
186
c) Deferredtaxrelatestothefollowing:
(` in lakhs)
Balance sheetRecognised in the statementofprofit
and lossRecognised in OCI
2018 2017 2018 2017 2018 2017Deferredtaxliabilities(net)TaxabletemporarydifferencesDepreciation on property, plant and equipment and intangible assets
3,664 4,381 (717) 831 - -
Outside basis tax 944 744 200 (22) - - Unamortised ancillary borrowing costs 9 33 (24) (9) - - Other taxable temporary differences 18 - 18 -
4,635 5,158 (523) 800 - -
Less:DeductibletemporarydifferencesEmployee benefits / expenses allowable on payment basis
873 671 (202) 122 - -
Allowance for bad and doubtful debts 196 194 (2) 3 - - Other deductible temporary differences - 217 217 57 - -
1,069 1,082 13 182 - - Deferredtaxliabilities(net)(a) 3,566 4,076 (510) 618 - -
Deferredtaxassets(net)DeductibletemporarydifferencesEmployee benefits / expenses allowable on payment basis
304 405 137 (259) (36) (78)
Unrealised profit on Inter company transactions
113 196 83 (37) - -
Unused tax losses 137 315 178 (41) - - 554 916 398 (337) (36) (78)
Less:TaxabletemporarydifferencesOther taxable temporary differences 11 12 (1) (3) - -
11 12 (1) (3) - - Deferredtaxassets(net)(b) 543 904 397 (334)Sub-total(a-b) (113) 952 Add: Foreign currency translation (120) 20
Less: Deferred tax movement on acquisition of joint ventures
- (187)
Deferredtaxcharge/(credit)recognisedintheconsolidatedstatementofprofitand loss
(233) 785 (36) (78)

Notes forming part of the consolidated financial statements
187Annual Report 2017-18
d) The parent company and its subsidiaries have the following unused tax losses which arose on incurrence of capital losses and business losses under the Income Tax for which no deferred tax asset (DTA) has been recognised
(` in lakhs) 2018 2017
Business loss 3,963 4,425 DTA on business loss 747 854
Capital loss 2,714 2,714 DTA on capital loss 632 615
57 Financial risk management
The group has exposure to the following risks arising from financial instruments:
- Credit risk;
- Liquidity risk;
- Market risk - Foreign currency; and
- Market risk - Interest rate
A Credit risk Credit risk is the risk of financial loss to the group if a customer or counter party to a financial instrument fails
to meet its contractual obligations. The Company is exposed to credit risk from its operating activities (primarily trade receivables) and from its financing activities, including lease rental deposits, deposits with banks and other financial instruments. Credit risk arises from the possibility that counter party may not be able to settle their obligations as agreed.
i) Tradereceivables
The group extends credit to customers in the normal course of business. The group considers factors such as financial conditions / market practices, credit track record in the market, analysis of historical bad debts and past dealings for extension of credit to customers. Individual credit limits are set accordingly. The group monitors the payment track record of the customers and ageing of receivables. Outstanding customer receivables are regularly monitored. The group considers the concentration of risk with respect to trade receivables as low, as its customers are located in several jurisdictions and industries and operate in largely independent markets. The group has also taken advances and security deposits from some of its customers, which mitigate the credit risk to an extent.
ii) The ageing analysis of the receivables (net of allowance for bad and doubtful debts) has beenconsidered from the date the invoice falls due.
(` in lakhs) 2018 2017
Up to 3 months 44,133 36,541 3 to 6 months 1,345 786 More than 6 months 426 335 Total 45,904 37,662

Notes forming part of the consolidated financial statements
188
iii) Thefollowingtablesummarizesthechangeintheallowanceforbadanddoubtfuldebts:
(` in lakhs)
As at 1 April 2016 704 Provided during the year 245 Amounts written off (188)Reversals of provision (111)As at 31 March 2017 650 Provided during the year 174 Amounts written off (134)Reversals of provision (39)As at 31 March 2018 651
The Group uses a provision matrix whereby trade receivables are considered impaired based on past trends where such receivables are outstanding for more than a year. The allowance for lifetime expected credit loss on customer balances for the year ended 31 March 2018 and 31 March 2017 is not material and the same has not been recognised. The reversal for lifetime expected credit loss on customer balances for the year ended 31 March 2018 is ` Nil (31 March 2017: ` Nil)
iv) Otherfinancialinstruments
The group considers factors such as track record, size of the institution, market reputation, financial strength / rating and service standards to select the banks with which balances and deposits are maintained. Generally, the balances are maintained with the institutions with which the group has also availed borrowings. Security deposits against leasing of premises / equipments are refundable upon closure of the lease and hence credit risk associated with such deposits is relatively low.
B Liquidity risk
i) Liquidity risk is defined as the risk that the group will not be able to settle or meet its obligations on time or at a reasonable price. For the group, liquidity risk arises from obligations on account of financial liabilities – borrowings, trade payables, derivative instruments and other financial liabilities.
The group’s approach to managing liquidity is to ensure, as far as possible, that it will always have sufficient liquidity to meet its liabilities when due, under both normal and stressed conditions, without incurring unacceptable losses or risking damage to the group’s reputation. The group manages liquidity risk by maintaining adequate reserves, by continuously monitoring forecast and actual cash flows and matching the maturity profiles of the financial assets and liabilities. It maintains adequate sources of financing including loans, debts and overdraft from banks. It also enjoys strong access to domestic capital markets across various debt instruments.

Notes forming part of the consolidated financial statements
189Annual Report 2017-18
ii) Exposuretoliquidityrisk
The following are the remaining contractual maturities of financial liabilities at the reporting date. The contractual cash flow amounts are gross and undiscounted.
As at 31 March 2018Maturitiesofnon–derivativefinancialliabilities (` in lakhs)
Less than 1 year
Between 1 and 5 years
Beyond 5 years Total
Long term borrowings 13,853 38,342 4,018 56,213 Short term borrowings 17,504 - - 17,504 Interest payable 2,318 5,095 1,908 9,321 Trade payables 18,842 - - 18,842 Other financial liabilities 15,522 - - 15,522 Total 68,039 43,437 5,926 117,402
Maturitiesofderivativefinancialliabilities (` in lakhs)Less than 1
yearBetween 1 and
5 yearsBeyond 5
years Total
Foreign exchange forward contracts 5 - - 5 Total 5 - - 5
As at 31 March 2017Maturitiesofnon–derivativefinancialliabilities (` in lakhs)
Less than 1 year
Between 1 and 5 years
Beyond 5 years Total
Long-term borrowings 10,644 46,486 14,823 71,953 Short-term borrowings 8,685 - - 8,685 Interest payable 3,362 7,497 2,351 13,210 Trade payables 14,732 - - 14,732 Other financial liabilities 14,845 - - 14,845 Total 52,268 53,983 17,174 123,425
Maturitiesofderivativefinancialliabilities (` in lakhs)Less than 1
yearBetween 1 and
5 yearsBeyond 5
years Total
Foreign exchange forward contracts 440 - - 440 Interest rate swap contract 8 - - 8 Total 448 - - 448
C Market risk
Market risk is the risk that changes in market prices, such as foreign exchange rates, interest rates and equity prices will affect the group’s income or the value of its holdings of financial instruments. The objective of market risk management is to manage and control market risk exposures within acceptable parameters, while optimising the return. The sensitivity analysis excludes the impact of movements in market variables on the carrying value of post-employment benefit obligations provisions and on the non-financial assets and liabilities. The sensitivity

Notes forming part of the consolidated financial statements
190
of the relevant profit and loss item is the effect of the assumed changes in respective market risks.
The group’s activities expose it to risks on account of changes in foreign currency exchange rates and interest rates. The Company uses derivative financial instruments such as foreign exchange forward contracts and interest rate swaps of varying maturity depending upon the underlying contract as a risk management strategy to manage its exposures to foreign exchange fluctuations and interest rate.
I Foreign currency risk
Currency risk is the risk that the fair value or future cash flows fluctuate because of changes in market prices of various currencies against the functional currency. The Group is exposed to currency risk on their receivables, payables and foreign currency loans and advances held other than in their respective functional currencies. Such exposure is with respect to the United State Dollar (“USD”), the Euro (“EUR”), the Swiss Franc (“CHF”), the Pound Sterling (“GBP”) and others. Consequently, the Group is exposed primarily to the risk that the exchange rate of the functional currency relative to the USD, the EUR, the CHF, the GBP and others may change in a manner that has a material effect on the reported values of the Company and its subsidiaries’ assets and liabilities that are denominated in these foreign currencies.
The group evaluates exchange rate exposure arising from foreign currency transactions and follows established risk management policies, including minimising cross currency transactions, using natural hedge and use of derivatives like foreign exchange forward contracts in order to minimise the impact of exchange rate movements on the results. The unhedged exposures are monitored and kept to minimum feasible.
Exchange differences arising on translation are accumulated in the Foreign Currency Translation Reserve (FCTR) until the disposal of foreign operations.
a) Foreigncurrencyriskexposure (` in lakhs)
2018 2017USD EUR CHF GBP Others USD EUR CHF GBP Others
Financial assetsTrade receivables 5,547 2,005 74 61 - 5,412 6,595 - 141 504 Cash and bank balances
873 205 0 - - 494 274 - 292 3
Others 253 56 - - 230 221 68 - - 186 Derivative assetsForeign exchange forward contracts
(13) - - - - (649) - - - (504)
Net exposure to foreign currency risk (assets)
6,660 2,266 74 61 230 5,478 6,937 - 433 189
Financial liabilitiesBorrowings 370 1,002 1,245 - - 1,751 3,907 1,302 - - Trade payables 4,838 2,897 - 743 491 5,542 2,799 519 389 160 Others 32 - 3 - 18 255 48 5 - 17 Derivative liabilitiesForeign exchange forward contracts
(1,208) - (1,245) - (247) (3,967) - (1,302) - (122)
Net exposure to foreign currency risk (liabilities)
4,032 3,899 3 743 262 3,581 6,754 524 389 55

Notes forming part of the consolidated financial statements
191Annual Report 2017-18
The above table exclude foreign currency exposures (financial liabilities) of ̀ 6,768 lakhs (31 March 2017 : ` 11,860 lakhs) denominated primarily in USD, EUR and CHF currencies for which the exchange differences (net) are being capitalised to cost of property, plant and equipment. Accordingly the corresponding foreign exchange forward contracts against these financial liabilities amounting to ̀ 1,829 lakhs (31 March 2017 : ` 4,828 lakhs) have been excluded.
b) Sensitivitytoforeigncurrencyrisk
The following table demonstrates the sensitivity in the USD, EUR, CHF, GBP and other currencies with all other variables held constant. The below impact on the group’s profit before tax and equity is based on changes in the fair value of unhedged foreign currency monetary assets and liabilities at balance sheet date:
(` in lakhs)
Currencies/Sensitivity2018 2017
Increaseby5% Decreaseby5% Increaseby5% Decreaseby5%(Loss)/Gain (Loss)/Gain
USD 131.44 (131.44) 94.88 (94.88)EUR (81.66) 81.66 9.13 (9.13)CHF 3.56 (3.56) (26.20) 26.20 GBP (34.09) 34.09 2.26 (2.26)Others (1.59) 1.59 6.76 (6.76)
II Interest rate risk
This refers to risk to group’s cash flow and profits on account of movement in market interest rates.
For the group the interest risk arises mainly from interest bearing borrowings which are at floating interest rates. To mitigate interest rate risk, the group closely monitors market interest and as appropriate make use of hedge products such as interest rate swaps.
a) Interestrateriskexposure
(` in lakhs)2018 2017
Variable rate borrowings 62,725 74,049 Fixed rate borrowings 10,992 6,589 Total borrowings 73,717 80,638
b) Interestratesensitivity
The following table illustrates the sensitivity of profit and equity to a reasonably possible change in interest rate of 50 basis point increase or decrease. The calculations are based on the variable rate borrowings outstanding at balance sheet date. All other parameters are held constant.
(` in lakhs)Impactonprofitaftertax
2018 2017Interest rates - (increase) by 50 basis points (314) (375)Interest rates - decrease by 50 basis points 314 375

Notes forming part of the consolidated financial statements
192
58 Capital management
a) Riskmanagement
The group manages its capital structure and makes necessary adjustments in light of changes in economic conditions and the requirement of financial covenants. To maintain or adjust the capital structure, the group may adjust the dividend payment to shareholders, return capital to shareholders, issue new shares or raise / retire debt. The primary objective of the group’s capital management is to maximise the shareholders’ value.
For the purpose of the group’s capital management, equity includes issued capital, securities premium and other reserves. Net debt includes loans less cash and bank balances. The group manages capital by monitoring gearing ratio which is net debt divided by equity plus net debt.
The capital composition is as follows:
(` in lakhs)2018 2017
Gross debt (inclusive of long term and short term borrowing) 73,717 80,638 Less: Cash and bank balances* 17,378 10,313 Net debt 56,339 70,325 Total equity (including non-controlling interest) 125,489 104,471 Total capital 181,828 174,796 Gearing ratio 31% 40%
* Including deposits with banks having original maturity period of more than 12 months of ` 20 lakhs (31 March 2017 ` 29 lakhs) shown under other non current financial assets.
b) Loancovenants
Borrowings contain certain debt covenants relating to limitation on indebtedness, debt-equity ratio, debt to EBITDA ratio, interest service coverage ratio and debt service coverage ratio. The limitation on indebtedness covenant gets suspended once the Group meets certain prescribed criteria. The debt covenant related to limitation on indebtedness remained suspended as of the date of adoption of the consolidated financial statements. The Group has also satisfied all other debt covenants prescribed in the respective sanction of bank loan. The deferred sales tax loans and finance leases do not carry any debt covenant.

Notes forming part of the consolidated financial statements
193Annual Report 2017-18
59 Fair value measurements
i) Financialinstrumentsbycategory:
(` in lakhs)2018 2017
FVTPL Amortised cost FVTPL Amortised costFinancial assets Loans 12,636 - 13,651 Trade receivables - 45,904 - 37,662 Cash and bank balances* - 17,378 - 10,313 Derivative instruments 41 - 2 - Other financial assets - 198 - 198 Totalfinancialassets 41 76,116 2 61,824
Financial liabilitiesBorrowings (including current maturities)
- 73,404 - 79,835
Trade payables - 18,842 - 14,732 Derivative instruments 5 - 448 - Other financial liabilities - 15,522 - 14,845 Totalfinancialliabilities 5 107,768 448 109,412
* Including deposits with banks having original maturity period of more than twelve months of ` 20 lakhs (31 March 2017 ` 29 lakhs) shown under other non current financial assets.
ii) Fairvaluehierarchy
The fair values of the financial assets and liabilities are included at the amount that would be received to sell an asset or paid to transfer a liability in an orderly transaction between market participants at the measurement date.
This section explains the judgements and estimates made in determining the fair values of the financial instruments that are (a) recognised and measured at fair value and (b) measured at amortised cost and for which fair values are disclosed in the consolidated financial statements. To provide an indication about the reliability of the inputs used in determining fair value, the group has classified its financial instruments into the three levels prescribed under the Indian Accounting Standards. An explanation of each level follows underneath the table.
a) Level 1: Level 1 hierarchy includes financial instruments measured using quoted prices.
b) Level 2: The fair value of financial instruments that are not traded in an active market is determined using valuation techniques which maximise the use of observable market data and rely as little as possible on entity-specific estimates. If all significant inputs required to fair value an instrument are observable, the instrument is included in level 2. Instruments in the level 2 category for the group include interest rate swaps and foreign exchange forward contract.
c) Level 3: If one or more of the significant inputs is not based on observable market data, the instrument is included in this level.

Notes forming part of the consolidated financial statements
194
iii) Financialassetsandliabilitiesmeasuredatfairvaluethroughprofitorlossateachreportingdate
(` in lakhs)2018 2017
Level 1 Level 2 Level 3 Level 1 Level 2 Level 3Financial assets measured at FVTPLNon-current investments - - - - - - Derivative instruments - 41 - - 2 - Total - 41 - - 2 - Financial liabilities measured at FVTPLDerivative instruments - 5 - - 448 - Total - 5 - - 448 -
iv) Non-currentfinancialassetsandliabilitiesmeasuredatamortisedcostateachreportingdate
(` in lakhs)2018 2017
Fair value
Carrying amount
Fair value
Carrying amount
Non-currentfinancialassetsLoans 1,389 1,358 2,500 2,453 Other financial assets 17 20 24 29 Non-currentfinancialliabilitiesBorrowings 44,922 44,922 60,496 60,496
Notes:
a) The group’s borrowings have been contracted at floating rates of interest, which resets at short intervals. Accordingly, the carrying value of such borrowings (including interest accrued but not due) approximates fair value.
b) The fair values for “Non-current financial assets“ comprising of lease rental deposits and bank deposits (due for maturity after twelve months from the reporting date) are based on discounted cash flows using a current lending rate. They are classified as level 3 fair values in the fair value hierarchy due to the use of unobservable inputs including counterparty credit risk.
c) The carrying amounts of trade receivables, cash and cash equivalents, bank balances other than cash and cash equivalents, current loans, other current financial assets, current borrowings, trade payables and other financial liabilities approximates the fair values due to the short-term maturities of these financial assets / liabilities.
d) There have been no transfers between level 1, level 2 and level 3 for the years ended 31 March 2018 and 31 March 2017.
v) Valuationtechniquesusedtodeterminefairvalue
The fair value of foreign exchange forward contracts is determined using forward exchange rates at the balance sheet date. The fair values of the remaining financial instruments is determined using discounted cash flow method.

Notes forming part of the consolidated financial statements
195Annual Report 2017-18
60 Reconciliation between opening and closing balances in the consolidated balance sheet for liabilities arising fromfinancingactivitiesasrequiredbyIndAS7“StatementofCashFlows”isasunder:
(` in lakhs)Non cash changes
As at 1 April 2017
Cash inflows
Cash outflows
Interest accrued
Other Changes
As at 31 March 2018
Equity share capital 3,143 2 - - - 3,145 Securities premium 10,987 96 - - 35 11,118 Non-convertible debentures (including current maturities)
8,969 5,000 (5,000) 154 (11) 9,112
Long-term borrowings (including current maturities)
56,728 - (12,113) - 287 44,902
Finance lease(including current maturities)
5,450 - (565) - - 4,885
Short-term borrowings 8,688 23,894 (18,202) 125 - 14,505
61 (a)Segmentinformation
The Company for evaluating group performance and for allocating resources based on analysis of various performance indicators, has identified four operative segments by geography.
Geographical segmentation:
(a) Africa, Middle East and South Asia (AMESA region) include operations in India and Egypt.
(b) East Asia Pacific (EAP region) includes operations in China and Philippines
(c) Americas region includes operations in United States of America, Mexico and Colombia.
(d) Europe region includes operations in Germany, United Kingdom, Poland and Russia.

Notes forming part of the consolidated financial statements
196
Segment reporting as at and for the year ended 31 March 2018
Primary segment disclosure - Geographical segment
(` in lakhs) AMESA EAP Americas Europe Unallocated Eliminations Total
Revenue External sales and services 91,616 53,221 48,846 50,959 - - 244,642 Inter-segment sales and services
1,868 4,216 - - 77 (6,161)
Total revenue 93,484 57,437 48,846 50,959 77 (6,161) 244,642 Segment Results 14,123 9,050 6,112 1,200 (401) 484 30,568 Add / (Less) :Other income (including interest income of `1319 lakhs)
2,637
Exchange difference gain / (loss) (net) (800)Finance costs (5,491)Share of profit from associate and joint ventures
(104)
Profitbeforetaxandexceptionalitems 26,810 Less : Exceptional items (net) (Refer note 44) (498)Profitbeforetax 26,312 Less: Tax expense Current tax 9,124 Deferred tax charge / (credit) (233)Profitaftertaxbeforenon-controllinginterest 17,421 Less: Non-controlling interest 261 Profitfortheyearattributabletoownersoftheparent 17,160
Other segment information:
AMESA EAP Americas Europe Unallocated Eliminations Total 1. Segment assets * 70,515 55,039 40,591 57,713 24,263 (2,661) 245,460 2. Segment liabilities 13,739 10,782 6,470 11,463 79,487 (1,970) 119,971 3. Non current assets ** 40,488 25,695 22,092 36,367 4,726 (538) 128,830 4. Capital expenditure 6,940 2,246 2,075 2,835 - (42) 14,054 5. Depreciation and
amortisation expense 7,036 3,432 2,270 3,905 150 (86) 16,707
Note :
* Segment assets - unallocated includes investments in associate of ` 1,310 lakhs.
** Non-current assets are excluding financial assets, deferred tax assets and investment in associate and joint ventures.

Notes forming part of the consolidated financial statements
197Annual Report 2017-18
Segment reporting as at and for the year ended 31 March 2017
Primary segment disclosure - Geographical segment
(` in lakhs) AMESA EAP Americas Europe Unallocated Eliminations Total
Revenue External sales and services 96,096 50,917 48,277 43,504 - - 238,794 Inter-segment sales and services
1,984 4,368 - 21 83 (6,456)
Total revenue 98,080 55,285 48,277 43,525 83 (6,456) 238,794 Segment Results 12,840 7,808 5,265 2,447 (415) 390 28,335 Add / (Less) :Other income (including interest income of ` 1,497 lakhs) 3,530 Exchange difference gain / (loss) (net) (Refer note 44) (294)Finance costs (5,812)Share of profit from associate and joint ventures 105 Profitbeforetaxandexceptionalitems 25,864 Add : Exceptional items (net) 1,565 Profitbeforetax 27,429 Less: Tax expense Current tax 7,084 Deferred tax charge / (credit) 785 Profitaftertaxbeforenon-controllinginterest 19,560 Less: Non-controlling interest 528 Profitfortheyear 19,032
Other segment information:
AMESA EAP Americas Europe Unallocated Eliminations Total 1. Segment assets * 67,003 46,732 37,944 52,049 26,057 (3,915) 225,870 2. Segment liabilities 13,171 7,550 7,406 10,144 85,754 (2,626) 121,399 3. Non current assets ** 40,120 24,833 22,222 32,740 5,269 (624) 124,560 4. Capital expenditure 11,131 1,992 8,364 1,648 1,362 (1,445) 23,052 5. Depreciation and
amortisation expense 6,379 3,295 1,786 2,727 39 (78) 14,148
Note :
* Segment assets - unallocated includes investments in associate of ` 1,526 lakhs.
** Non-current assets are excluding financial assets, deferred tax assets and investment in associate and joint ventures.

Notes forming part of the consolidated financial statements
198
61 (b) Informationaboutmajorcustomers
There is one customer accounting for more than 10% of revenue, amounting to ` 27,906 lakhs (31 March 2017 ` 27,969 lakhs).
62 Prior period comparatives
Previous year’s figures have been regrouped / reclassified wherever necessary to correspond with current year’s classifications / disclosures.
As per our attached report of even date For and on behalf of the Board
For Ford Rhodes Parks & Co. LLP Chartered AccountantsFirm Registration Number 102860W/W100089
Ashok GoelChairman & Managing Director
A.V. GanapathyChief Financial Officer
Boman Moradian
DirectorsRamaswamy SubramanianPartnerMembership Number 016059
Mukund M. Chitale Suresh SavaliyaCompany Secretary & Head - LegalRadhika Pereira
Atul Goel
Place: MumbaiDate: 26 April 2018
{

199Annual Report 2017-18
(` in lakhs)2018 2017
A. Cashflowfromoperatingactivities Profitbeforetax 26,312 27,429 Adjustmentsfor: Depreciation and amortisation expense 16,707 14,148 Share-based payment (credit)/expense (net) (Refer note 53) (342) 28 Interest expense 4,004 4,154 Interest income (1,553) (1,314) Unwinding of discount on security deposits (89) (183) Gain on disposal of property, plant and equipment (net) (115) (1,387) Gain on sale of current investments (7) (3) Gain recognised on measuring equity interest in joint venture on acquisition
of 100% stake (Refer note 54) - (2,518)
Loss on liquidation of subsidiary (Refer note 44) 498 - Share of (profit) / loss from associate and joint ventures 104 (105) Bad and doubtful debts (net of provision) 187 141 Deferred rent amortisation 95 179 Amortisation of ancillary borrowing costs 286 360 Remeasurement gains/(losses) on defined benefit plan (75) (222) Exchange adjustments (net) 1,579 (1,137) Operatingprofitbeforeworkingcapitalchanges 47,591 39,570 Adjustmentsfor: (Increase) / decrease in trade and other receivables (6,003) 2,458 (Increase) / decrease in inventories (4,041) (1,091) Increase /(decrease) in trade and other payables 4,655 3,574 Cash generated from operations 42,202 44,511 Direct taxes paid (net of refunds) (7,833) (7,643) Netcashfromoperatingactivities(A) 34,369 36,868 B. Cashflowfrominvestingactivities Purchase of property, plant and equipment / intangible assets (including
under progress) (14,054) (23,052)
Sale of property, plant and equipment 309 2,366 (Increase) / decrease in other bank balances (3,694) (539) Repayment received of loan taken over pursuant to the scheme of
amalgamation (Refer note 41) - 975
Purchase of current investments (17,205) (4,551) Sale of current investments 17,212 4,554 (Acquisition) / liquidation of subsidiaries 480 (12,908) Interest received 1,270 2,887 Dividend received from associate and joint ventures 85 172 Netcashusedininvestingactivities(B) (15,597) (30,096)
Consolidatedstatementofcashflowsfor the year ended 31 March 2018

200
(` in lakhs)2018 2017
C. Cashflowfromfinancingactivities Proceeds from issue of equity shares [including securities premium of ` 96
lakhs (31 March 2017: ` 69 lakhs)] 98 70
Proceeds from issue of non-convertible debentures 5,000 - Redemption of non-convertible debentures (5,000) - Proceeds from long-term borrowings - 18,351 Repayment of long-term borrowings (12,113) (11,416) Proceeds from short-term borrowings 21,913 11,951 Repayment of short-term borrowings (18,202) (12,622) Increase / (decrease) in other borrowings (net) 1,981 (3,868) Principal payment under finance lease (565) (809) Interest paid (3,725) (3,923) Ancillary borrowing cost incurred (10) - Dividend paid (including tax) (4,524) (4,142) Dividend paid to non-controlling interests (254) (219) Expenses incurred pursuant to the scheme of amalgamation (Refer note 41) - (996) Netcashusedinfinancingactivities(C) (15,401) (7,623)
Netchangesincashandcashequivalents(A+B+C) 3,371 (851)Cash and cash equivalents at the beginning of the year 8,203 6,873 Cash and cash equivalents acquired pursuant to the scheme of amalgamation (Refer note 41)
- 30
Cash and cash equivalents taken over on acquisition of subsidiary (Refer note 54) - 2,151 Cash and cash equivalents at the end of the year 11,574 8,203 Notes :
1. As required by Ind AS 7 “Statement of Cash Flows”, a reconciliation between opening and closing balances in the balance sheet for liabilities arising from financing activities is given in note 60 of the consolidated financial statements.
2. Previous year figures are regrouped / reclassified wherever neccesary.
As per our attached report of even date For and on behalf of the Board
For Ford Rhodes Parks & Co. LLP Chartered AccountantsFirm Registration Number 102860W/W100089
Ashok GoelChairman & Managing Director
A.V. GanapathyChief Financial Officer
Boman Moradian
DirectorsRamaswamy SubramanianPartnerMembership Number 016059
Mukund M. Chitale Suresh SavaliyaCompany Secretary & Head - LegalRadhika Pereira
Atul Goel
Place: MumbaiDate: 26 April 2018
{
Consolidatedstatementofcashflowsfor the year ended 31 March 2018

“The earth, the air, the land and the water are not an inheritance from our forefathers but on loan from our children. So we have to handover to them at least as it was handed over to us.“

www.esselpropack.comThis Annual Report is also available in electronic format at http://www.esselpropack.com.
Please contribute to our sustainability initiative.
Send an email to [email protected] to receive all future communications in electronic form.