v2x functional and performance test report; test ... ex...letter from sean t. conway, counsel for...
TRANSCRIPT

1 8 0 0 M S T R E E T , N W
S U I T E 8 0 0 N
W A S H I N G T O N , D C 2 0 0 3 6
T E L 2 0 2 . 7 8 3 . 4 1 4 1
F A X 2 0 2 . 7 8 3 . 5 8 5 1
W W W . W B K L A W . C O M
July 8, 2019
Marlene H. Dortch Secretary Federal Communications Commission 445 12th St. SW Room TW-B204 Washington, DC 20554
Re: 5GAA Petition for Waiver to Allow Deployment of Cellular Vehicle-to-Everything (C-V2X) Technology in the 5.9 GHz Band; GN Docket No. 18-357
Revision of Part 15 of the Commission’s Rules; ET Docket No. 13-49
Dear Ms. Dortch:
The 5G Automotive Association (“5GAA”) hereby submits two reports further supporting a grant of the association’s pending waiver request.1
The first report, entitled V2X Functional and Performance Test Report; Test Procedures and Results (“5GAA Benchmark Report”),2 is an amended version of the initial report attached to the 5GAA Waiver Petition.3 The initial report described the results of benchmark testing comparing the radio performance of Cellular Vehicle-to-Everything (“C-V2X”) devices to Dedicated Short Range Communications (“DSRC”) devices. However, as previously referenced in the record, 5GAA discovered in February of this year a discrepancy in the configuration of DSRC devices used in this initial testing.4 5GAA thus expanded its testing to collect updated C-V2X and DSRC data while using a corrected configuration for the DSRC devices.
The results summarized in the attached Benchmark Report confirm the performance advantages of C-V2X technology over DSRC in terms of reliability and range in various real-world testing conditions. Moreover, these performance advantages were substantial in most
1 See 5GAA Petition for Waiver, GN Docket No. 18-357 (filed Nov. 21, 2018) (“5GAA Waiver Petition”). 2 See 5GAA, V2X Functional and Performance Test Report; Test Procedures and Results. (Attached) 3 5GAA Waiver Petition at App. C. 4 See Letter from Sean T. Conway, Counsel for the 5G Automotive Association, to Marlene H. Dortch, Secretary, Federal Communications Commission (Feb. 22, 2019).

July 8, 2019 Page 2 instances. For example, in non-line of sight scenarios, C-V2X reliably delivered important safety messages over a range more than twice that achieved by DSRC.5
The second report, entitled Addendum to V2X Functional and Performance Test Report; Test Procedures and Results for 20-MHz Deployment in CH183 (“Addendum to the 5GAA Benchmark Report”), complements the 5GAA Benchmark Report in two important respects. First, the test results summarized in the Addendum to the 5GAA Benchmark Report demonstrate C-V2X’s ability to deliver important safety messages over a 20 MHz channel. 5GAA previously explained the benefits of utilizing a 20 MHz channel for the proposed Basic C-V2X channel, which will support the delivery of safety messages such as the Basic Safety Message, Signal Phase and Timing, and others by C-V2X.6 The test results summarized in the Addendum to the 5GAA Benchmark Report demonstrate that C-V2X messages transmitted over a 20 MHz channel are delivered with the same reliability as those sent over a 10 MHz channel.7
Second, the testing results summarized in the Addendum to the 5GAA Benchmark Report further demonstrate the feasibility of adjacent channel operations by DSRC and C-V2X devices. Notably, this testing demonstrates that C-V2X transmissions in Channel 183 present no interference impact to operations in DSRC public safety Channel 172.8 Moreover, the minimal impact imposed by C-V2X in Channel 183 on DSRC operations in other channels, including the immediately adjacent Channel 180, is no greater than in those situations in which DSRC is
5 See 5GAA Benchmark Report at 110. 6 See Letter from Sean T. Conway, Counsel for the 5G Automotive Association, to Marlene H. Dortch, Secretary, Federal Communications Commission, GN Docket No. 18-357, ET Docket No. 13-49 at n. 41 (Apr. 3, 2019) (“5GAA Band Plan Proposal”) (“A 20 MHz Basic Safety channel will enhance C-V2X’s ability to implement congestion control, should help improve its resiliency to out -of-band interference, and will enable capacity to adjust dynamically between V2V and V2I applications in any given location, depending on usage. A 20 MHz channel allows for soft multiplexing of the various peer-to-peer mode communications supported by C-V2X. The communications system therefore will dynamically adjust to the capacity demands, ensuring a high reliability for message delivery. 5GAA members have validated C-V2X operation in a 20 MHz channel in laboratory tests and are performing additional field tests using a 20 MHz channel. Congestion control test results are expected to improve when utilizing a 20 MHz channel because a wider channel naturally accommodates more simultaneous users. In addition, resiliency test results using 20 MHz may similarly improve due to C-V2X’s channel sensing, which will choose less polluted parts of the channel for message transmission.”) 7 See 5GAA, Addendum to V2X Functional and Performance Test Report; Test Procedures and Results for 20-MHz Deployment in CH183 at 8. (Attached) 8 Id. at 65.

July 8, 2019 Page 3 operating in Channel 182-184.9 Thus, a waiver grant will not impose any additional hardship on DSRC operations in Channels 180 and below.
While 5GAA recently proposed a forward-looking approach in the 5.9 GHz band,10 a near-term grant of the 5GAA Waiver Petition remains critical for expediting the deployment of this technology. The attached two reports provide further support for such a waiver grant.
Sincerely,
/s/ Sean T. Conway Sean T. Conway
Counsel to the 5G Automotive Association Attachments cc: Aaron Goldberger
Julius Knapp Aspa Paroutsas
Ira Keltz Paul Murray Jamison Prime
Howard Griboff Patrick Forster Syed Hasan
William Richardson Deborah Broderson
9 Id. at 39-65. 10 See 5GAA Band Plan Proposal.

5GAA Benchmark Report

1 5GAA P-180106
V2X Functional and Performance Test Report;
Test Procedures and Results

2 5GAA P-190033
5GAA
Contents Contents .........................................................................................................................................................2
Foreword ........................................................................................................................................................5
Introduction.....................................................................................................................................................5
1 Scope .......................................................................................................................................................5
2 References ..............................................................................................................................................6
2.1 Standards ......................................................................................................................................6
3 Definitions and Abbreviations ..................................................................................................................7
3.1 Definitions ......................................................................................................................................7
3.2 Abbreviations .................................................................................................................................7
4 Executive Summary .................................................................................................................................9
4.1 Introduction ....................................................................................................................................9
4.2 Key Takeaways .............................................................................................................................9
4.2.1 Reliability ..............................................................................................................................9
4.2.2 End-to-End Latency .......................................................................................................... 10
4.2.3 Channel Congestion ......................................................................................................... 10
4.2.4 Resilience to Interference ................................................................................................. 10
4.2.5 Shadowing Scenarios ....................................................................................................... 10
4.2.6 Near-Far Effect ................................................................................................................. 10
4.3 Summary .................................................................................................................................... 11
5 Test Overview ....................................................................................................................................... 11
5.1 KPIs Overview ............................................................................................................................ 11
5.1.1 Packet Error Rate (PER) .................................................................................................. 11
5.1.2 Packet Reception Rate (PRR) .......................................................................................... 12
5.1.3 Received Signal Strength Indicator (RSSI)....................................................................... 12
5.1.4 Inter-Packet Gap (IPG) (Sourced from 5GAA TR P-170142) ........................................... 12
5.1.5 Latency (Sourced from 5GAA TR P-170142) ................................................................... 13
5.2 Data Post-Processing ................................................................................................................. 13
5.2.1 KPI Calculations................................................................................................................ 13
5.2.2 Distance Calculations ....................................................................................................... 14
5.2.3 Plotting vs Time ................................................................................................................ 15
5.2.4 Plotting vs Distance .......................................................................................................... 15
5.3 Test Classification ....................................................................................................................... 15
6 Test Equipment Description and Characterization ............................................................................... 16
6.1 OBUs (Savari MW1000 and Qualcomm Roadrunner Platforms) ................................................ 16
6.2 In-Vehicle Setup ......................................................................................................................... 17
6.3 Lab Equipment ............................................................................................................................ 19
6.4 Antenna Characterization ........................................................................................................... 20
6.4.1 Test Setup ......................................................................................................................... 20
6.4.2 Measurement Results ....................................................................................................... 21
6.4.3 Conclusion ........................................................................................................................ 24

3 5GAA P-190033
5GAA
7 Lab Test Procedures and Results ........................................................................................................ 25
7.1 Introduction ................................................................................................................................. 25
7.1.1 Test Cases – Device Characterization ............................................................................. 25
7.1.2 Common Parameters and Setup ...................................................................................... 25
7.1.3 General Guidance on C-V2X and DSRC Device RF Power Management ....................... 26
7.2 AWGN Lab Tests ........................................................................................................................ 27
7.2.1 Basic Bench Cabled RF Tests .......................................................................................... 27
7.2.2 Cabled Transmission and Reception Test with Varying Payload Sizes .................................. 27
7.2.3 Clean Channel Cabled Transmission and Reception Test Across Power Levels ............ 31
7.2.4 Cabled Transmission and Reception Test with Added Channel Impairment ................... 38
7.3 Interference Lab Tests ................................................................................................................ 48
7.3.1 Hidden Node Scenario ...................................................................................................... 48
7.3.2 Near-Far Effect ................................................................................................................. 58
7.4 Congestion Tests ........................................................................................................................ 62
7.4.1 Congestion Control Lab Test ............................................................................................ 62
8 Field Test Procedures and Results ...................................................................................................... 76
8.1 Introduction ................................................................................................................................. 76
8.2 Hardware Setup .......................................................................................................................... 77
8.3 Field Test Parameters ................................................................................................................ 79
8.4 Presentation of Results............................................................................................................... 80
8.5 Range Tests ............................................................................................................................... 80
8.5.1 Line-of-Sight (LOS) Tests ................................................................................................. 81
8.5.2 Non-Line-of-Sight (NLOS) Range Tests ........................................................................... 87
8.6 Interference Tests ....................................................................................................................... 95
8.6.1 U-NII-3 802.11ac Interference Test and Results .............................................................. 96
8.6.2 Adjacent Channel Interference Test and Results ........................................................... 102
8.7 Key Takeaways......................................................................................................................... 108
9 Conclusion and Next Steps ................................................................................................................ 110
Annex A: Supplemental Lab Interference Tests .................................................................................. 111
A.1 Interference Lab Test ................................................................................................................ 111
A.1.1 Cabled Transmission and Reception Test with Simulated External Interference: Flat Characteristics, Constant in Time, Occupying Part of ITS Channel (e.g., Channel 172) 111
A.1.2 Cabled Transmission and Reception Test with Simulated External Interference: Flat Characteristics, Constant in Time, Starting from Guard Band Occupying Part of Given ITS Channel (e.g., Channel 172) ........................................................................................... 122
Annex B: Supplemental Non-Line-of-Sight Field Tests ............................................................................ 129
B.1 CAMP Shadowing Test ................................................................................................... 129
Annex C: Latency and IPG Summary Tables ........................................................................................... 132
Annex D: Summary of Tests Conducted ................................................................................................... 134
Annex E: 5GAA V2X Test Procedures ...................................................................................................... 135
Annex F: Change History .......................................................................................................................... 135
4 5GAA P-190033
5GAA
Copyright Notification
No part may be reproduced except as authorized by written permission. The copyright and the foregoing restriction extend to reproduction in all media.
5 5GAA P-190033
5GAA
Foreword This Technical Report has been produced by 5GAA.
The contents of the present document are subject to continuing work within the Working Groups (WG) and may change following formal WG approval. Should the WG modify the contents of the present document, it will be re-released by the WG with an identifying change of the consistent numbering that all WG meeting documents and files should follow (according to 5GAA Rules of Procedure):
x-nnzzzz
(1) This numbering system has six logical elements:
(a) x: a single letter corresponding to the working group:
where x =
T (Use cases and Technical Requirements)
A (System Architecture and Solution Development) P (Evaluation, Testbed and Pilots)
S (Standards and Spectrum)
B (Business Models and Go-To-Market Strategies)
(b) nn: two digits to indicate the year. i.e. 16,17,18, etc.
(c) zzzz: unique number of the document
(2) No provision is made for the use of revision numbers. Documents which are a revision of a previous version should indicate the document number of that previous version.
(3) The file name of documents shall be the document number. For example, document S-160357 will be contained in file S-160357.doc
Introduction Ford and other automotive OEMs are interested in introducing V2V 5.9-GHz radio technology for safety and non-safety applications. Defining radio testing procedures is a prerequisite to comparing the candidate DSRC and C-V2X (PC5) radio technologies and performing validation. The initial V2V radio performance tests were conducted over a period spanning six months from March through September 2018, and those test results were documented in the 5GAA test report P-180106-V2X-Functional-and-Performance-Test-Report. In February 2019, it was discovered that a misconfiguration in the DSRC device resulted in receive diversity not being turned on. Since this is contrary to the expectation of the original test plan, all impacted tests were rerun with proper configuration enabled to turn on receive diversity.
1 Scope The current document describes tests and results comparing the two V2X radio technologies operating in the ITS band (5.850 GHz to 5.925 GHz) from the perspective of basic radio KPIs such as Packet Error Rate (PER) or Packet Reception Rate (PRR), latency or application end-to-end delay, Inter-Packet Gap (IPG), and Receive Signal Strength Indicator (RSSI). These tests are described in 5GAA test procedure documentation, but this document describes the test procedures specifically as they were executed in the lab and field environments.
6 5GAA P-190033
5GAA
2 References The following documents contain provisions which, through reference in this text, constitute provisions of the present document.
- (5GAA, March 2018) 5GAA TR P-180092, “5G Automotive Association; Working Group Evaluation, test beds and pilots; V2X Functional and Performance Test Procedures – Selected Assessment of Device to Device Communication Aspects”, March 2018.
- (Parsons, 1994), The Mobile Radio Propagation Channel, Halsted Press: a division of John WILEY and SONS, New York-Toronto, 1994.
- (USDOT NHTSA, CAMP, September 2011) Vehicle Safety Communications – Applications (VSC- A): Final Report: Appendix Volume 2 - Communications and Positioning, September 2011, DOT HS 811 492C.
- (USDOT ITS JPO DNPW) Do Not Pass Warning Illustration (https://www.its.dot.gov/infographs/DoNotPass.htm)
- (USDOT ITS JPO IMA) Intersection Movement Assist Illustration (https://www.its.dot.gov/infographs/intersection_movement.htm)
- (SAE J2945) On-board Minimum Performance Requirements for V2V Safety Communications, Version 1, March 2016.
- (Alsmirat, 2015) Mohammad A. Alsmirat, Saleh Yousef Al-Rifai, and Belal H. Sababha, Dynamic Distribution of Safety Messages over EDCA Access Categories, July 2015; https://pdfs.semanticscholar.org/2095/8ebeb2a1bdb25a4ac5e832679144dec4fdbd.pdf
2.1 Standards - 3GPP TS 36.213 Rel 14, Evolved Universal Terrestrial Radio Access (E-UTRA); Physical layer
procedures.
- 3GPP TS 36.331 Rel 14, Evolved Universal Terrestrial Radio Access (E-UTRA); radio Resource Control (RRC); protocol specification.
- 3GPP TS 36.301 Rel 14, Evolved Universal Terrestrial Radio Access (E-UTRA); User Equipment (UE) radio transmission and reception.
7 5GAA P-190033
5GAA
3 Definitions and Abbreviations
3.1 Definitions For the purposes of the present document, the following definitions apply: Approaching: Direction of movement of Moving Vehicle (MV) towards the Stationary Vehicle
(SV).
MV: Moving Vehicle communicates with the Stationary Vehicle and performs loops on a typically straight stretch of road where the Stationary Vehicle is located.
Receding: Direction of movement of Moving Vehicle away from the Stationary Vehicle.
Sensitivity level of a signal: The lowest receive signal level that allows almost error-free reception. Below this level, the packet reception starts to deteriorate.
SV: Stationary vehicle is positioned on one end of the test track and communicates with the Moving Vehicle.
3.2 Abbreviations For the purposes of the present document, the following symbols apply:
3GPP 3G Partnership Project (cellular standard organization)
AWGN Additive White Gaussian Noise
BLER Block Error Rate
BSM Basic Safety Message
CAMP Crash Avoidance Metric Partnership
CBP Channel Busy Period
CBR Channel Busy Ratio
CDF Cumulative Distribution Function
C-V2X Cellular Vehicle-to-Everything
DNPW Do Not Pass Warning
DSRC Dedicated Short-Range Communications (IEEE 802.11p)
DUT Device Under Test
FPG Fowlerville Proving Ground
HARQ Hybrid Automatic Repeat Request HV Home Vehicle
IEEE Institute of Electrical and Electronics Engineers
IPG Inter-Packet Gap(s)
ITS Intelligent Transportation Systems
ITS Band Frequency band for ITS communications (5.850-5.925 GHz in the US)
ITT Inter Transmission Time
KPI Key Performance Indicator
LOS Line of Sight
LTE Long Term Evolution (cellular standard organization)
MCS Modulation Coding Scheme

8 5GAA P-190033
5GAA
MIMO Multiple Input Multiple Output
MV Moving Vehicle
NLOS No Line of Sight
OBE On-Board Equipment
OBU On-Board Unit
OS Operating System
PCS Radio interface between two UEs, also known as Sidelink
PER Packet Error Rate (%)
PRB Physical Resource Block
PRR Packet Reception Ratio
PSCCH Physical Sidelink Control Channel (part of PC5)
REF Reference Device
RBs Resource Blocks
RSS/RSSI Receive Signal Strength Indicator
Rx Receiver
SA Spectrum Analyzer
SAE Society of Automotive Engineers
SG Signal Generator
SNR Signal-to-Noise Ratio
S-RSSI Sidelink RSSI
SPS Semi-Persistent Scheduling
SV Stationary Vehicle
TTI Transmission Time Interval in 3GPP
Tx Transmitter
UE User Equipment (device in 3GPP system)
U-NII Unlicensed-National Information Infrastructure
V2I Vehicle-to-Infrastructure
V2N Vehicle-to-Network
V2V Vehicle-to-Vehicle
V2X Vehicle-to-Everything

9 5GAA P-190033
5GAA
4 Executive Summary
4.1 Introduction This report describes the results of tests designed to objectively assess and compare DSRC and Cellular V2X (C-V2X) radio technologies for their suitability to deliver broadcast V2V safety messages. Many of the test results described in this report are traceable to the comprehensive test plan developed within 5GAA (5GAA, March 2018). Furthermore, several other tests were derived from that test plan to examine the effects of congestion control and interfering devices. In all instances, the test methodologies are either from the 5GAA test plan or are documented in this report. Therefore, between this document and the 5GAA test plan, the methodology is available to allow other parties to examine the procedures, understand their suitability, and to be able to reproduce and corroborate the results.
Reliable and timely radio performance is a crucial requirement that the transportation safety stakeholder community, including vehicle manufacturers, road infrastructure owner-operators, standardization bodies and regulators depend on to deliver critical safety applications. The test results reported here are intended to provide this community with an informed basis for making important decisions on the choice of the air interface to deliver standardized messages (e.g., Basic Safety Message or BSM). Therefore, great care was taken in the design, setup and execution of each experiment to ensure that environmental conditions (weather, time of day, temperature), RF parameters (antennas, power, cables), system integration details, and physical setup (track, obstructions, antenna placement) were consistent when comparing DSRC and C-V2X.
During field testing on two automotive test tracks for the original report published in September 2018, significant interference was discovered in the ITS band (CH172) coming from devices transmitting in the U-NII-3 band (5.725-5.850 MHz). Hence, CH184 was used for field test results published in the original report. To maintain similarity with the original report, retesting was done using the upper portion of the ITS band (CH184).
4.2 Key Takeaways We make the following observations based on the laboratory and field test results contained in this report.
4.2.1 Reliability Test results confirm that in ideal conditions, i.e., line of sight RF propagation with no interference and strong received signal level, both V2X technologies reliably deliver BSM payload sizes of 193 bytes with the low end-to-end latencies necessary for vehicular safety applications. These results also reveal a significant reliability performance advantage of C-V2X over DSRC. The performance advantage is also observed in non-ideal communication conditions. Non-ideal scenarios that were systematically tested included non-line-of- sight (NLOS) conditions involving fixed and moving obstructions, adjacent and near adjacent channel interference and congestion. These non-ideal scenarios represent real-world vehicular traffic scenarios that must be included in the analysis to facilitate informed decision making. In short, test results indicate that in the presence of signal attenuation from real-world obstructions such as buildings, other vehicles or foliage, C-V2X is more reliable than DSRC in terms of vehicle-to-vehicle communication.
Specifically, in Section 7.2.3 and 7.2.4 the controlled lab test shows a significant reliability advantage for C-V2X over DSRC in the presence of signal attenuation and background noise and interferences. In Sections 8.5 and 8.6, carefully executed field tests show that such advantage translates to very meaningful range advantage in the field. These demonstrated advantages mean enhanced safety for drivers and pedestrians by providing reliable and early alerts even when there are coverage dead spots created by obstructions such as buildings, vehicles, and foliage.
10 5GAA P-190033
5GAA
4.2.2 End-to-End Latency Both C-V2X and DSRC exhibited similar end-to-end application layer latencies under non-congested conditions, and both technologies met the latency requirements for the V2V safety applications defined in SAE J2945/1. Inter-packet gap performance was within 10 ms for both V2X technologies, typically increasing very quickly when the devices went out of range.
Only C-V2X technology was tested for a highly congested scenario in a laboratory setting. Even in the congested scenario, C-V2X latency remained bounded by the 100 ms latency budget configured for that scenario.
4.2.3 Channel Congestion Robust operation of V2X in dense deployments is a key requirement of the technology. A laboratory test was conducted based on the high-density CAMP scenario [NHTSA-2015-0060] where 576 congesting devices were emulated with a total traffic load of about twice of what could fit into the channel.
The test data in Section 7.4 show that the SAE J2945/1-based congestion control algorithm works well for C- V2X technology. Congesting devices reduce their rate of transmission according to the SAE algorithm, while the devices under test continue to maintain the high packet reception rate.
The data showed that the PER performance of high-priority BSM is noticeably better than lower-priority messages when high attenuations are used, or reception signals are weak.
The reason is that high-priority safety messages can be protected more efficiently for channel-congested and collision scenarios by the C-V2X resource selection algorithm. For actual highly congested deployment scenarios, we expect this packet reception improvement of high-priority BSM to translate to noticeable and meaningful reliability improvement of critical safety messages.
4.2.4 Resilience to Interference Interference is another major impairment for V2X communications. It arises as other devices in the environment emit RF energy into the V2X channel. These devices can be WiFi devices operating in the UNII-3 band. They can also be V2X devices in the neighboring channels. The net effect is elevated channel noise level at the V2X receiver. With the interference in close proximity, the improvement in range for C-V2X over DSRC with U-NII-3 interferer was 1.7x while the improvement for C-V2X over DSRC with the adjacent DSRC interferer was 2.9x.
4.2.5 Shadowing Scenarios A comparison test between DSRC and C-V2X for the shadowing scenarios was repeated for both C-V2X and DSRC. Although the same test was conducted and reported by CAMP in 2011 for DSRC, the test was reproduced for both radios to ensure that results are compared under similar parameters, environmental conditions, and physical setup. It was shown that the shadowing test specified by 5GAA is more demanding than that conducted by CAMP. More importantly, test results under similar conditions showed a significant advantage of C-V2X over DSRC.
4.2.6 Near-Far Effect One of the key features of C-V2X is frequency division multiplexing (FDM). However, because of the potential for transmissions on adjacent subchannels, FDM can lead to the near-far effect. The impact of the near-far effect though is limited by the minimum in-band emissions requirements defined in 3GPP specifications. The data from the near-far test showed that the average leakage of the device under test ~ -35 dB meets the minimum requirements specified in 3GPP Rel 14 TS 36.101 Section 6.5.2G.3.
11 5GAA P-190033
5GAA
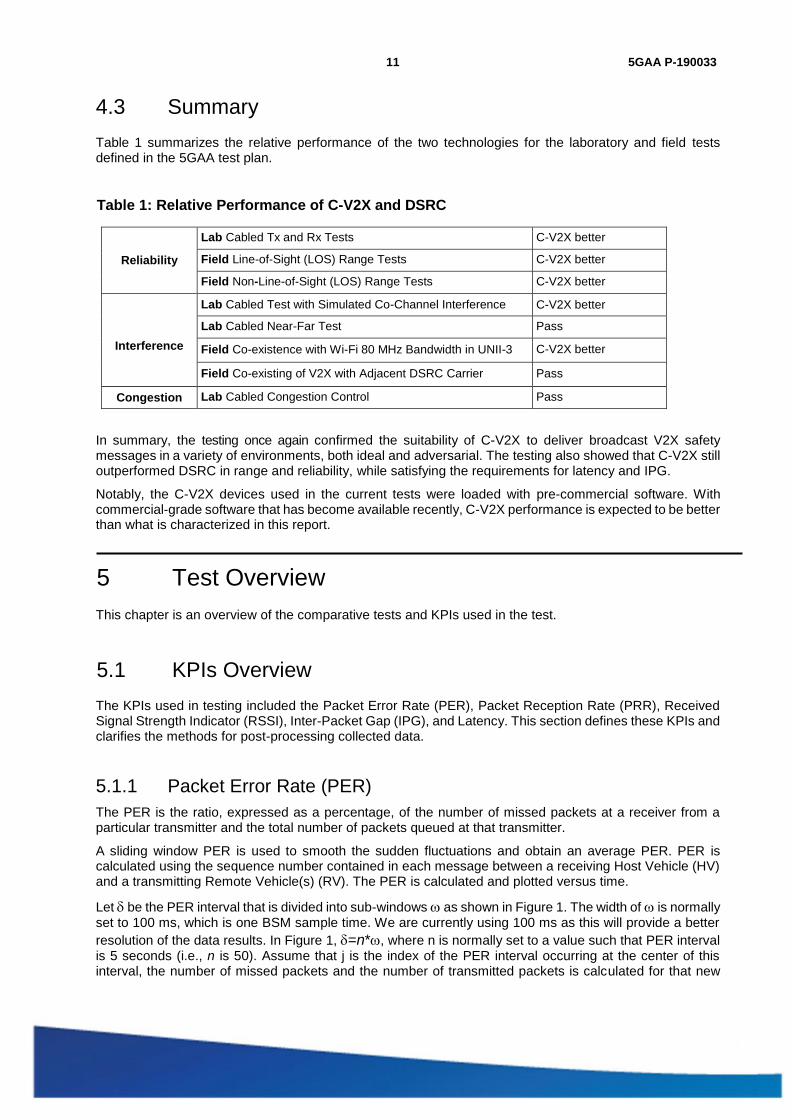
4.3 Summary Table 1 summarizes the relative performance of the two technologies for the laboratory and field tests defined in the 5GAA test plan.
Table 1: Relative Performance of C-V2X and DSRC
Reliability
Lab Cabled Tx and Rx Tests C-V2X better
Field Line-of-Sight (LOS) Range Tests C-V2X better
Field Non-Line-of-Sight (LOS) Range Tests C-V2X better
Interference
Lab Cabled Test with Simulated Co-Channel Interference C-V2X better
Lab Cabled Near-Far Test Pass
Field Co-existence with Wi-Fi 80 MHz Bandwidth in UNII-3 C-V2X better
Field Co-existing of V2X with Adjacent DSRC Carrier Pass
Congestion Lab Cabled Congestion Control Pass
In summary, the testing once again confirmed the suitability of C-V2X to deliver broadcast V2X safety messages in a variety of environments, both ideal and adversarial. The testing also showed that C-V2X still outperformed DSRC in range and reliability, while satisfying the requirements for latency and IPG.
Notably, the C-V2X devices used in the current tests were loaded with pre-commercial software. With commercial-grade software that has become available recently, C-V2X performance is expected to be better than what is characterized in this report.
5 Test Overview This chapter is an overview of the comparative tests and KPIs used in the test.
5.1 KPIs Overview The KPIs used in testing included the Packet Error Rate (PER), Packet Reception Rate (PRR), Received Signal Strength Indicator (RSSI), Inter-Packet Gap (IPG), and Latency. This section defines these KPIs and clarifies the methods for post-processing collected data.
5.1.1 Packet Error Rate (PER) The PER is the ratio, expressed as a percentage, of the number of missed packets at a receiver from a particular transmitter and the total number of packets queued at that transmitter.
A sliding window PER is used to smooth the sudden fluctuations and obtain an average PER. PER is calculated using the sequence number contained in each message between a receiving Host Vehicle (HV) and a transmitting Remote Vehicle(s) (RV). The PER is calculated and plotted versus time.
Let be the PER interval that is divided into sub-windows as shown in Figure 1. The width of is normally set to 100 ms, which is one BSM sample time. We are currently using 100 ms as this will provide a better resolution of the data results. In Figure 1, =n*, where n is normally set to a value such that PER interval is 5 seconds (i.e., n is 50). Assume that j is the index of the PER interval occurring at the center of this interval, the number of missed packets and the number of transmitted packets is calculated for that new

12 5GAA P-190033
5GAA
PER interval j.
The PER is then calculated for that index j at the center of each j, using the surrounding n sub-windows as follows,
𝑚𝑖𝑠𝑠𝑒𝑑 # 𝑜𝑓 𝐵𝑆𝑀𝑠 𝑓𝑟𝑜𝑚 𝑣𝑒ℎ𝑖𝑐𝑙𝑒 𝑖 𝑑𝑢𝑟𝑖𝑛𝑔 [𝜔(𝑗 𝑛 +1 , 𝜔(𝑗 𝑛)]
− ) + 𝑃𝐸𝑅𝑖(𝑗) = 2 2
𝑡𝑜𝑡𝑎𝑙 # 𝑜𝑓 𝐵𝑆𝑀𝑠 𝑓𝑟𝑜𝑚 𝑣𝑒ℎ𝑖𝑐𝑙𝑒 𝑖 𝑑𝑢𝑟𝑖𝑛𝑔 [𝜔(𝑗 𝑛)+1 , 𝜔(𝑗 𝑛 ] −2 +2)
(1)
Where j ≥ n.
Figure 1: Sliding Window (SAE J2945)
Sliding window PER values are plotted against the duration of the test. In addition, all sliding window PER values are averaged and plotted on the same figure. The PER metric in this case includes:
- Packet loss due to packets that were dropped from the transmit queue because a newer BSM arrived in the queue before the previous BSM could be transmitted due to the medium being busy (the DSRC radio’s clear channel assessment could not detect that the medium was clear for transmitting before the next packet arrived)
- Packets lost over the air due to collisions or insufficient signal strength
5.1.2 Packet Reception Rate (PRR) The PRR is the ratio, expressed as a percentage, of the number of packets received from a particular transmitter and the total number of packets queued at the transmitter. The PRR is, therefore, the complement of the PER defined in Section 5.1.1 and is defined as PRR = 1 – PER.
5.1.3 Received Signal Strength Indicator (RSSI) For DSRC, RSSI is the Received Signal Strength Indicator. For Cellular, RSSI is the Reference Signal Received Power.
That the RSSI is a device self-reported quantity that is both noisy and biased. AGC outputs can differ from one type of radio to another due to (1) RF calibration per unit (2) amplifier noise floor. ADC will add quantization errors. At low received signal levels, thermal noise and other device noise floor start to color and even dominate the reported RSSI values. We have, therefore, observed RSSI reports to be a few dBs off expected signal levels. For these reasons, we view RSSI as a crude metric that is useful for making qualitative observations, but it is not accurate enough for quantitative conclusions.
5.1.4 Inter-Packet Gap (IPG) (Sourced from 5GAA TR P-170142) The IPG is the time, calculated at the receiver and expressed in milliseconds, between successive successful packet receptions from a particular transmitter. IPG is calculated at the receiver and expressed in milliseconds.

13 5GAA P-190033
5GAA
Like the PER, the IPG is calculated between a receiving Host Vehicle (HV) and a transmitting Remote Vehicle(s) (RV) and represents the IPG seen over the entire test run.
Let 𝑟1 denote the Coordinated Universal Time (UTC time) at which the ith message from an RV is received by the HV, and r-1 denote the UTC time at which the (i-1)th message from the RV was received by the HV. Then the IPGi between the (i-1)th message and the ith message is:
𝐼𝑃𝐺𝑖 = 𝑟𝑖 − 𝑟𝑖−1 (2)
5.1.5 Latency (Sourced from 5GAA TR P-170142) Latency represents the time interval, expressed in milliseconds, between the time instant when the transmitter application delivers the application layer packet (e.g., BSM) to the lower layers, and the time instant when the application layer packet is received by the application layer at the receiver.
Latency is an important KPI for safety applications. C-V2X is designed for low-latency direct communications. The latency requirements, however, vary from application to application. For example, for today’s ITS applications such as EEBL/FCW/LTA/IMA/DNPW, an end-to-end application layer latency of 100 to 150 ms may be sufficient. For other future applications such as close-following platooning, an end-to-end application layer latency of about 40 ms or less may be needed.
Research is ongoing for latencies needed for platooning, and the latency configuration for C-V2X can be tailored to assure that future latency requirements are met. For the safety applications to be effective, the application-specific latency requirements need to be predictably met in all real-world scenarios (including highly congested scenarios). As the system load increases, C-V2X continues to meet the latency required by a particular safety application in a predictable manner.
5.1.5.1 Differences between C-V2X and DSRC Regarding Latency C-V2X is a synchronous system that relies on a distributed scheduling mechanism for packet transmission. This mechanism enables very efficient allocation of resources to C-V2X devices. The “Packet Delay Budget,” or PDB, is the window of time over which packets from an SPS flow are assigned resources when they are scheduled for the first time. PDB determines the latency experienced by packets from a specific Semi- Persistent Scheduling (SPS) flow. All subsequent messages from the same flow are transmitted exactly at the message periodicity interval (e.g., 100 ms gap between messages). The PDB for an SPS flow can be set based on the application requirement for latency, thereby allowing the device to stay below the required latency limit yet use an efficient scheduling mechanism. For example, EEBL/FCW/LTA/IMA/DNPW applications can use a PDB of 100 ms, while platooning could use a PDB of 40 ms. Average and maximum latency remains the same even as the system loading increases. The standard guarantees that the latency requirement is always met by allowing the devices to reselect SPS resources to meet the PDB. This can happen, for example, when there is variability in arrival at the application layer and an SPS opportunity is missed.
DSRC relies on CSMA/CA for channel access. There is no scheduling involved, and transmission is based on energy sensing on the channel. When the system is lightly loaded, messages can be transmitted with low latency. However, as the system becomes heavily loaded, latency experienced by messages will grow rapidly. This has been observed/confirmed and documented by several third parties (Alsmirat, 2015). With high congestion, latency, as well as the interval between subsequent messages, increases significantly. Message reception reliability thus becomes unsuitable for safety applications.
5.2 Data Post-Processing The data collected during tests was post-processed using methods that will be outlined in this section.
5.2.1 KPI Calculations

14 5GAA P-190033
5GAA
Figure 2 shows the high-level process flow for data processing and KPI generation. The details of each step follow the diagram.
Figure 2: Data Processing Overview
The data files collected during tests were stored as comma separated value files. The content of the data files includes timestamp information, vehicle telemetry data, and the content of the transmitted and received BSM. These log files were read in and the data was labeled with the Vehicle from which it came, either “HV” or “RV”. The data from these files were concatenated, with HV followed by RV. In the case of multiple RVs, the data frame from each RV was separately merged with the HV data frame.
Next, the data was pre-processed. This involved filtering out blank RSSI values, and incorrect GNSS data. The data frames were then prepared using the following columns in the log files: Vehicle, LogRecType, TimeStamp, TimeStamp_ms, secMark, msgCnt, lat, long, and RSS. The KPI’s were calculated for two cases/perspectives:
1. RV is transmitting (Tx), HV is receiving (Rx).
2. HV is transmitting (Tx), RV is receiving (Rx).
For each of the two cases, the subset of Tx and Rx data was separated from the concatenated data, then matched together by the secMark and MsgCnt columns. Only the Tx-Rx matches per secMark and MsgCnt that have absolute minimum value of difference between the Tx and Rx timestamps were extracted. Any duplicate timestamps from the TimeStamp_ms field for the Tx data were removed. Due to the possibility of multiple matches per secMark and MsgCnt pairs, only matches with a timestamp difference or latency of less than 5000 ms were considered a match.
Data is then sorted by Rx TimeStamp_ms, which is used to determine the latency, IPG, and RSSI values. The calculation for each of the KPIs is done per the 5GAA definition as mentioned in the previous sections. Latency values were the previously calculated absolute time difference between the extracted Tx-Rx matches. The inter-packet gap, IPG, was determined by calculating the iterated differences over TimeStamp_ms for Rx. RSSI values are given from the source data via the Rx side respectively, ignoring any invalid values.
On generating packet-error and packet-reception rates (PER, PRR): the resulting data of Tx-Rx data was first sequenced by seconds - with all records outside of the lap timeframe removed - before beginning the PER and PRR calculations. The PRR was calculated as described in Section 5.1.1, and the PER was calculated by simply subtracting each calculated PRR value from 100.
The tables of calculated values for PER, PRR, latency, IPG and RSSI are then fully joined pairwise by their timestamp.
5.2.2 Distance Calculations To analyze the individual KPIs arranged by timestamp, the distance is calculated using the latitude and longitude recorded within the logfile and finding the closest matching timestamps for the Rx and Tx vehicles and the associated coordinates. For example, while targeting the RV Tx record with which an HV Rx is matched, we look for the opposite HV Tx data to find the Tx record that occurred prior to the target RV Tx record to locate the starting coordinates. With the starting and final coordinates of the messages, these two sets of coordinates are calculated to distance using the haversine distance function, assuming an earth

15 5GAA P-190033
5GAA
radius of 6,378,137 m.
For graphs using individual lines for approaching and receding runs, the local minima and maxima of distance are found within the data, before iterating through the data and marking individual entries as approaching or receding based on their position relative to the last extreme point.
5.2.3 Plotting vs Time The KPIs described in the previous sections are all time-based so it is easy to plot those KPIs directly with respect to their associated time. For example, plotting each RSSI sample point directly with respect to the associated timestamp guarantees a reference in time to whether any BSM packet was received on the other end. Since the PER is a time window calculation, each value is plotted against the center or middle Tx timestamp value of that window.
5.2.4 Plotting vs Distance The distance between the two vehicles is calculated as described in Section 5.1.2. As we always use the transmitter for reference, we now have an associated distance value for each sample BSM value regardless of whether this BSM was received. Once we have this data, the KPIs are plotted as scatter plots. Each RSSI value is plotted against the associated distance for that sample. In addition, each PER value associated with a time window is plotted against the distance of the vehicle at the center of that window. Since the vehicle is moving at constant speed, the timestamps and distance values are linear; therefore, picking the center of the PER window for time and distance has the same effect as picking the linear average value of either distance and time. This is equivalent to results for PER vs distance if raw values were binned by distance first before doing the analysis.
For most tests, the vehicles were run in multiple loops to provide redundant and more robust data to perform KPI vs distance calculations. Clean, one-line average PER or RSSI vs distance values are provided by a procedure that averages results of the many loops by sorting the data with respect to distance first, then running a centered moving average on the data.
5.3 Test Classification Planned tests are:
- Lab tests
- Field tests
Within the lab test category, we define these test areas:
- Clean (strong) signal reception tests
- Attenuation tests
- Strong signal reception tests in the presence of White-Gaussian noise
- Interference tests (resilience of the signal to jamming)
- Hidden-node tests
- Near-Far tests
Within the field test category, we define these test areas:
- Range tests
- Line-of-Sight (LOS) tests with two vehicles
- Non-Line-of-Sight (NLOS) tests with two vehicles and an obstruction
- Obstruction can be stationary or moving
- Non-Line-of-Sight (NLOS) intersection tests with two vehicles and two obstructions
16 5GAA P-190033
5GAA
- Interference tests
- Impact of UNII-3 802.11ac interferer
- Impact of DSRC interferer in the adjacent channel
6 Test Equipment Description and Characterization This chapter describes the test equipment and how it is characterized.
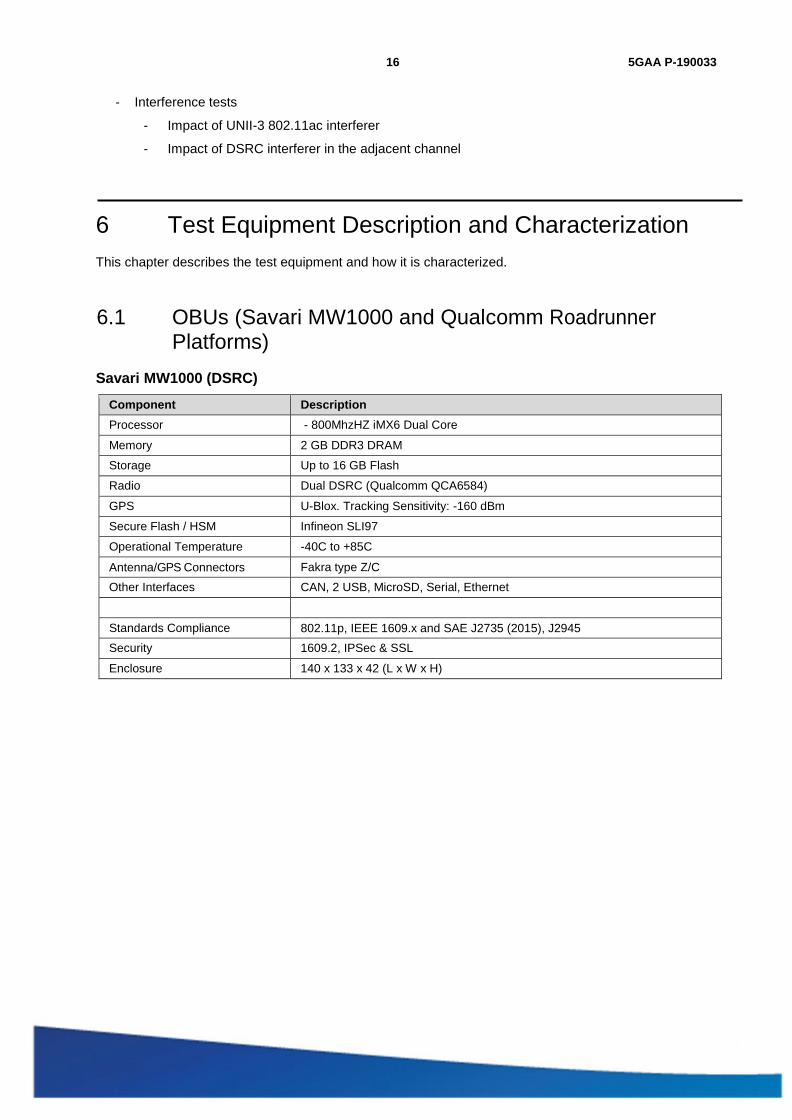
6.1 OBUs (Savari MW1000 and Qualcomm Roadrunner Platforms)
Savari MW1000 (DSRC)
Component Description
Processor - 800MhzHZ iMX6 Dual Core
Memory 2 GB DDR3 DRAM Storage Up to 16 GB Flash Radio Dual DSRC (Qualcomm QCA6584)
GPS U-Blox. Tracking Sensitivity: -160 dBm Secure Flash / HSM Infineon SLI97 Operational Temperature -40C to +85C
Antenna/GPS Connectors Fakra type Z/C Other Interfaces CAN, 2 USB, MicroSD, Serial, Ethernet
Standards Compliance 802.11p, IEEE 1609.x and SAE J2735 (2015), J2945 Security 1609.2, IPSec & SSL
Enclosure 140 x 133 x 42 (L x W x H)
17 5GAA P-190033
5GAA
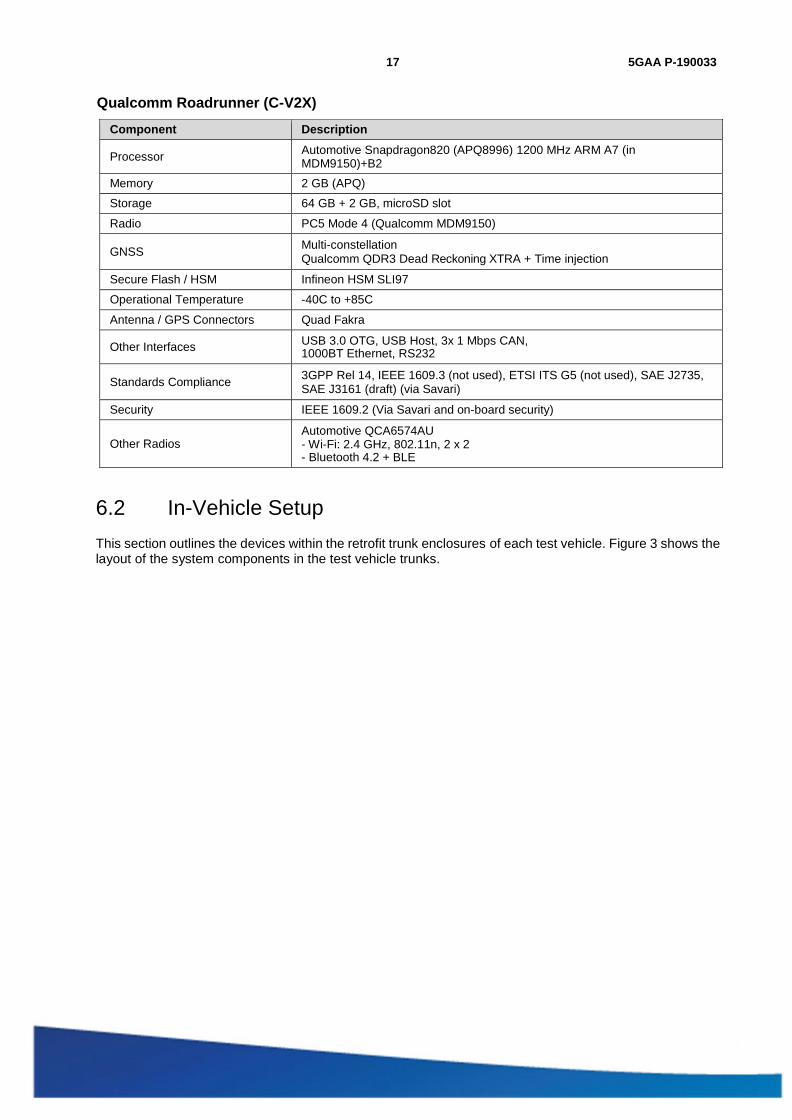
Qualcomm Roadrunner (C-V2X)
Component Description
Processor Automotive Snapdragon820 (APQ8996) 1200 MHz ARM A7 (in MDM9150)+B2
Memory 2 GB (APQ) Storage 64 GB + 2 GB, microSD slot Radio PC5 Mode 4 (Qualcomm MDM9150)
GNSS Multi-constellation Qualcomm QDR3 Dead Reckoning XTRA + Time injection
Secure Flash / HSM Infineon HSM SLI97 Operational Temperature -40C to +85C Antenna / GPS Connectors Quad Fakra
Other Interfaces USB 3.0 OTG, USB Host, 3x 1 Mbps CAN, 1000BT Ethernet, RS232
Standards Compliance 3GPP Rel 14, IEEE 1609.3 (not used), ETSI ITS G5 (not used), SAE J2735, SAE J3161 (draft) (via Savari)
Security IEEE 1609.2 (Via Savari and on-board security)
Other Radios Automotive QCA6574AU - Wi-Fi: 2.4 GHz, 802.11n, 2 x 2 - Bluetooth 4.2 + BLE
6.2 In-Vehicle Setup This section outlines the devices within the retrofit trunk enclosures of each test vehicle. Figure 3 shows the layout of the system components in the test vehicle trunks.

18 5GAA P-190033
5GAA
Figure 3: Ford Fusion Test Vehicle Trunk Enclosure Contents
The vehicles used in testing are six 2017 Ford Fusion sedans outfitted with identical equipment.
- The trunk enclosure is made of 80/20 aluminum rail and is secured to the trunk floor.
- The enclosure is secured enough so vibration and movement outside of normal road disturbances do not influence the components.
- Each vehicle is outfitted with a magnet-mounted antenna with connections for 5.9 GHz (x2), Cellular, and GPS. The antenna is a MobileMark ECOM6 (manufacturer part number: ECOM6-5500-3C-BLK- 120).
- Each antenna is placed on the apex of the vehicle roof and aligned 24” from the center of the dipole.
- The driver-side antenna cable is clocked at 225 degrees. See Figure 8.
- The passenger-side antenna cable is clocked at 45 degrees. See Figure 8.
- Two low-loss, 8--foot RF195 cables are connected to the 5.9-GHz antenna connectors and routed through to the trunk. These and the GPS antenna connections are made to the appropriate device under test. Due to space limitations in Figure 3 only DSRC primary and secondary antenna ports are shown connected to the antennas. Both OBUs use the same antennas and cables, but only one OBU is connected to the antennas at any time.
- Each of the vehicle CAN buses is routed through the Netway module into each of the on-board units. The Netway module translates the required Ford-specific CAN signals coming from the vehicle into the 6XX message set standard defined by CAMP.
- The custom power distribution panel interfaces with the vehicle battery and ACC signal to manage power to the components. The panel keeps power to the system once the ACC signal is pulled and initiates proper shutdown sequences for the connected components.

19 5GAA P-190033
5GAA
- Additional, optional components include a Qualcomm® DragonBoard, a Raspberry PI, Network Storage, and a Cradlepoint. The Cradlepoint provides internet access to the components that can use it, such as the DragonBoard or Raspberry PI. The Cradlepoint was not used during the comparison tests and was either powered off or removed from the instrumentation bay. The Raspberry PI works in conjunction with the Network Storage unit for data transfer.
- Ethernet cables are routed throughout the vehicle from the trunk using the network switch to give operators access to the devices under test via the local area network. The hardwired Ethernet cables were used to collect the data from the devices under test once the tests were completed.
6.3 Lab Equipment Variable Attenuator
- Model 4205 0.2 to 6 GHz Digital Attenuator TTL and USB Control, SMA Connectors
- Attenuation varies up to 95.5 dB in 0.5-dB steps. Nominal impedance is 50 Ω, and the frequency range is 0.2 to 6.0 GHz
R&S SMBV100A Vector Signal Generator**
- R&S®SMBV100A was equipped with an internal baseband generator to allow generation of a C-V2X signal.
R&S CMW 500 – Protocol Test**
- R&S CMW 500 used for C-V2X & Wi-Fi signal generation. Combination of R&S SMBV100A & CMW 500 used for C-V2X Testing.
Spirent VR5 Channel Emulator
- The Spirent spatial channel Emulator is an External RF BOX which is used to run AWGN and Fading scenarios. With this channel emulator we control MIMO configuration, DUT RSRP, AWGN power/SNR, Doppler, fading, timing/frequency offset and noise Bandwidth.
Keysight Technologies (formerly Agilent) N9010A EXA Signal Analyzer, 10 Hz to 26.5 GHz
- EXA Signal Analyzer used to perform power measurements quickly at discrete frequency points with list-sweep mode
R&S SMJ100A Vector Signal Generator
- The R&S®SMJ100A is used as signal generator to generate AWGN waveforms of given powers and bandwidths.
Splitter/Combiner
- Splitter – Combiners that support 6 GHz RF are used based on the testing needs.
R&S NRP2 Power Meter
- Power meter used to accurate measure cable loss.
RF Cables Used
- LMR-195, LMR-100A, and LMR-240
RF Shielded Test Enclosure - Model STE3300 was used to enclose devices (C-V2X and DSRC) during execution of test.

20 5GAA P-190033
5GAA
6.4 Antenna Characterization Antenna characterization was performed to determine the performance of the antenna installation on the vehicles. The identical antenna configuration was used to support both DSRC and C-V2X.
6.4.1 Test Setup The antenna performance was validated as passive components in the Oakland University Test using a gantry system. The method used was gain by comparison, and measurements were performed in the far field; no near-to-far field comparisons were performed. Table 2 shows the test parameters used for the antenna performance testing. These values are the standard test setup parameters used by OEMs for DSRC testing.
Figure 4: Oakland University Antenna Test Range (NOTE: Vehicle shown is not actual test vehicle.)
Table 2: Antenna Test Parameters
Test Frequencies 5850, 5860, 5870, 5880, 5890, 5900, 5910, 5920, 5930 MHz
Elevation 10 deg to -6 deg by 2 deg (0 deg is defined as horizon)
Azimuth 0 deg to 355 (Zero is Front of Vehicle)
Elevation
Azimuth

21 5GAA P-190033
5GAA
6.4.2 Measurement Results Initial measurement was of the antenna (ECOM6-5500) on a 1-meter rolled edge ground plane. See Figure 5.
Figure 5: Single Antenna on 1 Meter Rolled Edge Groundplane
Figure 6: Test Setup
22 5GAA P-190033
5GAA
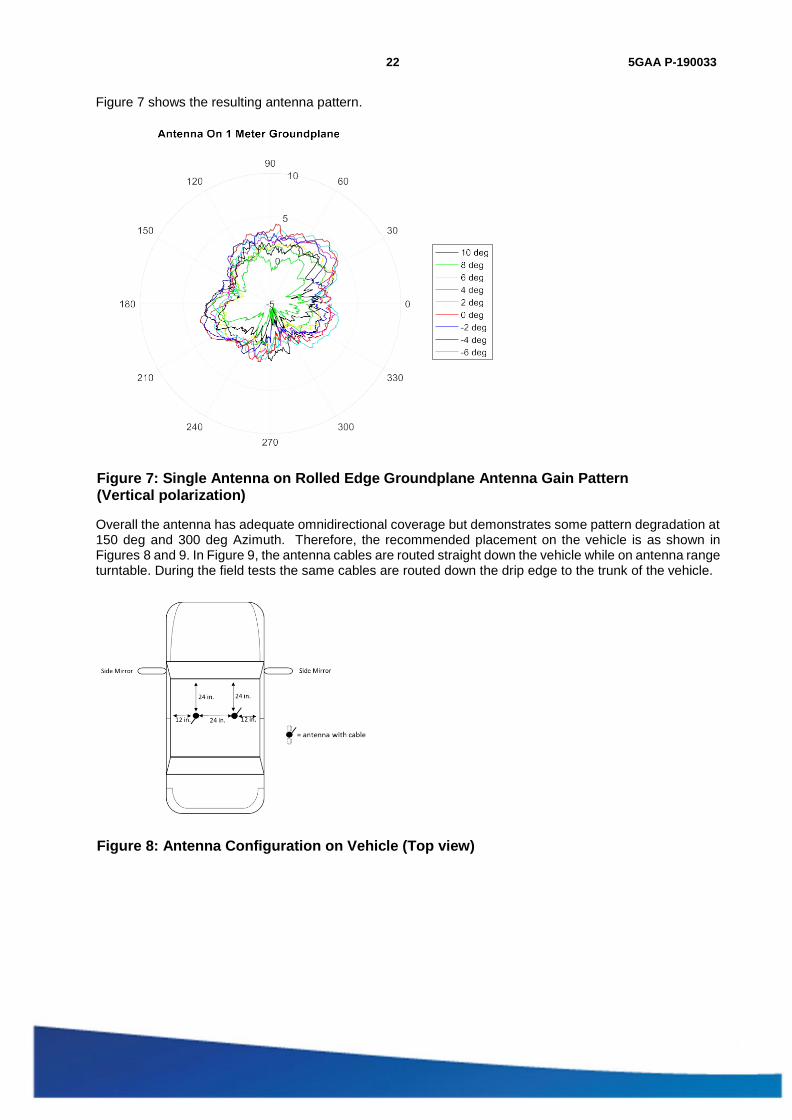
Figure 7 shows the resulting antenna pattern.
Figure 7: Single Antenna on Rolled Edge Groundplane Antenna Gain Pattern (Vertical polarization)
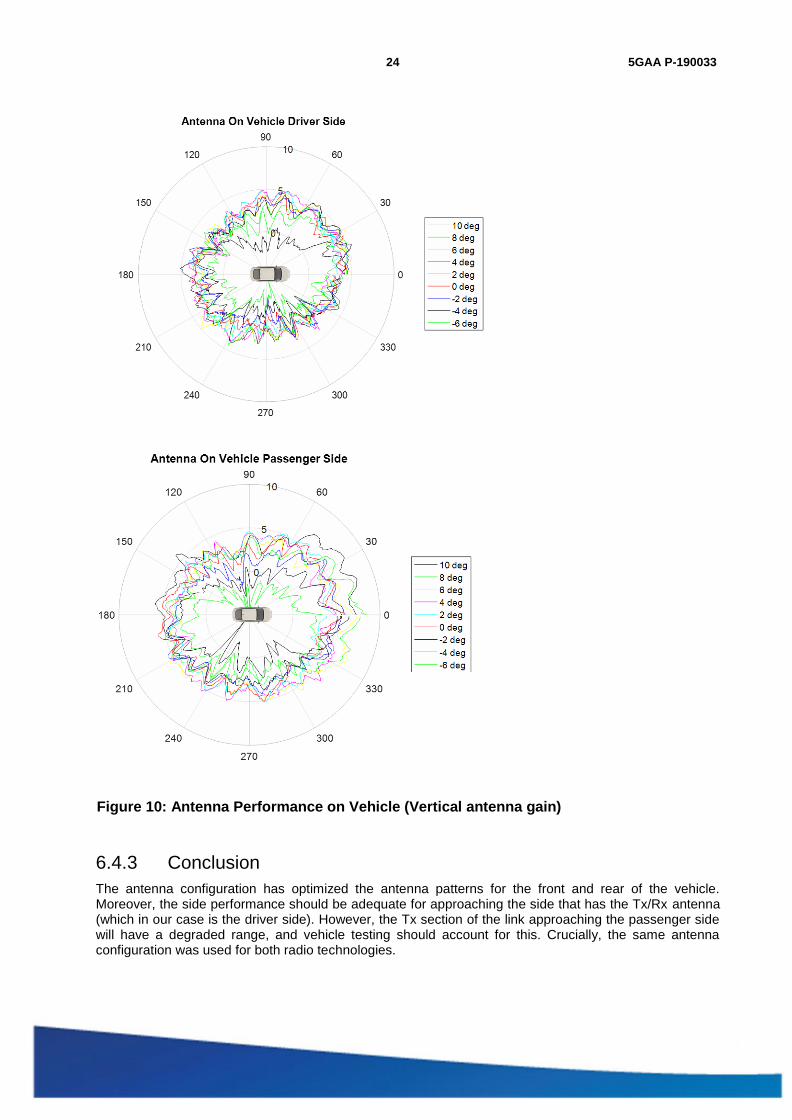
Overall the antenna has adequate omnidirectional coverage but demonstrates some pattern degradation at 150 deg and 300 deg Azimuth. Therefore, the recommended placement on the vehicle is as shown in Figures 8 and 9. In Figure 9, the antenna cables are routed straight down the vehicle while on antenna range turntable. During the field tests the same cables are routed down the drip edge to the trunk of the vehicle.
Figure 8: Antenna Configuration on Vehicle (Top view)

23 5GAA P-190033
5GAA
Figure 9: Antennas on Vehicle
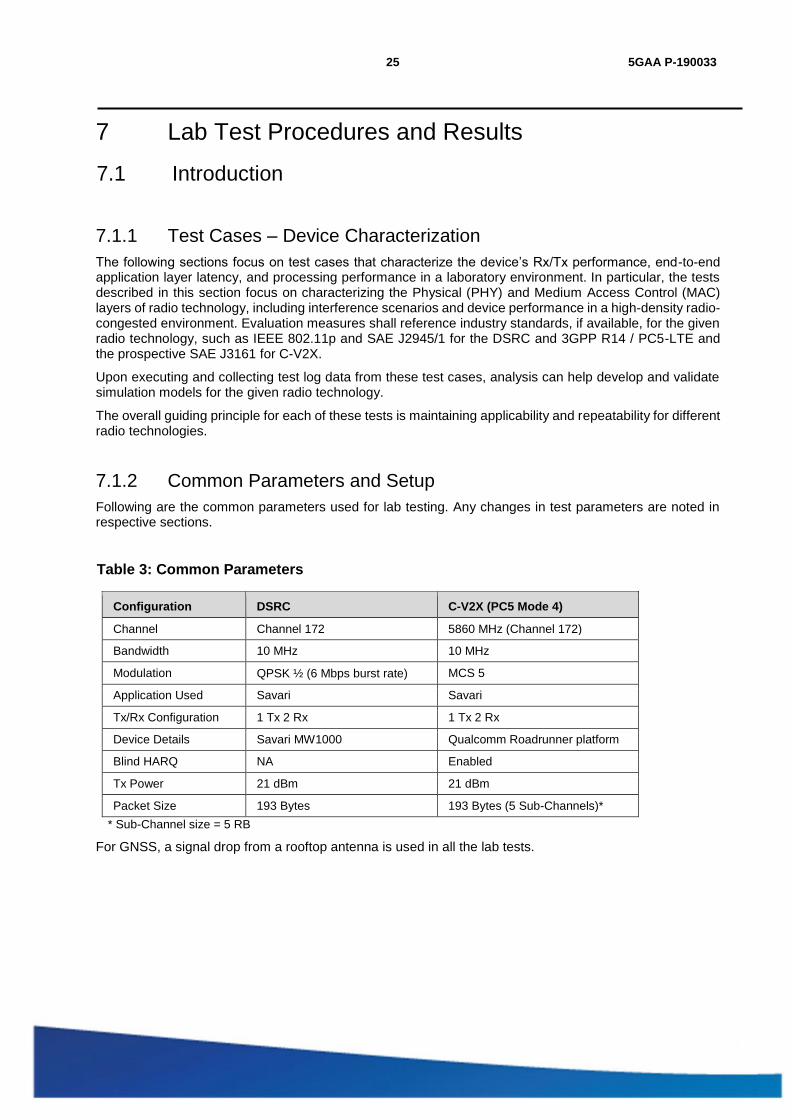
This configuration optimizes the antenna gain to the front and rear of the vehicle. Figure 10 shows this in the antenna gain patterns.
24 5GAA P-190033
5GAA
Figure 10: Antenna Performance on Vehicle (Vertical antenna gain)
6.4.3 Conclusion The antenna configuration has optimized the antenna patterns for the front and rear of the vehicle. Moreover, the side performance should be adequate for approaching the side that has the Tx/Rx antenna (which in our case is the driver side). However, the Tx section of the link approaching the passenger side will have a degraded range, and vehicle testing should account for this. Crucially, the same antenna configuration was used for both radio technologies.
25 5GAA P-190033
5GAA
7 Lab Test Procedures and Results
7.1 Introduction
7.1.1 Test Cases – Device Characterization The following sections focus on test cases that characterize the device’s Rx/Tx performance, end-to-end application layer latency, and processing performance in a laboratory environment. In particular, the tests described in this section focus on characterizing the Physical (PHY) and Medium Access Control (MAC) layers of radio technology, including interference scenarios and device performance in a high-density radio- congested environment. Evaluation measures shall reference industry standards, if available, for the given radio technology, such as IEEE 802.11p and SAE J2945/1 for the DSRC and 3GPP R14 / PC5-LTE and the prospective SAE J3161 for C-V2X.
Upon executing and collecting test log data from these test cases, analysis can help develop and validate simulation models for the given radio technology.
The overall guiding principle for each of these tests is maintaining applicability and repeatability for different radio technologies.
7.1.2 Common Parameters and Setup Following are the common parameters used for lab testing. Any changes in test parameters are noted in respective sections.
Table 3: Common Parameters
Configuration DSRC C-V2X (PC5 Mode 4)
Channel Channel 172 5860 MHz (Channel 172)
Bandwidth 10 MHz 10 MHz
Modulation QPSK ½ (6 Mbps burst rate) MCS 5
Application Used Savari Savari
Tx/Rx Configuration 1 Tx 2 Rx 1 Tx 2 Rx
Device Details Savari MW1000 Qualcomm Roadrunner platform
Blind HARQ NA Enabled
Tx Power 21 dBm 21 dBm
Packet Size 193 Bytes 193 Bytes (5 Sub-Channels)* * Sub-Channel size = 5 RB
For GNSS, a signal drop from a rooftop antenna is used in all the lab tests.
26 5GAA P-190033
5GAA
7.1.3 General Guidance on C-V2X and DSRC Device RF Power Management
7.1.3.1 Equipment Used
1. Spectrum Analyzer (SA)
2. Power Sensor
3. Signal Generator (SG)
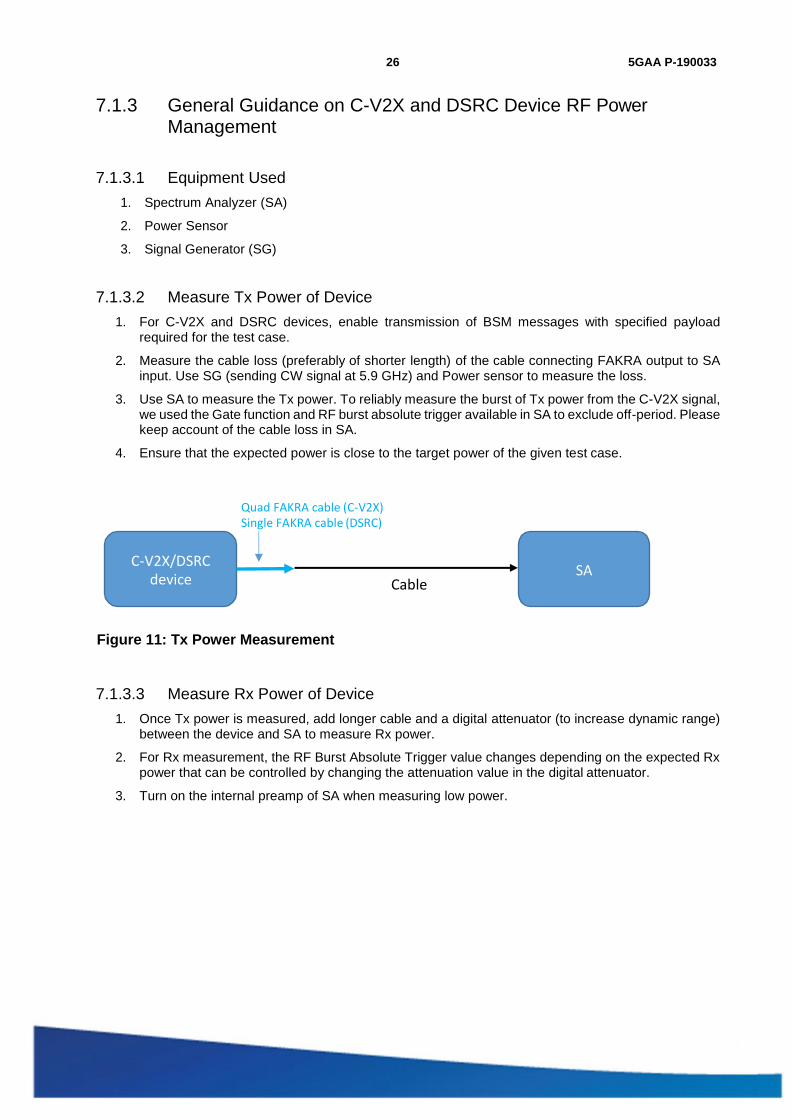
7.1.3.2 Measure Tx Power of Device 1. For C-V2X and DSRC devices, enable transmission of BSM messages with specified payload
required for the test case.
2. Measure the cable loss (preferably of shorter length) of the cable connecting FAKRA output to SA input. Use SG (sending CW signal at 5.9 GHz) and Power sensor to measure the loss.
3. Use SA to measure the Tx power. To reliably measure the burst of Tx power from the C-V2X signal, we used the Gate function and RF burst absolute trigger available in SA to exclude off-period. Please keep account of the cable loss in SA.
4. Ensure that the expected power is close to the target power of the given test case.
Figure 11: Tx Power Measurement
7.1.3.3 Measure Rx Power of Device 1. Once Tx power is measured, add longer cable and a digital attenuator (to increase dynamic range)
between the device and SA to measure Rx power.
2. For Rx measurement, the RF Burst Absolute Trigger value changes depending on the expected Rx power that can be controlled by changing the attenuation value in the digital attenuator.
3. Turn on the internal preamp of SA when measuring low power.
Quad FAKRA cable (C-V2X) Single FAKRA cable (DSRC)
C-V2X/DSRC device
SA Cable
27 5GAA P-190033
5GAA
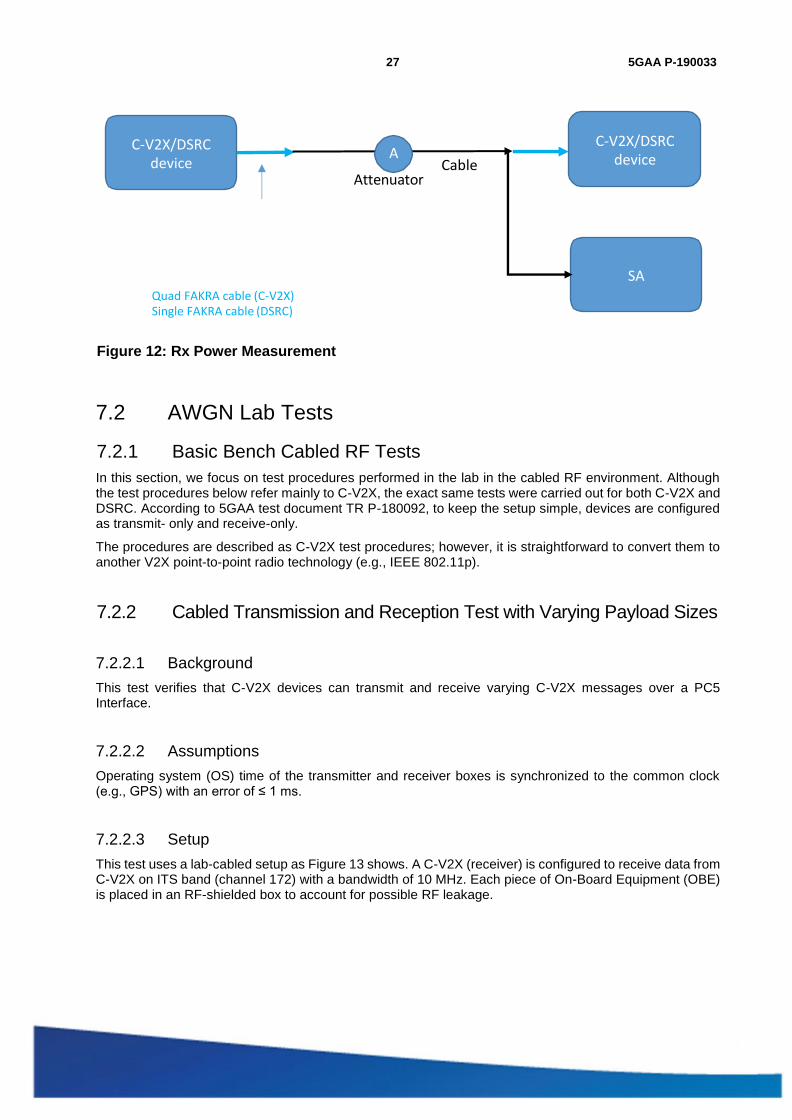
Figure 12: Rx Power Measurement
7.2 AWGN Lab Tests
7.2.1 Basic Bench Cabled RF Tests In this section, we focus on test procedures performed in the lab in the cabled RF environment. Although the test procedures below refer mainly to C-V2X, the exact same tests were carried out for both C-V2X and DSRC. According to 5GAA test document TR P-180092, to keep the setup simple, devices are configured as transmit- only and receive-only.
The procedures are described as C-V2X test procedures; however, it is straightforward to convert them to another V2X point-to-point radio technology (e.g., IEEE 802.11p).
7.2.2 Cabled Transmission and Reception Test with Varying Payload Sizes
7.2.2.1 Background This test verifies that C-V2X devices can transmit and receive varying C-V2X messages over a PC5 Interface.
7.2.2.2 Assumptions Operating system (OS) time of the transmitter and receiver boxes is synchronized to the common clock (e.g., GPS) with an error of ≤ 1 ms.
7.2.2.3 Setup This test uses a lab-cabled setup as Figure 13 shows. A C-V2X (receiver) is configured to receive data from C-V2X on ITS band (channel 172) with a bandwidth of 10 MHz. Each piece of On-Board Equipment (OBE) is placed in an RF-shielded box to account for possible RF leakage.
C-V2X/DSRC device
A
Attenuator Cable
C-V2X/DSRC device
SA Quad FAKRA cable (C-V2X) Single FAKRA cable (DSRC)
28 5GAA P-190033
5GAA
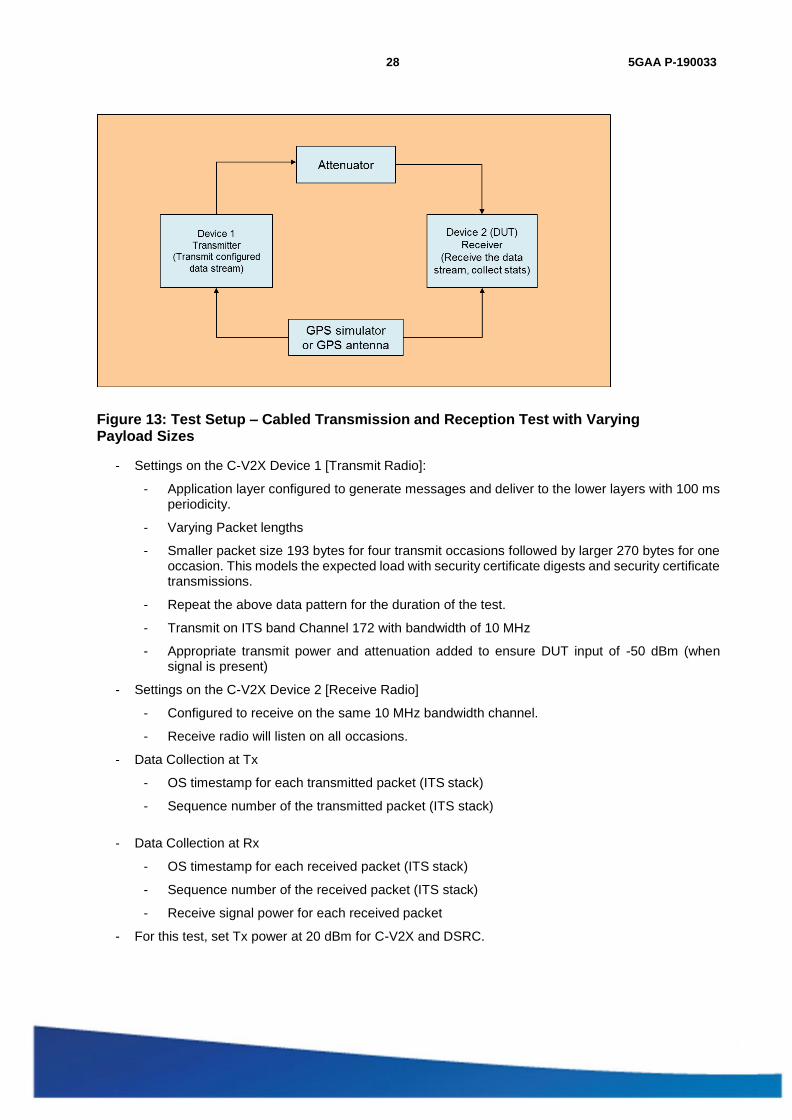
Figure 13: Test Setup – Cabled Transmission and Reception Test with Varying Payload Sizes
- Settings on the C-V2X Device 1 [Transmit Radio]:
- Application layer configured to generate messages and deliver to the lower layers with 100 ms periodicity.
- Varying Packet lengths
- Smaller packet size 193 bytes for four transmit occasions followed by larger 270 bytes for one occasion. This models the expected load with security certificate digests and security certificate transmissions.
- Repeat the above data pattern for the duration of the test.
- Transmit on ITS band Channel 172 with bandwidth of 10 MHz
- Appropriate transmit power and attenuation added to ensure DUT input of -50 dBm (when signal is present)
- Settings on the C-V2X Device 2 [Receive Radio]
- Configured to receive on the same 10 MHz bandwidth channel.
- Receive radio will listen on all occasions.
- Data Collection at Tx
- OS timestamp for each transmitted packet (ITS stack)
- Sequence number of the transmitted packet (ITS stack)
- Data Collection at Rx
- OS timestamp for each received packet (ITS stack)
- Sequence number of the received packet (ITS stack)
- Receive signal power for each received packet
- For this test, set Tx power at 20 dBm for C-V2X and DSRC.
29 5GAA P-190033
5GAA
Table 4: Test Configuration
Configuration C-V2X DSRC
Packet Size 193 and 270 Bytes 193 and 270 Bytes
Number of Samples 1000 1000
Tx Power 20 dBm 20 dBm
7.2.2.4 Test Execution 1. Configure the attenuator so that received power on the receiver entity is -50 dBm.
2. Configure the transmit device with the data stream of interest.
- Transmit power for the transmit device remains constant.
- Data stream is a sample SPS-based transmit flow of varying payload sizes sent periodically every 100 ms (NOTE: equivalent to setting a periodic stream at 100 ms period for other technologies)
3. Record this data collected by the Tx and Rx device in a log file.
- OS timestamp for each Tx/Rx packet
- Sequence number of the Tx/Rx packet
- Receive signal power for each Rx packet
7.2.2.5 Unique Tests to Conduct Run this test using:
- Two (2) C-V2X devices for the test
30 5GAA P-190033
5GAA
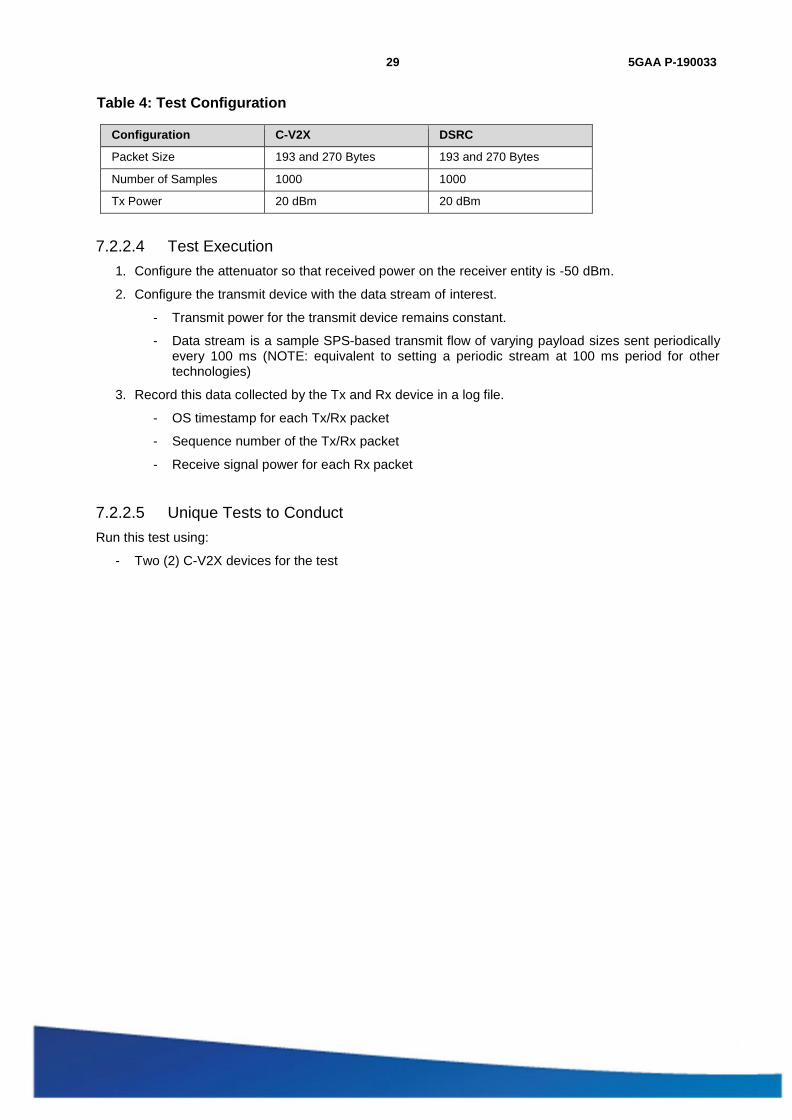
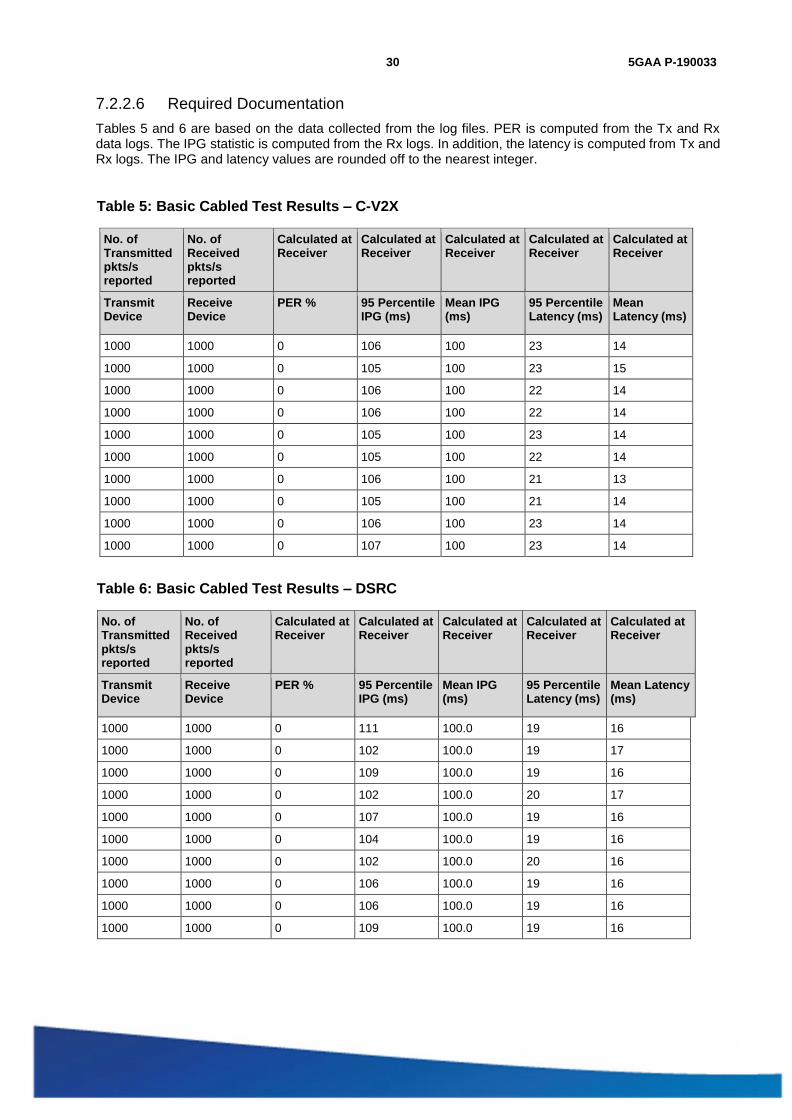
7.2.2.6 Required Documentation Tables 5 and 6 are based on the data collected from the log files. PER is computed from the Tx and Rx data logs. The IPG statistic is computed from the Rx logs. In addition, the latency is computed from Tx and Rx logs. The IPG and latency values are rounded off to the nearest integer.
Table 5: Basic Cabled Test Results – C-V2X
No. of Transmitted pkts/s reported
No. of Received pkts/s reported
Calculated at Receiver
Calculated at Receiver
Calculated at Receiver
Calculated at Receiver
Calculated at Receiver
Transmit Device
Receive Device
PER % 95 Percentile IPG (ms)
Mean IPG (ms)
95 Percentile Latency (ms)
Mean Latency (ms)
1000 1000 0 106 100 23 14
1000 1000 0 105 100 23 15
1000 1000 0 106 100 22 14
1000 1000 0 106 100 22 14
1000 1000 0 105 100 23 14
1000 1000 0 105 100 22 14
1000 1000 0 106 100 21 13
1000 1000 0 105 100 21 14
1000 1000 0 106 100 23 14
1000 1000 0 107 100 23 14
Table 6: Basic Cabled Test Results – DSRC
No. of Transmitted pkts/s reported
No. of Received pkts/s reported
Calculated at Receiver
Calculated at Receiver
Calculated at Receiver
Calculated at Receiver
Calculated at Receiver
Transmit Device
Receive Device
PER % 95 Percentile IPG (ms)
Mean IPG (ms)
95 Percentile Latency (ms)
Mean Latency (ms)
1000 1000 0 111 100.0 19 16
1000 1000 0 102 100.0 19 17
1000 1000 0 109 100.0 19 16
1000 1000 0 102 100.0 20 17
1000 1000 0 107 100.0 19 16
1000 1000 0 104 100.0 19 16
1000 1000 0 102 100.0 20 16
1000 1000 0 106 100.0 19 16
1000 1000 0 106 100.0 19 16
1000 1000 0 109 100.0 19 16

31 5GAA P-190033
5GAA
7.2.2.7 Evaluation Criteria The evaluation criteria are a successful decode of all the payload lengths on the Rx entity.
7.2.2.8 Key Takeaway Test results show that in excellent radio conditions (-50 dBm Receive power with no added noise), both V2X technologies can reliably carry BSM payload sizes. In unloaded conditions, C-V2X latency is generally within 1 to 4 ms of DSRC latency, which from the entire vehicle system perspective, is a negligible difference.
7.2.3 Clean Channel Cabled Transmission and Reception Test Across Power Levels
7.2.3.1 Background This test verifies that C-V2X devices can transmit and receive C-V2X messages over a PC5 Interface at different received power levels and assess end-to-end statistics. This test determines the receiver sensitivity of a device (at a 10% PER level).
7.2.3.2 Assumptions The operating system (OS) time of the transmitter and receiver boxes is synchronized to the common clock (e.g., GPS) with an error of no more than 1 ms.
7.2.3.3 Setup This test used a lab-cabled setup as Figure 14 shows. A C-V2X (receiver) is configured to receive data from C-V2X on the ITS band (Channel 184) with a Bandwidth of 10 MHz Each C-V2X OBE was placed in an RF- shielded box to account for possible RF leakage.
Figure 14: Test Setup – Clean Channel Transmission and Reception Test Across Power Levels

32 5GAA P-190033
5GAA
- Settings on the C-V2X Device 1 [ Transmit Radio]:
- Application layer configured to generate messages and deliver to the lower layers with 100 ms periodicity.
- Packet length is constant and is set to 193 Bytes.
- Transmit on ITS band (CH 184) with bandwidth of 10 MHz
- Appropriate transmit power and fixed attenuation added to ensure DUT input of -72.45 dBm.
- Settings on the C-V2X Device 2 [ Receive Radio]
- Configured to receive on ITS Band (CH 184) and bandwidth of 10 MHz
- Receive radio in C-V2X configured to always be in Rx mode.
- Data Collection at Tx
- OS timestamp for each transmitted packet.
- Sequence number of the transmitted packet.
- Data Collection at Rx
- OS timestamp for each received packet.
- Sequence number of the received packet.
- Receive signal power for each received packet.
- For this test Tx power is set at 20 dBm for both C-V2X and DSRC.
Table 7: Test Configuration
Configuration C-V2X DSRC
Number of Samples 1000 1000
Tx Power 20 dBm 20 dBm
7.2.3.4 Test Execution
1. Calibrate the insertion loss between the two devices by setting the attenuator to 0 dB and measure the loss with both cables connected to the attenuator. This measured value will be the fixed insertion loss of the cables and attenuator setup.
2. Transmit power for the transmit device remains constant.
3. Adjust overall path loss (insertion loss plus attenuator value) to be 92.45 dB
4. Vary the attenuation in large steps of 10/5 dB initially
a. Near sensitivity, reduce step size to 1 dB
b. Continue the test until observed PER is 100%
5. Record these statistics on the devices for each path loss setting in a log file:
- OS timestamp for each Tx/Rx packet
- Sequence number of the Tx/Rx packet
- Receive signal power for each Rx packet
NOTE: Tests should be conducted at room temperature (21 deg Celsius +/- 5 deg).

33 5GAA P-190033
5GAA
7.2.3.5 Unique Tests to Conduct Run this test using:
Two (2) C-V2X devices for the test
7.2.3.6 Required Documentation Tables 8 through 11 are based on the data we collected from log files. PER is computed from the Tx and Rx data logs. The number of missing (not received) packets is divided by the number of total packets transmitted. The IPG statistic is computed from the Rx logs. The latency is computed from Tx and Rx logs. IPG and latency values are captured for runs in which PER reaches around 10%. The IPG and latency values are rounded off to the nearest integer.
Table 8: C-V2X Results – PER
No. of Transmitted pkts/s
No. of Received pkts/s
Calculated at Receiver
Calculated at Receiver
Overall Path Loss (dB)
C-V2X Transmit Device
C-V2X Receive Device
CV2X PER % CBR (%) for C-V2X
109.45 1000 1000 0 <1%
114.45 1000 1000 0.1 <1%
119.45 1000 987 1.3 <1%
120.45 1000 989 1.1 <1%
121.45 1000 941 5.9 <1%
122.45 1000 947 5.3 <1%
123.45 1000 920 8 <1%
124.45 1000 708 29.2 <1%
125.45 1000 633 36.7 <1%
127.45 1000 421 57.9 <1%
128.45 1000 0 100 <1%
34 5GAA P-190033
5GAA
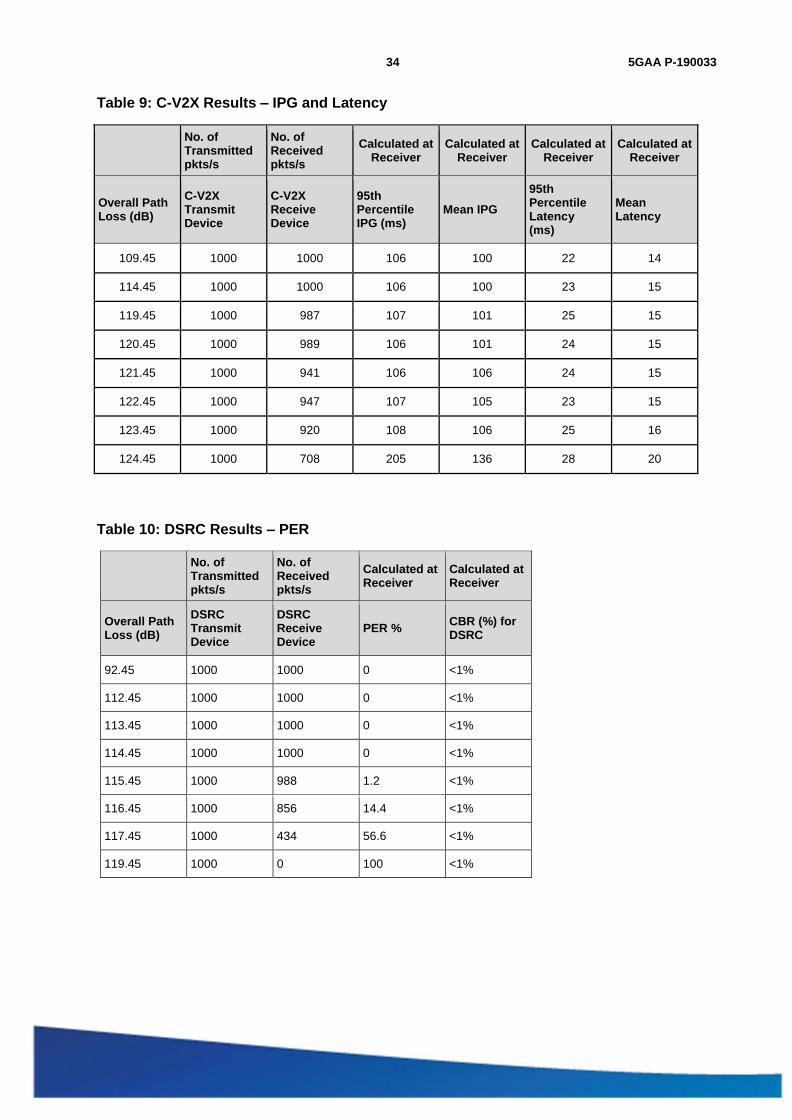
Table 9: C-V2X Results – IPG and Latency
No. of Transmitted pkts/s
No. of Received pkts/s
Calculated at Receiver
Calculated at Receiver
Calculated at Receiver
Calculated at Receiver
Overall Path Loss (dB)
C-V2X Transmit Device
C-V2X Receive Device
95th Percentile IPG (ms)
Mean IPG
95th Percentile Latency (ms)
Mean Latency
109.45 1000 1000 106 100 22 14
114.45 1000 1000 106 100 23 15
119.45 1000 987 107 101 25 15
120.45 1000 989 106 101 24 15
121.45 1000 941 106 106 24 15
122.45 1000 947 107 105 23 15
123.45 1000 920 108 106 25 16
124.45 1000 708 205 136 28 20
Table 10: DSRC Results – PER
No. of Transmitted pkts/s
No. of Received pkts/s
Calculated at Receiver
Calculated at Receiver
Overall Path Loss (dB)
DSRC Transmit Device
DSRC Receive Device
PER % CBR (%) for DSRC
92.45 1000 1000 0 <1%
112.45 1000 1000 0 <1%
113.45 1000 1000 0 <1%
114.45 1000 1000 0 <1%
115.45 1000 988 1.2 <1%
116.45 1000 856 14.4 <1%
117.45 1000 434 56.6 <1%
119.45 1000 0 100 <1%

35 5GAA P-190033
5GAA
Table 11: DSRC Results - IPG and Latency
No. of Transmitted pkts/s
No. of Received pkts/s
Calculated at Receiver
Calculated at Receiver
Calculated at Receiver
Calculated at Receiver
Overall Path Loss (dB)
DSRC Transmit Device
DSRC Receive Device
95th Percentile IPG (ms)
Mean IPG
95th Percentile Latency (ms)
Mean Latency
92.45 1000 1000 108 96.24 18 15.98
112.45 1000 1000 108 94.44 19 16.53
113.45 1000 1000 102 95.34 18 16.06
114.45 1000 1000 101 96.23 18 17.25
115.45 1000 988 102 96.28 19 17.21
116.45 1000 856 201 111.31 19 16.9
Figure 15: 7.2.3 – PER vs Overall Path Loss

36 5GAA P-190033
5GAA
Figure 16: 7.2.3 – 95th Percentile IPG
Figure 17: 7.2.3 – Mean IPG
37 5GAA P-190033
5GAA
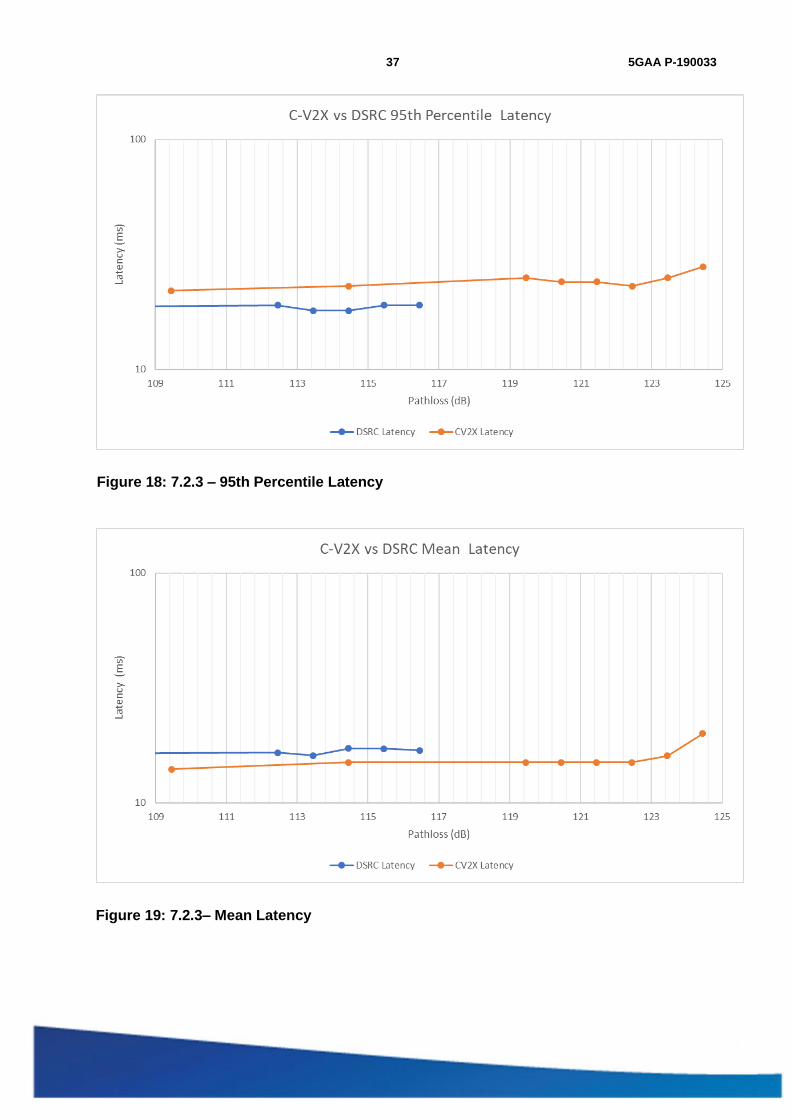
Figure 18: 7.2.3 – 95th Percentile Latency
Figure 19: 7.2.3– Mean Latency

38 5GAA P-190033
5GAA
7.2.3.7 Evaluation Criteria Evaluation criteria is a successful decode of all the payload lengths on Rx entity.
7.2.3.8 Key Takeaway The purpose of this controlled lab test was to examine and compare the communication reliability of V2X technologies at varying levels of received signal strength. This test emulates field scenarios where the received signal power diminishes because of the distance between the transmitter and the receiver, or because of obstructions between the two. This test has no added background interference in the channel.
The results show significant reliability advantage of C-V2X over DSRC, which translates into a longer communication range for C-V2X in the real world. Field results in Chapter 8 show these gains. This advantage implies enhanced safety for drivers and pedestrians by providing reliable and early alerts even with coverage dead spots created by obstructions such as buildings, vehicles, and foliage.
Even at reasonable distances, the RSSI can be low due to obstructions such as buildings or blocking vehicles. In DNPW scenarios for example, a few vehicles in front of the receiver severely degrade the received signal strength. Similarly, a line of vehicles waiting in turn lanes from the opposite direction can severely degrade the RSSI in the left-turn-assist scenario. Obstructions create areas of very low RSSI in the environment, i.e., dead spots. With superior link performance, C-V2X can eliminate or alleviate the dead spots experienced by DSRC.
Note: The C-V2X devices used in the current tests were loaded with pre-commercial software. With commercial-grade software that has become available recently, C-V2X performance is expected to be better than what was characterized in this report.
7.2.4 Cabled Transmission and Reception Test with Added Channel Impairment
7.2.4.1 Background This test verifies that C-V2X devices can transmit and receive messages over the PC5 Interface with an AWGN channel impairment model applied between the transmit and receive devices.
7.2.4.2 Assumptions The operating system time of the transmitter and receiver boxes is synchronized to a common clock (e.g., GNSS) with an error of no more than 1 ms.
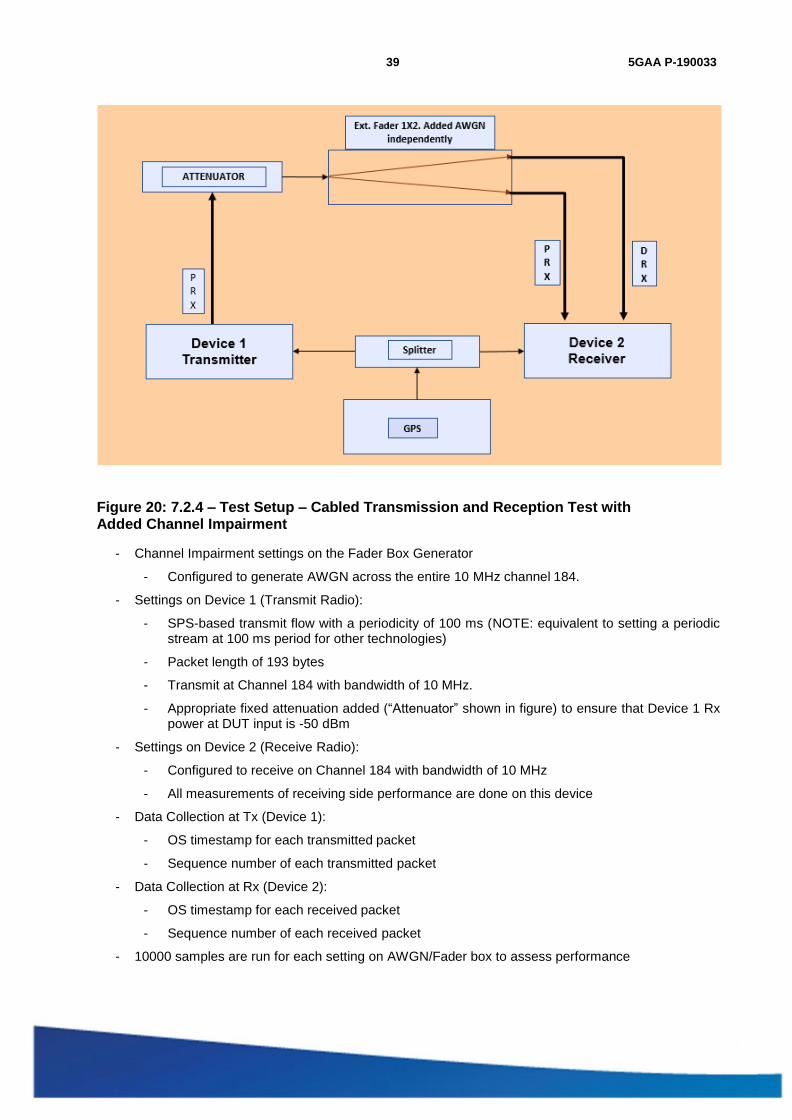
7.2.4.3 Setup This test uses a lab-cabled setup as Figure 20 shows. A Fader Box is used to generate AWGN in the frequency range of the channel, and Device 2 (receiver) is configured to receive data from Device 1 on this same impaired channel.(Channel 184)
39 5GAA P-190033
5GAA
Figure 20: 7.2.4 – Test Setup – Cabled Transmission and Reception Test with Added Channel Impairment
- Channel Impairment settings on the Fader Box Generator
- Configured to generate AWGN across the entire 10 MHz channel 184.
- Settings on Device 1 (Transmit Radio):
- SPS-based transmit flow with a periodicity of 100 ms (NOTE: equivalent to setting a periodic stream at 100 ms period for other technologies)
- Packet length of 193 bytes
- Transmit at Channel 184 with bandwidth of 10 MHz.
- Appropriate fixed attenuation added (“Attenuator” shown in figure) to ensure that Device 1 Rx power at DUT input is -50 dBm
- Settings on Device 2 (Receive Radio):
- Configured to receive on Channel 184 with bandwidth of 10 MHz
- All measurements of receiving side performance are done on this device
- Data Collection at Tx (Device 1):
- OS timestamp for each transmitted packet
- Sequence number of each transmitted packet
- Data Collection at Rx (Device 2):
- OS timestamp for each received packet
- Sequence number of each received packet
- 10000 samples are run for each setting on AWGN/Fader box to assess performance
40 5GAA P-190033
5GAA
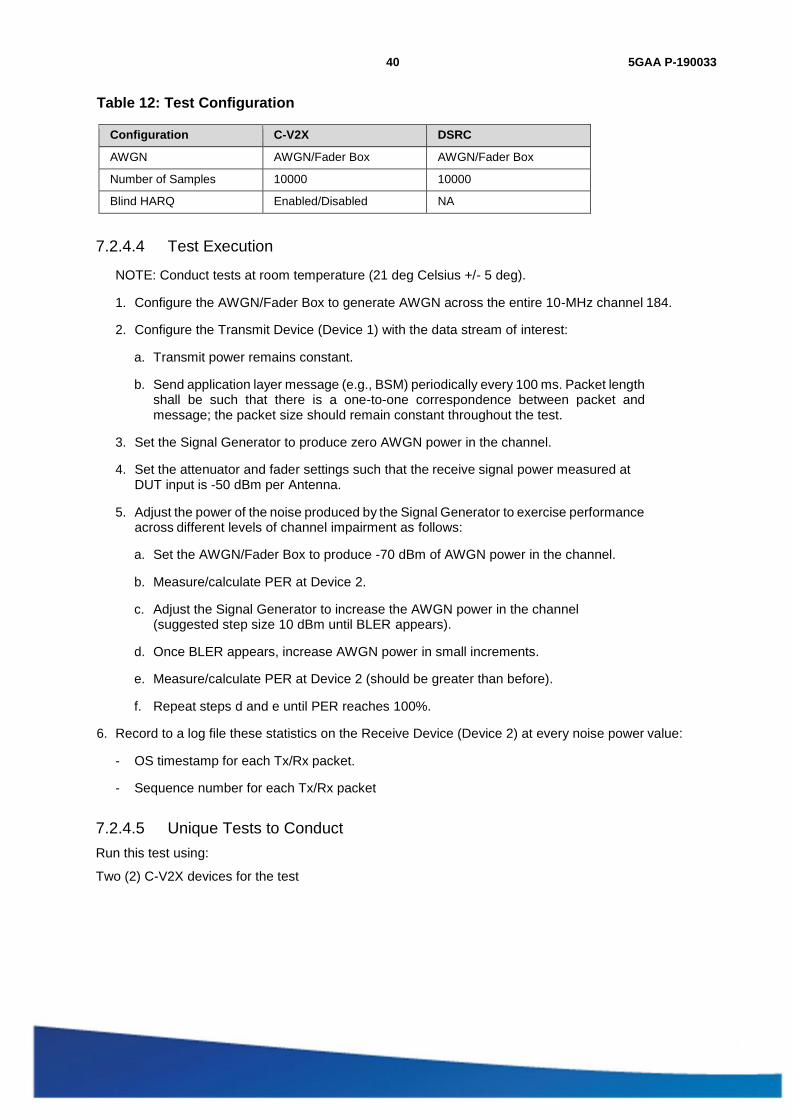
Table 12: Test Configuration
Configuration C-V2X DSRC
AWGN AWGN/Fader Box AWGN/Fader Box
Number of Samples 10000 10000
Blind HARQ Enabled/Disabled NA
7.2.4.4 Test Execution
NOTE: Conduct tests at room temperature (21 deg Celsius +/- 5 deg).
1. Configure the AWGN/Fader Box to generate AWGN across the entire 10-MHz channel 184.
2. Configure the Transmit Device (Device 1) with the data stream of interest:
a. Transmit power remains constant.
b. Send application layer message (e.g., BSM) periodically every 100 ms. Packet length shall be such that there is a one-to-one correspondence between packet and message; the packet size should remain constant throughout the test.
3. Set the Signal Generator to produce zero AWGN power in the channel.
4. Set the attenuator and fader settings such that the receive signal power measured at DUT input is -50 dBm per Antenna.
5. Adjust the power of the noise produced by the Signal Generator to exercise performance across different levels of channel impairment as follows:
a. Set the AWGN/Fader Box to produce -70 dBm of AWGN power in the channel.
b. Measure/calculate PER at Device 2.
c. Adjust the Signal Generator to increase the AWGN power in the channel (suggested step size 10 dBm until BLER appears).
d. Once BLER appears, increase AWGN power in small increments.
e. Measure/calculate PER at Device 2 (should be greater than before).
f. Repeat steps d and e until PER reaches 100%.
6. Record to a log file these statistics on the Receive Device (Device 2) at every noise power value:
- OS timestamp for each Tx/Rx packet.
- Sequence number for each Tx/Rx packet
7.2.4.5 Unique Tests to Conduct Run this test using:
Two (2) C-V2X devices for the test

41 5GAA P-190033
5GAA
7.2.4.6 Required Documentation
Tables 13 through 18 show the data collected from log files. IPG and latency values are captured for runs in which PER is < 10%. The IPG and latency values are rounded off to the nearest integer. Noise Power Spectral Density (PSD) is calculated from actual Noise power or from the knowledge of Signal power and SNR. PSD is calculated per Hz in terms of dBm and hence we also need to convert into a Logarithmic scale. For example, total noise power of -60 dBm for 10 MHz BW is equivalent to -130 dBm/Hz PSD.
Table 13: C-V2X Blind HARQ Enabled Results – PER
Signal Generator Setting
No. of Transmitted pkts
No. of Received Pkts
Calculated at Receiver
Noise PSD dBm/Hz
Tx Device Rx Device PER %
-139.54 10000 10000 0
-129.54 10000 10000 0
-119.54 10000 10000 0
-111.54 10000 9956 0.44
-111.44 10000 9864 1.36
-111.34 10000 9442 5.58
-111.24 10000 8784 12.16
-111.14 10000 7797 22.03
-111.04 10000 5343 46.57
-110.94 10000 4796 52.04
-110.84 10000 1062 89.38
-110.44 10000 16 99.84
Table 14: C-V2X Blind HARQ Enabled Results – IPG and Latency
Signal Generator Setting
No. of Transmitted pkts
No. of Received pkts
Calculated at Receiver
Calculated at Receiver
Calculated at Receiver
Calculated at Receiver
Noise PSD dBm/Hz
Tx Device Rx Device 95th Percentile IPG (ms)
Mean IPG 95th Percentile Latency (ms)
Mean Latency
-139.54 10000 10000 106 100 22 14
-129.54 10000 10000 106 100 22 14
-119.54 10000 10000 106 100 22 14
-111.54 10000 9956 107 101 26 19
-111.44 10000 9864 108 103 27 20
-111.34 10000 9442 200 106 29 20
-111.24 10000 8784 218 114 38 21
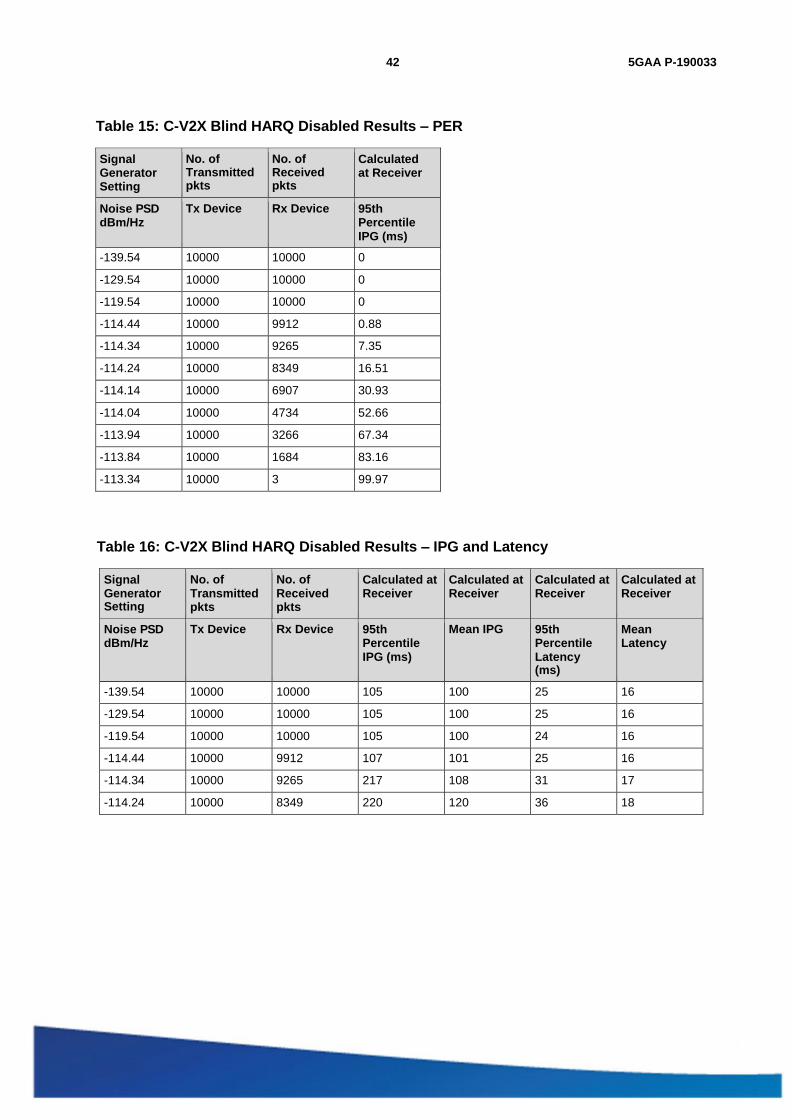
42 5GAA P-190033
5GAA
Table 15: C-V2X Blind HARQ Disabled Results – PER
Signal Generator Setting
No. of Transmitted pkts
No. of Received pkts
Calculated at Receiver
Noise PSD dBm/Hz
Tx Device Rx Device 95th Percentile IPG (ms)
-139.54 10000 10000 0
-129.54 10000 10000 0
-119.54 10000 10000 0
-114.44 10000 9912 0.88
-114.34 10000 9265 7.35
-114.24 10000 8349 16.51
-114.14 10000 6907 30.93
-114.04 10000 4734 52.66
-113.94 10000 3266 67.34
-113.84 10000 1684 83.16
-113.34 10000 3 99.97
Table 16: C-V2X Blind HARQ Disabled Results – IPG and Latency
Signal Generator Setting
No. of Transmitted pkts
No. of Received pkts
Calculated at Receiver
Calculated at Receiver
Calculated at Receiver
Calculated at Receiver
Noise PSD dBm/Hz
Tx Device Rx Device 95th Percentile IPG (ms)
Mean IPG 95th Percentile Latency (ms)
Mean Latency
-139.54 10000 10000 105 100 25 16
-129.54 10000 10000 105 100 25 16
-119.54 10000 10000 105 100 24 16
-114.44 10000 9912 107 101 25 16
-114.34 10000 9265 217 108 31 17
-114.24 10000 8349 220 120 36 18

43 5GAA P-190033
5GAA
Table 17: DSRC Results – PER
Signal Generator Setting
No. of Transmitted pkts
No. of Received Pkts
Calculated at Receiver
Noise PSD dBm/Hz
Tx Device Rx Device PER %
-130 10000 10000 0
-126 10000 9999 0.01
-125 10000 9999 0.01
-124 10000 9966 0.34
-123 10000 9414 5.86
-122.75 10000 9210 7.9
-122.5 10000 8610 13.9
-122 10000 6714 32.86
-121.5 10000 4103 58.97
-121 10000 969 90.31
-120 10000 3 99.97
Table 18: DSRC Results – IPG and Latency
Signal Generator Setting
No. of Transmitted pkts
No. of Received pkts
Calculated at Receiver
Calculated at Receiver
Calculated at Receiver
Calculated at Receiver
Noise PSD dBm/Hz
Tx Device Rx Device 95th Percentile IPG (ms)
Mean IPG 95th Percentile Latency (ms)
Mean Latency
-130 10000 10000 107 95.02 19 16.94
-126 10000 9999 103 94.74 18 15.7
-125 10000 9999 108 95.34 19 17.07
-124 10000 9966 108 95.28 19 16.95
-123 10000 9414 141.35 100.3 18 16.29
-122.75 10000 9210 199 102.4 18 15.38
-122.5 10000 8610 201 108.16 19 17
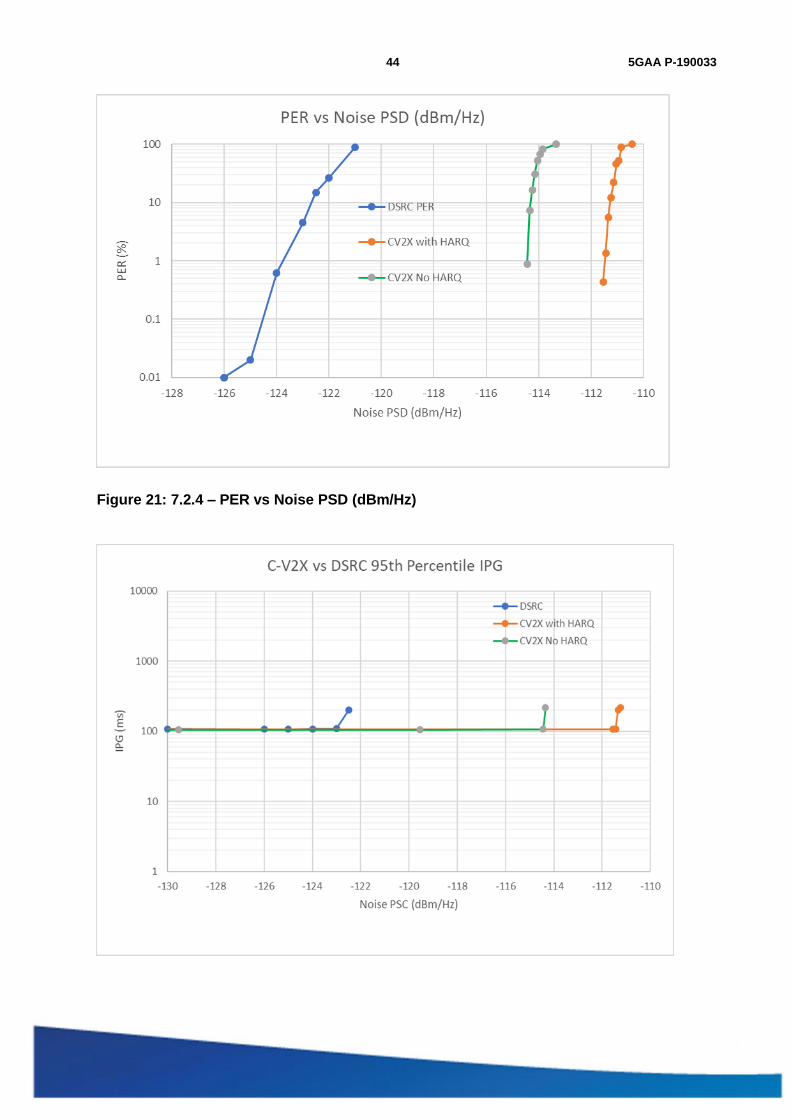
44 5GAA P-190033
5GAA
Figure 21: 7.2.4 – PER vs Noise PSD (dBm/Hz)
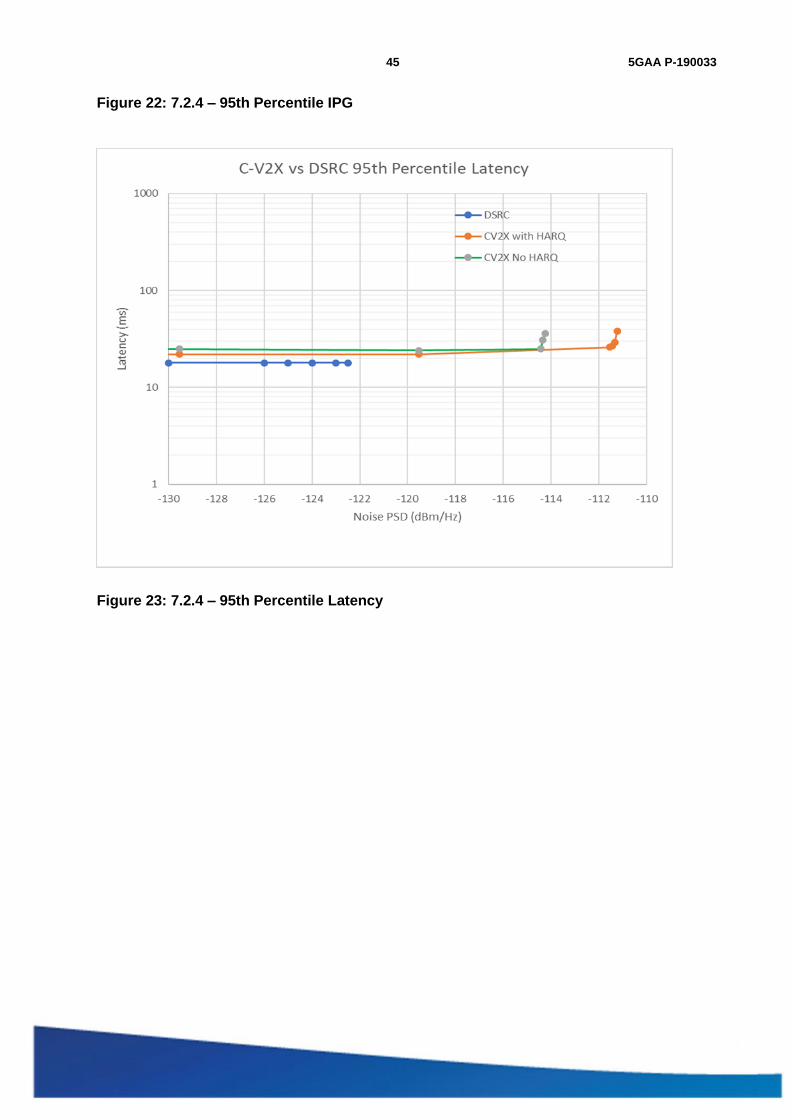
45 5GAA P-190033
5GAA
Figure 22: 7.2.4 – 95th Percentile IPG
Figure 23: 7.2.4 – 95th Percentile Latency
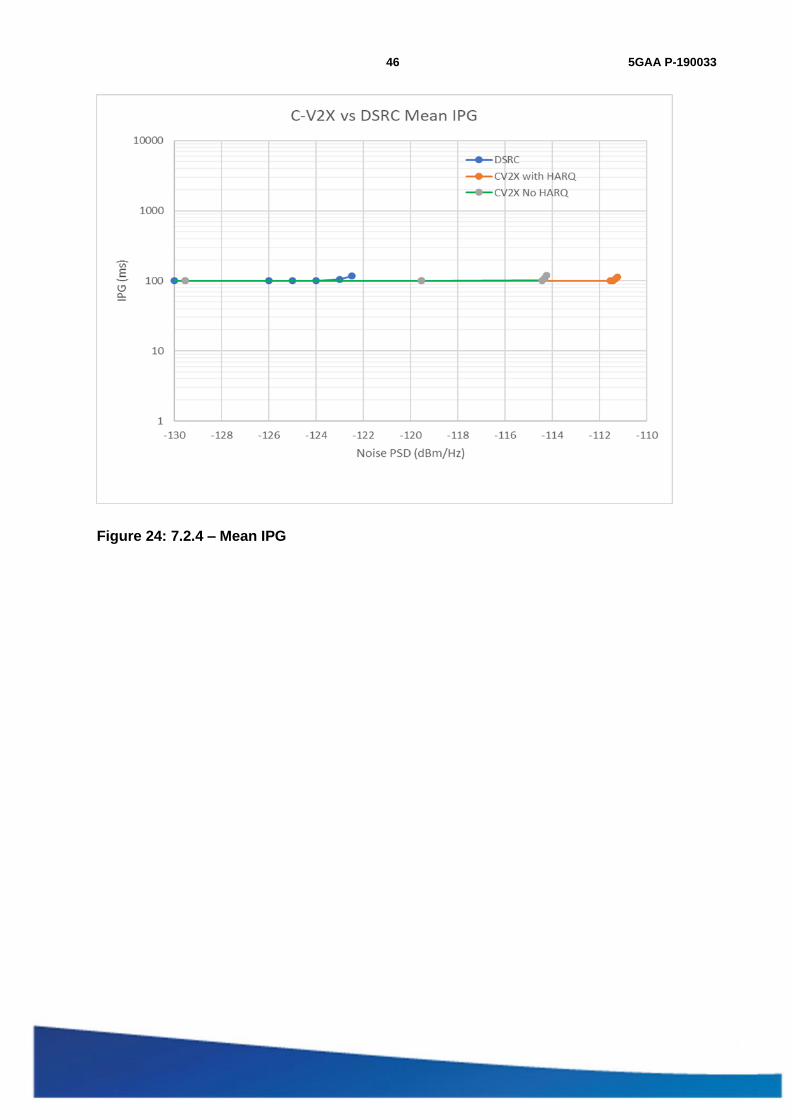
46 5GAA P-190033
5GAA
Figure 24: 7.2.4 – Mean IPG

47 5GAA P-190033
5GAA
Figure 25: 7.2.4 - Mean Latency
7.2.4.7 Evaluation Criteria Evaluation criteria assess the performance across the noise power range.
7.2.4.8 Key Takeaway This test examined and compared the communication reliability of V2X technologies at varying levels of added channel noise. The test emulates deployments with other users in the environment, either within communication range or outside of it. These other users produce over-the-air background noise. This configuration complements Section 7.2.3 where path loss is modelled without added channel noise.
The results show a significant reliability advantage of C-V2X over DSRC. The difference in the AWGN curves is due to the difference between technologies; C-V2X transmits for much longer and spends more energy per information bit, but uses a much smaller bandwidth. This leads to a higher link budget for C-V2X. We note that this also means that the information bit rate is slower for C-V2X.
Together with Section 7.2.3, this section establishes that C-V2X has superior performance over DSRC in the presence of path loss and channel noise.
Again, this performance advantage is expected to translate into meaningful improvements for V2X safety applications. Communication range will be improved. More importantly, coverage dead spots created by obstructions such as buildings, other vehicles, foliage, etc., can be significantly mitigated with C-V2X. Non-line-of-sight (NLOS) conditions created by obstructions are the most relevant scenarios for V2X technologies as existing sensing techniques such as LiDAR or radar do not work well under NLOS conditions.
48 5GAA P-190033
5GAA
7.3 Interference Lab Tests Adjacent/Non-Adjacent Channel Interference Lab Test
The following test cases were performed.
- Intra-System Interference Testing
- Hidden Node Scenario (Section 7.3.1)
- Interference caused by Near-Far Effect (Section 7.3.2)
The procedures are described as C-V2X test procedures; however, it is straightforward to convert them to another V2X point-to-point radio technology (e.g., IEEE 802.11p).
7.3.1 Hidden Node Scenario
7.3.1.1 Background This test assesses the performance of a V2X device during a resource collision scenario (hidden node phenomenon). The hidden node scenario is reproducible in a highly congested environment, for example, OBUs located at opposite edges of one OBU’s communication range. Those transmitter devices cannot sense each other and can transmit on the same subframe to the OBU in the middle which produces a collision at the latter device.
7.3.1.2 Assumptions Lab setup with cabled or over-the-air RF environment: The test case is specified with a cabled environment in Section 7.3.1.3, but it can also be adapted to an RF laboratory environment.
The operating system time of all the transmitter and receiver boxes is synchronized to a common clock (e.g., GPS) with an error of no more than 1 ms.
All devices operate in the same channel (e.g., 172).
49 5GAA P-190033
5GAA
7.3.1.3 Setup Two different configurations run the hidden node test scenario.
Configuration 1 – Without congesting devices
We consider three devices (DUT1, DUT2, DUT3) in the setup in Figure 26.
- Settings on Device 1 (DUT1):
- SPS-based transmit flow with a periodicity of 100 ms
- Transmit with bandwidth of 10 MHz.
- Settings on Device 2 (DUT2):
- SPS-based transmit flow with a periodicity of 100 ms (NOTE: equivalent to setting a periodic stream at 100 ms period for other technologies).
- Transmit with bandwidth of 10 MHz.
DUT1 and DUT2 are isolated from each other such that both the transmit devices (DUT1 and DUT2) are unable to decode each other’s transmissions.
- Settings on Device 3 (DUT3):
- Configured to receive on ITS band of 10 MHz
- All measurements of receiving side performance are done on this device.
- Variable attenuators VA1, VA2 are set to 50 dB attenuation.
- Data Collection at DUT1:
- OS timestamp for each transmitted packet
- Sequence number of each transmitted packet
- Data Collection at DUT2:
- OS timestamp for each transmitted packet
- Sequence number of each transmitted packet
- Data Collection at DUT3:
- OS timestamp for each received packet
- Sequence number of each received packet

50 5GAA P-190033
5GAA
*1x2 and 2x1 above are splitter/combiners and VA is the variable attenuator
Figure 26: Hidden Node Scenario Test Setup (Configuration 1 – Without congesting devices)
Table 19: Test Configuration
Configuration C-V2X DSRC
Number of Samples 6000 6000
Blind HARQ Enabled NA

51 5GAA P-190033
5GAA

52 5GAA P-190033
5GAA
Configuration 2 – With congesting devices
We consider five devices (DUT1, DUT2, DUT3, two Congesting Devices) in the setup in Figure 17.
- Settings on Device 1 (DUT1):
- SPS-based transmit flow with a periodicity of 100 ms.
- Transmit on Channel 172 with bandwidth of 10 Mhz.
- Settings on Device 2 (DUT2):
- SPS-based transmit flow with a periodicity of 100 ms (NOTE: equivalent to setting a periodic stream at 100 ms period for other technologies).
- Transmit on Channel 172 with bandwidth of 10 Mhz.
- DUT1 and DUT2 are isolated from each other such that both the transmit devices (DUT1 and DUT2) are unable to decode each other’s transmissions.
- Settings on Device 3 (DUT3):
- Configured to receive transmissions on Channel 172.
- All measurements of receiving side performance are done on this device.
- Settings on Device: Congesting Device 1, Congesting Device 2:
- C-V2X configuration:
- Configured to continuously transmit on Channel 172 with bandwidth of 10 MHz to achieve desired CBR.
- Each device is configured to achieve ~ 80% CBR.
- DSRC configuration:
- Configured to continuously transmit on Channel 172, a fixed-packet size to achieve the desired congestion level.
- Each device is configured to create ~ 80% CBR.
- On C-V2X Transmit devices DUT1 and DUT2, Blind HARQ is disabled (because DUT1 and DUT2 will observe congestion).
- Variable attenuators VA1, VA2, VA3 and VA4 are set to 50 dB attenuation.
- Data Collection at DUT1:
- OS timestamp for each transmitted packet
- Sequence number of each transmitted packet
- Data Collection at DUT2:
- OS timestamp for each transmitted packet
- Sequence number of each transmitted packet
- Data Collection at DUT3:
- OS timestamp for each received packet
- Sequence number of each received packet

53 5GAA P-190033
5GAA
*1x2 and 2x1 above are splitter/combiners and VA is the variable attenuator
Figure 27: Hidden Node Scenario Test Setup (Configuration 2 – With congesting devices)
54 5GAA P-190033
5GAA
Table 20: Test Configuration
Configuration C-V2X DSRC
Number of Samples 6000 6000
Blind HARQ Disabled NA
7.3.1.4 Test Execution 1. Transmit power of Device 1 and Device 2 remains constant at 21 dBm throughout the test.
2. Set the attenuator value to 50 dB between Device 1 (DUT1) and Device 3 (DUT3) and 50 dB between Device 2 (DUT2) and Device 3 (DUT3).
3. Calculate the insertion loss between Device 2 (DUT2) and Device 3 (DUT3) and Device 1 (DUT1) and Device 3 (DUT3). This value is the fixed insertion loss of the cables/attenuator/combiner setup for these devices.
4. After setting the attenuator to these values, ensure that transmissions from Device 1(DUT1) and Device 2 (DUT2) are isolated such that they cannot decode each other’s transmissions.
5. For Configuration2 (with congesting devices), turn on congesting devices and check the average CBR/CBP at Tx devices.
6. Turn on Device 3.
7. Record these statistics on all the C-V2X devices for a period of 10 minutes:
- Device 1 and Device 2:
- OS timestamp for each Tx packet
- Sequence number of each Tx packet
- Device 3:
- OS timestamp for each Rx packet
- Sequence number of each Rx packet
- Receive signal power for each Rx packet
8. Repeat step 7 for a total of 10 executions.

55 5GAA P-190033
5GAA
7.3.1.5 Required Documentation
Table 21: C-V2X Results with Configuration 1 (no congesting device)
Execution #
No. of Transmitted pkts No. of Received pkts PER % Calculated at Receiver (Device 3)
(total for the 10 min test) (total for the 10-min test)
Transmit Device 1
Transmit Device 2
Received at Device 3 from Device 1
Received at Device 3 from Device 2
For Packets from Device 1
For Packets from Device 2
1 6000 6000 5992 5966 0.13 0.57 2 6000 6000 6000 5999 0.00 0.02
3 6000 6000 5999 5989 0.02 0.18 4 6000 6000 6000 6000 0.00 0.00
5 6000 6000 5993 5992 0.12 0.13
6 6000 6000 5998 5978 0.03 0.37 7 6000 6000 6000 6000 0.00 0.00 8 6000 6000 6000 5998 0.00 0.03
9 6000 6000 5999 5999 0.02 0.02
10 6000 6000 5998 5991 0.03 0.15
Measured Insertion Loss, Device 1 to Device 3 (dB)
37 Attenuator 1 Value (dB)
50
Measured Insertion Loss, Device 2 to Device 3 (dB)
37 Attenuator 2 Value (dB)
50
Table 22: DSRC Results with Configuration 1 (no congesting device)
Execution #
No. of Transmitted pkts No. of Received pkts PER % Calculated at Receiver (Device 3)
(total for the 10 min test) (total for the 10-min test)
Transmit Device 1
Transmit Device 2
Received at Device 3 from Device 1
Received at Device 3 from Device 2
For Packets from Device 1
For Packets from Device 2
1 6000 6000 5999 5998 0.02 0.03
2 6000 6000 5995 5994 0.08 0.10 3 6000 6000 6000 6000 0.00 0.00
4 6000 6000 5998 5999 0.03 0.02 5 6000 6000 6000 5999 0.00 0.02
6 6000 6000 5998 5999 0.03 0.02 7 6000 6000 5996 5997 0.07 0.05
8 6000 6000 6000 6000 0.00 0.00
9 6000 6000 5999 6000 0.02 0.00
10 6000 6000 6000 6000 0.00 0.00 Measured Insertion Loss, Device 1 to Device 3 (dB)
37 Attenuator 1 Value (dB)
50
56 5GAA P-190033
5GAA
Measured Insertion Loss, Device 2 to Device 3 (dB)
37 Attenuator 2 Value (dB)
50

57 5GAA P-190033
5GAA
Table 23: C-V2X Results with Configuration 2 (with congesting devices)
Execution #
No. of Transmitted pkts No. of Received pkts PER % Calculated at Receiver (Device 3)
(total for the 10 min test) (total for the 10-min test)
Transmit Device 1
Transmit Device 2
Received at Device 3 from Device 1
Received at Device 3 from Device 2
For Packets from Device 1
For Packets from Device 2
1 6000 6000 6000 6000 0 0 2 6000 6000 6000 6000 0 0
3 6000 6000 5971 5994 0.48 0.1
4 6000 6000 5848 5871 2.53 2.15
5 6000 6000 5995 5992 0.08 0.13
6 6000 6000 5994 6000 0.1 0 7 6000 6000 5981 5966 0.32 0.57 8 6000 6000 6000 6000 0 0
9 6000 6000 5937 5955 1.05 0.75
10 6000 6000 5848 5911 2.53 1.48
Measured Insertion Loss, Device 1 to Device 3 (dB)
37 Attenuator 1 Value (dB)
50
Measured Insertion Loss, Device 2 to Device 3 (dB)
37 Attenuator 2 Value (dB)
50
Table 24: DSRC Results with Configuration 2 (with congesting devices)
Execution #
No. of Transmitted pkts No. of Received pkts PER % Calculated at Receiver (Device 3)
(total for the 10 min test) (total for the 10-min test)
Transmit Device 1
Transmit Device 2
Received at Device 3 from Device 1
Received at Device 3 from Device 2
For Packets from Device 1
For Packets from Device 2
1 6000 6000 5996 5997 0.07 0.05
2 6000 6000 6000 6000 0.00 0.00 3 6000 6000 5542 5552 7.63 7.47
4 6000 6000 5894 5897 1.77 1.72 5 6000 6000 6000 6000 0.00 0.00
6 6000 6000 5996 5995 0.07 0.08
7 6000 6000 6000 6000 0.00 0.00 8 6000 6000 5939 5941 1.02 0.98
9 6000 6000 5999 6000 0.02 0.00
10 6000 6000 5999 6000 0.02 0.00
Measured Insertion Loss, Device 1 to Device 3 (dB)
37 Attenuator 1 Value (dB)
50
Measured Insertion Loss, Device 2 to Device 3 (dB)
37 Attenuator 2 Value (dB)
50

58 5GAA P-190033
5GAA
7.3.1.6 Evaluation Criteria Evaluation criteria assesses the performance in a collision-challenged environment through assessment of colliding TTIs and RBs.
7.3.1.7 Key Takeaways This section examines and compares the robustness of V2X technologies for the hidden node scenario. In this scenario, two transmitters target the same receiver, but are out of communication range of each other. Because the two transmitters are unaware of each other, the scheduling algorithm cannot effectively avoid mutual collision.
We tested two scenarios. The scenario with no congesting devices models a lightly loaded deployment with no other users around. In this case, we observed that C-V2X and DSRC communications stayed robust with lower than 1% PER.
In the scenario with congesting devices, congestion is added to the system to reduce the number of available resources and to increase the probability of collision. This is achieved by connecting separate congesting device to each of the two transmitters. The emulated scenario calls for each transmitter being congested by its own cluster of local users.
In the scenario with congesting devices, we observe that the link stayed relatively reliable for both technologies. The PER is less than 10% across runs for both technologies.
Because communication is independent between the two transmitters, there is inherent variability in the test results from one run to another. Depending on how the timing of traffic processes align for a particular run, the transmissions can be more or less prone to collisions. In the second scenario, independent traffic processes from the two congesting devices also contribute to run-to-run variability. Indeed, inspection of the 7% PER for DSRC from Table 24 confirms that for this run, the timing of the two transmissions happens to align more than for other runs.
7.3.2 Near-Far Effect
7.3.2.1 Background This test assesses the performance of C-V2X devices in the scenario where a device receives a signal from two or more transmitters with different power levels in adjacent subchannels. The power difference can occur even for two nearby transmitters, when one of them is obstructed.
This test applies only for C-V2X technology as DSRC transmissions occupy all the frequency resources within allocated bandwidth.
7.3.2.2 Assumptions Lab setup with cabled or over-the-air RF environment: The test case is specified with a cabled environment in Section 7.3.2.3, but it can also be adapted to an RF laboratory environment.
The operating system time of all the transmitter and receiver boxes is synchronized to a common clock (e.g., GPS) with an error of no more than 1 ms.
All devices operate in the same channel (e.g., 172).
7.3.2.3 Setup Three C-V2X devices (DUT1, DUT2, DUT3) are included in the setup in Figure 28.
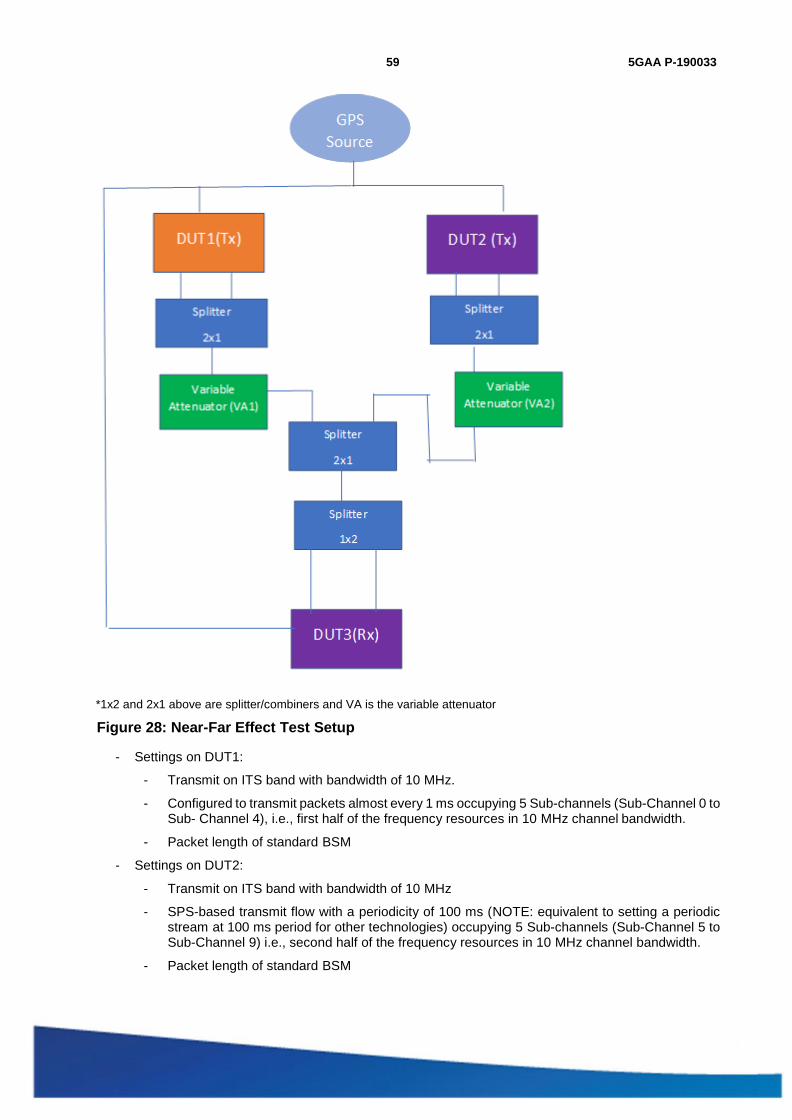
59 5GAA P-190033
5GAA
*1x2 and 2x1 above are splitter/combiners and VA is the variable attenuator
Figure 28: Near-Far Effect Test Setup
- Settings on DUT1:
- Transmit on ITS band with bandwidth of 10 MHz.
- Configured to transmit packets almost every 1 ms occupying 5 Sub-channels (Sub-Channel 0 to Sub- Channel 4), i.e., first half of the frequency resources in 10 MHz channel bandwidth.
- Packet length of standard BSM
- Settings on DUT2:
- Transmit on ITS band with bandwidth of 10 MHz
- SPS-based transmit flow with a periodicity of 100 ms (NOTE: equivalent to setting a periodic stream at 100 ms period for other technologies) occupying 5 Sub-channels (Sub-Channel 5 to Sub-Channel 9) i.e., second half of the frequency resources in 10 MHz channel bandwidth.
- Packet length of standard BSM
60 5GAA P-190033
5GAA
- Settings on DUT3:
- Configured to receive on ITS band (e.g., center frequency 5,860 MHz) with bandwidth of 10 MHz
- All measurements of receiving side performance are done on this device.
- Data Collection at DUT1
- OS timestamp for each transmitted packet
- Sequence number of each transmitted packet
- Data Collection at DUT2
- OS timestamp for each transmitted packet
- Sequence number of each transmitted packet
- Data Collection at DUT3
- OS timestamp for each received packet
- Sequence number of each received packet
- Receive signal power for each received packet
Table 25: Test Configuration
Configuration C-V2X
Blind HARQ Disabled
Number of Samples 6000
NOTE: For an equivalent test for 3GPP for near-far effect, please see 3GPP Rel 14 TS 36.101, chapter 14.4.
7.3.2.4 Test Execution 1. Turn off Device 2 (DUT2).
2. Adjust the attenuator between Device 1 (DUT1) and Device 3 (DUT3) such that received power is -50 dBm at DUT3. Record this attenuator setting.
3. Turn off Device 1 (DUT1).
4. Turn on Device 2 (DUT2) and set the attenuation at Device 2 (DUT2) such that the input power at Device 3 (DUT3) is -50 dBm.
5. Turn on Device 1 (DUT1) and set the attenuator to the value determined in Step 2. This attenuator value is set constant throughout the test.
6. Record the data as mentioned below on all the devices:
o Device 1 (DUT1) and Device 2 (DUT2):
OS timestamp for each Tx packet
Sequence number of each Tx packet
o Device 3 (DUT3)
OS timestamp for each Rx packet
Sequence number of each Rx packet
Receive signal power for each Rx packet

61 5GAA P-190033
5GAA
7. At Device 3 (DUT3), calculate the PER for packets sent by Device 1 (DUT1), as well as the PER for packets sent by Device 2 (DUT2).
8. Increase the attenuation on the Variable Attenuator between DUT2 and DUT3 by a certain increment.
a. In the first few iterations, use 10 dB as the increment.
b. In later iterations, as the PER approaches 100%, use one dB as the increment.
9. Repeat step 8 until the PER for packets sent by Device 2 reaches 100%
7.3.2.5 Required Documentation Table 26 is based on the data collected from log files.
Table 26: C-V2X Near-Far Effect Results
Attenuator Value (dB)
Rx power delta* at Device 3 (dB)
No. of Transmitted pkts No. of Received pkts PER % Calculated at Receiver (Device 3)
(total for the 10 min test) (total for the 10-min test)
Transmit Device 1
Transmit Device 2
Received at Device 3 from Device 1
Received at Device 3 from Device 2
For Packets from Device 1
For Packets from Device 2
39 0 6000 6000 6000 6000 0 0
49 10 6000 6000 6000 6000 0 0
59 20 6000 6000 6000 6000 0 0
69 30 6000 6000 6000 6000 0 0
71 32 6000 6000 6000 6000 0 0
72 33 6000 6000 6000 5996 0 0.07
73 34 6000 6000 6000 5918 0 1.37
74 35 6000 6000 6000 5675 0 5.42
75 36 6000 6000 6000 4475 0 25.42
76 37 6000 6000 6000 2501 0 58.32
77 38 6000 6000 6000 699 0 88.35
78 39 6000 6000 6000 16 0 99.73
Device 1 Tx Power (dBm) 21 dBm
Device 2 Tx Power (dBm) 21 dBm
* Rx power difference at Device 3 (Receiving Device), between transmissions received from Device 1 and Device 2 (which are transmitting devices).
NOTE: Table 26 captures Tx packets from DUT1 and DUT2 that are sent in the same subframe. Measured insertion loss from DUT1 to DUT3, and DUT2 to DUT3 is 32 dB. Total Pathloss = Attenuation + Insertion loss.

62 5GAA P-190033
5GAA
7.3.2.6 Evaluation Criteria Evaluation criteria assesses the performance in terms of PER during near-far scenario through assessment of colliding TTIs and adjacent RBs.
7.3.2.7 Key Takeaways One of the key features of C-V2X is frequency division multiplexing (FDM). However, because of the potential for transmissions on adjacent subchannels, FDM can lead to the near-far effect. The impact of the near-far effect though is limited by the minimum in-band emissions requirements defined in 3GPP specifications. The data from the near-far test showed that the average leakage of device under test ~ -35 dB meets the minimum requirements specified in 3GPP Rel 14 TS 36.101 Section 6.5.2G.3.
7.4 Congestion Tests
7.4.1 Congestion Control Lab Test The following lab tests are conducted to assess performance of the V2X systems in a radio-congested environment (all cases listed here are V2V without network infrastructure coverage):
- Section 7.4.1: V2V congestion control in lab environment: regular BSM broadcast
- Section 7.4.2: V2V congestion control in lab environment: critical BSM broadcast
Carefully designed, cabled-up lab testbeds produce repeatable and reproducible results. As a result, they provide a controlled and stable platform for comparing technologies and algorithms. Unlike an over-the-air testbed that produces results that vary over time, performance comparisons obtained from cabled-up testbeds are precise.
CBR is a metric that tracks the Channel Utilization in C-V2X. It is defined as mentioned in 3GPP specification TS 36.214 section 5.1.30.
Definition Channel busy ratio (CBR) measured in subframe n is defined as follows: - For PSSCH, the portion of sub-channels in the resource pool whose S-RSSI measured by the
UE exceed a (pre-)configured threshold sensed over subframes [n-100, n-1]; - For PSCCH, in a pool (pre)configured such that PSCCH may be transmitted with its
corresponding PSSCH in non-adjacent resource blocks, the portion of the resources of the PSCCH pool whose S-RSSI measured by the UE exceed a (pre-)configured threshold sensed over subframes [n-100, n-1], assuming that the PSCCH pool is composed of resources with a size of two consecutive PRB pairs in the frequency domain.
The congestion control lab setup evaluates the performance of speeding cars in the carpool lane of a traffic- jammed highway.
7.4.1.1 V2V Congestion Control in Lab Environment – Regular BSM Broadcast
7.4.1.1.1 Background This test verifies that V2V (LTE C-V2X Mode 4) devices can transmit and receive BSM messages in a congestion-challenged channel. C-V2X devices communicate over the PC5 interface without cellular network assistance (out-of-coverage, Mode 4). The devices implement the congestion control algorithm inspired by SAE J2945/1. 3GPP congestion control was turned off for this test. This is a standalone C-V2X test and only C-V2X results are presented.

63 5GAA P-190033
5GAA
Goals
- Execute a BSM transmission and reception test between DUT1 and DUT2 in a congestion- challenged environment.
- Measure KPIs including PER, Latency, and IPG for transmission and reception between DUT 1 and DUT 2.
- Compare the CDF of PER and CBR generated from the lab Setup with the System-Level Simulation and verify a match.
To achieve these goals, we consider the challenging scenario of speeding cars on the carpool lane of a traffic- jammed highway. This test is based on the CAMP scenario described in [NHTSA-2015-0060] where the devices under test move on a 1200-meter stretch of highway in the carpool lanes, while the devices creating the congestion are stationary on both sides of the carpool lanes. In the CAMP setup and with 5x emulation by the test devices, the congesting test devices emulate columns of 10 cars on each side of the carpool lanes where the columns are separated by 12.5 meters and the lane width is 3.6 meters. This scenario repeats the setup for the congesting devices.
Compared to the original CAMP setup, the following changes were made to adapt the test to the lab environment:
1. Two stationary DUT devices: The two devices under test are stationary in the middle of the 1200-meter stretch of highway, but they still transmit periodically every 100 ms as in the original scenario. The stationarity assumption simplifies the lab setup emulating this scenario while placing the devices under test in the location where maximum interference is occurring.
2. AWGN channel: The main source of error is interference from the congesting devices and thus modeling AWGN is not necessary.
3. Reduced set of emulated congesting devices: The main contributors to interference are the closest 576 cars that are traffic-jammed on the highway. This number was determined by conducting simulations of a larger number of interfering devices spread over the full 1200-meter stretch of highway (1940 cars) and then repeating the simulations with an increasingly smaller number of interfering cars to determine the smallest number of congesting devices for which the performance of the DUTs remains unchanged. Figure 29 shows the congestion scenario:
a. DUT 1, shown in red, is the host vehicle. It is stationary in the test environment but transmits at the maximum frequency of once every 100 ms due to its higher speed in the emulated scenario.
b. DUT 2, shown in grey on the central lanes, is the remote vehicle. Similarly, to DUT1, it transmits at the maximum frequency of once every 100 ms.
c. The 576 interfering cars are also stationary in columns that are spaced 12.5 meters from each other. Within a column, 10 cars are spaced by the lane width of 3.6 meters on each of the upper and the lower sides of the carpool lanes.

64 5GAA P-190033
5GAA
Figure 29: Emulated Congestion Scenario
4. 12-to-1 emulation ratio was produced for the lab reference devices: the 576 interfering devices are emulated in the lab environment using 48 lab reference devices. The next section explains how the 12- to-1 ratio is achieved.
5. Path loss model from 3GPP TR 36.885: The path loss model is the freeway scenario mentioned in 3GPP TR 36.885 Section A.1.4. It specifies the model of LOS in WINNER+B1. Pathloss at 3m is used if distance is less than 3m.
NOTE: This test exercises the congestion control feature on the devices in the lab setup. Without congestion control, all devices would transmit a BSM every 100 ms. Each of the 48 reference devices generates two SPS transmissions occupying four subframes every 100 ms (one transmission and one retransmission per SPS, each using 50 out of 50 RBs per subframe). Given that all the devices are within communication range, this setup would produce a load of (48*4)/100 = 192%, almost twice what the channel bandwidth can support. Without congestion control, the system would fail to support every user in the system and result in large packet drops due to the high load.
7.4.1.1.2 Assumptions For C-V2X, the devices should be pre-configured as mentioned in Section 7.4.1.1.3.
The operating system time of all devices is synchronized to a common clock (e.g., GPS) with an error of no more than 1 ms. This requirement ensures that end-to-end latency between the transmitter and receiver can be measured with an accuracy of 2 ms. (This requirement does not relate to the requirement of the PHY layer synchronization.)

65 5GAA P-190033
5GAA
7.4.1.1.3 Setup Fully cabled setup, using RF cables and arrays of splitters and combiners to connect all required devices, is used to construct this setup. A cabled environment is more controlled and repeatable.
Table 27: Test Configuration
Configuration C-V2X
Channel 5890 MHz (Channel 178)
NOTE: The following describes the cabled lab setup:
In this setup, multiple reference devices are used (sometimes referred to as “REF”), and their purpose is to generate the traffic that will provide the congested environment. In addition, two devices under test (DUT) are used, referred to as DUT1 and DUT2.
In this setup:
- All devices will be cabled up and connected via splitters and combiners.
- Adequate insulation is required to prevent leakages.
- The setup needs to use splitters/combiners that satisfy the requirements in the frequency range of C- V2X operation.
To control the experiment, use either or both of these:
- External PC/laptop units
- Connection of the modules/devices by wired LAN or 2.4 GHz Wi-Fi to centrally controlled equipment Figure 30 is a diagrammatic description of the setup. Notes for reading the diagram:
- The devices labelled “UE” are reference devices [Congesting Devices].
- “VA” stands for “variable attenuator.”
- DUT1 and DUT2 are shown as “HV” and “RV,” respectively.
- N=2, so every two REF devices are grouped in terms of the path loss toward the DUT1 and DUT2.
- The diagram is a representative illustration of the lab setup.
66 5GAA P-190033
5GAA
Figure 30: Representative Lab Setup (HV is DUT1 and RV is DUT2)
Detailed Diagram Description
1. The Test setup is constructed keeping in mind that each device needs to hear the others, while offering pathloss control for specific device groups with other device groups.
2. The Reference Devices are shown on the left, grouped in pairs.
3. HV-RV are on the right talking to each other via a separate path connected via a fixed and a variable attenuator.
4. The Blue Line Connector connects all the reference devices to HV, and path losses between them are tuned (via variable attenuator) per the simulation.
5. The Yellow Line Connector connects all the reference devices to RV, and path losses between them are tuned (via variable attenuator) per the simulation.
6. The two separate paths are required because path losses between HV-Reference Devices and RV- Reference Devices are different.
7. The Reference Devices are connected to each other with the Red Connector path. The Variable attenuator for that link is set to ‘0’ as pathloss between reference devices does not impact the result of metrics collected at DUT1(HV) and DUT2(RV).
8. HV-RV are connected with the Green Connector path and have a fixed attenuator of 95 dB and a variable attenuator that applies values per the test requirement.
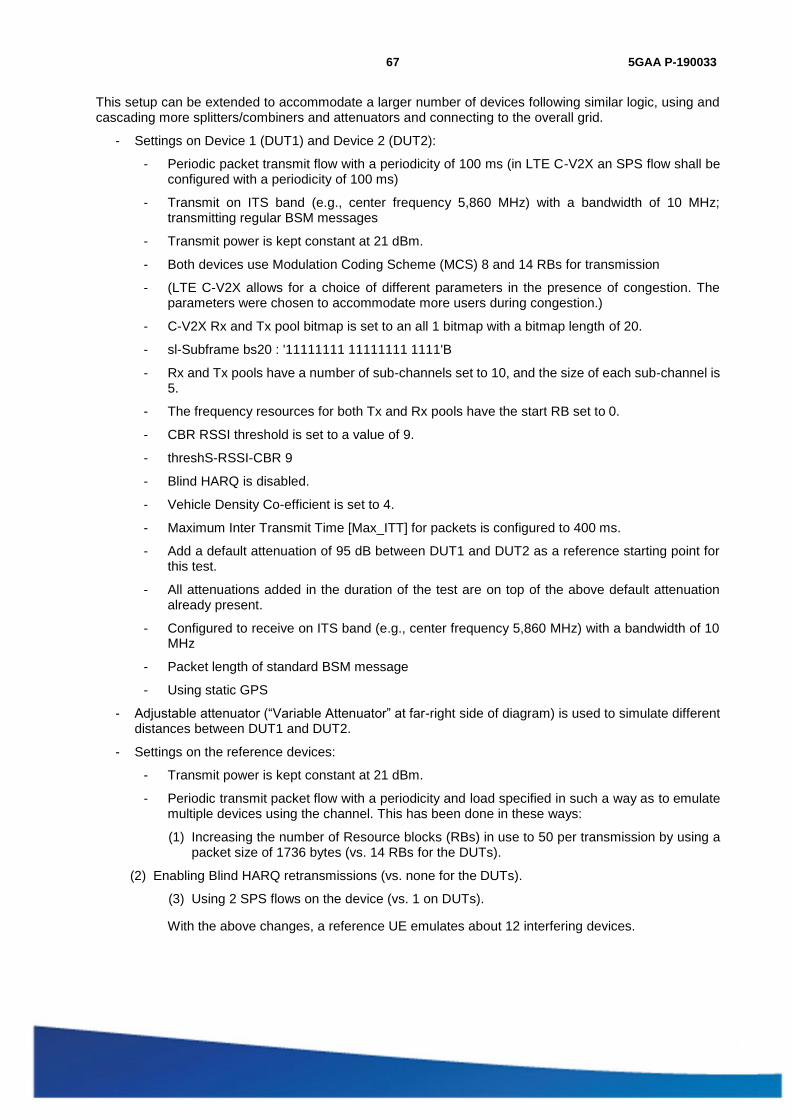
67 5GAA P-190033
5GAA
This setup can be extended to accommodate a larger number of devices following similar logic, using and cascading more splitters/combiners and attenuators and connecting to the overall grid.
- Settings on Device 1 (DUT1) and Device 2 (DUT2):
- Periodic packet transmit flow with a periodicity of 100 ms (in LTE C-V2X an SPS flow shall be configured with a periodicity of 100 ms)
- Transmit on ITS band (e.g., center frequency 5,860 MHz) with a bandwidth of 10 MHz; transmitting regular BSM messages
- Transmit power is kept constant at 21 dBm.
- Both devices use Modulation Coding Scheme (MCS) 8 and 14 RBs for transmission
- (LTE C-V2X allows for a choice of different parameters in the presence of congestion. The parameters were chosen to accommodate more users during congestion.)
- C-V2X Rx and Tx pool bitmap is set to an all 1 bitmap with a bitmap length of 20.
- sl-Subframe bs20 : '11111111 11111111 1111'B
- Rx and Tx pools have a number of sub-channels set to 10, and the size of each sub-channel is 5.
- The frequency resources for both Tx and Rx pools have the start RB set to 0.
- CBR RSSI threshold is set to a value of 9.
- threshS-RSSI-CBR 9
- Blind HARQ is disabled.
- Vehicle Density Co-efficient is set to 4.
- Maximum Inter Transmit Time [Max_ITT] for packets is configured to 400 ms.
- Add a default attenuation of 95 dB between DUT1 and DUT2 as a reference starting point for this test.
- All attenuations added in the duration of the test are on top of the above default attenuation already present.
- Configured to receive on ITS band (e.g., center frequency 5,860 MHz) with a bandwidth of 10 MHz
- Packet length of standard BSM message
- Using static GPS
- Adjustable attenuator (“Variable Attenuator” at far-right side of diagram) is used to simulate different distances between DUT1 and DUT2.
- Settings on the reference devices:
- Transmit power is kept constant at 21 dBm.
- Periodic transmit packet flow with a periodicity and load specified in such a way as to emulate multiple devices using the channel. This has been done in these ways:
(1) Increasing the number of Resource blocks (RBs) in use to 50 per transmission by using a packet size of 1736 bytes (vs. 14 RBs for the DUTs).
(2) Enabling Blind HARQ retransmissions (vs. none for the DUTs).
(3) Using 2 SPS flows on the device (vs. 1 on DUTs).
With the above changes, a reference UE emulates about 12 interfering devices.

68 5GAA P-190033
5GAA
- C-V2X Rx and Tx pool bitmap is set to an all 1 bitmap with a bitmap length of 20.
- sl-Subframe bs20 : '11111111 11111111 1111'B
- Rx and Tx Pools have number of Sub-Channels set to 10, with size of each sub-channel being 5.
- The Frequency resources for both Tx and Rx Pools have the start RB set to 0.
- CBR RSSI threshold is set to a value of 15.
- thresS-RSSI-CBR 15
- Given the above 12-to-1 emulation ratio, the position of the REF devices is shown in Figure 31:
- Simulated devices are shown as light blue stars.
- REF devices are shown as red stars. These devices are labeled from 1 to 24 and then 1’ to 24’. Devices x and x’ have the same path loss toward the DUT1 and DUT2 in the lab setup due to the grouping highlighted above (N=2).
Figure 31: REF Device Locations
- The variable attenuators (in cabled RF setup) are set depending on the following:
- The number of “real” devices each REF device emulates; (since a reference device emulates three equivalent “real” devices within each transmission, the attenuation from this device to each DUT should be divided by 3 to account for the reduced power per resource block in the lab scenario).
- The real-world “distance” to be emulated between the specific REF device and the DUTs.
- The attenuation between the REF devices is set to a fixed value corresponding to the average distance between the REF devices. In the default setup, the path loss between any two REF devices is 103 dB.
NOTE: The set of attenuators discussed here excludes the “Variable Attenuator” shown at the far-right side of diagram.
- Table 28 lists the positions and attenuations used in the default test setup.

69 5GAA P-190033
5GAA
Table 28: Default Test Setup Positions and Attenuations
Device X-Pos Y-Pos Pathloss to DUT2 Pathloss to DUT1
DUT2 675 0 N/A 95.1 DUT1 600 0 95.1 N/A 1 575 8.7 95.15 72.01 1' 575 8.7 95.15 72.01 2 600 8.7 90.19 58.89 2' 600 8.7 90.19 58.89 3 625 8.7 83.31 72.01 3' 625 8.7 83.31 72.01 4 581.25 29.7 94.78 76.89 4' 581.25 29.7 94.78 76.89 5 618.75 29.7 87.21 76.89 5' 618.75 29.7 87.21 76.89 6 650 8.7 72.01 83.31 6' 650 8.7 72.01 83.31 7 675 8.7 58.89 90.19 7' 675 8.7 58.89 90.19 8 700 8.7 72.01 95.15 8' 700 8.7 72.01 95.15 9 656.25 29.7 76.89 87.21 9' 656.25 29.7 76.89 87.21 10 693.75 29.7 76.89 94.78 10' 693.75 29.7 76.89 94.78 11 550 8.7 98.99 83.31 11' 550 8.7 98.99 83.31 12 525 8.7 102.16 90.19 12' 525 8.7 102.16 90.19 13 500 8.7 104.82 95.15 13' 500 8.7 104.82 95.15 14 543.75 29.7 100.24 87.21 14' 543.75 29.7 100.24 87.21 15 506.25 29.7 104.43 94.78 15' 506.25 29.7 104.43 94.78 16 725 8.7 83.31 98.99 16' 725 8.7 83.31 98.99 17 750 8.7 90.19 102.16 17' 750 8.7 90.19 102.16 18 775 8.7 95.15 104.82 18' 775 8.7 95.15 104.82 19 731.25 29.7 87.21 100.24 19' 731.25 29.7 87.21 100.24 20 768.75 29.7 94.78 104.43 20' 768.75 29.7 94.78 104.43 21 475 8.7 107.14 98.99 21' 475 8.7 107.14 98.99 22 450 8.7 109.18 102.16 22' 450 8.7 109.18 102.16 23 425 8.7 111.01 104.82 23' 425 8.7 111.01 104.82 24 468.75 29.7 107.83 100.24 24' 468.75 29.7 107.83 100.24
70 5GAA P-190033
5GAA
- Transmit on ITS band (e.g., center frequency 5,860 MHz) with bandwidth of 10 MHz; transmitting regular BSM messages
- Generation of BSM content shall not be synchronized, i.e., each reference device generates its content at a different (random) point in time to avoid synchronization of transmission behavior
- Transmit power is kept constant at 21 dBm.
- Configured to receive on ITS band (e.g., center frequency 5,860 MHz) with a bandwidth of 10 MHz
- Packet length of standard BSM message (unless the choice is made to vary the packet size as described in earlier bullet)
- Using static GPS
- SAE congestion control settings:
- Max_ITT of 400 ms. The max_ITT was pushed lower, from the default of 600 ms, to ensure a higher load in the system.
- DensityCoefficient, B, is set to 25/6 ~= 4. Reason: each device transmits two BSMs and emulates 12 devices. Thus, every received BSM emulates six BSMs in the original scenario and the congestion control density coefficient, which has a default value of 25 per specification, should be adjusted accordingly.
- Data Collection at DUT1 and DUT2:
- Timestamp for each transmitted packet
- Timestamp for each received packet
- Receive signal power for each received packet
- All KPIs as listed further in this section
- Data Collection at each reference device:
- Timestamp for each transmitted packet
- All KPIs as listed further in this section
7.4.1.1.4 Test Execution Overview: With the reference devices creating a congested environment, the PER between the DUTs (DUT1 and DUT2) is observed as the “distance” between them is gradually increased by adjusting the attenuation.
Set up the test bed as explained above, where the total number of reference devices is 48 which effectively simulates 576 devices.
1. Add a default attenuation of 95 dB, between DUT1 and DUT2 as a reference starting point for this test
2. The default attenuation of 95 dB was chosen to emulate ~75 m according to simulations as mentioned in Section 7.4.1.1.3.
3. Set “Variable Attenuator” at the far-right side of the diagram to 0 dB to simulate a short distance between the DUTs.
4. Start transmission at all reference devices (regular BSM broadcast).
5. Start transmission at DUT1 and DUT2 (regular BSM broadcast).
6. Record to a log file the statistics and KPIs as defined in this section for DUT1, DUT2, and the reference devices.

71 5GAA P-190033
5GAA
NOTE: Logging/saving of all KPIs shall be done for at least one reference device. Logging/saving is recommended for all reference devices as far as practical for additional analysis.
7. Calculate the PER between the two DUTs at both DUT1 and DUT2.
8. Increase the attenuation at “Variable Attenuator” by 5 dB to simulate an increased distance between the DUTs.
9. Repeat steps 5 through 7 until the overall attenuation reaches 115 dB (near sensitivity level).
10. Set “Variable Attenuator” at the far-right side of the diagram to 0 dB to simulate a short distance between the DUTs.
7.4.1.1.5 Unique Tests to be Conducted Run this test as described in Section 7.4.1.1.4 using two C-V2X DUTs and up to 48 reference devices as explained in Section 7.4.1.1.3. All devices (DUT1, DUT2, reference devices) have congestion control turned on.
7.4.1.1.6 Required Documentation Table 29 summarizes the results based on the data collected from log files.
Table 29: Congestion Control results with regular BSM broadcast
Attenuation value between DUTs (dB)
Number of reference devices
No. of Transmitted pkts
No. of Received pkts
Calculated at Receiver
DUT1 DUT2 DUT1 DUT2
PER % at DUT1
PER % at DUT2
95%ile IPG Value at DUT1
95%ile IPG Value at DUT2
95%ile Latency Value at DUT1
95%ile Latency value at DUT2
95
48
2071 2076 2043 2029 1.6 2.0 105 104 97 102
100 2068 2055 1952 1964 5.0 5.0 108 105 104 101
105 2068 2072 1850 1967 10.7 4.8 105 105 99 97
110 2065 2067 1847 1846 10.6 10.6 212 104 100 90
115 2067 2066 1720 1681 16.7 18.6 214 215 92 102

72 5GAA P-190033
5GAA
Figure 32: CDF of CBR
Figure 33: CDF of PER
60 50 40 30 CBR
20 10
0,3
0,2
0,1
Simulation - 1940 UEs
0,4
Sims - 600 Users - AWGN
0,6
0,5
Lab with CC
0,9
0,8
0,7
CDF of CBR C
DF
0,25 0,3 0,35 0,4 0,2
PER
0,05 0,1 0,15
0,00%
Lab PER CDF
Simulation 600 UEs
Simulation 1940 UEs
90,00%
80,00%
70,00%
60,00%
50,00%
40,00%
30,00%
RV PER CDF
CD
F
73 5GAA P-190033
5GAA
7.4.1.1.7 Evaluation Criteria Evaluation criteria assesses the performance of V2X in a highly congested environment, including the performance of the distributed congestion control mechanism implemented on the device under test under different values of CBR. For CBR implementation details see: J2945-1.
Verify that lab data at the 75-m distance point (95 dB Attenuation) matches the SIM data for the CDF of CBR and the CDF of PER. A satisfactory match for both these metrics implies that channel utilization was commensurate to the load on the system and that Packet Loss under the observed congestion environment is as per expectation.
7.4.1.1.8 Key Takeaway As can be observed, both CBR metrics and PER metrics observed in the lab and the SIM closely resemble each other. SAE congestion control is working as expected for C-V2X. All the devices in the system back off to an ITT of 400 ms as soon as congestion is detected per the parameters set in the test. The devices in the setup choose their transmission resources while avoiding transmissions chosen by other devices, which helps improve overall PER as measured on DUT1 and DUT2.
This confirms the channel utilization under operating load is an efficient use of the channel while also maintaining a low packet error rate to improve overall PER performance in a congested environment.
7.4.1.2 V2V Congestion Control in Lab – Critical BSM Broadcast Most of the test setup and test steps for this 7.4.1.2 test case are the same as for the 7.4.1.1 test case. Therefore, the following subsections describe only key differences.
7.4.1.2.1 Background Same as Section 7.4.1.1.1 except for the following:
The purpose of this test is to verify that C-V2X devices can transmit and receive BSM messages, with critical priority, over the PC5 interface in a congestion-challenged channel. This corresponds to a critical event condition, as defined in SAE J2945/1, and corresponding messages are transmitted with a higher 3GPP priority.
In the following lab tests, we have an equivalent load of 578 devices like the earlier test with 48 special configured devices and two DUTs.
7.4.1.2.2 Assumptions Same as Section 7.4.1.1.2.
7.4.1.2.3 Setup Same as Section 7.4.1.1.3 except for the following:
The two devices under test, DUT1 and DUT2, send BSM messages as in Section 7.4.1.1.3. While most of the messages are regular BSM messages, a subset of the sent BSM messages is critical, as detailed below. (As in Section 7.4.1.1.3, the REF devices provide the congested environment, and they send only regular, not critical BSM messages.)
- Settings on Device 1 (DUT1) and Device 2 (DUT2):
- Same as in Section 7.4.1.1.3 except as described below:
- BSM messages are sent according to the same cadence in Section 7.4.1.1.3. The only
74 5GAA P-190033
5GAA
difference is that critical BSM messages (i.e., priority 0) are sent at random occasions (in place of regular BSM messages) to simulate the event or incident. More specifically:
- At a random time, the device starts sending BSM messages with critical priority in place of regular priority BSM. Critical BSMs are transmitted with highest priority at the occurrence of an event.
After the first transmission of a critical BSM, a periodicity of 10 Hz is maintained until the event is over. The duration of an event has been set to 5 seconds for the test.
- At the end of the event the device reverts to sending the BSM messages with regular priority.
- Adjustable attenuator (“Variable Attenuator” at far-right side of Figure 30):
- Same as specified in Section 7.4.1.1.3
- Settings on the reference devices:
- Same as specified in Section 7.4.1.1.3. This includes the fact that the reference devices will send only regular BSM messages (no critical ones).
- Data Collection at DUT1 and DUT2:
- Same as specified in Section 7.4.1.1.3 with the additions listed below
- Priority (critical or regular) for each transmitted packet
- Priority (critical or regular) for each received packet
- Data Collection at each reference device:
- Same as specified in Section 7.4.1.1.3
7.4.1.2.4 Test Execution The overall idea of the testing is the same as in Section 7.4.1.1.4. The “Overview” from Section 7.4.1.1.4 is repeated here:
With the reference devices creating a congested environment, the PER between the DUTs (DUT1 and DUT2) is observed as the “distance” between them is gradually increased by adjusting the attenuation.
Following is the complete set of test execution steps.
1. Set up the test bed as explained in Section 7.4.1.1.3, where the total quantity of reference devices is 48.
2. The default attenuation of 95 dB was chosen to emulate ~75 m according to Simulations.
3. Set “Variable Attenuator” (at the far-right side of diagram in Figure 7 20) to 0 dB to simulate a short distance between the DUTs.
4. Start transmission at all reference devices (regular BSM broadcast).
5. Start transmission at DUT1 and DUT2 (BSM broadcast). Normally the BSM messages of a given DUT shall be sent with regular priority, but at times they shall instead be sent with critical priority, according to the following:
- At a random time, the device starts sending BSM messages with critical priority in place of regular priority BSM. Critical BSMs are transmitted with highest priority at the occurrence of an event. After the first transmission of a critical BSM, a periodicity of 10 Hz is maintained until the event is over. The duration of an event has been set to 5 seconds for the test
- At the end of the event the device reverts to sending the BSM messages with regular priority. The event repeats for five to 10 times in the overall test duration.
6. Record to a log file the data and KPIs as defined in this section for DUT1, DUT2, and the reference devices.
NOTE: Logging/saving of all KPIs shall be done for at least one reference device. Logging/saving is recommended for all reference devices as far as practical, for additional analysis.
75 5GAA P-190033
5GAA
7. Calculate the PER between the two DUTs at both DUT1 and DUT2.
NOTE: Perform these calculations separately for critical and regular BSM messages.
8. Increase the attenuation at “Variable Attenuator” (at far-right side of Figure 30) by 10 dB to simulate an increase in distance between the DUTs.
9. Repeat steps 5 through 7 until the overall attenuation between DUT1 and DUT2 reaches 115 dB. PER shall be considered separately for critical and regular BSM messages.
7.4.1.2.5 Unique Tests to be Conducted Run this test as described in Section 7.4.1.2.3 using two C-V2X DUTs and up to 48 reference devices with special configuration as explained above. Run the test in Section 7.4.1.2.4 as follows:
- All devices (DUT1, DUT2, reference devices) have congestions control switched on
7.4.1.2.6 Required Documentation Table 30 uses the data collected from log files or observed from any OBU user interface.
Table 30: Congestion Control Results with High Priority BSM Broadcast
Attenuation value between DUTs (dB)
No. of Transmitted pkts No. of Received pkts Calculated at Receiver
DUT1 DUT2 DUT1 DUT2 PER % at DUT1
PER % at DUT2
95th Percentile IPG (ms)
95th Percentile Latency (ms)
Crit. BSM
Reg. BSM
Crit. BSM
Reg. BSM
Crit. BSM
Reg. BSM
Crit. BSM
Reg. BSM
Crit. BSM
Reg. BSM
Crit. BSM
Reg. BSM DUT1 DUT2 DUT1 DUT2
95 350 1448 399 1669 394 1667 347 1426 1.2 1.9 0.8 1.5 105 105 98 101
100 350 1449 400 1660 388 1542 340 1320 2.9 7.1 2.8 8.8 105 105 101 103
105 350 1451 395 1658 383 1511 330 1291 3.1 8.8 5.6 11.0 105 105 103 102
110 350 1449 400 1662 367 1408 323 1279 8.2 15.3 7.5 11.4 215 105 102 101
115 350 1450 400 1665 351 1281 322 1201 12.3 23.1 8 17.2 219 105 100 100
7.4.1.2.7 Evaluation Criteria Evaluation criteria assess the performance of high-priority BSM messages in a highly congested lab environment and multi-priority BSM usages.
The evaluation criteria are satisfactory performance of lab tests with congestion control where the PER performance of high-priority BSM messages is better than, or at least, equal to the low-priority messages.
7.4.1.2.8 Key Takeaway The results showed that the PER performance of high-priority BSM messages is noticeably better than lower- priority messages when high attenuations are used, or reception signals are weak.
Under poor communication environments, high-priority BSM messages showed more reliable performance compared to lower priority messages. The reason is that high-priority safety messages can be protected more efficiently for congested and collision scenarios by the C-V2X resource selection algorithm.
Under low attenuation or strong reception signal environments, the PER improvement of high-priority BSM messages is marginal, which is expected because the PER performance of low- priority BSM messages is already satisfactory.

76 5GAA P-190033
5GAA
For the actual deployment, we expect that this PER improvement of high-priority BSM messages can be translated into noticeable and meaningful reliability improvement of critical safety messages under highly congested scenarios.
8 Field Test Procedures and Results
8.1 Introduction These field tests provided a realistic, but controlled, open-sky setting for comparative testing of the V2V technologies. Each test is executed in exactly the same manner and in sequence for both technologies, and the results are compared. For comparative tests, the following must be the same when testing the two technologies:
- Test procedure
- Test conditions
Under test conditions we ensured that the following are the same:
- Antenna characteristics and placement
- Vehicle geometry and cabling
- Track topology and arrangement
- Sample size and repeatability
- Environmental conditions and interference
- Power and other radio settings
- Vehicle speed
In our tests, our main goal is to collect data for an apples-to-apples comparison between DSRC and C-V2X technologies. The performance metrics or KPIs used for the comparison are:
- Packet reception rate (PRR)
- Inter-packet gap (IPG)
Receive Signal Strength Indicator (RSSI) is collected and presented for DSRC only.
Range tests determine the distance at which PRR or the reliability of the BSM message reception drops below an acceptable level. The PRR threshold for range determination is 90%. The range tests were performed on the following test track:
- Road A – Straightaway (Fowlerville Proving Ground - FPG, Michigan)
It is commonly accepted that range is reached when the PRR drops below 90%.
In field tests, it is observed that the signal sometimes drops and then quickly recovers, resulting in packet loss over a short period of time and, since the vehicle is moving, over a short distance. There is no industry agreement on how to treat these short outages. The goal of this document is to make a wider industry audience aware of this effect and promote discussion leading to a consensus. In this section, we report both the first time the PRR crosses 90% and the last time before the PRR deteriorates beyond recovery.

77 5GAA P-190033
5GAA
The rest of this section presents test procedures and results for the following tests:
- Range
- Line-of-Sight (LOS)
- Non-Line-of-Sight (NLOS)
- Shadowing
- Intersection
- LOS interference from U-NII-3 band
- LOS interference from adjacent channel
8.2 Hardware Setup Figure 34 shows the setup of the transmitter and receiver. The connector on the DSRC OBU was FAKRA Type Z with a 6’’ SMA cable. The connector on the C-V2X OBU was Quad FAKRA with a 2’’ SMA cable. One antenna was used for transmission and two antennas for reception (1Tx 2Rx configuration). The effective transmit power was varied by changing both attenuators simultaneously at the primary and the secondary ports. The sum of the attenuator values at the transmit and receive sides represents the effective transmit power reduction (10 dB and 16 dB total path loss increase for 5 dB and 8 dB attenuator values, respectively).
Figure 34: Transmitter and Receiver Setup
In the field tests both OBUs were transmitting and receiving at the same time. As discussed, all three antennas: primary (Tx and Rx), secondary (Rx only) and GPS, were placed on the roof. The OBUs are connected to a power supply, CAN connector, and a laptop for test control and data logging.
Each OBU has a primary antenna port to transmit the RF signal out of the unit. The antenna port connectors are different for each technology and are shown in Table 31. In Figure 35, shows the link power budget for both technologies for the field test. Assuming the same antenna cabling and gain used for both technologies (same car), the only variable component is the antenna connector with a short SMA-terminated cable. The transmit power is measured at the output of each connector/cable as shown in the table in Figure 35. Section 7.1.2 describes the measurement technique. Based on the connector loss values and the requirement to guarantee the same end-to-end loss conditions for comparative testing the transmit power of the DSRC OBU is set to 23 dBm. This setting provides approximately the same effective end-to-end power budget for both technologies.

78 5GAA P-190033
5GAA
Table 31: Antenna Connectors and Cables with Illustrations
Technology Connector Loss
C-V2X Quad FAKRA 0.4 dB
DSRC FAKRA Type Z 0.46 dB
Figure 35: Link Budget for the Two Technologies

79 5GAA P-190033
5GAA
8.3 Field Test Parameters As Section 6.1 describes, the OBUs used in the tests are:
- Savari MW1000 ((Qualcomm QCA6582 DSRC Radio and Savari V2X SAE Stack)
- Qualcomm Roadrunner (Qualcomm MDM9150 C-V2X Radio and Savari V2X SAE Stack )
Table 32 shows the main parameters used in the field tests. Due to high activity of the U-NII-3 devices on most test tracks including FPG, it was decided to move the test frequency as far as possible from the U-NII-3 band but keep it in the ITS band, i.e., to CH184 (center frequency 5,920 MHz). Based on free-space and plane-earth propagation models (see (Parsons, 1994)) the change in operating frequency should have less than 0.1 dB effect on propagation loss, ensuring that the conclusions from CH172 and CH184 testing are the same. This equivalence is ensured under the interference-free conditions required for the range tests. Additionally, while the C-V2X has the same channel bandwidth as DSRC, the actual transmission bandwidth of C-V2X can be a fraction of 10 MHz (in our case it is 3.6 MHz) due to the frequency division multiplexing feature of C-V2X.
Table 32: Field Test OBU and System Parameters
Parameter11 DSRC C-V2X
Vehicle Fusion (w/o moon roof) Fusion (w/o moon roof)
Modulation and coding QPSK, 0.5 MCS 5
Blind HARQ Not available Yes
Channel2 CH184 (5,920 MHz) CH184 (5,920 MHz)
Bandwidth (message) 10 MHz 10 MHz
Packet size 193B 193B
Message frequency 10 Hz 10 Hz
Antenna3 ECOM6-5500 (6 dBi) ECOM6-5500 (6 dBi)
Diversity 1Tx, 2Rx 1Tx, 2Rx
Equivalent Tx Power (with attenuation)4 5 dBm, 11 dBm 5 dBm, 11 dBm
1 Selected parameters include standard options. Proprietary options were not considered. 2 We used CH184 to avoid any impact of the existing U-NII-3 devices operating near the test track that we
do not have control over. 3 Antennas were mounted 24 inches apart in the middle of the roof (driver side Primary, passenger side
Secondary – Primary used for Tx). 4 Equivalent Tx power is the OBU total Tx power out minus attenuation on each RF antenna cable. Tx power
was 21 dBm and the total attenuation was 10 dB (on both Rx ends combined) resulting in 11 dBm equivalent Tx power. For DSRC OBU the matching Tx power was 23 dBm. To simplify, we will refer to Tx powers of both OBUs as 21 dBm. We have also done tests with 5 dBm effective transmit power by introducing 16 dB of total attenuation. This was done to fit the C-V2X range into the test track as well as match the same setting in previous tests by the industry (USDOT NHTSA, CAMP, September 2011).
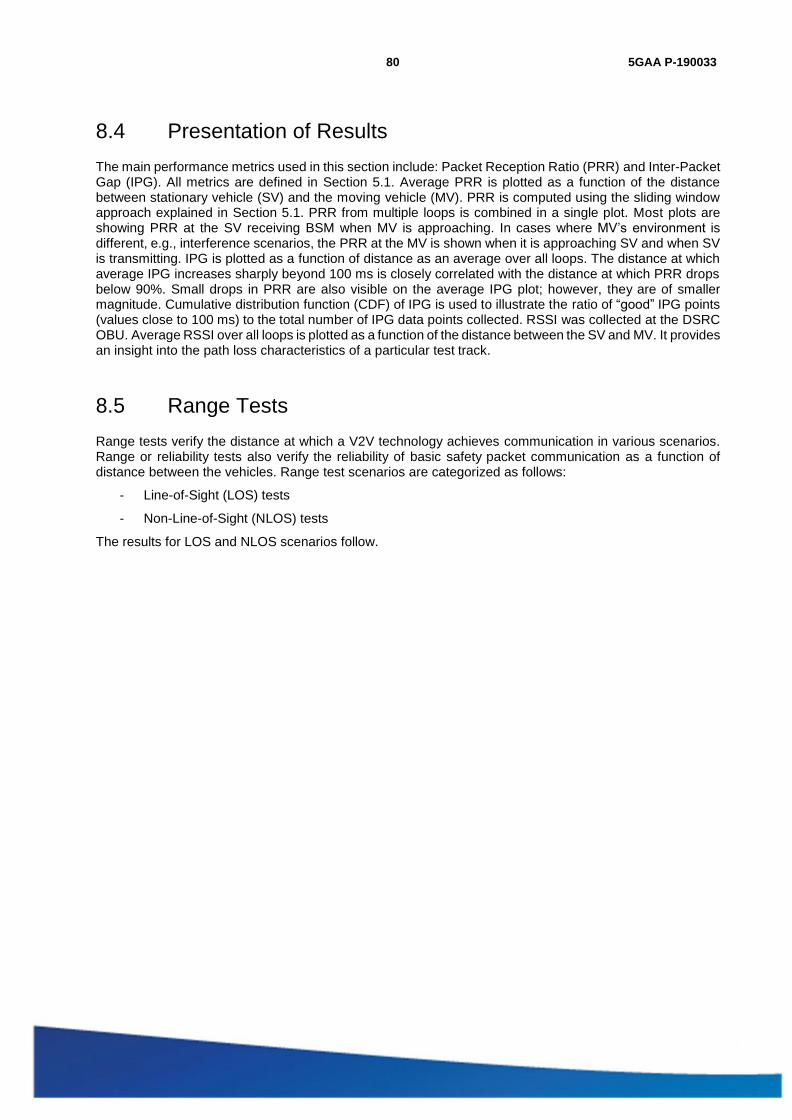
80 5GAA P-190033
5GAA
8.4 Presentation of Results The main performance metrics used in this section include: Packet Reception Ratio (PRR) and Inter-Packet Gap (IPG). All metrics are defined in Section 5.1. Average PRR is plotted as a function of the distance between stationary vehicle (SV) and the moving vehicle (MV). PRR is computed using the sliding window approach explained in Section 5.1. PRR from multiple loops is combined in a single plot. Most plots are showing PRR at the SV receiving BSM when MV is approaching. In cases where MV’s environment is different, e.g., interference scenarios, the PRR at the MV is shown when it is approaching SV and when SV is transmitting. IPG is plotted as a function of distance as an average over all loops. The distance at which average IPG increases sharply beyond 100 ms is closely correlated with the distance at which PRR drops below 90%. Small drops in PRR are also visible on the average IPG plot; however, they are of smaller magnitude. Cumulative distribution function (CDF) of IPG is used to illustrate the ratio of “good” IPG points (values close to 100 ms) to the total number of IPG data points collected. RSSI was collected at the DSRC OBU. Average RSSI over all loops is plotted as a function of the distance between the SV and MV. It provides an insight into the path loss characteristics of a particular test track.
8.5 Range Tests Range tests verify the distance at which a V2V technology achieves communication in various scenarios. Range or reliability tests also verify the reliability of basic safety packet communication as a function of distance between the vehicles. Range test scenarios are categorized as follows:
- Line-of-Sight (LOS) tests
- Non-Line-of-Sight (NLOS) tests
The results for LOS and NLOS scenarios follow.

81 5GAA P-190033
5GAA
8.5.1 Line-of-Sight (LOS) Tests LOS range tests are described in Section 9.1.1 of (5GAA, March 2018). The procedure tests the performance characteristics of the radio technology in a realistic, yet controlled, environment of a test track. The conditions are open sky with no obstructions and minimal disturbance in the RF environment.
The objectives of the test are:
1. Compare communication range (packet reception rate vs. distance) and reliability of safety message exchange under LOS conditions for C-V2X and DSRC.
2. Compare inter-packet gap (IPG) for both technologies.
The scenario includes the following for both RF technologies tested:
- One stationary and one moving vehicle (SV, MV) broadcasting BSM messages (packets) without security.
- Packets are fixed at 193 bytes.
- Fixed attenuators are used so that the tests can be scaled to the test track maximum length.
- Transmit power fixed at the same equivalent value to guarantee the same link budget. Typically, two levels are tested: 5 dBm and 11 dBm effective transmit power.
- RF cabling including attenuation identical for both technologies.
- Same vehicles, instrumentation and antenna placements are used during the comparison tests for both technologies.
- Same vehicle models are used, so that the vehicle antenna characteristics are identical between SV and MV.
- MV is performing loops by moving away and returning towards the SV (see Figure 36). The two directions are referred to as receding and approaching. In the approach direction the MV uses the neighboring lane. Each test consists of 6 loops.
- MV uses cruise control to maintain a constant speed of 20 mph or approximately 32 kph (except in the turns) per lap to be consistent for both technologies.
Figure 36: LOS Ranging Setup D is the Length of the Test Track (1.35 km)
Table 32 shows parameters used in the LOS test. The test track was not long enough to observe packet errors with a transmit power of 21 dBm. For that reason, the tests were performed with the reduced effective transmit power of 5 dBm and 11 dBm. The effective transmit power was achieved by placing the same fixed attenuators on both RF antenna cables (primary and secondary) between the OBU connector and the antenna cable (see Figure 34.). The fixed attenuators were measured in the lab using a VNA (Vector Network Analyzer).

82 5GAA P-190033
5GAA
The test was performed on Road A at the Fowlerville Proving Grounds (FPG), Fowlerville, Michigan. Road A is a 1.35-km long straightaway shown in Figure 37. Figure 38 shows a more detailed aerial view of the Stationary Vehicle setup and the U-turn performed by the Moving Vehicle.
Figure 37: Map of FPG Road A (The blue square on the map above represents the north circle where the SV was located. See Figure 38.)

83 5GAA P-190033
5GAA
Figure 38: Map of the North Circle at FPG Road A (The red vehicle is the SV and the blue vehicle is the MV with its trajectory labeled with the white arrow.)
8.5.1.1 LOS Test Results The first test was done to assess range of the devices on the track and collect the RSSI with no additional attenuation and 23 dBm transmit power. Figure 39 shows the RSSI of a three-loop test. The RSSI KPI logs were collected by the DSRC OBUs. No packet loss was observed. For that reason, additional loss was introduced into the system by adding 5 dB or 8 dB attenuators on each RF cable (two per OBU) increasing the path loss by a total of 10 dB or 16dB, respectively. This is effective to reducing the transmit power from 21 dBm down to 11 dBm or 5 dBm, respectively.
The RSSI plot in Figure 39 exhibits a classic example of the constructive and destructive superposition of direct and reflective paths. The sharp drop of RSSI at 100 m distance is predicted by the plane-earth propagation equation; see (Parsons, 1994), which also predicts the slope of the RSSI curve at larger distance (~1/(distance) 4 or approximately 12 dB for each doubling of the distance).
Figure 39: Receive Signal Strength Measured by the Stationary Vehicle DSRC OBU with 23 dBm Transmit Power
Figure 40, shows average Packet Reception Ratio (PRR) as a function of distance between the stationary vehicle (SV) and the moving vehicle (MV) when MV is approaching, averaged over all the loops. Assuming 90% PRR as the threshold, DSRC range for 5 dBm and 11 dBm is 625 m and 925 m, respectively. Similarly, C-V2X range is 1050 m and >1350 m for effective transmit power of 5 dBm and 11 dBm, respectively. The slight dip in PRR for C-V2X at effective transmit power of 11d dBm is likely caused by the vehicle performing the U-turn at the end of the test track. PRR of C-V2X at 5 dBm effective transmit power has a higher range than PRR for DSRC at 11 dBm which is expected based on the Lab results in Section 7.2.2.

84 5GAA P-190033
5GAA
Figure 40 LOS Average Packet Reception Ratio at the SV as a Function of Distance between the SV and MV
Figure 41 shows the average Inter-Packet Gap (IPG) as a function of distance between SV and MV observed by SV for both technologies at 5 dBm effective power. It is observed that average IPG is a fixed value (100 ms) for distances below PRR range for each technology. This is expected when no packets are lost. Small variations around the average are due to radio access and protocol stack processing variability. When N packets are lost the next received packet will record IPG which is approximately (N+1) inter-packet gaps or (N+1) x 100 ms. With a larger number of packets lost, the IPG increases rapidly, meaning that consecutive packets are being dropped. It can be observed that the rapid increase in the average IPG is closely correlated with range (see corresponding curves in Figure 40).
Figure 42 shows the Cumulative Distribution Function (CDF) of the IPG data from Figure 41. It is observed that for both DSRC and C-V2X ~97 to 98% of all BSMs received during the test recorded a regular inter-packet gap of 100 ms. Similar observation from Figure 41 and Figure 42 apply to Figure 43 and Figure 44, respectively.

85 5GAA P-190033
5GAA
Figure 41: LOS Average Inter-Packet Gap at the SV as a Function of Distance between the SV and MV (5 dBm)
Figure 42: LOS Inter-Packet Gap CDF (5 dBm)
Figure 43: LOS average Inter-Packet Gap at the SV as a Function of Distance between the SV and MV (11 dBm)

86 5GAA P-190033
5GAA
Figure 44: LOS Inter-Packet Gap CDF (11 dBm)
Figure 45 illustrates RSSI measured by the SV DSRC OBU for the 5 dBm and 11 dBm effective power levels.
Figure 45: LOS DSRC RSSI as a Function of Distance between the SV and MV

87 5GAA P-190033
5GAA
8.5.2 Non-Line-of-Sight (NLOS) Range Tests This section describes the test procedure and presents the results for two NLOS tests. The two NLOS tests that were performed are:
1. NLOS shadowing test, which assumes that the obstruction is in front of the SV and that the MV performs the maneuver in front of the blocker. This test is closely related to Do Not Pass Warning safety use case (e.g., (USDOT ITS JPO DNPW)).
2. NLOS intersection obstructed view test, which assumes that SV is positioned between two blockers obstructing the view of the road perpendicular to the SV position where the MV performs the maneuver. This test is closely related to Intersection Movement Assist (IMA) safety use case (e.g., (USDOT ITS JPO IMA)).
NLOS range tests are described in Section 9.1.1 of (5GAA, March 2018). As in the LOS test, the NLOS procedures test performance characteristics of the radio technology in a dynamic outdoor environment over the full range communications. The conditions are open sky with precisely defined obstructions and minimal disturbance in the RF environment.
The objectives of the test are to
1. Compare communication range and reliability of safety message exchange under NLOS conditions (non-intersection and intersection) for C-V2X and DSRC.
2. Compare inter-packet gap (IPG) for both technologies.
The test and system parameters used in these tests are the same as in Section 8.3. The 26-ft U-Haul trucks were used as blockers in all NLOS tests.
8.5.2.1 NLOS Shadowing Test and Results The NLOS non-intersection test setup is shown in Figure 46. The distance between the front of the SV and the back of the blocker truck was set at 5.3 m. MV starts close to SV and moves away in the same lane as the SV at speed V=20 mph until out-of-range. Blocker stays stationary in front of SV. MV performs a U-turn and approaches SV in the neighboring lane. Testing was performed with 5 and 11 dBm effective transmit power.
Figure 46: NLOS Non-Intersection Test Setup
The test was performed on the same test track as the LOS test, namely Road A at the Fowlerville Proving Grounds (FPG), Fowlerville, Michigan. The layout is shown in Figure 47. The red vehicle is the Stationary vehicle (SV) and the blue vehicle is the moving vehicle (MV) with its trajectory labeled by white arrows. The grey blocker (U-Haul truck) is shown in front of the SV. After the U-turn the MV approaches the SV in the neighboring lane.
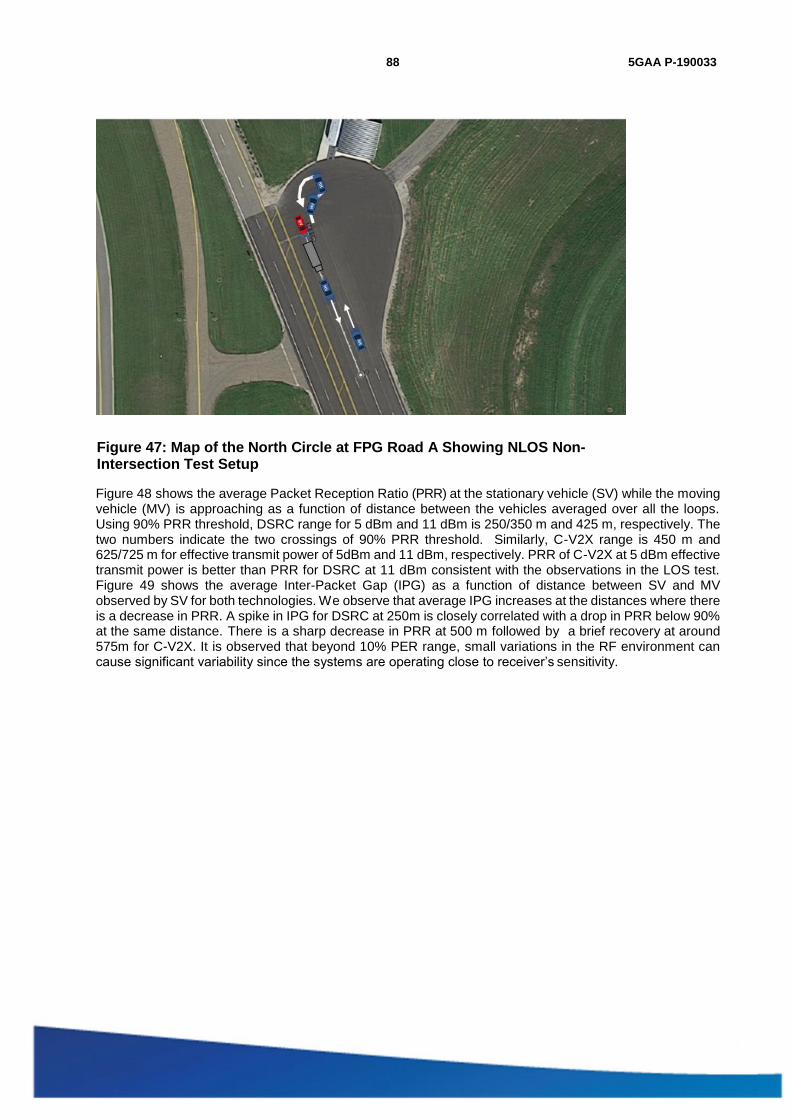
88 5GAA P-190033
5GAA
Figure 47: Map of the North Circle at FPG Road A Showing NLOS Non-Intersection Test Setup
Figure 48 shows the average Packet Reception Ratio (PRR) at the stationary vehicle (SV) while the moving vehicle (MV) is approaching as a function of distance between the vehicles averaged over all the loops. Using 90% PRR threshold, DSRC range for 5 dBm and 11 dBm is 250/350 m and 425 m, respectively. The two numbers indicate the two crossings of 90% PRR threshold. Similarly, C-V2X range is 450 m and 625/725 m for effective transmit power of 5dBm and 11 dBm, respectively. PRR of C-V2X at 5 dBm effective transmit power is better than PRR for DSRC at 11 dBm consistent with the observations in the LOS test. Figure 49 shows the average Inter-Packet Gap (IPG) as a function of distance between SV and MV observed by SV for both technologies. We observe that average IPG increases at the distances where there is a decrease in PRR. A spike in IPG for DSRC at 250m is closely correlated with a drop in PRR below 90% at the same distance. There is a sharp decrease in PRR at 500 m followed by a brief recovery at around 575m for C-V2X. It is observed that beyond 10% PER range, small variations in the RF environment can cause significant variability since the systems are operating close to receiver’s sensitivity.

89 5GAA P-190033
5GAA
Figure 48: NLOS Shadowing Average Packet Reception Ratio at the SV as a Function of Distance between the SV and MV
Figure 49 shows the average Inter-Packet Gap (IPG) as a function of distance between SV and MV observed by SV for both technologies at 5 dBm effective power. It is observed that average IPG is approximately flat (100 ms) for distances below PRR range for each technology. Figure 50 shows the Cumulative Distribution Function (CDF) of the IPG data from Figure 50. It is observed that for DSRC and C-V2X ~97% and ~98% of all BSMs received during the test had a regular inter-packet gap of 100ms, respectively. Similar observation from Figure 49 and Figure 50 apply to Figure 51 and Figure 52, respectively.
Figure 49: NLOS Shadowing Average Inter-Packet Gap at the SV as a Function of Distance between the SV and MV

90 5GAA P-190033
5GAA
Figure 50: NLOS Shadowing Inter-Packet Gap CDF
Figure 51: NLOS Shadowing Average Inter-Packet Gap at the SV as a Function of Distance between the SV and MV
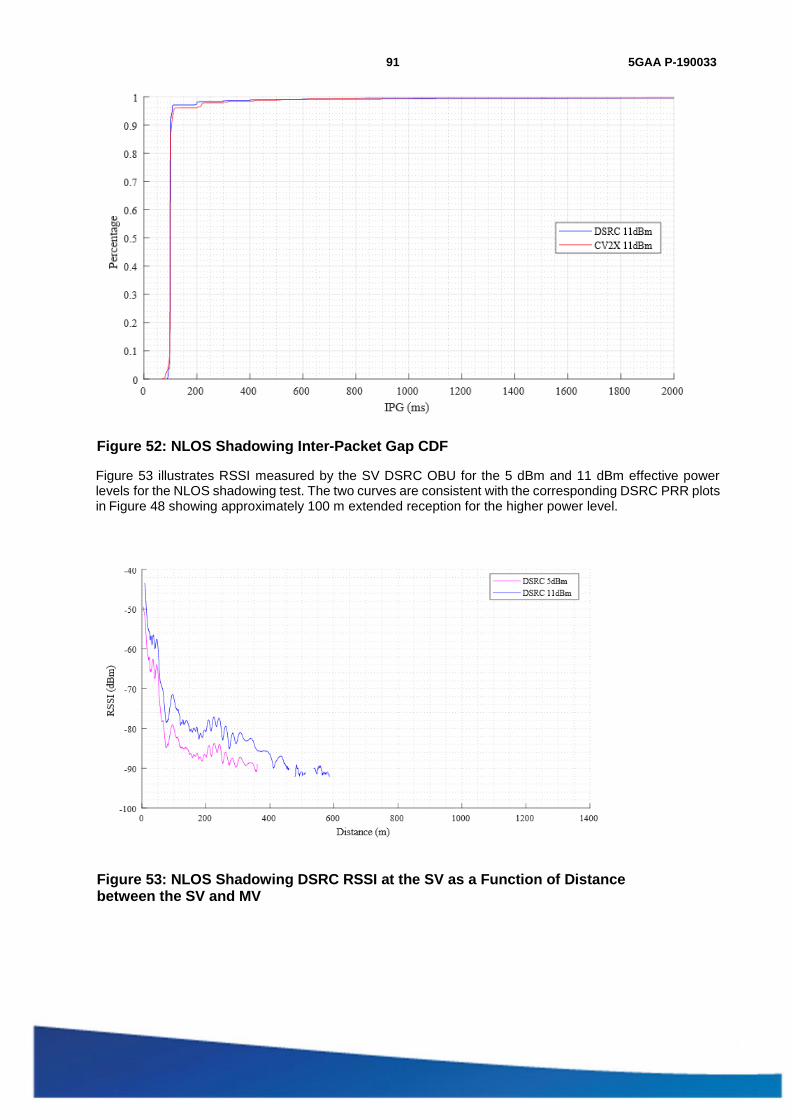
91 5GAA P-190033
5GAA
Figure 52: NLOS Shadowing Inter-Packet Gap CDF
Figure 53 illustrates RSSI measured by the SV DSRC OBU for the 5 dBm and 11 dBm effective power levels for the NLOS shadowing test. The two curves are consistent with the corresponding DSRC PRR plots in Figure 48 showing approximately 100 m extended reception for the higher power level.
Figure 53: NLOS Shadowing DSRC RSSI at the SV as a Function of Distance between the SV and MV

92 5GAA P-190033
5GAA
8.5.2.2 NLOS Intersection Test and Results Figure 54 shows the NLOS intersection test setup. The test was performed with the full distance of Road A test track (D=1.35 km). SV is placed between two large blocking objects (trucks). Two 26-ft U-Haul trucks were used for the intersection tests. In the approach from the left, the MV starts in front of the SV and moves away in the lane perpendicular to the SV at a constant speed of 20 mph, simulating an intersection scenario. At the end of the test track it performs a U-turn and moves back in the neighboring lane. After passing by SV in the opposite direction it performs a U-turn and gets into the initial position without stopping. The blockers are placed 2.1 m from either side of the SV.
Figure 54: NLOS Test Setup for the Approach from the Left

93 5GAA P-190033
5GAA
Figure 55: Map of the North Circle at FPG Road A Showing NLOS Intersection Test Setup
NOTE: The red vehicle is the SV, the blue vehicle is the MV and the grey blockers are U-Haul trucks.
Figure 56 shows the average Packet Reception Ratio at the stationary vehicle (SV) while the moving vehicle (MV) is approaching as a function of distance between the vehicles averaged over all the loops. Using 90% PRR threshold, DSRC and C-V2X ranges are 90/400 m and 600/800 m, respectively. Figure 57 shows the average Inter-Packet Gap (IPG) as a function of distance between SV and MV observed by SV for both technologies. Small spikes in average IPG indicate isolated packet errors which is consistent with the small temporary dips in PRR in Figure 56.
Figure 56: NLOS Intersection Average Packet Reception Ratio at the SV as a Function of Distance between the SV and MV
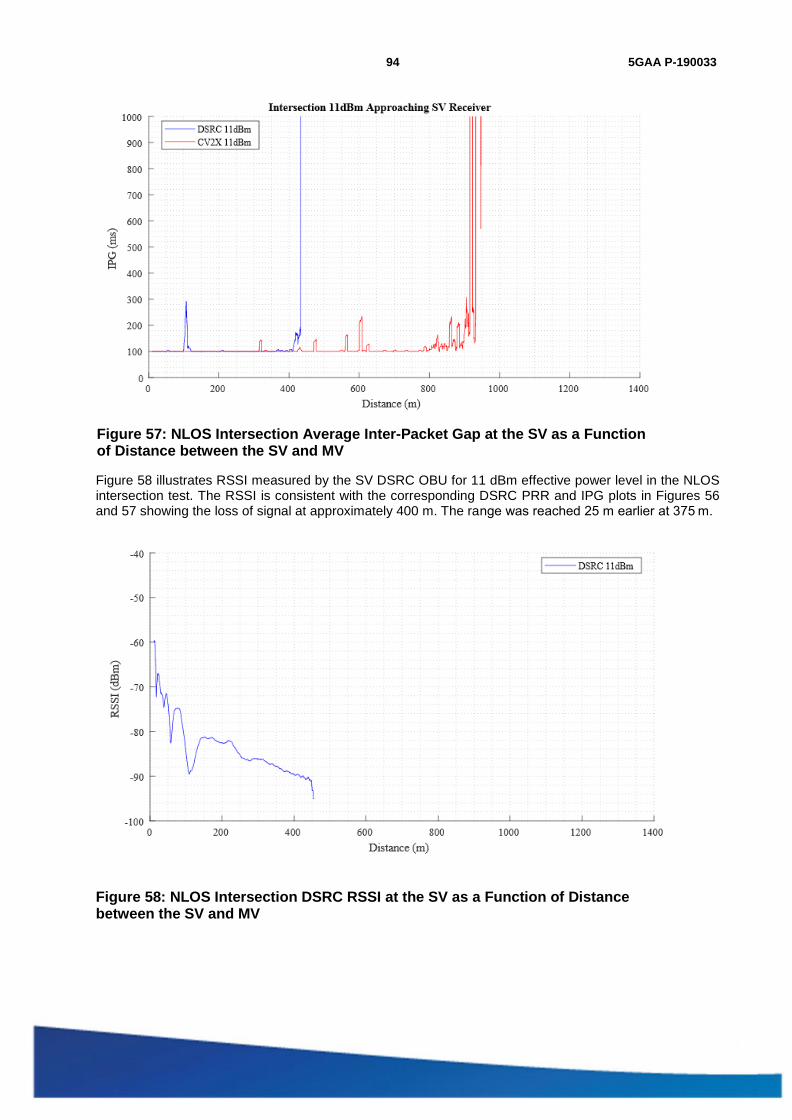
94 5GAA P-190033
5GAA
Figure 57: NLOS Intersection Average Inter-Packet Gap at the SV as a Function of Distance between the SV and MV
Figure 58 illustrates RSSI measured by the SV DSRC OBU for 11 dBm effective power level in the NLOS intersection test. The RSSI is consistent with the corresponding DSRC PRR and IPG plots in Figures 56 and 57 showing the loss of signal at approximately 400 m. The range was reached 25 m earlier at 375 m.
Figure 58: NLOS Intersection DSRC RSSI at the SV as a Function of Distance between the SV and MV
95 5GAA P-190033
5GAA
8.6 Interference Tests The purpose of the interference tests was to assess resilience of V2X technologies from two types of out-of- band interference:
1. Interference originating in U-NII-3 Band (5,725-5,850 MHz)
2. Interference originating in the channel adjacent to the operating (safety) channel (CH172)
As in the range tests, both DSRC and C-V2X OBUs are tested under the same conditions. This implies that both technologies are tested using the same interferer. In the case of the U-NII-3 test, both V2X technologies are subjected to the same IEEE 802.11ac 80 MHz synthetically created interference in CH155. Similarly, in the case of the adjacent channel interference tests, the interference for both DSRC and CXV2X is the same synthetically created IEEE 802.11p 10MHz interference in the adjacent channel.
Since the operating channel was moved to CH184, to create equivalent interference conditions the interference had to be moved accordingly. Center frequency of CH184 (5,920 MHz) is 60 MHz above the center frequency of CH172 (5,860 MHz). To ensure the same interference effect by the U-NII-3 interference on the safety, the center frequency of the interfering signal was shifted up by 60 MHz to maintain the same 40 MHz separation. Similarly, adjacent channel interference was configured for center frequency 5,910 MHz (CH182) to ensure operation in the adjacent channel. Both tests are following test procedures described in Sections 9.1.3 and 9.1.4 of (5GAA, March 2018).

96 5GAA P-190033
5GAA
8.6.1 U-NII-3 802.11ac Interference Test and Results This test compares the effects of U-NII-3 band interference on both V2X technologies in terms of range, reliability, and IPG. Since this is a LOS test, the range with interference present should be compared to the LOS range results. It is expected that the range of both technologies will decrease when the interference is in close proximity. This is a realistic situation when a vehicle is for example at an intersection and a Wi-Fi hotspot antenna is close by as in Figure 59.
Figure 59: Downtown Manhattan Intersection with a Possible Wi-Fi Hotspot at the Corner Cafe
This test closely follows the test procedure described in Section 9.1.3 of (5GAA, March 2018). This scenario tests the impact of a fixed Wi-Fi 802.11ac 80 MHz interferer in U-NII-3 CH155 on Basic Safety Message (BSM) reception in CH172. The interferer is the widest IEEE 802.11ac signal that fits in U-NII-3 (80 MHz). Since the OBUs are operating in CH184, the interferer was shifted from the center frequency 5,775 MHz to the center frequency 5,835 MHz. The modified center frequency ensures that the tests in CH184 will produce results equivalent to the tests in CH172 with Wi-Fi signal in CH155. This is shown in Figure 60.

97 5GAA P-190033
5GAA
Figure 60: Frequency Layout of the U-NII-3 LOS Interference Test
Figure 61 shows the test setup. This setup is identical to the LOS test setup in Section 8.5.1 except that the interferer is placed in the same line as the SV 13 m away as Figure 61 shows. The same test track (Road A at FPG) was used in this test. The moving vehicle (MV) starts in front of the stationary vehicle (SV) and moves away in the same lane at a constant speed of 20 mph. At the end of the test track it performs a U-turn and moves back in the neighboring lane. After passing SV in the opposite direction, it performs a U-turn and gets into the initial position without stopping. As in the LOS test case, D is the length of the test track (1.35 km).
Figure 61: LOS U-NII-3 Interference Test Setup D is the Length of the Test Track
Interference is generated by the signal generator. We used a Rohde and Schwartz SMBV100A signal generator with the configuration listed in Table 33.

98 5GAA P-190033
5GAA
Table 33: U-NII-3 Interference Test Signal Generator Configuration Parameters
Configuration parameter Value
Frequency 5.835 GHz
Frame Block Configuration (Std) 11ac
Frame Block Configuration (Type) Data
Frame Block Configuration (Physical Mode) Mixed
Frame Block Configuration (Tx Mode) VHT-80MHz
Frame Block Configuration (Frames) 1
Frame Block Configuration (Idle time/ms) 0.081
Frame Block Configuration (Data) A-MPDU
Frame Block Configuration (A-MPDU length) 1484 bytes
Frame Block Configuration (DRate/Mbps) 58.50
Frame Block Configuration (State) On
Clipping setting (State) On
Clipping setting (Level) 100%
Clipping setting (Mode) Vector |i+jQ|
Level (power) 25 dBm at the antenna cable input
Traffic source duty cycle 76%
Output of the signal generator is connected to an RF cable to the power amplifier (Minicircuits ZVE-3W-83+) as shown in Figure 62. Output of the power amplifier is connected to a Wi-Fi base station antenna (HG2458- 06U-PRO) mounted on a tripod with the height of 7 ft 10 in (top). The loss of the two RF cables in Figure 62 was measured to be 2.1 dB and 2.4 dB respectively. The measured average power at output of the power amplifier was 25 dBm. The output power was measured with a power meter with the Idle Time in Table 33 set to 0.001 ms. The power spectrum of the signal measured at the input to the antenna is shown in Figure 63.
The combination of packet length, data rate, and idle time duration results in 252 µs ON periods followed by 81µs OFF or idle periods. The application data rate is approximately 35 Mbps while the utilization of the channel is 76%. This traffic profile models high-volume data download or high data-rate video streaming.

99 5GAA P-190033
5GAA
Figure 62: U-NII-3 Interferer Setup
Figure 63: Power Spectrum of the U-NII-3 Interferer
In this compares the range of DSRC and C-V2X OBUs in the presence of 80-MHz wide U-NII-3 interference assuming 11 dBm effective transmit power of the OBUs. Figure 64 shows PRR as a function of distance for the SV receiver. Compared to the LOS results in Section 8.5.1.1, a decrease in range is observed for both technologies, with DSRC PRR affected by the destructive superposition of the direct and reflected paths. The range for DSRC and C-V2X with U-NII-3 interference present is 550 m and 950 m, respectively. DSRC PRR drops 2-3% at 125 m but recovers at 75 m as the MV approaches the SV. Figure 65 shows PRR at the MV when MV approaches the SV. It is observed that there is a small negative impact at the MV for both technologies from the presence of the UNII-3 interference. However, this degradation is significantly smaller compared to the negative impact on the reception at the SV. This is explained by the close proximity of the AP antenna to the SV. The new range is 550 m and 950 m for DSRC and C-V2X, respectively.

100 5GAA P-190033
5GAA
IT was noted that DSRC reception at the SV was negatively impacted even for distances below range. A steady loss of packet at roughly 2 to 3% was observed for distance below range at the SV (Figure 64) and MV (Figure 65).
Figure 64: U-NII-3 interference average Packet Reception Ratio at the SV as a function of distance between the SV and MV.
Figure 65: U-NII-3 Interference Average Packet Reception Ratio at the MV as a Function of Distance between the SV and MV;
Figures 66 and 67 show average Inter-Packet Gap (IPG) as a function of distance between SV and MV for both technologies observed by SV and MV, respectively. Small constant spikes in average IPG for DSRC

101 5GAA P-190033
5GAA
indicate a constant small packet error rate which is consistent with the PRR plot in Figure 64 and Figure 65. Both IPG plots are consistent with the corresponding PRR plots indicating a sharp increase in IPG when the range is reached.
Figure 66: U-NII_3 Interference Average Inter-Packet Gap vs Distance at the SV as a Function of Distance between the SV and MV
Figure 67: U-NII-3 Interference Average Inter-Packet Gap vs Distance at the MV as a Function of Distance between the SV and MV

102 5GAA P-190033
5GAA
Figure 68 illustrates RSSI measured by the SV DSRC OBU U-NII-3 interference test. The RSSI plot is approximately the same, just a truncated version of the DSRC RSSI in the LOS test which is to be expected since the setup is the same.
Figure 68: U-NII-3 Interference DSRC RSSI at the SV as a Function of Distance between the SV and MV
8.6.2 Adjacent Channel Interference Test and Results This test compares the effects of the adjacent ITS Band channel interference at close range on both V2X technologies in terms of range, reliability, and IPG. Both V2X technologies are interfered by the same signal emulating IEEE 802.11p at high utilization.
This test follows the test procedure described in Section 9.1.4 of (5GAA, March 2018). The original test procedure called for testing only C-V2X in the presence of the adjacent DSRC carrier. To make this a comparative test, it was decided to test DSRC in the presence of the same interference. Clearly, other extensions are possible. This scenario tests the impact of a fixed DSRC interferer in the adjacent ITS band channel on Basic Safety Message (BSM) reception in CH172. The interferer is using CH174. Since the OBUs are operating in CH184, the interferer was shifted from center frequency CH174 to CH182 to remain in the ITS band and be adjacent to the safety channel which in the test was CH184. This new position ensures that the tests in CH184 will produce the equivalent results as the tests in CH172 with V2X interfering signal in CH174.
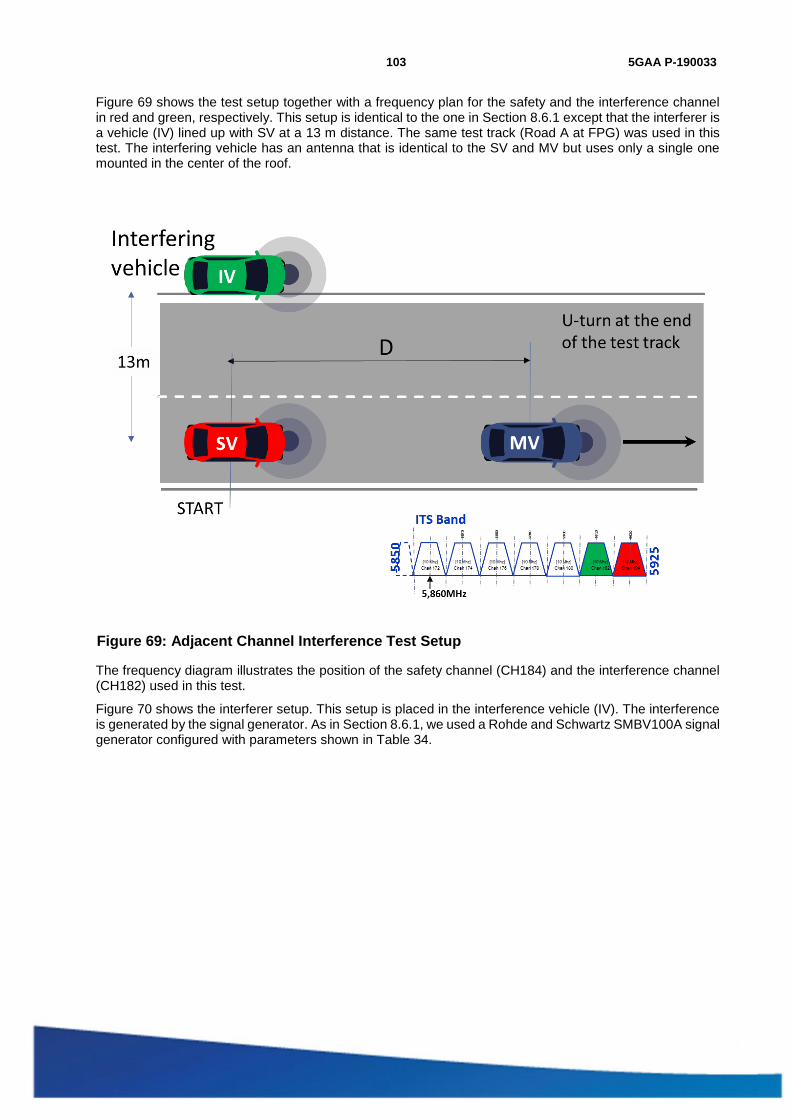
103 5GAA P-190033
5GAA
Figure 69 shows the test setup together with a frequency plan for the safety and the interference channel in red and green, respectively. This setup is identical to the one in Section 8.6.1 except that the interferer is a vehicle (IV) lined up with SV at a 13 m distance. The same test track (Road A at FPG) was used in this test. The interfering vehicle has an antenna that is identical to the SV and MV but uses only a single one mounted in the center of the roof.
Figure 69: Adjacent Channel Interference Test Setup
The frequency diagram illustrates the position of the safety channel (CH184) and the interference channel (CH182) used in this test.
Figure 70 shows the interferer setup. This setup is placed in the interference vehicle (IV). The interference is generated by the signal generator. As in Section 8.6.1, we used a Rohde and Schwartz SMBV100A signal generator configured with parameters shown in Table 34.

104 5GAA P-190033
5GAA
Table 34: Adjacent Channel Interference Test Signal Generator Configuration Parameters
Configuration Parameter Value
Frequency 5.910 GHz
Frame Block Configuration (Std) 11p/j
Frame Block Configuration (Type) Data
Frame Block Configuration (Physical Mode) Legacy
Frame Block Configuration (Tx Mode) L-10MHz
Frame Block Configuration (Frames) 1
Frame Block Configuration (Idle time/ms) 0.081
Frame Block Configuration (Data) PN 9
Frame Block Configuration (PPDU(Packet length)) 1460 bytes
Frame Block Configuration (DRate/Mbps) 6.00
Frame Block Configuration (State) On
Filter/Clipping setting (Filter) Cosine
Filter/Clipping setting (Roll Off Factor) 0.70
Filter/Clipping setting (Cut Off Frequency Shift) 0.00
Filter/Clipping setting (Sample Rate Variation) 20 MHz
Filter/Clipping setting (Clipping) On
Filter/Clipping setting (Clipping(Level)) 60%
Filter/Clipping setting (Clipping(Mode)) Vector |i+jq|
Level (power) 23 dBm at the antenna cable input
Traffic source duty cycle 96%
Output of the signal generator connects to an RF cable to the power amplifier (Minicircuits ZVE-3W-83+) as Figure 70 shows. Output of the power amplifier is connected to the vehicle antenna (COM6-5500) which comes with a 10-ft cable and is mounted on the roof of the Interfering Vehicle (IV). In our tests the IV was the same vehicle type as the SV and MV (Ford Fusion w/o moon roof). The measured average power at the input to the AP antenna was 23 dBm. The transmit power was measured with a power meter with the Idle Time in Table 34 set to 0.001 ms. The power spectrum of the signal measured at the input to the antenna cable is shown in Figure 71. The combination of packet length, data rate, and idle time duration results in 1,946 µs ON periods followed by 81 µs OFF or idle periods. The application data rate is approximately 6 Mbps while the utilization of the channel is 96%. This traffic profile models V2V/V2I data download.

105 5GAA P-190033
5GAA
Figure 70: Adjacent Channel Interferer setup; the equipment was placed in the interfering vehicle (IV)
Figure 71: Power Spectrum of the Adjacent Channel DSRC Interferer
This test compares the range of DSRC and C-V2X OBUs in the presence of 10-MHz-wide DSRC interference in the adjacent channel (CH182) assuming 11 dBm effective transmit power of the OBUs. The transmit power of the IV measured at the output of the power amplifier is approximately 23 dBm. Figure 72 shows PRR at the SV as a function of distance for the MV and SV. The DSRC and CV2X range is 100/325 m and 950 m, respectively. This represents a higher negative impact than the U-NII-3 interference. DSRC PRR drops below 90% briefly at the distance of 100 m but quickly recovers. It is also observed that the DSRC reception at the SV is negatively impacted even for distances below range. A steady loss of packets at roughly approximately 1% is observed.
Similar to U-NII-3 results, Figure 73 shows that reception at the MV is only slightly affected by the presence of the interferer. The range for DSRC and C-V2X is 900 m and 1075 m, respectively. Compared to LOS

106 5GAA P-190033
5GAA
results MV range for DSRC is unchanged while MV range for C-V2X dropped by several hundred meters.
Figure 72: Adjacent Channel Interference Average Packet Reception Ratio at the SV as a Function of Distance between the SV and MV
Figure 73: Adjacent Channel Interference Average Packet Reception Ratio at the MV as a Function of Distance between the SV and MV
Figures 74 and 75 show the average Inter-Packet Gap (IPG) as a function of distance between SV and MV for both technologies, observed by SV and MV, respectively. Small constant spikes in average IPG for

107 5GAA P-190033
5GAA
DSRC indicate constant small packet error rate which is consistent with the PRR plot in Figure 64. Both IPG plots are consistent with the corresponding PRR plots indicating a sharp increase in IPG when the range is reached.
Figure 74: Adjacent Channel Interference Average Inter-Packet Gap vs Distance at the SV as a Function of Distance between the SV and MV
Figure 75: Adjacent Channel Interference Average IPG vs Distance at the MV as a Function of Distance between the SV and MV

108 5GAA P-190033
5GAA
Figure 76 illustrates RSSI measured by the SV DSRC OBU for the adjacent channel interference test. The RSSI plot is approximately the same to the RSSI plot in Figure 68
Figure 76: Adjacent Channel Interference DSRC RSSI at the SV as a Function of Distance between the SV and MV
8.7 Key Takeaways The field tests compared DSRC and C-V2X under the tight control of the factors that influence RF propagation:
- Antenna characteristics and placement
- Vehicle geometry and cabling
- Location and environmental conditions
- Power, interference, and other settings
- Vehicle speed
The field test addressed the following questions:
- Range of the system and reliability of communication as a function of distance for the following vehicle scenarios:
- Line-of-Sight (LOS)
- Non-Line-of-Sight (NLOS)
- Shadowing
- Intersection
- Impact of out-of-band interference for the following cases
- LOS interference from the U-NII-3 band
- LOS interference from the adjacent DSRC channel
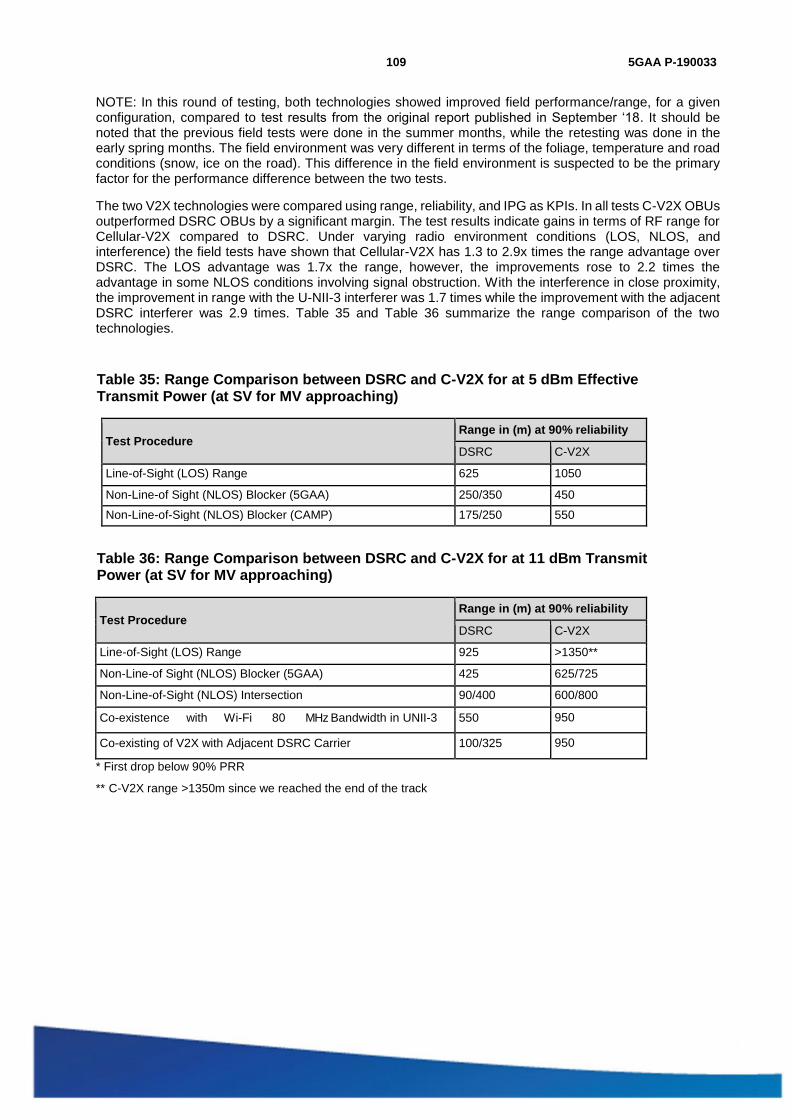
109 5GAA P-190033
5GAA
NOTE: In this round of testing, both technologies showed improved field performance/range, for a given configuration, compared to test results from the original report published in September ‘18. It should be noted that the previous field tests were done in the summer months, while the retesting was done in the early spring months. The field environment was very different in terms of the foliage, temperature and road conditions (snow, ice on the road). This difference in the field environment is suspected to be the primary factor for the performance difference between the two tests.
The two V2X technologies were compared using range, reliability, and IPG as KPIs. In all tests C-V2X OBUs outperformed DSRC OBUs by a significant margin. The test results indicate gains in terms of RF range for Cellular-V2X compared to DSRC. Under varying radio environment conditions (LOS, NLOS, and interference) the field tests have shown that Cellular-V2X has 1.3 to 2.9x times the range advantage over DSRC. The LOS advantage was 1.7x the range, however, the improvements rose to 2.2 times the advantage in some NLOS conditions involving signal obstruction. With the interference in close proximity, the improvement in range with the U-NII-3 interferer was 1.7 times while the improvement with the adjacent DSRC interferer was 2.9 times. Table 35 and Table 36 summarize the range comparison of the two technologies.
Table 35: Range Comparison between DSRC and C-V2X for at 5 dBm Effective Transmit Power (at SV for MV approaching)
Test Procedure Range in (m) at 90% reliability
DSRC C-V2X
Line-of-Sight (LOS) Range 625 1050
Non-Line-of Sight (NLOS) Blocker (5GAA) 250/350 450 Non-Line-of-Sight (NLOS) Blocker (CAMP) 175/250 550
Table 36: Range Comparison between DSRC and C-V2X for at 11 dBm Transmit Power (at SV for MV approaching)
Test Procedure Range in (m) at 90% reliability
DSRC C-V2X
Line-of-Sight (LOS) Range 925 >1350**
Non-Line-of Sight (NLOS) Blocker (5GAA) 425 625/725
Non-Line-of-Sight (NLOS) Intersection 90/400 600/800
Co-existence with Wi-Fi 80 MHz Bandwidth in UNII-3 550 950
Co-existing of V2X with Adjacent DSRC Carrier 100/325 950
* First drop below 90% PRR
** C-V2X range >1350m since we reached the end of the track

110 5GAA P-190033
5GAA
9 Conclusion and Next Steps Ford and Qualcomm performed a series of V2V RF tests from March 2018- September 2018, with the goal of comparing two V2X RF technologies, namely DSRC and C-V2X, under the same RF conditions and using the same in-vehicle integration setup. The tests were performed in both laboratory and field environments and follow closely 5GAA test procedure methodology. Due to a discrepancy discovered in DSRC device configuration in the original test report, retesting of identified test cases [Refer to Annex D] was done in March 2019, and the updated results have been published in this report.
The test results indicate gains in terms of RF range for C-V2X compared to DSRC. The lab tests have shown significant link budget gain for C-V2X compared to DSRC. Under varying radio environment conditions (LOS, NLOS, and interference) the field tests have shown that C-V2X has a 1.3x-2.9x range advantage over DSRC. The LOS advantage was 1.7x, however, the improvements rose to 2.2x in more realistic NLOS conditions involving signal obstruction. With the interference in close proximity the improvement in range with U-NII-3 interferer was 1.7x while the improvement with the adjacent DSRC interferer was 2.9x.
Both C-V2X and DSRC exhibited similar end-to-end application layer latencies under non-congested conditions, and both technologies met the latency requirements for the V2V safety applications defined in SAE J2945/1. Inter-packet gap performance was within 10 ms for both V2X technologies, typically increasing very quickly when the devices went out of range. Only C-V2X technology was tested for a highly congested scenario in a laboratory setting. Even in the congested scenario, C-V2X latency remained bounded by the 100ms latency budget configured for that scenario.
As previously noted, the first tests as well as the latest tests were done with pre-commercial software for C-V2X, due to non-availability of commercial software at the time of testing. The commercial software is expected to produce better performance compared to the pre-commercial software. On the other hand, the DSRC devices were commercial devices. As a follow-up to the testing and results presented in this report we are preparing for the next phase that will involve doing more tests using the commercial software for C-V2X. The planning is underway for such tests.

111 5GAA P-190033
5GAA
Annex A: Supplemental Lab Interference Tests
A.1 Interference Lab Test
A.1.1 Cabled Transmission and Reception Test with Simulated External Interference: Flat Characteristics, Constant in Time, Occupying Part of ITS Channel (e.g., Channel 172)
A.1.1.1 Background This test analyzes robustness to external interference which has flat spectrum density, varying bandwidths, and is constant in time.
The goal is to verify that C-V2X devices can transmit and receive C-V2X messages over the PC5 interface with an interference model being applied between the transmit and receive C-V2X devices to simulate potential external interference in the system with pre-defined characteristics.
A.1.1.2 Assumptions The operating system time of the transmitter and receiver boxes is synchronized to a common clock (e.g., GPS) with an error of no more than 1 ms.
The testing environment is isolated from other external interference sources.
Tests should be conducted at room temperature (21 degrees Celsius +/- 5 degrees).
A.1.1.3 Setup This test uses a lab cabled setup as Figure 77 shows. Signal generators (1, 2, and 3) model different characteristics of potential interference in a 10-MHz channel bandwidth. Device 2 (receiver, Rx), also known as DUT, is configured to receive data from Device 1 (Tx) on the same impaired channel.
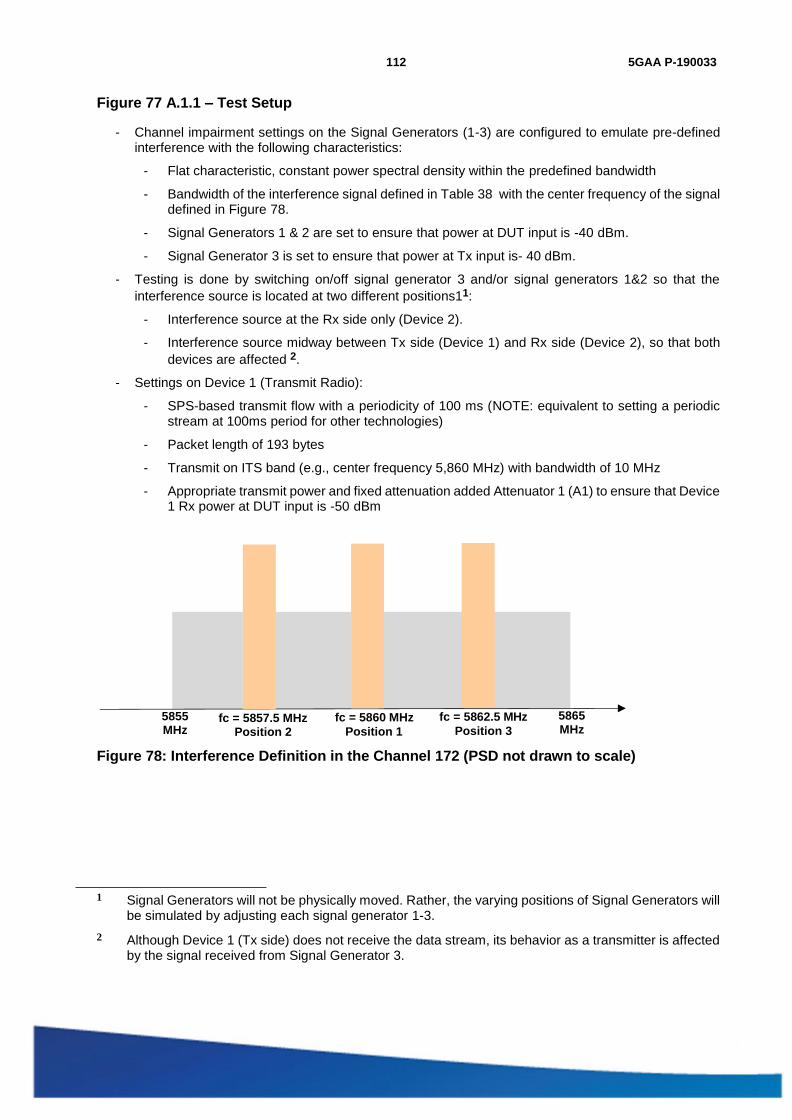
112 5GAA P-190033
5GAA
Figure 77 A.1.1 – Test Setup
- Channel impairment settings on the Signal Generators (1-3) are configured to emulate pre-defined interference with the following characteristics:
- Flat characteristic, constant power spectral density within the predefined bandwidth
- Bandwidth of the interference signal defined in Table 38 with the center frequency of the signal defined in Figure 78.
- Signal Generators 1 & 2 are set to ensure that power at DUT input is -40 dBm.
- Signal Generator 3 is set to ensure that power at Tx input is- 40 dBm.
- Testing is done by switching on/off signal generator 3 and/or signal generators 1&2 so that the interference source is located at two different positions11:
- Interference source at the Rx side only (Device 2).
- Interference source midway between Tx side (Device 1) and Rx side (Device 2), so that both devices are affected 2.
- Settings on Device 1 (Transmit Radio):
- SPS-based transmit flow with a periodicity of 100 ms (NOTE: equivalent to setting a periodic stream at 100ms period for other technologies)
- Packet length of 193 bytes
- Transmit on ITS band (e.g., center frequency 5,860 MHz) with bandwidth of 10 MHz
- Appropriate transmit power and fixed attenuation added Attenuator 1 (A1) to ensure that Device 1 Rx power at DUT input is -50 dBm
Figure 78: Interference Definition in the Channel 172 (PSD not drawn to scale)
1 Signal Generators will not be physically moved. Rather, the varying positions of Signal Generators will be simulated by adjusting each signal generator 1-3.
2 Although Device 1 (Tx side) does not receive the data stream, its behavior as a transmitter is affected by the signal received from Signal Generator 3.
5855 MHz
fc = 5857.5 MHz Position 2
fc = 5860 MHz fc = 5862.5 MHz
Position 1 Position 3
5865 MHz

113 5GAA P-190033
5GAA
- Settings on the Device 2 (Receive Radio):
- Configured to receive on ITS band (e.g., center frequency 5,860 MHz) with bandwidth of 10 MHz
- All measurements of receiving side performance are done on this device.
- Data Collection at Tx (Device 1):
- OS timestamp for each transmitted packet
- Sequence number of each transmitted packet
- Data Collection at Rx (Device 2):
- OS timestamp for each received packet
- Sequence number of each received packet
- Receive signal power for each received packet
Table 37: Device Configuration
Configuration C-V2X DSRC
Number of samples 1000, 10000 1000, 10000
Interference signal External AWGN source External AWGN source
Table 38: Interference Characterization Definition
Signal Generator Setting
Interference Bandwidth (MHz) Position Numbers Number of Iterations
0.2 1, 2, 3 1
0.5 1, 2, 3 1
1 1, 2, 3 1
2 1, 2, 3 1
5 1, 2, 3 1
A.1.1.4 Test Execution NOTE: Tests should be conducted at room temperature (21 degrees Celsius +/- 5 degrees).
1. Configure the Transmit Device (Device 1) with the data stream of interest: Application layer message (e.g., BSM) to be sent periodically every 100 ms. Packet length shall reflect a one-to-one correspondence between packet and message; the packet size should remain constant throughout the test.
2. Set the Signal Generator to produce zero power.
3. Set Attenuator 1 (A1) to an attenuation value such that the receive signal power measured at DUT input is -50 dBm.
4. Set the transmit power for the Transmit device (Device 1) to zero (e.g., by turning the device off).
5. Configure the Signal Generators 1, 2, and 3 to generate a pre-defined interference of 200-kHz bandwidth with center frequency defined in Table 38 as position 1.
6. Adjust levels of Signal Generators 1, 2 and 3 according to the first row of Table 39.

114 5GAA P-190033
5GAA
Table 39: Interference Source Position Settings
Interference Source Position Settings
Interference Source Signal Generator 1 & 2 Signal Generator 3
Interference source is close to Rx device (Device 2). Tx device (Device 1) is minimally impacted by interference source.
Setting to achieve that interference power at DUT input is 10dB above Device 1 power at DUT input.
Interference source is close to Rx device (Device 2). Tx device (Device 1) is minimally impacted by interference source.
I.e. receive signal power (of Signal Generators) measured at DUT input is -40 dBm.
Off I.e. receive signal power (of Signal Generators) measured at DUT input is -40 dBm.
7. Enable transmission of the Transmit device (Device 1).
8. For each test run, record a log file of the following statistics:
- For Device 1: OS timestamp for each Tx packet, sequence number of each Tx packet.
- For DUT: OS timestamp for each Rx packet, sequence number of each Rx packet, receive signal power for each Rx packet.
9. Repeat step 8 for a total of “n” iterations, according to column “Number of Iterations” of Table 38.
10. Repeat steps 5 through 9 for interference on position 2 from Figure 78, (i.e., in step 6 use the center frequency defined in Figure 78 as position 2.)
11. Repeat steps 5 through 10 for interference on position 3 from Figure 78, (i.e., in step 6 use the center frequency defined in Figure 78 as position 3.)
12. Repeat steps 5 through 11 for all bandwidth sizes from Table 38, (i.e., in step 6 use the bandwidth from column “Interference Bandwidth” from the next row of Table 38).
13. Repeat steps 5 through 12 for the second set of interference source position settings, (i.e., in step 7 set the attenuation values on Attenuator 1 and Attenuator 2 according to the second row of Table 38.)
A.1.1.5 Unique Tests to be Conducted Run this test using:
Two (2) C-V2X devices for the test
A.1.1.6 Required Documentation Using the data collected from log files, or observed from any OBU user interface, fill in Table 40.

115 5GAA P-190033
5GAA
Table 40: C-V2X Results
Signal Generator Setting – Interference Bandwidth (MHz)
Signal Generator Setting – Position (i.e. Interference Center Frequency (1, 2, or 3)
SigGen Location (“Rx” = close to Rx device; “Mid” = halfway between Tx and Rx Devices)
No. of Transmitted pkts (summed across all 60- second iterations)
No. of Received pkts (summed across all 60-second iterations) PER %
95th Percentile IPG (ms)
95th Percentile Latency (ms)
Measured at Tx Device
Measured at Rx Device
Calculated at Rx Device
Calculated at Rx Device
Calculated at Rx Device
0.2 1 Rx 1000 999 0.1 106 32
0.2 2 Rx 10000 2855 71.45 n\a* n\a*
0.2 3 Rx 1000 1000 0 108 26
0.5 1 Rx 1000 1000 0 108.5 24
0.5 2 Rx 10000 2875 71.25 n\a* n\a*
0.5 3 Rx 1000 1000 0 106 22
1 1 Rx 1000 999 0.1 107 24
1 2 Rx 10000 2443 75.57 n\a* n\a*
1 3 Rx 1000 998 0.2 106 23
2 1 Rx 10000 8197 18.03 n\a* n\a*
2 2 Rx 10000 47 99.53 n\a* n\a*
2 3 Rx 1000 999 0.1 108 24
5 1 Rx 1000 0 100 n\a* n\a*
5 2 Rx 10000 0 100 n\a* n\a*
5 3 Rx 1000 996 0.4 108 24
0.2 1 Mid 1000 995 0.5 108 23
0.2 2 Mid 1000 1000 0 106 23
0.2 3 Mid 1000 999 0.1 105 22
0.5 1 Mid 1000 1000 0 107 22
0.5 2 Mid 1000 1000 0 107 22
0.5 3 Mid 1000 1000 0 105 23
1 1 Mid 1000 0 0 107 23
1 2 Mid 1000 1000 0 107 23
1 3 Mid 1000 1000 0 105 23
2 1 Mid 1000 7444 25.56 n\a* n\a*
2 2 Mid 1000 1000 0 107 27
2 3 Mid 1000 1000 0 107 22
5 1 Mid 1000 0 100 n\a* n\a*
5 2 Mid 1000 997 0.3 108 25
5 3 Mid 1000 1000 0 107 22 n\a* - Latency and IPG are shown only in scenarios where PER is < 10%

116 5GAA P-190033
5GAA

117 5GAA P-190033
5GAA
Table 41: DSRC Results
Signal Generator Setting – Interference Bandwidth (MHz)
Signal Generator Setting – Position (i.e. Interference Center Frequency (1, 2, or 3)
SigGen Location (“Rx” = close to Rx device; “Mid” = halfway between Tx and Rx Devices)
No. of Transmitted pkts (summed across all 60- second iterations)
No. of Received pkts (summed across all 60-second iterations) PER %
95th Percentile IPG (ms)
95th Percentile Latency (ms)
Measured at Tx Device
Measured at Rx Device
Calculated at Rx Device
Calculated at Rx Device
Calculated at Rx Device
0.2 1 Rx 1000 0 100 n\a n\a
0.2 2 Rx 1000 0 100 n\a n\a
1 1 Rx 1000 0 100 n\a n\a
1 2 Rx 1000 0 100 n\a n\a
5 1 Rx 1000 0 100 n\a n\a
5 2 Rx 1000 0 100 n\a n\a
0.2 1 Mid 1000 0 100 n\a n\a
0.2 2 Mid 1000 0 100 n\a n\a
1 1 Mid 1000 0 100 n\a n\a
1 2 Mid 1000 0 100 n\a n\a
5 1 Mid 1000 0 100 n\a n\a
5 2 Mid 1000 0 100 n\a n\a
The DSRC system did not receive any data packages while the interfering signal was present. For that reason, latency and IPG time calculation is not possible at receiving side. This is marked “n\a” in Table 41.
When the disturbing signal is injected closer at the Rx device (case “Rx”), poor SNR ratio is the main root cause for failing. If injected halfway between Tx and Rx and therefore also disturbing Tx is noticeable (case “Mid”), Clear Channel Assessment (CCA) of Wi-fi technology can make the transmitter hold off sending data packages or send them with a delay (after the interferer is gone).
C-V2X vs DSRC Comparison
Interferer
5855 fc = 5857.5 MHz fc = 5860 MHz fc = 5862.5 MHz 5865 MHz Position 2 Position 1 Position 3 MHz
C-V2X 10MHz band (PSD not drawn to scale)

118 5GAA P-190033
5GAA
Figure 79: When Interferer is at Position 1
Figure 80: C-V2X vs DSRC Comparison Plot When Interferer is at Position 1
Interferer
C-V2X 10MHz band (PSD not drawn to scale)
Figure 81: When Interferer is at Position 2
5855 MHz
fc = 5857.5 MHz fc = 5860 MHz fc = 5862.5 MHz Position 2 Position 1 Position 3
5865 MHz
Interferer at Position 1
C-V2X PER %(Interferer at Rx)
DSRC PER %(Interferer at Rx)
C-V2X PER %(Interferer at Tx and Rx)
DSRC PER %(Interferer at Tx and Rx)
100
90
80
70
60
50
40
30
20
10
0
0.2 MHz 0.5 MHz 1 MHz
Interferer Bandwidth
2 MHz 5 MHz
PER
(%
)
PER
(%
)
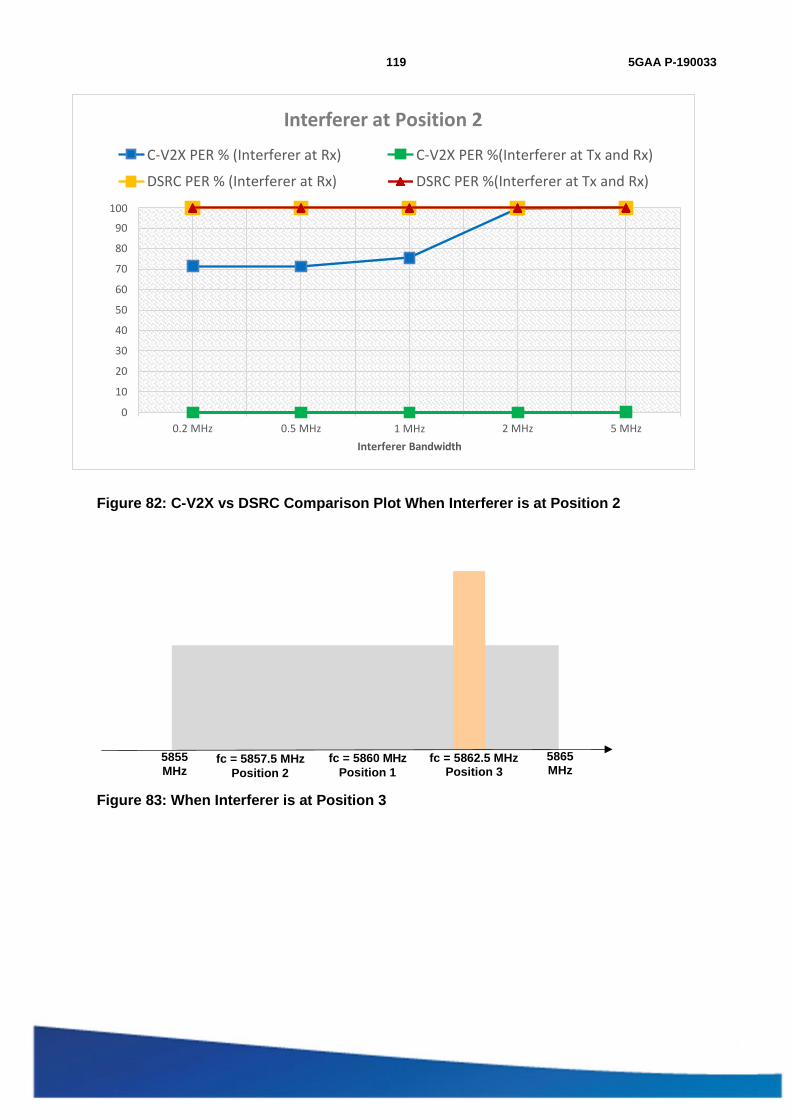
119 5GAA P-190033
5GAA
Figure 82: C-V2X vs DSRC Comparison Plot When Interferer is at Position 2
Figure 83: When Interferer is at Position 3
5 MHz 2 MHz 1 MHz
Interferer Bandwidth
0.5 MHz 0.2 MHz
100
90
80
70
60
50
40
30
20
10
0
C-V2X PER %(Interferer at Tx and Rx)
DSRC PER %(Interferer at Tx and Rx)
C-V2X PER % (Interferer at Rx)
DSRC PER % (Interferer at Rx)
Interferer at Position 2
5855
MHz fc = 5857.5 MHz fc = 5860 MHz
Position 2 Position 1
fc = 5862.5 MHz Position 3
5865 MHz
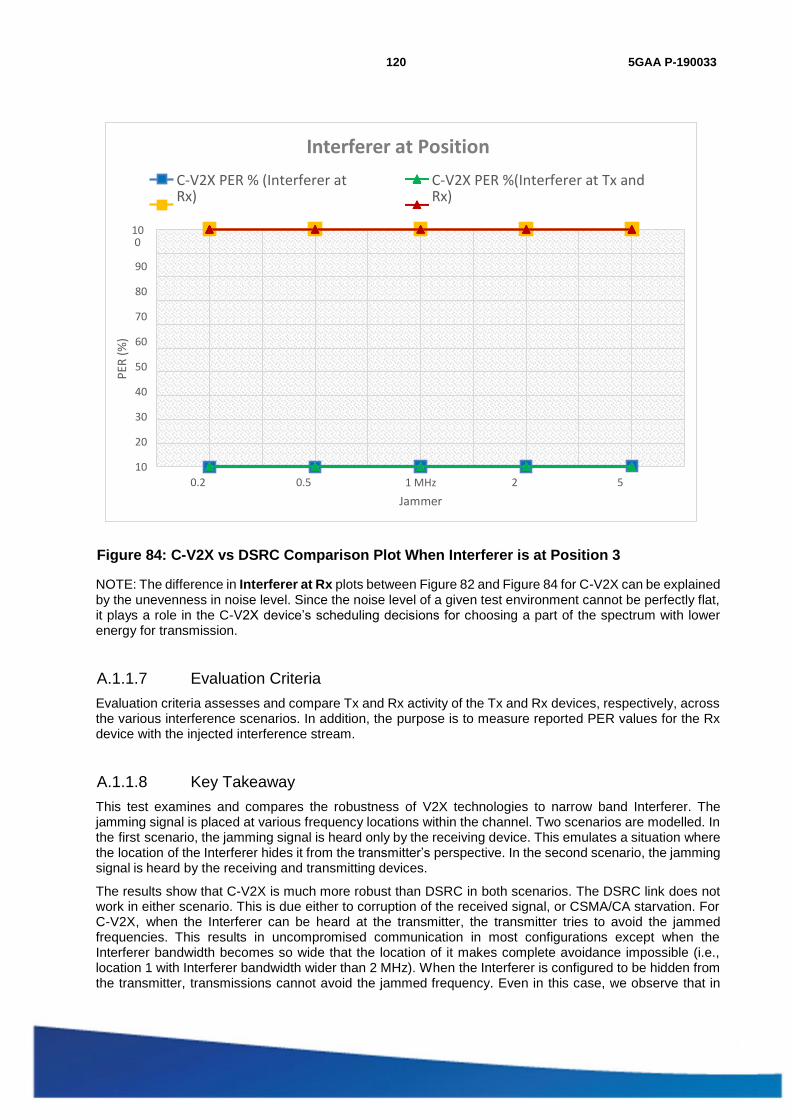
120 5GAA P-190033
5GAA
Figure 84: C-V2X vs DSRC Comparison Plot When Interferer is at Position 3
NOTE: The difference in Interferer at Rx plots between Figure 82 and Figure 84 for C-V2X can be explained by the unevenness in noise level. Since the noise level of a given test environment cannot be perfectly flat, it plays a role in the C-V2X device’s scheduling decisions for choosing a part of the spectrum with lower energy for transmission.
A.1.1.7 Evaluation Criteria Evaluation criteria assesses and compare Tx and Rx activity of the Tx and Rx devices, respectively, across the various interference scenarios. In addition, the purpose is to measure reported PER values for the Rx device with the injected interference stream.
A.1.1.8 Key Takeaway This test examines and compares the robustness of V2X technologies to narrow band Interferer. The jamming signal is placed at various frequency locations within the channel. Two scenarios are modelled. In the first scenario, the jamming signal is heard only by the receiving device. This emulates a situation where the location of the Interferer hides it from the transmitter’s perspective. In the second scenario, the jamming signal is heard by the receiving and transmitting devices.
The results show that C-V2X is much more robust than DSRC in both scenarios. The DSRC link does not work in either scenario. This is due either to corruption of the received signal, or CSMA/CA starvation. For C-V2X, when the Interferer can be heard at the transmitter, the transmitter tries to avoid the jammed frequencies. This results in uncompromised communication in most configurations except when the Interferer bandwidth becomes so wide that the location of it makes complete avoidance impossible (i.e., location 1 with Interferer bandwidth wider than 2 MHz). When the Interferer is configured to be hidden from the transmitter, transmissions cannot avoid the jammed frequency. Even in this case, we observe that in
5 MHz
2 MHz
1 MHz
Jammer Bandwith
0.5 MHz
0.2 MHz
100
90
80
70
60
50
40
30
20
10
C-V2X PER %(Interferer at Tx and Rx)
DSRC PER %(Interferer at Tx and
C-V2X PER % (Interferer at Rx)
DSRC PER % (Interferer at
Interferer at Position 3
PER
(%
)
121 5GAA P-190033
5GAA
many configurations the communication link remains reliable.

5GAA
122 5GAA P-190033
A.1.2 Cabled Transmission and Reception Test with Simulated External Interference: Flat Characteristics, Constant in Time, Starting from Guard Band Occupying Part of Given ITS Channel (e.g., Channel 172)
A.1.2.1 Background This test analyzes robustness to external interference which has flat spectrum density, varying bandwidths, and is constant in time, where the external interference is starting from the guard band of channel 172.
The goal is to verify that C-V2X devices can transmit and receive C-V2X messages over the PC5 interface with an interference model being applied between the transmit and receive C-V2X devices to simulate potential external interference in the system with pre-defined characteristics.
A.1.2.2 Assumptions The operating system time of both the transmitter and receiver boxes is synchronized to a common clock (e.g., GPS) with an error of no more than 1ms.
The testing environment is isolated from other external interference sources.
Tests should be conducted at room temperature (21 degrees Celsius +/- 5 degrees).
A.1.2.3 Setup This test uses a lab cabled setup as shown in Figure 85. Signal generators (1, 2 and 3) are used to model different characteristics of potential interface in a 10-MHz channel bandwidth. Device 2 (receiver, Rx), also known as DUT, is configured to receive data from Device 1 (Tx) on the same impaired channel.
- Channel impairment settings on the Signal Generator (Signal Generators 1-3) are configured to emulate pre-defined interference characterization:
- Flat characteristic, constant power spectral density within the predefined bandwidth
- Bandwidth of the interference signal defined in Table 43 with the center frequency of the signal such that it starts from the edge of the spectrum as shown in Figure 86.
- Signal Generators 1&2 are set to ensure that power at DUT input is -40 dBm.
- Signal Generator 3 is set to ensure that power at Tx input is -40 dBm.
- Testing is done by switching on/off signal generator 3 an/or signal generators 1&2 so that the interference source is located at two different positions 3:
- Interference source at the Rx side only (Device 2)
- Interference source midway between Tx side (Device 1) and Rx side (Device 2), so that both devices are affected4
3 Signal Generators will not be physically moved. Rather, the varying positions of Signal Generators will be simulated by adjusting each signal generator 1-3.
4 Although Device 1 (Tx side) does not receive the data stream, its behavior as a transmitter is affected by the signal received from Signal Generator 3.
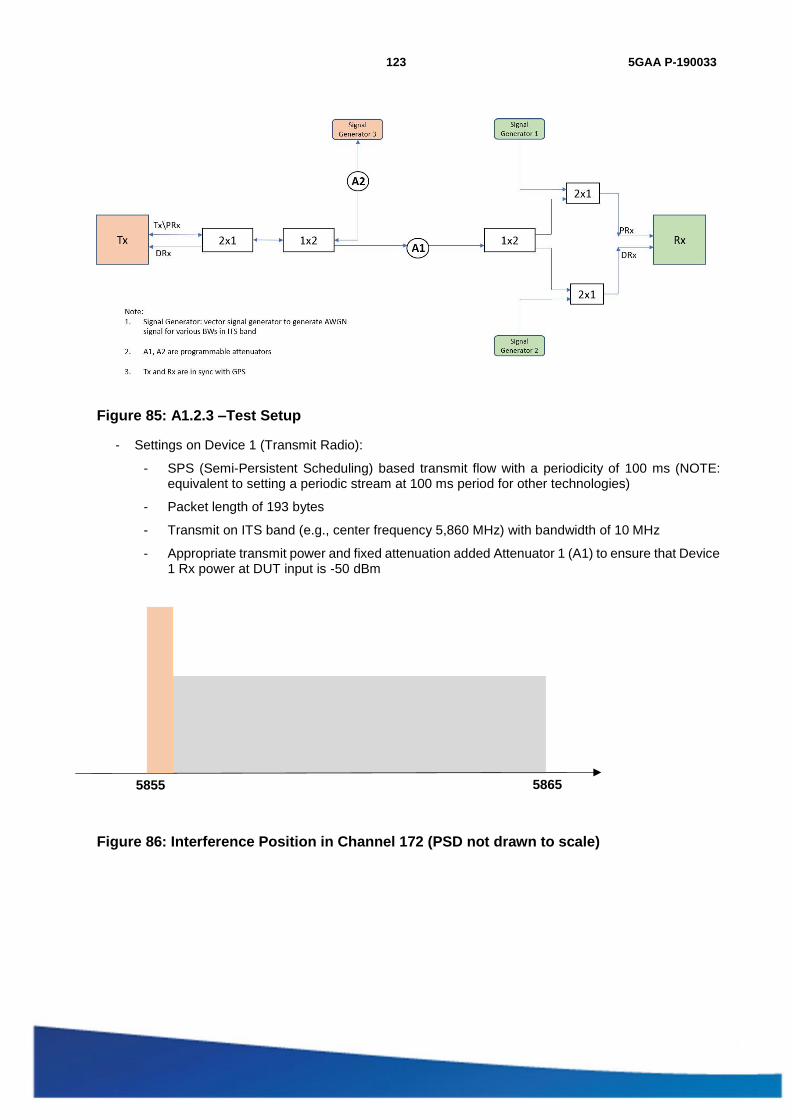
5GAA
123 5GAA P-190033
Figure 85: A1.2.3 –Test Setup
- Settings on Device 1 (Transmit Radio):
- SPS (Semi-Persistent Scheduling) based transmit flow with a periodicity of 100 ms (NOTE: equivalent to setting a periodic stream at 100 ms period for other technologies)
- Packet length of 193 bytes
- Transmit on ITS band (e.g., center frequency 5,860 MHz) with bandwidth of 10 MHz
- Appropriate transmit power and fixed attenuation added Attenuator 1 (A1) to ensure that Device 1 Rx power at DUT input is -50 dBm
Figure 86: Interference Position in Channel 172 (PSD not drawn to scale)
5855 5865

5GAA
124 5GAA P-190033
- Settings on the Device 2 (Receive Radio, Rx):
- Configured to receive on ITS band (e.g., center frequency 5,860 MHz) with bandwidth of 10 MHz
- All measurements of receiving side performance are done on this device.
- Data Collection at Tx (Device 1):
- OS timestamp for each transmitted packet
- Sequence number of each transmitted packet
- Data Collection at Rx (Device 2):
- OS timestamp for each received packet
- Sequence number of each received packet
- Receive signal power for each received packet
Table 42: Test Configuration
Configuration C-V2X DSRC
Number of Samples 1000 1000
Interference Signal External AWGN source External AWGN source
Table 43: Interference Characterization Definition
Signal Generator Setting
Interference Bandwidth [MHz] Number of Iterations
0.05 1
0.1 1
0.2 1
0.3 1
0.4 1
0.5 1
0.6 1
0.7 1
0.8 1
0.9 1
1 1
A.1.2.4 Test Execution NOTE: Tests should be conducted at room temperature (21 degrees Celsius +/- 5 degrees)
1. Configure the Signal Generator 1-3 to generate a pre-defined interference of 50 kHz bandwidth (subsequently referred to as “Interference_Bandwidth") with a center frequency of (5855 MHz + Interference_Bandwidth/2).
2. Adjust levels of Signal Generators 1, 2, and 3 according to the first row of Table 44.
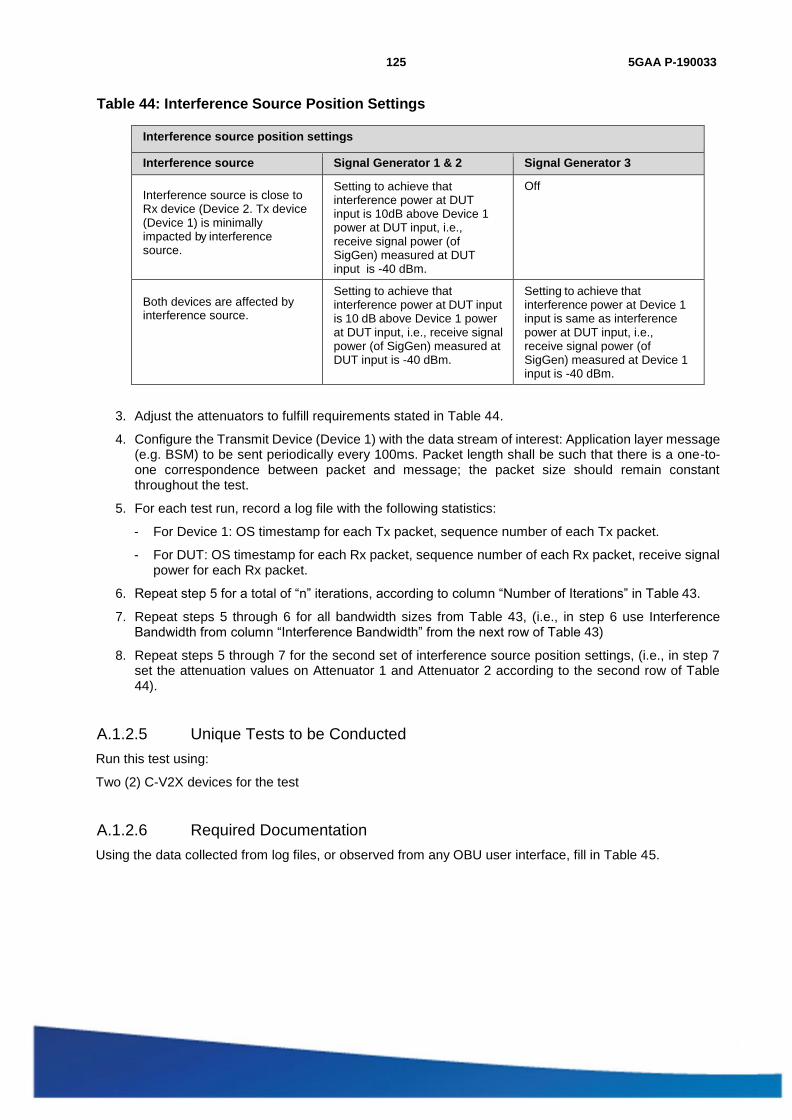
5GAA
125 5GAA P-190033
Table 44: Interference Source Position Settings
Interference source position settings
Interference source Signal Generator 1 & 2 Signal Generator 3
Interference source is close to Rx device (Device 2. Tx device (Device 1) is minimally impacted by interference source.
Setting to achieve that interference power at DUT input is 10dB above Device 1 power at DUT input, i.e., receive signal power (of SigGen) measured at DUT input is -40 dBm.
Off
Both devices are affected by interference source.
Setting to achieve that interference power at DUT input is 10 dB above Device 1 power at DUT input, i.e., receive signal power (of SigGen) measured at DUT input is -40 dBm.
Setting to achieve that interference power at Device 1 input is same as interference power at DUT input, i.e., receive signal power (of SigGen) measured at Device 1 input is -40 dBm.
3. Adjust the attenuators to fulfill requirements stated in Table 44.
4. Configure the Transmit Device (Device 1) with the data stream of interest: Application layer message (e.g. BSM) to be sent periodically every 100ms. Packet length shall be such that there is a one-to-one correspondence between packet and message; the packet size should remain constant throughout the test.
5. For each test run, record a log file with the following statistics:
- For Device 1: OS timestamp for each Tx packet, sequence number of each Tx packet.
- For DUT: OS timestamp for each Rx packet, sequence number of each Rx packet, receive signal power for each Rx packet.
6. Repeat step 5 for a total of “n” iterations, according to column “Number of Iterations” in Table 43.
7. Repeat steps 5 through 6 for all bandwidth sizes from Table 43, (i.e., in step 6 use Interference Bandwidth from column “Interference Bandwidth” from the next row of Table 43)
8. Repeat steps 5 through 7 for the second set of interference source position settings, (i.e., in step 7 set the attenuation values on Attenuator 1 and Attenuator 2 according to the second row of Table 44).
A.1.2.5 Unique Tests to be Conducted Run this test using:
Two (2) C-V2X devices for the test
A.1.2.6 Required Documentation Using the data collected from log files, or observed from any OBU user interface, fill in Table 45.

5GAA
126 5GAA P-190033
Table 45: C-V2X Results
Signal Generator Setting – Interference Bandwidth (MHz)
Signal Generator Setting – Interference Center Frequency (MHz)
SigGen location (“Rx” = close to Rx device; “Mid” = halfway between Tx and Rx devices)
No. of
transmitted
pkts (summed
across all 60-
second
iterations)
No. of received pkts (summed across all 60-second iterations)
PER % 95th
percentile IPG (ms)
95th
percentile Latency (ms)
Measured at Tx device
Measured at Rx device
Calculated at Rx device
Calculated at Rx device
Calculated at Rx device
0.05 5.855025 Rx 1000 1000 0 107.5 21
0.1 5.85505 Rx 1000 1000 0 108 23
0.2 5.8551 Rx 1000 1000 0 107 29
0.3 5.85515 Rx 1000 1000 0 107 22
0.4 5.8552 Rx 1000 1000 0 109 25
0.5 5.85525 Rx 1000 1000 0 107 23
0.6 5.8553 Rx 1000 111 88.9 n\a* n\a*
0.7 5.85535 Rx 1000 159 84.1 n\a* n\a*
0.8 5.8554 Rx 1000 284 71.6 n\a* n\a*
0.9 5.85545 Rx 1000 174 85.3 n\a* n\a*
1 5.8555 Rx 1000 122 87.8 n\a* n\a*
0.05 5.855025 Mid 1000 943 5.7 108 24
0.1 5.85505 Mid 1000 970 3 106 24
0.2 5.8551 Mid 1000 980 2 107 23
0.3 5.85515 Mid 1000 1000 0 106 25
0.4 5.8552 Mid 1000 1000 0 107 22
0.5 5.85525 Mid 1000 1000 0 106 24
0.6 5.8553 Mid 1000 971 2.9 107 23
0.7 5.85535 Mid 1000 1000 0 106.5 41
0.8 5.8554 Mid 1000 1000 0 107 22
0.9 5.85545 Mid 1000 1000 0 108 27
1 5.8555 Mid 1000 1000 0 107 24 n\a* - Latency and IPG are shown only in scenarios where PER is < 10%

5GAA
127 5GAA P-190033
Table 46: DSRC Results
Signal Generator Setting – Interference Bandwidth (MHz)
Signal Generator Setting – Interference Center Frequency (MHz)
SigGen location (“Rx” = close to Rx device; “Mid” = halfway between Tx and Rx devices)
No. of
transmitted
pkts (summed
across all 60-
second
iterations)
No. of received pkts (summed across all 60-second iterations)
PER % 95th percentile IPG (ms)
95th percentile Latency (ms)
Measured at Tx device
Measured at Rx device
Calculated at Rx device
Calculated at Rx device
Calculated at Rx device
0.05 5855.025 Rx 1000 315 68.5 n\a n\a
0.1 5855.05 Rx 1000 423 57.7 n\a n\a
0.2 5855.1 Rx 1000 534 46.6 n\a n\a
0.3 5855.15 Rx 1000 567 43.3 n\a n\a
0.4 5855.2 Rx 1000 522 47.8 n\a n\a
0.5 5855.25 Rx 1000 542 45.8 n\a n\a
0.6 5855.3 Rx 1000 501 49.9 n\a n\a
0.7 5855.35 Rx 1000 522 47.8 n\a n\a
0.8 5855.4 Rx 1000 474 52.6 n\a n\a
0.9 5855.45 Rx 1000 368 63.2 n\a n\a
1 5855.5 Rx 1000 37 96.3 n\a n\a
0.05 5855.025 Mid 1000 0 100 n\a n\a
0.1 5855.05 Mid 1000 1 99.9 n\a n\a
0.2 5855.1 Mid 1000 0 100 n\a n\a
0.3 5855.15 Mid 1000 10 99 n\a n\a
0.4 5855.2 Mid 1000 8 99.2 n\a n\a
0.5 5855.25 Mid 1000 12 98.8 n\a n\a
0.6 5855.3 Mid 1000 42 95.8 n\a n\a
0.7 5855.35 Mid 1000 9 99.1 n\a n\a
0.8 5855.4 Mid 1000 3 99.7 n\a n\a
0.9 5855.45 Mid 1000 1 99.9 n\a n\a
1 5855.5 Mid 1000 0 100 n\a n\a
The DSRC system did not receive any data packages while the interfering signal was present halfway between Tx and Rx (case “Mid”). For that reason, latency and IPG time calculation is not possible at the receiving side. This is marked in Table 46 with “n\a”. Latency and IPG are also marked “n/a” in scenarios where PER is greater than 10%.
When the disturbing signal is inserted closer to the Rx device (case “Rx”), poor SNR ratio is the main root cause for failing. If inserted halfway between Tx and Rx and therefore also noticeably disturbing Tx (case “Mid”), Clear Channel Assessment (CCA) of Wi-fi technology can also make the transmitter hold off sending
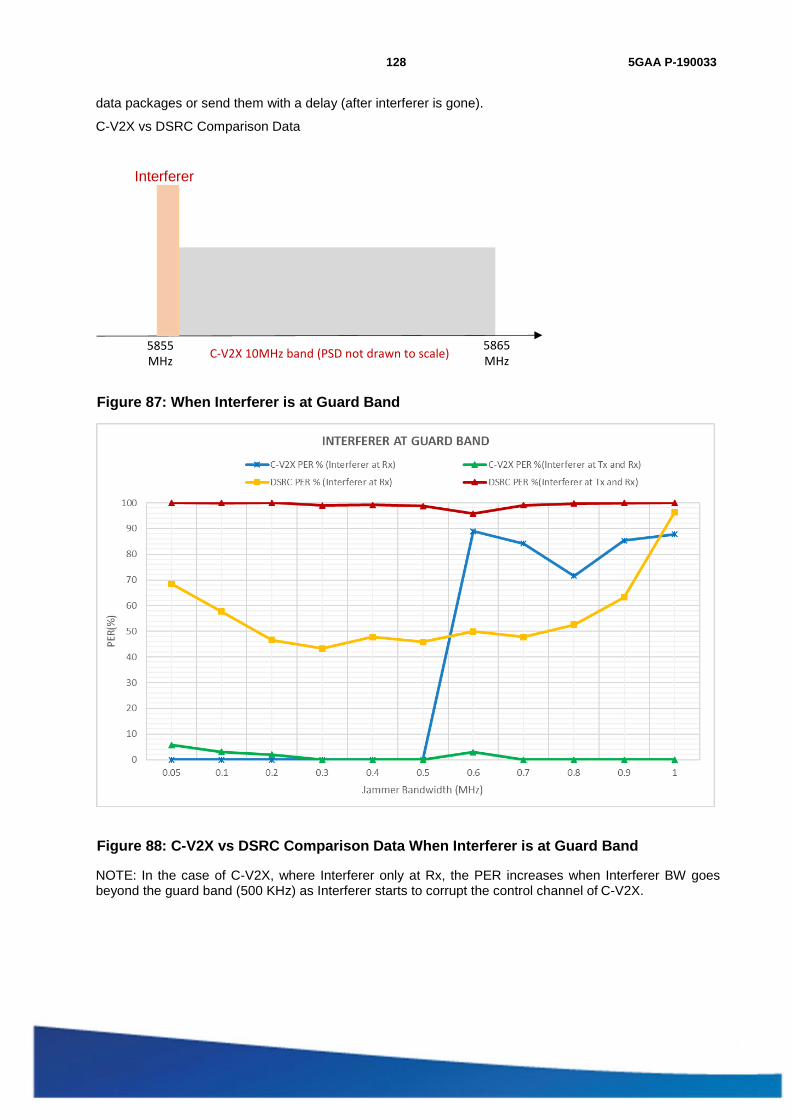
5GAA
128 5GAA P-190033
data packages or send them with a delay (after interferer is gone).
C-V2X vs DSRC Comparison Data
Interferer
Figure 87: When Interferer is at Guard Band
Figure 88: C-V2X vs DSRC Comparison Data When Interferer is at Guard Band
NOTE: In the case of C-V2X, where Interferer only at Rx, the PER increases when Interferer BW goes beyond the guard band (500 KHz) as Interferer starts to corrupt the control channel of C-V2X.
5855 MHz
C-V2X 10MHz band (PSD not drawn to scale) 5865 MHz

129 5GAA P-190033
A.1.2.7 Evaluation Criteria Evaluation criteria assess and compare Tx and Rx activity of the Tx and Rx devices, respectively, across the various interference scenarios. In addition, the purpose is to measure reported PER values for the Rx device with the added interference stream.
A.1.2.8 Key Takeaway This test examines and compares the robustness of V2X technologies against Interferers located in the guard band of the channel. This is an extension of Section A.1.1 with the Interferer moved from within the channel to the guard band.
Like Section A.1.1, we observe that C-V2X is much more robust than DSRC. DSRC link reliability is severely impacted across the board. For C-V2X, if the Interferer can be heard by the transmitter, the communication is uncompromised. Even when the Interferer is not recognized by the transmitter, the link remains reliable until the Interferer bandwidth exceeds 500 kHz.
Annex B: Supplemental Non-Line-of-Sight Field Tests B.1 CAMP Shadowing Test CAMP shadowing tests are described in (USDOT NHTSA, CAMP, September 2011). The test is illustrated in Figure 89. The test is significantly different from the NLOS shadowing test described in Section 8.5.2 that it was important to perform the test for both V2X technologies. The purpose of the test is to assess V2V message exchange capability through obstruction in a highway queue-forming scenario. The same blocker used in the NLOS shadowing test is positioned in the middle of the test track while the MV initial position is at the opposite end of the track from the SV. The MV and the truck move towards the SV at the constant speed of 20 mph and 10 mph, respectively, ensuring that the truck is half the distance between SV and MV at all times.
The objectives of the test are the same as in NLOS tests:
1. Compare communication range and reliability of safety message exchange for C-V2X and DSRC under NLOS conditions with the blocker moving.
2. Compare Inter-Packet Gap (IPG) for both technologies.
The test and system parameters used in these tests are the same as in the Section 8.5.1. The 26-ft U-Haul trucks were used as blockers in all NLOS tests. The test was performed on the same test track as the LOS test, namely Road A at the Fowlerville Proving Grounds (FPG), Fowlerville, Michigan.
Since the blocker is at a large distance from both vehicles its blocking impact is reduced compared to the NLOS shadowing test in Section 8.5.2. We expect that this will be less demanding and will result in a higher range than the NLOS shadowing test with the blocker stationary and in close proximity to the SV.
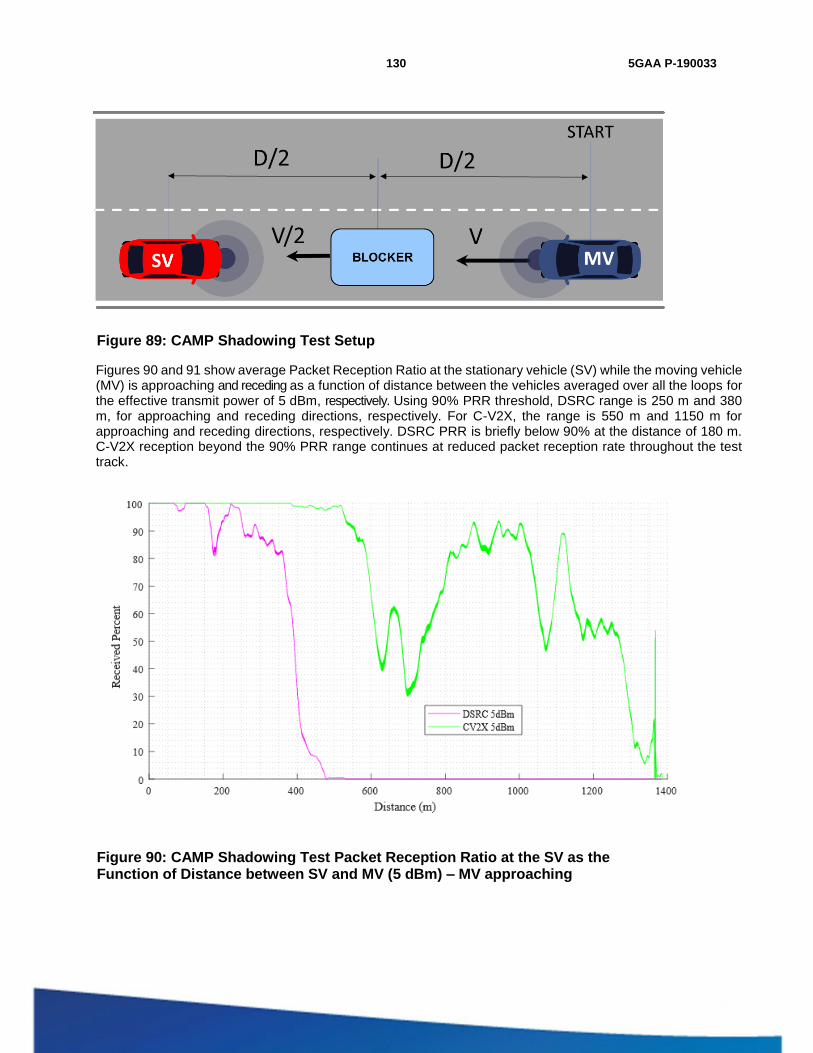
130 5GAA P-190033
Figure 89: CAMP Shadowing Test Setup
Figures 90 and 91 show average Packet Reception Ratio at the stationary vehicle (SV) while the moving vehicle (MV) is approaching and receding as a function of distance between the vehicles averaged over all the loops for the effective transmit power of 5 dBm, respectively. Using 90% PRR threshold, DSRC range is 250 m and 380 m, for approaching and receding directions, respectively. For C-V2X, the range is 550 m and 1150 m for approaching and receding directions, respectively. DSRC PRR is briefly below 90% at the distance of 180 m. C-V2X reception beyond the 90% PRR range continues at reduced packet reception rate throughout the test track.
Figure 90: CAMP Shadowing Test Packet Reception Ratio at the SV as the Function of Distance between SV and MV (5 dBm) – MV approaching
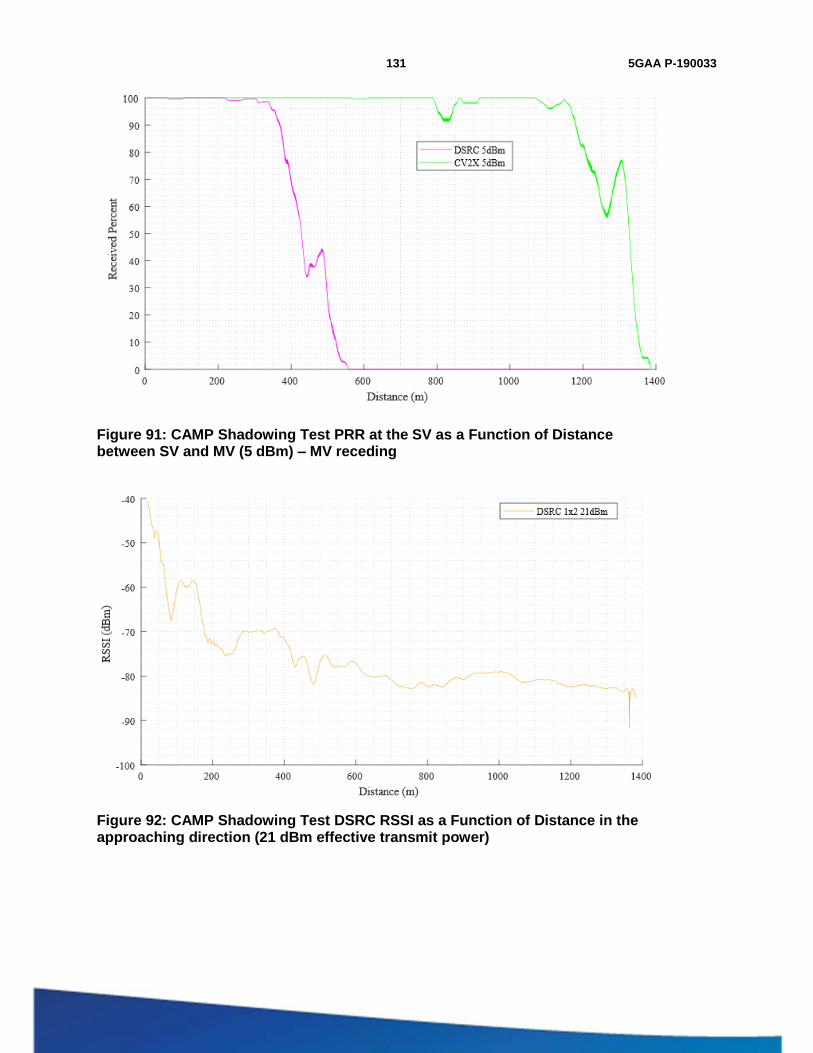
131 5GAA P-190033
Figure 91: CAMP Shadowing Test PRR at the SV as a Function of Distance between SV and MV (5 dBm) – MV receding
Figure 92: CAMP Shadowing Test DSRC RSSI as a Function of Distance in the approaching direction (21 dBm effective transmit power)
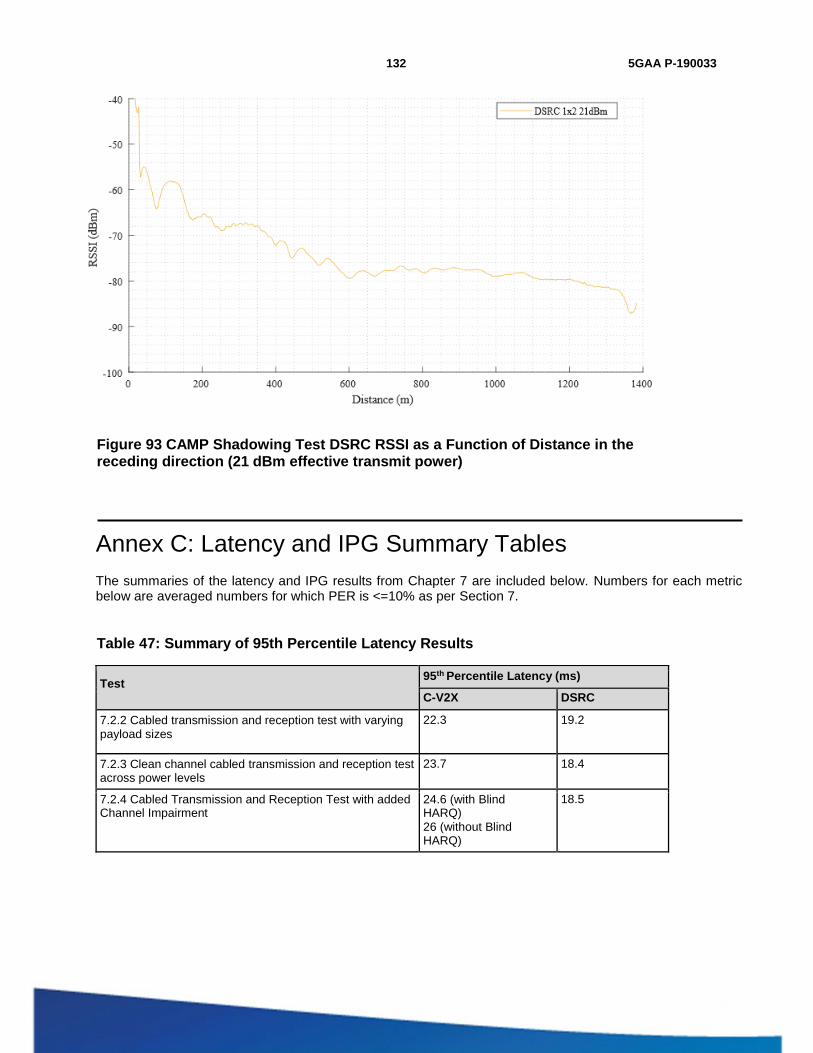
132 5GAA P-190033
Figure 93 CAMP Shadowing Test DSRC RSSI as a Function of Distance in the receding direction (21 dBm effective transmit power)
Annex C: Latency and IPG Summary Tables The summaries of the latency and IPG results from Chapter 7 are included below. Numbers for each metric below are averaged numbers for which PER is <=10% as per Section 7.
Table 47: Summary of 95th Percentile Latency Results
Test 95th Percentile Latency (ms)
C-V2X DSRC
7.2.2 Cabled transmission and reception test with varying payload sizes
22.3 19.2
7.2.3 Clean channel cabled transmission and reception test across power levels
23.7 18.4
7.2.4 Cabled Transmission and Reception Test with added Channel Impairment
24.6 (with Blind HARQ) 26 (without Blind HARQ)
18.5

133 5GAA P-190033
Table 48: Summary of Average Latency Results
Test Average Latency (ms)
C-V2X DSRC
7.2.2 Cabled transmission and reception test with varying payload sizes
14 16.2
7.2.3 Clean channel cabled transmission and reception test across power levels
15 16.6
7.2.4 Cabled Transmission and Reception Test with added Channel Impairment
16.8 (with Blind HARQ) 16.2(without Blind HARQ)
16.3
Table 49: Summary of 95th Percentile IPG Results
Test 95th Percentile IPG (ms)
C-V2X DSRC
7.2.2 Cabled transmission and reception test with varying payload sizes
105.7 105.8
7.2.3 Clean channel cabled transmission and reception test across power levels
106.5 104.2
7.2.4 Cabled Transmission and Reception Test with added Channel Impairment
122.1 (with Blind HARQ) 127.8 (without Blind HARQ)
127.7
Table 50: Summary of Average IPG Results
Test Average IPG (ms)
C-V2X DSRC
7.2.2 Cabled transmission and reception test with varying payload sizes
100 100
7.2.3 Clean channel cabled transmission and reception test across power levels
102.7 95.7
7.2.4 Cabled Transmission and Reception Test with added Channel Impairment
101.6 (with Blind HARQ) 101.8 (without Blind HARQ)
97.1
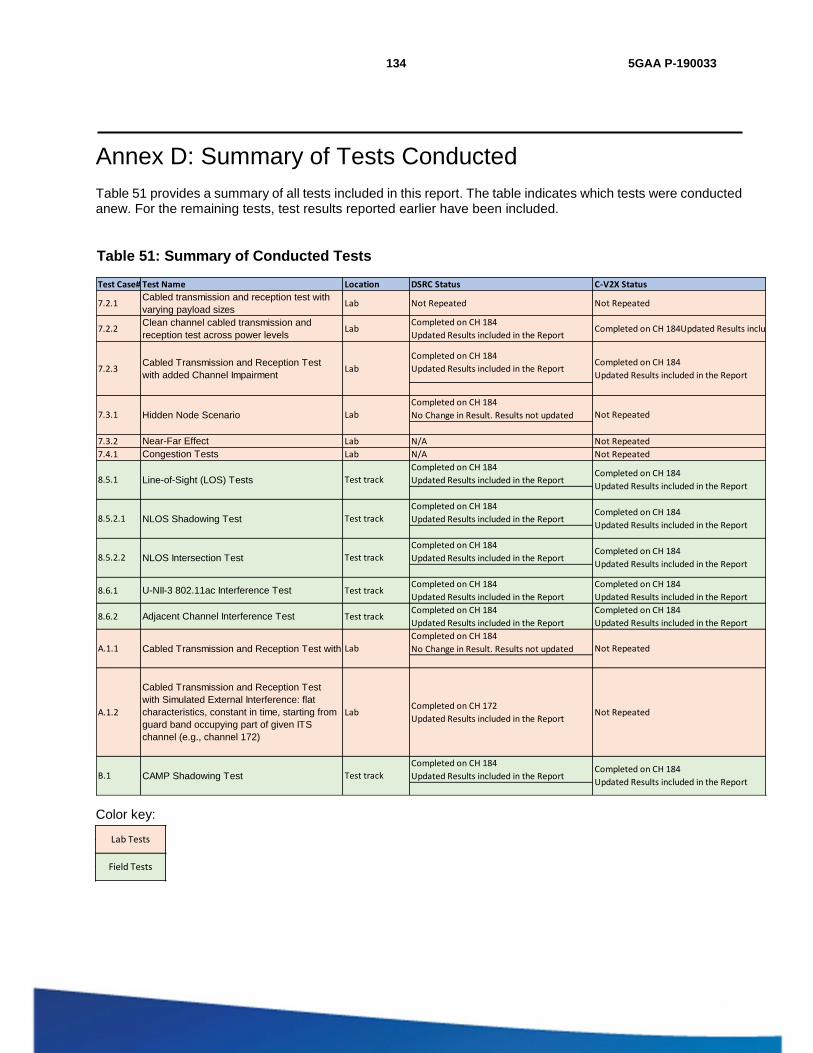
134 5GAA P-190033
Annex D: Summary of Tests Conducted Table 51 provides a summary of all tests included in this report. The table indicates which tests were conducted anew. For the remaining tests, test results reported earlier have been included.
Table 51: Summary of Conducted Tests
Color key:
Test Case# Test Name Location DSRC Status C-V2X Status
7.2.1Cabled transmission and reception test with varying payload sizes Lab Not Repeated Not Repeated
Completed on CH 184
Updated Results included in the Report
Completed on CH 184
No Change in Result. Results not updated
7.3.2 Near-Far Effect Lab N/A Not Repeated
7.4.1 Congestion Tests Lab N/A Not Repeated
Completed on CH 184
Updated Results included in the Report
Completed on CH 184
Updated Results included in the Report
Completed on CH 184
Updated Results included in the Report
8.6.1 U-NII-3 802.11ac Interference Test Test trackCompleted on CH 184
Updated Results included in the Report
Completed on CH 184
Updated Results included in the Report
8.6.2 Adjacent Channel Interference Test Test trackCompleted on CH 184
Updated Results included in the Report
Completed on CH 184
Updated Results included in the Report
Completed on CH 184
No Change in Result. Results not updated
Completed on CH 172
Updated Results included in the Report
Completed on CH 184
Updated Results included in the ReportB.1 CAMP Shadowing Test Test trackCompleted on CH 184
Updated Results included in the Report
Completed on CH 184
Updated Results included in the Report
A.1.1 Cabled Transmission and Reception Test with Simulated External Interference: flat characteristics, constant in time, occupying part of ITS channel (e.g., channel 172)Lab Not Repeated
A.1.2
Cabled Transmission and Reception Test with Simulated External Interference: flat characteristics, constant in time, starting from guard band occupying part of given ITS channel (e.g., channel 172)
Lab Not Repeated
8.5.2.1 NLOS Shadowing Test Test trackCompleted on CH 184
Updated Results included in the Report
8.5.2.2 NLOS Intersection Test Test trackCompleted on CH 184
Updated Results included in the Report
7.3.1 Hidden Node Scenario Lab Not Repeated
8.5.1 Line-of-Sight (LOS) Tests Test trackCompleted on CH 184
Updated Results included in the Report
7.2.2Clean channel cabled transmission and reception test across power levels Lab Completed on CH 184 Updated Results included in the Report
7.2.3Cabled Transmission and Reception Test with added Channel Impairment Lab
Completed on CH 184
Updated Results included in the Report
Field Tests
Lab Tests

135 5GAA P-190033
Annex E: 5GAA V2X Test Procedures
The detailed test procedures are documented in TR P-180092.
Double-click the PDF icon to open the document.
Adobe Acrobat
Document
Annex F: Change History
Date Meeting TDoc Subject/Comment
24 October 2018 F2F P-180106 Approved by WG
26 October 2018 F2F P-180106 Approved by Board
25 March 2019 WG3 VC P-190033 (replacing P-180106)
Approved by Board
11 April 2019 Board Call P-190033 (replacing P-180106)
Approved by Board
Addendum to the 5GAA Benchmark Report

1 5GAA P-180106
Addendum to V2X Functional and Performance Test Report;
Test Procedures and Results for 20-MHz Deployment in CH183

2
5GAA
Contents Contents .........................................................................................................................................................2
Foreword ........................................................................................................................................................4
Introduction.....................................................................................................................................................4
1 Scope .......................................................................................................................................................5
2 References ..............................................................................................................................................5
2.1 Standards ......................................................................................................................................5
3 Definitions and Abbreviations ..................................................................................................................6
3.1 Definitions ......................................................................................................................................6
3.2 Abbreviations .................................................................................................................................6
4 Executive Summary .................................................................................................................................8
4.1 Lab test results ..............................................................................................................................8
4.2 Baseline reliability field test results ................................................................................................8
4.3 C-V2X high load interference results .............................................................................................8
5 Device Characterization and Test Equipment .........................................................................................9
5.1 OBUs (Savari MW1000 and Qualcomm Roadrunner platforms)...................................................9
6 Lab Test Procedures and Results ........................................................................................................ 10
6.1 Introduction ................................................................................................................................. 10
6.1.1 Test cases – device characterization ............................................................................... 10
6.1.2 Parameters and setup ...................................................................................................... 11
6.1.3 General guidance on C-V2X RF power management ...................................................... 11
6.2 AWGN lab tests .......................................................................................................................... 11
6.2.1 Clean channel cabled transmission and reception test across power levels ................... 11
7 Field Test Procedures and Results ...................................................................................................... 18
7.1 Introduction ................................................................................................................................. 19
7.2 Hardware setup .......................................................................................................................... 21
7.3 Field test parameters .................................................................................................................. 22
7.4 Presentation of results ................................................................................................................ 23
7.5 Reliability tests ............................................................................................................................ 24
7.5.1 Line-of-Sight (LOS) in CH183 test procedure and results ................................................ 24
7.5.2 Non-Line-of-Sight (LOS) in CH183 test procedure and results ........................................ 29
7.6 High load interference tests ........................................................................................................ 31
7.6.1 High load characterization ................................................................................................ 32
7.6.2 Impact on DSRC safety message traffic in CH172 from C-V2X/DSRC traffic in CH183/CH 182+184: test procedure and results ................................................................................ 36
7.6.3 C-V2X/DSRC traffic in CH183/(CH182+CH184) and DSRC traffic in CH178: test procedure and results ....................................................................................................... 39
7.6.4 C-V2X traffic in CH183 and DSRC traffic in CH180: test procedure and results ............. 46
7.7 Key takeaways ............................................................................................................................ 65
8 Conclusion and Next Steps .................................................................................................................. 65
Annex A: Change History ....................................................................................................................... 66

3
5GAA
Version: 2.0
Date of publication: 06.06.2019
Document type: Technical Report
Confidentiality class: P (Public use)
Reference 5GAA Working Group Working Group 3
Date of approval by 5GAA Board: 31.05.2019
5GAA
Postal address
5GAA c/o MCI Munich
Neumarkter Str. 21
81673 München, Germany
Internet
http://www.5gaa.org
Copyright Notification
No part may be reproduced except as authorized by written permission. The copyright and the foregoing restriction extend to reproduction in all media.

4
Foreword This Technical Report has been produced by 5GAA.
The contents of the present document are subject to continuing work within the Working Groups (WG) and may change following formal WG approval. Should the WG modify the contents of the present document, it will be re-released by the WG with an identifying change of the consistent numbering that all WG meeting documents and files should follow (according to 5GAA Rules of Procedure):
x-nnzzzz
(1) This numbering system has six logical elements:
(a) x: a single letter corresponding to the working group:
where x =
T (Use cases and Technical Requirements)
A (System Architecture and Solution Development)
P (Evaluation, Testbed and Pilots)
S (Standards and Spectrum)
B (Business Models and Go-To-Market Strategies)
(b) nn: two digits to indicate the year. i.e. 16,17,18, etc.
(c) zzzz: unique number of the document
(2) No provision is made for the use of revision numbers. Documents which are a revision of a previous version should indicate the document number of that previous version.
(3) The file name of documents shall be the document number. For example, document S-160357 will be contained in file S-160357.doc
Introduction Recently, 5GAA filed a petition for waiver1 with the FCC requesting that C-V2X be allowed to operate in the upper 20 MHz (5905 MHz – 5925 MHz) of the ITS band in the United States. In support of this petition, 5GAA member companies have performed a series of tests in an attempt to address anticipated technical questions related to the favorable implementation of this petition. This document describes the test procedures and results that were undertaken to support the 5GAA C-V2X FCC petition for waiver in the 5.9 GHz band.
1 https://www.fcc.gov/ecfs/filing/11212224101742

5
1 Scope This document describes tests and results evaluating performance of C-V2X devices operating in the upper 20 MHz of the U.S. ITS band [5,905 MHz - 5,925 MHz], subsequently referred to as CH 183.
These tests were conducted to obtain basic radio KPIs such as packet error rate (PER) or packet reception rate (PRR), latency or application end-to-end delay, and inter-packet gap (IPG).
Equally important, these tests evaluated the impact of the RF interference that may be caused by high utilization in CH 183 by C-V2X devices on DSRC devices operating simultaneously in other non-overlapping channels of the ITS band.
This document describes the test procedures specifically as they were executed in the lab and field environments.
2 References The following documents contain provisions which, through reference in this text, constitute provisions of the present document.
- (5GAA, March 2018) 5GAA TR P-180092, “5G Automotive Association; Working Group Evaluation, test beds and pilots; V2X Functional and Performance Test Procedures – Selected Assessment of Device to Device Communication Aspects”, March 2018.
- (Parsons, 1994), The Mobile Radio Propagation Channel, Halsted Press: a division of John WILEY and SONS, New York-Toronto, 1994.
- (USDOT NHTSA, CAMP, September 2011) Vehicle Safety Communications – Applications (VSC- A): Final Report: Appendix Volume 2 - Communications and Positioning, September 2011, DOT HS 811 492C.
- (SAE J2945/1) On-board Minimum Performance Requirements for V2V Safety Communications, Version 1, March 2016.
- (5GAA Benchmark Test Report)(5GAA Test Report) 5GAA TR P-180106, “V2X Functional and Performance Test Report; Test Procedures and Results”, October 2018. http://5gaa.org/wp-content/uploads/2018/11/P-180106-V2X-Functional-and-Performance-Test-Report_Final_051118.pdf
2.1 Standards - 3GPP TS 36.213 Rel 14, Evolved Universal Terrestrial Radio Access (E-UTRA); Physical layer
procedures.
- 3GPP TS 36.331 Rel 14, Evolved Universal Terrestrial Radio Access (E-UTRA); Radio Resource Control (RRC); protocol specification.
- 3GPP TS 36.301 Rel 14, Evolved Universal Terrestrial Radio Access (E-UTRA); User Equipment (UE) radio transmission and reception.

6
3 Definitions and Abbreviations
3.1 Definitions For the purposes of the present document, the following definitions apply: Approaching: Direction of movement of Moving Vehicle (MV) towards the Stationary Vehicle
(SV)).
MV: Moving Vehicle communicates with the Stationary Vehicle and performs loops on a typically straight stretch of road where the Stationary Vehicle is located.
Receding: Direction of movement of Moving Vehicle away from the Stationary Vehicle.
Reliability: Capability of the communication system to deliver a message with certain likelihood.
RSU: Connected vehicle Roadside Unit that provides wireless communication from roadside infrastructure to the vehicle.
Sensitivity level of a signal: The lowest receive signal level that allows almost error-free reception. Below this level, the packet reception starts to deteriorate.
SV: Stationary vehicle is positioned on one end of the test track and communicates with the Moving Vehicle.
3.2 Abbreviations For the purposes of the present document, the following symbols apply:
3GPP 3G Partnership Project (cellular standard organization) AWGN Additive White Gaussian Noise BLER Block Error Rate BSM Basic Safety Message CAMP Crash Avoidance Metric Partnership CBP Channel Busy Period CBR Channel Busy Ratio CDF Cumulative Distribution Function C-V2X Cellular Vehicle-to-Everything DNPW Do Not Pass Warning DSRC Dedicated Short-Range Communications (IEEE 802.11p) DUT Device Under Test FPG Fowlerville Proving Ground HARQ Hybrid Automatic Repeat Request HV Home Vehicle IEEE Institute of Electrical and Electronics Engineers

7
IPG Inter-Packet Gap ITS Intelligent Transportation Systems ITS Band Frequency band for ITS communications (5.850-5.925 GHz in the US) ITT Inter Transmission Time KPI Key Performance Indicator LOS Line of Sight LTE Long Term Evolution (cellular standard organization) MIMO Multiple Input Multiple Output MV Moving Vehicle NLOS No Line of Sight OBU On-Board Unit OS Operating System PCS Radio interface between two UEs, also known as sidelink PER Packet Error Rate (%) PRB Physical Resource Block PRR Packet Reception Ratio PSCCH Physical Sidelink Control Channel (part of PC5) REF Reference Device RB Resource Block RSS/RSSI Receive Signal Strength Indicator RSU Roadside Unit Rx Receiver SAE Society of Automotive Engineers SG Signal Generator SNR Signal-to-Noise Ratio S-RSSI Sidelink RSSI SPS Semi-Persistent Scheduling SV Stationary Vehicle TTI Transmission Time Interval in 3GPP Tx Transmitter UE User Equipment (device in 3GPP system) U-NII Unlicensed-National Information Infrastructure V2I Vehicle-to-Infrastructure V2N Vehicle-to-Network V2V Vehicle-to-Vehicle V2X Vehicle-to-Everything
8
4 Executive Summary This report presents an extension of the results of comparative V2X benchmark testing in the 10 MHz channel of the 5.9 GHz ITS band. This report presents results of testing C-V2X in 20-MHz wide CH183. This channel has been recently proposed for C-V2X deployment in the ITS band. It is referred to as basic C-V2X Channel and it allows for V2V and V2X messages such as basic safety message (BSM), signal phase and timing (SPaT), signal request message (SRM), signal status message (SSM), and others covered by the Road Safety Message under development in SAE standards. The upper part of the ITS band was chosen to minimize impact to DSRC channels, especially CH172.
The viability of C-V2X in 10 MHz has been demonstrated in the preceding report (5GAA Benchmark Test Report). In that report, C-V2X has been shown to outperform DSRC in terms of reliability, resilience to out-of-band interference and range. This report extends these results by showing that a BSM message sent in 20-MHz CH183 has the same reliability as previously shown in 10-MHz CH184. Both lab and field data included in the report demonstrate consistent results.
An important part of the 20-MHz testing was demonstrating coexistence between C-V2X deployment on CH 183 and the DSRC Basic Safety operation in CH172 as this report shows. This report also assesses the coexistence of C-V2X in channel CH183 with DSRC I2V and V2I communication in CH178 and CH180, respectively. These tests were performed with short DSRC packets. Further tests to assess impact on larger payloads in CH 178 and CH 180 when high load traffic is present in CH 183 may be of interest as a next step. For comparative purposes, DSRC operation in CH182 (10 MHz operation) and CH184 (10 MHz operation) is also employed in the high load interference tests.
4.1 Lab test results The purpose of this controlled lab test was to examine the communication reliability of C-V2X in CH183 (20 MHz) at varying levels of received signal strength and compare it with the corresponding results for C-V2X in CH184 (10 MHz). The lab test has shown that the reliability and inter-packet gap (IPG) for C-V2X short-message transmissions is approximately the same regardless of operating channel bandwidth.
4.2 Baseline reliability field test results Reliability vs. range tests verify the distance at which a V2V technology maintains communication in various scenarios. The test results validated the hypothesis that C-V2X operation in 10-MHz and 20-MHz channels achieve very similar reliability as a function of the distance between the transmitter and the receiver. This confirms the lab tests and extends validation achieved at 10-MHz operations in the 5GAA Benchmark Test Report to the proposed 20-MHz operation in CH183.
4.3 C-V2X high load interference results High load tests should not be viewed as tests of realistic scenarios. However, the tests in this document use these extreme loading conditions to stretch the receiving conditions for an extended time. If performance under these conditions is acceptable, the same is implied for less stringent conditions. In realistic scenarios, the interference at any point would be a result of many transmissions being received from various distances and thus at varying receive powers and would likely be transitory in nature. The significant interference allowed testing for corner cases and capturing results with high statistical confidence.

9
The tests have shown that both C-V2X and DSRC high load traffic in CH183 presents minimal impact to DSRC communications in CH172-CH180 over distance and transmit power levels of practical relevance. All tests were conducted on a 1.4 km test track.
No impact is observed on DSRC basic safety communications in CH172 from C-V2X transmissions in CH183. in LOS Conditions.
No impact is observed on DSRC I2V communications in CH178 from C-V2X transmissions in CH183 in LOS Conditions.
Gradual impact is observed to DSRC I2V and V2I communications in CH180 beyond a range of 1000m in LOS conditions
o The impact from high load C-V2X in CH183 was observed before impact from DSRC operations in CH 182 + CH 184. In both cases impact is only seen beyond a LOS range of 1000m between MV OBU and RSU. 1000m is considered more than adequate range for V2I and I2V applications. It should also be noted that the interference used in this test is unrealistically high for reasons mentioned above. Furthermore, it is observed that the impact from C-V2X transmissions is gradual and does not result in complete loss of communications in CH180. In realistic scenarios, the expected impact is less than what is observed in this test. This test was conducted with the same RSU power as for the OBUs, leaving room for impact reductions on the I2V link if the higher RSU power were to be used.
5 Device Characterization and Test Equipment This chapter describes the devices being used and their characterization. It also describes the test equipment being used.
5.1 OBUs (Savari MW1000 and Qualcomm Roadrunner platforms) Table 1: Savari MW1000 (DSRC)
Component Description
Processor 800 MHz iMX6 Dual Core Memory 2 GB DDR3 DRAM Storage Up to 16 GB Flash Radio Dual DSRC (Qualcomm QCA6584) GPS U-Blox. Tracking Sensitivity: -160 dBm Secure Flash/HSM Infineon SLI97 Operational Temperature -40C to +85C Antenna/GPS Connectors Fakra type Z/C Other Interfaces CAN, 2 USB, MicroSD, Serial, Ethernet Standards Compliance 802.11p, IEEE 1609.x and SAE J2735 (2015), J2945 Security 1609.2, IPSec and SSL Enclosure 140 x 133 x 42 (L x W x H)

10
Table 2: Qualcomm Roadrunner (C-V2X)
Component Description
Processor Automotive Snapdragon820 (APQ8996) and 1200 MHz ARM A7 (in MDM9150)
Memory 2 GB (APQ) Storage 64 GB + 2 GB, microSD slot Radio PC5 Mode 4 (Qualcomm MDM9150)
GNSS Multi-constellation Qualcomm QDR3 Dead Reckoning XTRA + Time injection
Secure Flash HSM Infineon HSM SLI97 Operational Temperature -40C to +85C Antenna/GPS Connectors Quad Fakra
Other Interfaces USB 3.0 OTG, USB Host, 3x 1 Mbps CAN, 1000BT Ethernet, RS232
Standards Compliance 3GPP Rel 14, IEEE 1609.3 (not used), ETSI ITS G5 (not used), SAE J2735, SAE J3161 (draft)
Security IEEE 1609.2 (via Savari and on-board security)
Other Radios Automotive QCA6574AU - Wi-Fi : 2.4 GHz, 802.11n, 2 x 2 - Bluetooth 4.2 + BLE
6 Lab Test Procedures and Results This chapter describes the test procedures and results of lab testing in CH183.
6.1 Introduction
6.1.1 Test cases – device characterization The following sections focus on test cases that characterize the C-V2X device’s basic Rx/Tx performance in a 20MHz channel in a laboratory environment. The tests in this section augment the detailed performance data already presented in (5GAA Benchmark Test Report).
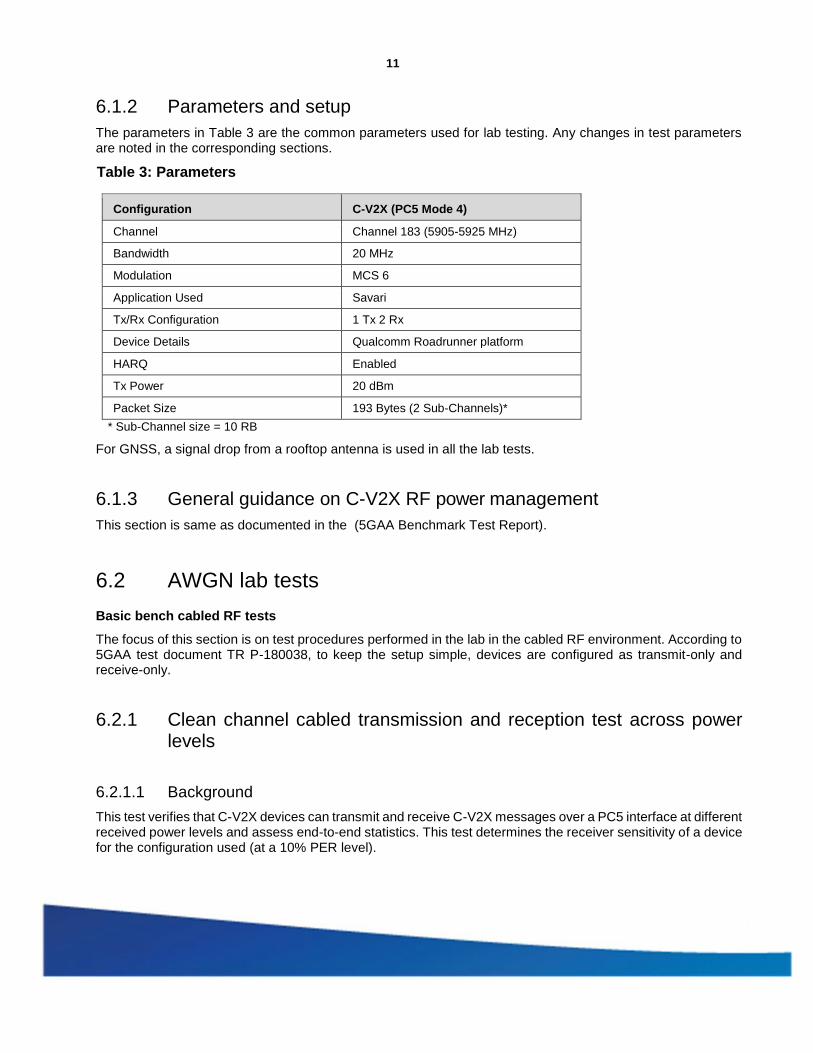
11
6.1.2 Parameters and setup The parameters in Table 3 are the common parameters used for lab testing. Any changes in test parameters are noted in the corresponding sections.
Table 3: Parameters
Configuration C-V2X (PC5 Mode 4)
Channel Channel 183 (5905-5925 MHz)
Bandwidth 20 MHz
Modulation MCS 6
Application Used Savari
Tx/Rx Configuration 1 Tx 2 Rx
Device Details Qualcomm Roadrunner platform
HARQ Enabled
Tx Power 20 dBm
Packet Size 193 Bytes (2 Sub-Channels)* * Sub-Channel size = 10 RB
For GNSS, a signal drop from a rooftop antenna is used in all the lab tests.
6.1.3 General guidance on C-V2X RF power management This section is same as documented in the (5GAA Benchmark Test Report).
6.2 AWGN lab tests Basic bench cabled RF tests
The focus of this section is on test procedures performed in the lab in the cabled RF environment. According to 5GAA test document TR P-180038, to keep the setup simple, devices are configured as transmit-only and receive-only.
6.2.1 Clean channel cabled transmission and reception test across power levels
6.2.1.1 Background This test verifies that C-V2X devices can transmit and receive C-V2X messages over a PC5 interface at different received power levels and assess end-to-end statistics. This test determines the receiver sensitivity of a device for the configuration used (at a 10% PER level).

12
6.2.1.2 Assumptions The operating system (OS) time of the transmitter and receiver boxes is synchronized to the common clock (e.g., GPS) with an error of no more than 1 ms.
6.2.1.3 Setup This test used a lab-cabled setup as shown in Figure 1. A C-V2X (receiver) is configured to receive data from a C-V2X (transmitter) on the ITS band (Channel 183) with a bandwidth of 20 MHz. Each C-V2X OBE was placed in an RF-shielded box to account for possible RF leakage.
Figure 1: Test setup – Clean channel cabled transmission and reception test across power levels
- Settings on the C-V2X Device 1 [Transmit Radio]:
- Application layer configured to generate messages and deliver to the lower layers with 100 ms periodicity.
- Packet length is constant and is set to 193 Bytes.
- Transmit on ITS band with bandwidth of 20 MHz.
- Appropriate transmit power and fixed attenuation added to ensure DUT input of -49 dBm.
- Settings on the C-V2X Device 2 [Receive Radio]
- Configured to receive on ITS Band (e.g., center frequency 5.915 MHz) and bandwidth of 20 MHz.
- Receive radio in C-V2X configured to always be in Rx mode.
- Data Collection at Tx
- OS timestamp for each transmitted packet
- Sequence number of the transmitted packet

13
- Data Collection at Rx
- OS timestamp for each received packet
- Sequence number of the received packet
- Receive signal power for each received packet
- For this test, Tx power is set at 20 dBm
Table 1: Test configuration
Configuration C-V2X PC5 Mode 4)
Channel 5915 MHz (Channel 183)
Bandwidth 20 MHz
Modulation MCS 6
Application Used Savari
Tx/Rx Configuration 1 Tx 2 Rx
Device Details Qualcomm Roadrunner platform
HARQ Enabled
Tx Power 20 dBm
Packet Size (2 Sub-Channels)* * Sub-Channel size = 10 RB
6.2.1.4 Test execution 1. Calibrate the insertion loss between the two devices by setting the attenuator to 0 dB and measure the
loss with both cables connected to the attenuator. This measured value is the fixed insertion loss of the cables and attenuator setup.
2. Transmit power for the transmit device remains constant.
3. Adjust overall path loss (insertion loss plus attenuator value) to 69 dB.
4. Vary the attenuation in steps of 10 dB.
a. Near sensitivity, reduce step size to 1 dB.
b. Continue the test until observed PER is 100%.
5. Record these statistics on the devices for each path loss setting in a log file:
- OS timestamp for each Tx/Rx packet.
- Sequence number of the Tx/Rx packet.
- Receive signal power for each Rx packet.
NOTE: Conduct tests at room temperature (21 deg Celsius +/- 5 deg).
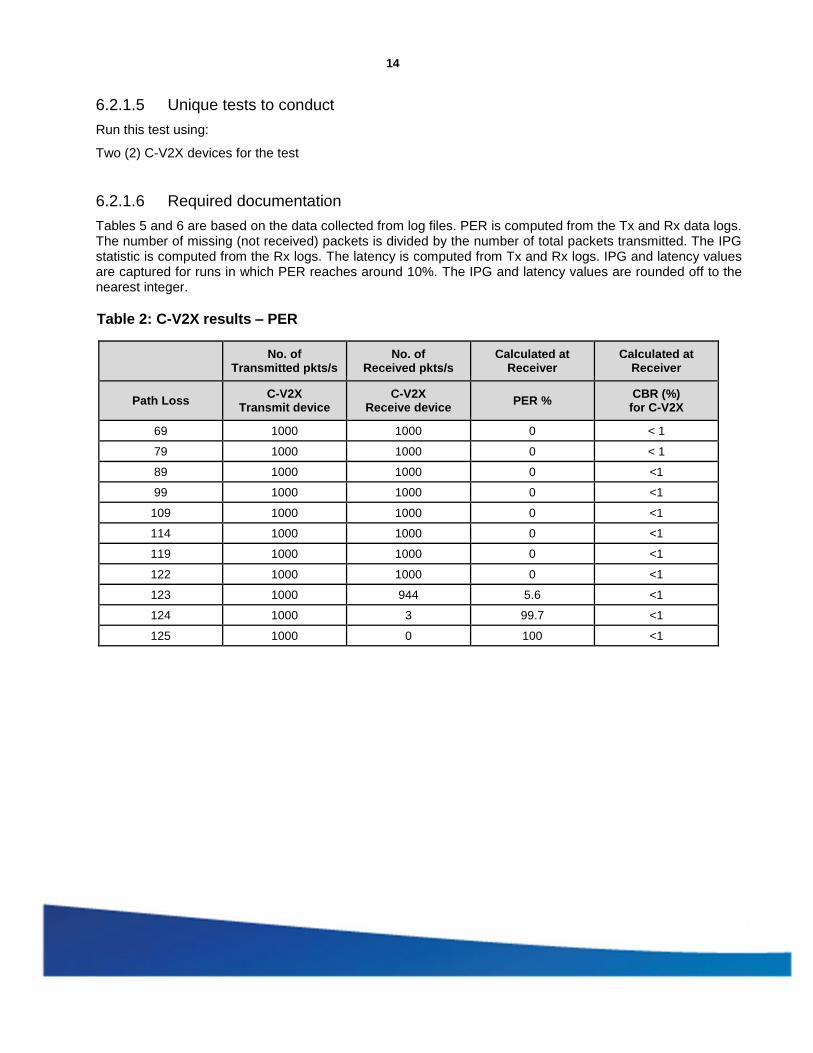
14
6.2.1.5 Unique tests to conduct Run this test using:
Two (2) C-V2X devices for the test
6.2.1.6 Required documentation Tables 5 and 6 are based on the data collected from log files. PER is computed from the Tx and Rx data logs. The number of missing (not received) packets is divided by the number of total packets transmitted. The IPG statistic is computed from the Rx logs. The latency is computed from Tx and Rx logs. IPG and latency values are captured for runs in which PER reaches around 10%. The IPG and latency values are rounded off to the nearest integer.
Table 2: C-V2X results – PER
No. of
Transmitted pkts/s No. of
Received pkts/s Calculated at
Receiver Calculated at
Receiver
Path Loss C-V2X
Transmit device C-V2X
Receive device PER %
CBR (%) for C-V2X
69 1000 1000 0 < 1
79 1000 1000 0 < 1
89 1000 1000 0 <1
99 1000 1000 0 <1
109 1000 1000 0 <1
114 1000 1000 0 <1
119 1000 1000 0 <1
122 1000 1000 0 <1
123 1000 944 5.6 <1
124 1000 3 99.7 <1
125 1000 0 100 <1
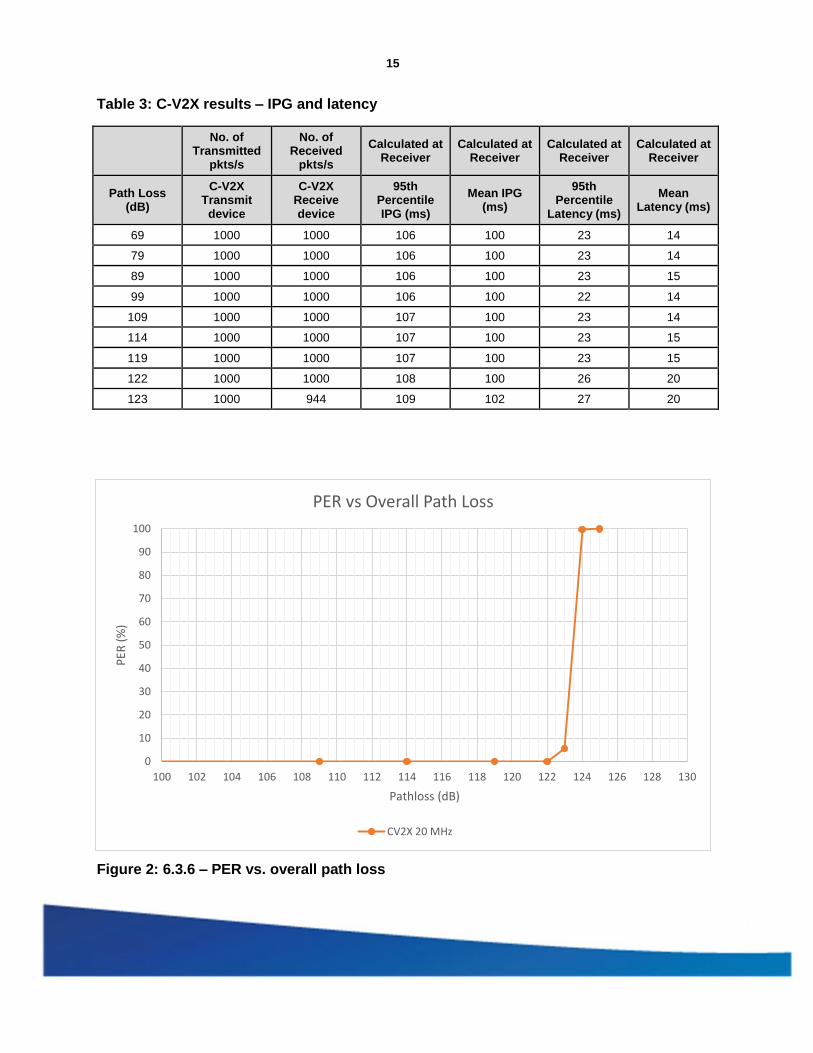
15
Table 3: C-V2X results – IPG and latency
No. of
Transmitted pkts/s
No. of Received
pkts/s
Calculated at Receiver
Calculated at Receiver
Calculated at Receiver
Calculated at Receiver
Path Loss (dB)
C-V2X Transmit
device
C-V2X Receive device
95th Percentile IPG (ms)
Mean IPG (ms)
95th Percentile
Latency (ms)
Mean Latency (ms)
69 1000 1000 106 100 23 14
79 1000 1000 106 100 23 14
89 1000 1000 106 100 23 15
99 1000 1000 106 100 22 14
109 1000 1000 107 100 23 14
114 1000 1000 107 100 23 15
119 1000 1000 107 100 23 15
122 1000 1000 108 100 26 20
123 1000 944 109 102 27 20
Figure 2: 6.3.6 – PER vs. overall path loss
0
10
20
30
40
50
60
70
80
90
100
100 102 104 106 108 110 112 114 116 118 120 122 124 126 128 130
PER
(%
)
Pathloss (dB)
PER vs Overall Path Loss
CV2X 20 MHz
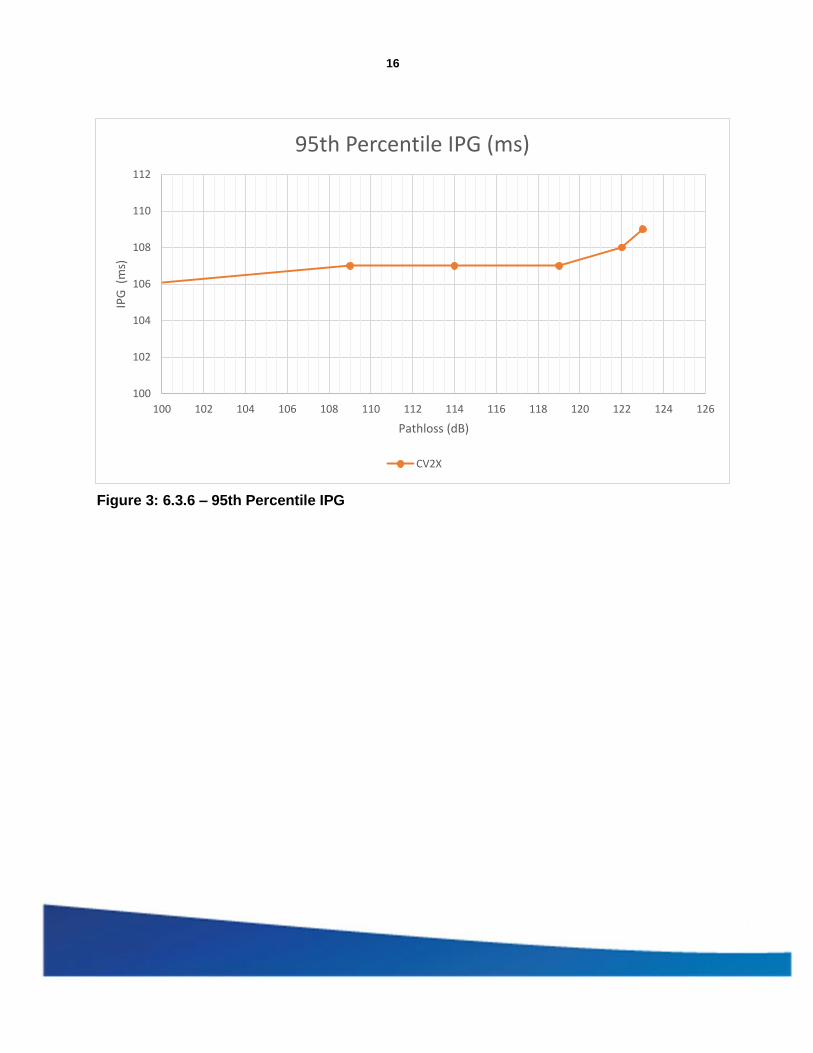
16
Figure 3: 6.3.6 – 95th Percentile IPG
100
102
104
106
108
110
112
100 102 104 106 108 110 112 114 116 118 120 122 124 126
IPG
(m
s)
Pathloss (dB)
95th Percentile IPG (ms)
CV2X
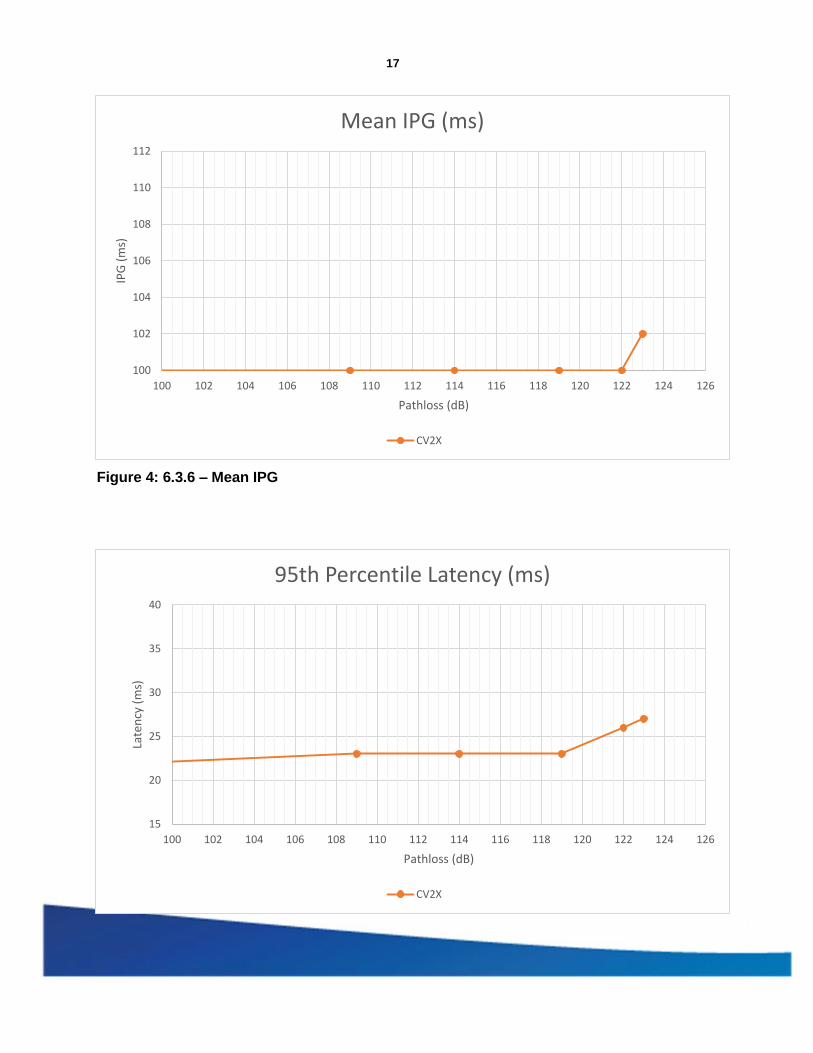
17
Figure 4: 6.3.6 – Mean IPG
100
102
104
106
108
110
112
100 102 104 106 108 110 112 114 116 118 120 122 124 126
IPG
(m
s)
Pathloss (dB)
Mean IPG (ms)
CV2X
15
20
25
30
35
40
100 102 104 106 108 110 112 114 116 118 120 122 124 126
Late
ncy
(m
s)
Pathloss (dB)
95th Percentile Latency (ms)
CV2X

18
Figure 5: 6.3.6 – 95th Percentile Latency
Figure 6: 6.3.6 – Mean Latency
6.2.1.7 Evaluation criteria Evaluation criteria is a successful decode of all the payload on an Rx entity.
6.2.1.8 Key takeaway This test emulates field scenarios where the received signal power diminishes because of the distance between the transmitter and the receiver, or because of obstructions between the two. This test has no added background interference in the channel. It should be noted that the MCS and subchannel configuration used for the 20-MHz test were different than those used for the previous 10-MHz tests in the 5GAA benchmark results and hence some differences in results is expected. The 20MHz config chosen for the test is considered optimal for a 20 MHz deployment and is aligned with the configuration proposed in SAE J3161.
The results of the test indicate that the lab performance for 20 MHz is similar to that of the 10 MHz presented in the 5GAA Benchmark Test Report.
7 Field Test Procedures and Results
12
14
16
18
20
22
24
26
28
30
32
100 102 104 106 108 110 112 114 116 118 120 122 124 126
Late
ncy
(m
s)
Pathloss (dB)
Mean Latency (ms)
CV2X

19
This chapter describes the test procedures and results of field-testing C-V2X technology in CH183. The tests described here are an extension of the tests described and analyzed in Section 8 of (5GAA Benchmark Test Report)(5GAA Test Report).
7.1 Introduction The field tests provide a realistic, yet controlled, open-sky setting for testing C-V2X technology in the proposed 20MHz CH183 of the ITS band.
The goal of the testing is twofold:
1. Assess C-V2X by itself in terms of reliability, range, and IPG, and
2. Assess the impact of C-V2X operating in CH183 on DSRC communication in other ITS channels.
The tests supporting the first goal are the same range and reliability tests as described in Section 8.4 of (5GAA Benchmark Test Report). It is hypothesized that CH183 C-V2X range and reliability tests will yield approximately the same results as the same tests performed in 10-MHz wide CH184. It is reasonable to assume that some parameters (e.g., MCS) might need to be tuned differently for the 20-MHz operation.
The tests supporting the second goal fall into the category of high-load or interference tests. In this case, V2X traffic generated in 20 MHz centered at 5,915 MHz co-exists with possible DSRC services in other ITS channels, namely CH172, CH178, and CH180. Adjacent and non-adjacent channel interference is generated either with C-V2X OBUs operating in CH183 or with DSRC OBUs operating in CH182 and CH184. It is hypothesized that C-V2X impact on these other channels is similar to the impact of DSRC operating in the same channels (CH182 and CH184).
Similar to the field test procedures described in (5GAA Benchmark Test Report), each test is executed exactly the same for both technologies that are creating interference, and the results are compared. For comparative tests, the following must be the same when testing the two technologies:
- Test procedure
- Test conditions
As described above, our first goal is to compare C-V2X results in CH183 with C-V2X results performed in CH184. In order to get need an apples-to-apples comparison between these two tests, the usual metrics or KPIs are used for comparison:
- Packet reception rate (PRR)
- Inter-packet gap (IPG)
The same KPIs will be used in the interference tests that are part of the second goal. These tests will compare KPIs between different scenarios with DSRC operating in each of the three channels, CH172, CH178, and CH180. The first scenario will test the impact of C-V2X operating in CH183 on DSRC communication in one of the three channels mentioned above. The second scenario will test the impact of DSRC operating in CH182 and in CH184 on DSRC in the above-mentioned three channels.

20
Receive signal strength Indicator (RSSI) is collected and presented for DSRC only.
Range tests determine the distance at which PRR or the reliability of the BSM message reception drops below an acceptable level. The PRR threshold for range determination is 90%. The range tests were performed on the following test track:
- Road A – Straightaway (Fowlerville Proving Ground - FPG, Michigan)
The rest of this section presents test procedures and results for the following tests:
- Range and reliability
- C-V2X Line-of-Sight (LOS) C-V2X
- C-V2X Non-Line Line-of-Sight (NLOS)
- High load interference
- LOS interference from C-V2X in CH183 (or CH182+CH184) on DSRC in CH172
- LOS interference from C-V2X/DSRC in CH183 (or CH182+CH184) on DSRC in CH178
- LOS interference from C-V2X/DSRC in CH183 (or CH182+CH184) on DSRC in CH180
The high load tests will compare the impact of both DSRC and CV2X interference on DSRC operation in CH178 and CH180. DSRC interference devices are operating in 10 MHz configuration. Section 7.6 has additional details on interference pattern and generation.
.
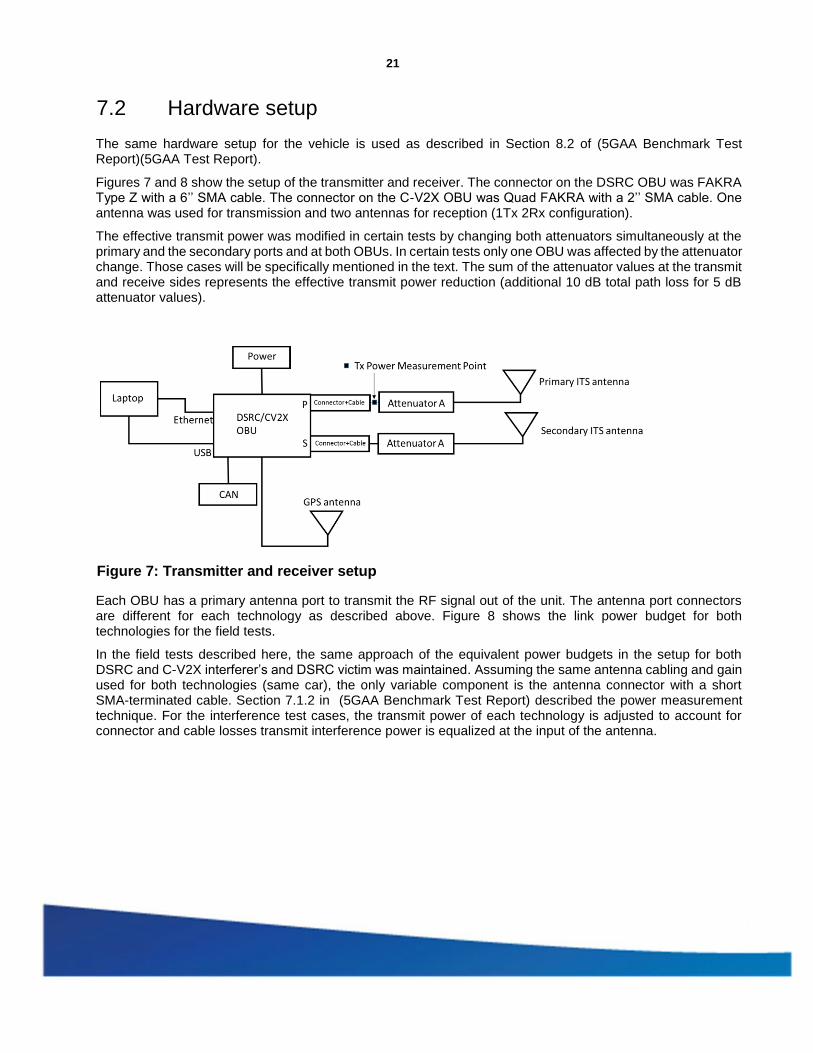
21
7.2 Hardware setup The same hardware setup for the vehicle is used as described in Section 8.2 of (5GAA Benchmark Test Report)(5GAA Test Report).
Figures 7 and 8 show the setup of the transmitter and receiver. The connector on the DSRC OBU was FAKRA Type Z with a 6’’ SMA cable. The connector on the C-V2X OBU was Quad FAKRA with a 2’’ SMA cable. One antenna was used for transmission and two antennas for reception (1Tx 2Rx configuration).
The effective transmit power was modified in certain tests by changing both attenuators simultaneously at the primary and the secondary ports and at both OBUs. In certain tests only one OBU was affected by the attenuator change. Those cases will be specifically mentioned in the text. The sum of the attenuator values at the transmit and receive sides represents the effective transmit power reduction (additional 10 dB total path loss for 5 dB attenuator values).
Figure 7: Transmitter and receiver setup
Each OBU has a primary antenna port to transmit the RF signal out of the unit. The antenna port connectors are different for each technology as described above. Figure 8 shows the link power budget for both technologies for the field tests.
In the field tests described here, the same approach of the equivalent power budgets in the setup for both DSRC and C-V2X interferer’s and DSRC victim was maintained. Assuming the same antenna cabling and gain used for both technologies (same car), the only variable component is the antenna connector with a short SMA-terminated cable. Section 7.1.2 in (5GAA Benchmark Test Report) described the power measurement technique. For the interference test cases, the transmit power of each technology is adjusted to account for connector and cable losses transmit interference power is equalized at the input of the antenna.
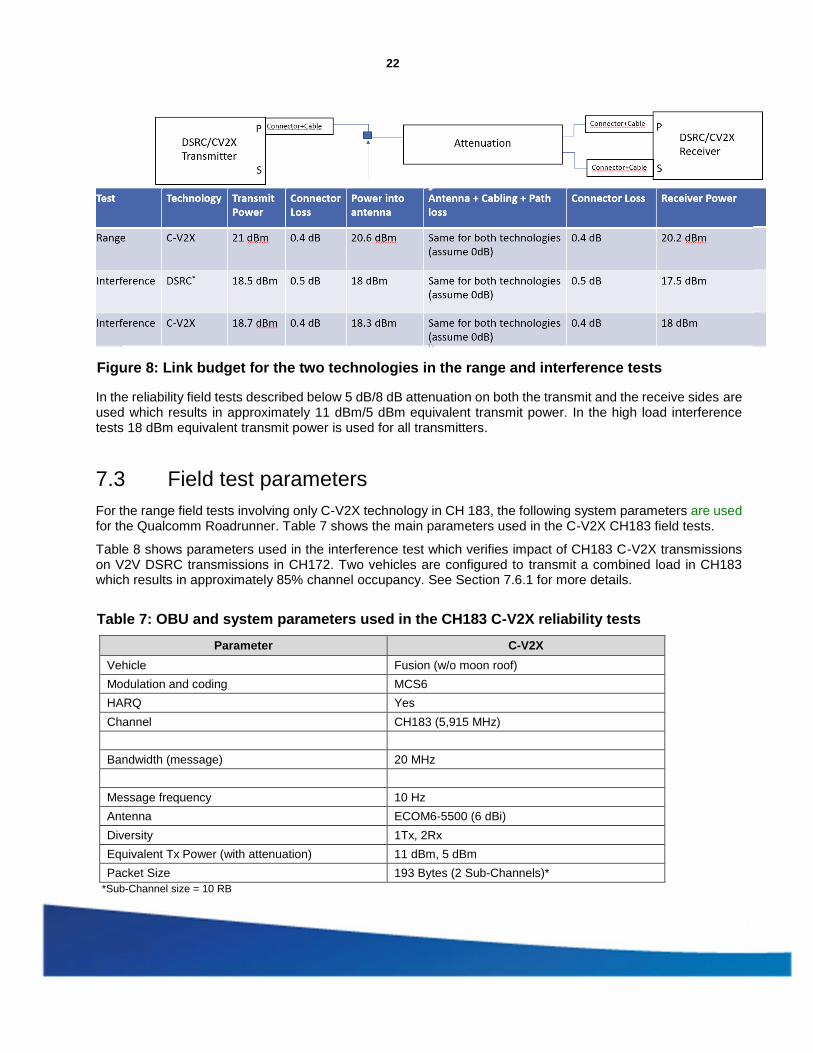
22
Figure 8: Link budget for the two technologies in the range and interference tests
In the reliability field tests described below 5 dB/8 dB attenuation on both the transmit and the receive sides are used which results in approximately 11 dBm/5 dBm equivalent transmit power. In the high load interference tests 18 dBm equivalent transmit power is used for all transmitters.
7.3 Field test parameters For the range field tests involving only C-V2X technology in CH 183, the following system parameters are used for the Qualcomm Roadrunner. Table 7 shows the main parameters used in the C-V2X CH183 field tests.
Table 8 shows parameters used in the interference test which verifies impact of CH183 C-V2X transmissions on V2V DSRC transmissions in CH172. Two vehicles are configured to transmit a combined load in CH183 which results in approximately 85% channel occupancy. See Section 7.6.1 for more details.
Table 7: OBU and system parameters used in the CH183 C-V2X reliability tests
Parameter C-V2X
Vehicle Fusion (w/o moon roof) Modulation and coding MCS6 HARQ Yes Channel CH183 (5,915 MHz)
Bandwidth (message) 20 MHz
Message frequency 10 Hz Antenna ECOM6-5500 (6 dBi) Diversity 1Tx, 2Rx Equivalent Tx Power (with attenuation) 11 dBm, 5 dBm Packet Size 193 Bytes (2 Sub-Channels)*
*Sub-Channel size = 10 RB

23
Table 8: OBU and system parameters used in testing transmission in CH183 impact on basic safety transmissions in CH172
Parameter DSRC (MV) DSRC (RSU) C-V2X Interference
in CH183 DSRC Interference in CH182+CH184
Vehicle Fusion (w/o moon roof) Not applicable 2 Fusion vehicles
(w/o moon roof) 2 Fusion vehicles (w/o moon roof)
Modulation and coding MCS 2* MCS 2* MCS6* MCS 0*
HARQ Not available Not available OFF Not available
Channel CH172, CH178, CH180
CH172, CH178, CH180 CH183 (5,915 MHz) CH182 (5,910 MHz)
CH184 (5,920 MHz)
Resource restrictions None None
(5,905-5,925 MHz) Interference Vehicle 1: 5,905-5,915 MHz Interference Vehicle 2: 5,915-5,925 MHz
None
System Bandwidth (message) 10 MHz 10 MHz 20 MHz 10 MHz
Packet size 193B 193B (190,450) 1 packet size (1365)
Message frequency 10 Hz 10 Hz Targeting 85% channel occupancy time
Targeting 85% channel occupancy time
Antenna ECOM6-5500 (6 dBi)
ECOM6-5500 (6 dBi), 5.3 m height
ECOM6-5500 (6 dBi)
ECOM6-5500 (6 dBi)
Diversity 1Tx, 2Rx 1Tx, 2Rx 1Tx, 2Rx 1Tx, 2Rx
Equivalent Tx Power (with attenuation)
18 dBm 18 dBm 18 dBm 18 dBm
*The MCS is referring to Modulation and Coding Scheme as specified for the respective standards. For C-V2X the MCS may vary.
The DSRC RSU used in the high load interference test uses the same hardware as the in-vehicle OBUs. This includes the same antennas (ECOM6-5500) with the difference being the 5.3 m height in the RSU case.
7.4 Presentation of results As in the field results section of (5GAA Benchmark Test Report)(5GAA Test Report) the main performance metrics used here include: packet reception ratio (PRR), inter-packet gap (IPG), and receive signal strength indicator (RSSI). All metrics are defined in Section 5.1 of (5GAA Benchmark Test Report)(5GAA Test Report).

24
7.5 Reliability tests Reliability vs. range tests verify the distance at which a V2V technology maintains communication in various scenarios. Additionally, reliability tests validate message reception reliability at a particular distance. Range or reliability tests also verify the reliability of basic safety packet communication as a function of distance between the vehicles. This section presents test procedures and results for:
- Line-of-Sight (LOS) test
- Non-Line of Sight test (non-intersection)
The tests also test the hypothesis that the set of distances at which 90% or higher reliability can be achieved is approximately the same for 10-MHz and 20-MHz channel operation. It is expected that the results of this test are closely aligned with the results from 10-MHz testing in CH184 presented in (5GAA Benchmark Test Report).
It should be noted that the tests in Sections 7.5.1 and 7.5.2 were done in late November with different environmental conditions in terms of foliage, temperature and road conditions (no snow vs snow) than the latest (5GAA Benchmark Test Report) and hence the absolute range numbers will differ slightly.
7.5.1 Line-of-Sight (LOS) in CH183 test procedure and results LOS reliability tests are described in Section 9.1.1 of (5GAA, March 2018). The procedure tests the performance characteristics of the radio technology in a realistic, yet controlled, environment of a test track. The conditions are open sky with no obstructions.
The objectives of the test are:
1. Compare communication range (packet reception rate vs. distance) and reliability of safety message exchange under LOS conditions for C-V2X in CH183 (20-MHz Channel bandwidth) with the C-V2X in CH184 (10-MHz Channel bandwidth).
2. Compare inter-packet gap (IPG) for both CH183 and CH184 C-V2X.
The hypothesis for this test is that the BSM communication using C-V2X in CH183 in LOS conditions has the same reliability as in CH184 under the same conditions.
The scenario includes the following:
- One stationary and one moving vehicle (SV, MV) broadcasting BSM messages (packets) without security.
- Packets are fixed at 193 bytes.
- Packets are transmitted at a rate of 10 Hz.
- Each vehicle is both transmitting and receiving packets.
- Fixed attenuators are used so that the tests can be scaled to the test track maximum length.
- Equivalent transmit power of 11 and 5 dBm tested.
- RF cabling including 5-dB attenuators on each RF cable.
- Same vehicles, instrumentation and antenna placements are used during the CH183 test as s used in (5GAA Benchmark Test Report)(5GAA Test Report) for CH184.
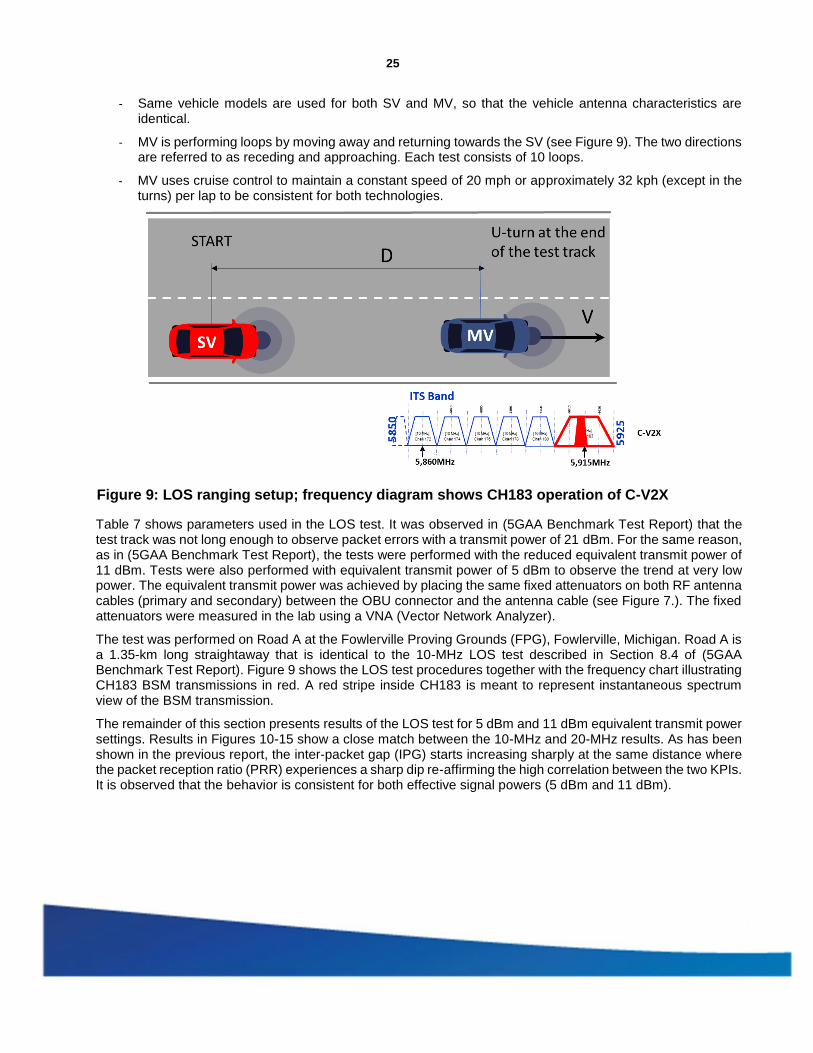
25
- Same vehicle models are used for both SV and MV, so that the vehicle antenna characteristics are identical.
- MV is performing loops by moving away and returning towards the SV (see Figure 9). The two directions are referred to as receding and approaching. Each test consists of 10 loops.
- MV uses cruise control to maintain a constant speed of 20 mph or approximately 32 kph (except in the turns) per lap to be consistent for both technologies.
Figure 9: LOS ranging setup; frequency diagram shows CH183 operation of C-V2X
Table 7 shows parameters used in the LOS test. It was observed in (5GAA Benchmark Test Report) that the test track was not long enough to observe packet errors with a transmit power of 21 dBm. For the same reason, as in (5GAA Benchmark Test Report), the tests were performed with the reduced equivalent transmit power of 11 dBm. Tests were also performed with equivalent transmit power of 5 dBm to observe the trend at very low power. The equivalent transmit power was achieved by placing the same fixed attenuators on both RF antenna cables (primary and secondary) between the OBU connector and the antenna cable (see Figure 7.). The fixed attenuators were measured in the lab using a VNA (Vector Network Analyzer).
The test was performed on Road A at the Fowlerville Proving Grounds (FPG), Fowlerville, Michigan. Road A is a 1.35-km long straightaway that is identical to the 10-MHz LOS test described in Section 8.4 of (5GAA Benchmark Test Report). Figure 9 shows the LOS test procedures together with the frequency chart illustrating CH183 BSM transmissions in red. A red stripe inside CH183 is meant to represent instantaneous spectrum view of the BSM transmission.
The remainder of this section presents results of the LOS test for 5 dBm and 11 dBm equivalent transmit power settings. Results in Figures 10-15 show a close match between the 10-MHz and 20-MHz results. As has been shown in the previous report, the inter-packet gap (IPG) starts increasing sharply at the same distance where the packet reception ratio (PRR) experiences a sharp dip re-affirming the high correlation between the two KPIs. It is observed that the behavior is consistent for both effective signal powers (5 dBm and 11 dBm).

26
Figure 10: LOS average PRR at the SV as a function of distance between the SV and MV (5 dBm equivalent transmit power); both 10-MHz and 20-MHz test results are shown
Figure 11: LOS average IPG at the SV as a function of distance between the SV and MV (5 dBm equivalent transmit power); both 10-MHz and 20-MHz test results are shown

27
Figure 12: LOS IPG CDF (5 dBm equivalent transmit power); both 10-MHz and 20MHz test results are shown
Figure 13: LOS average PRR at the SV as a function of distance between the SV and MV (11 dBm equivalent transmit power); both 10-MHz and 20-MHz test results are shown
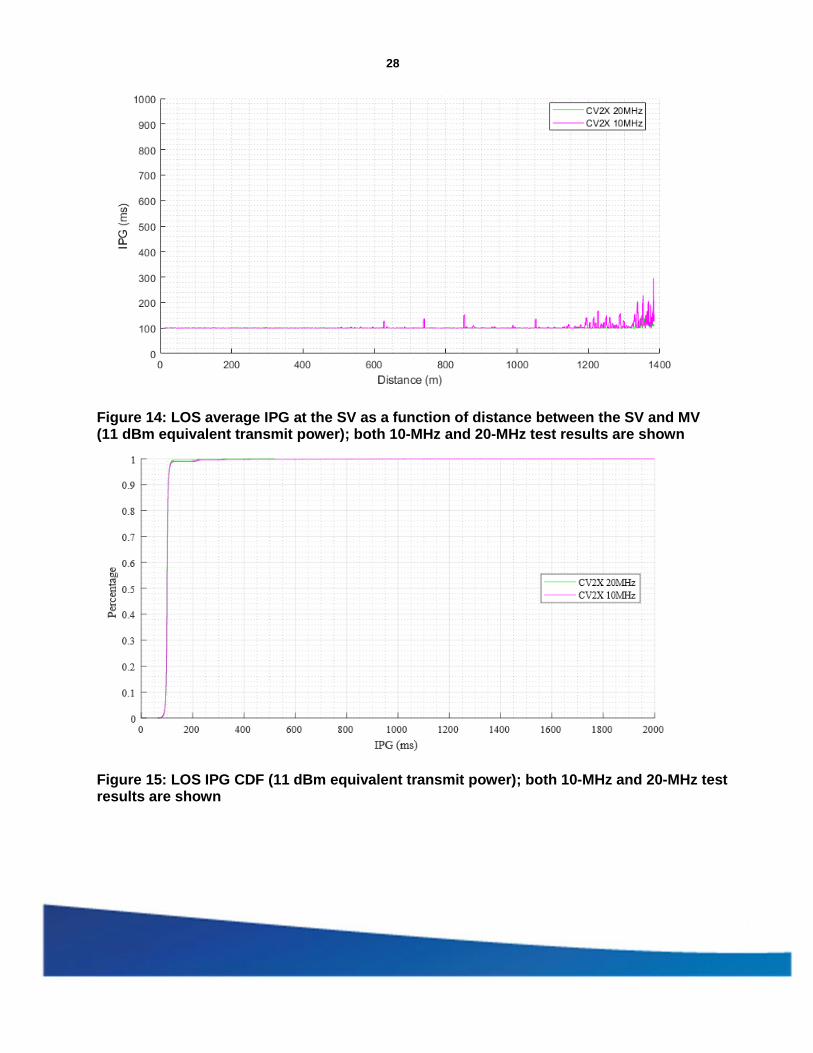
28
Figure 14: LOS average IPG at the SV as a function of distance between the SV and MV (11 dBm equivalent transmit power); both 10-MHz and 20-MHz test results are shown
Figure 15: LOS IPG CDF (11 dBm equivalent transmit power); both 10-MHz and 20MHz test results are shown
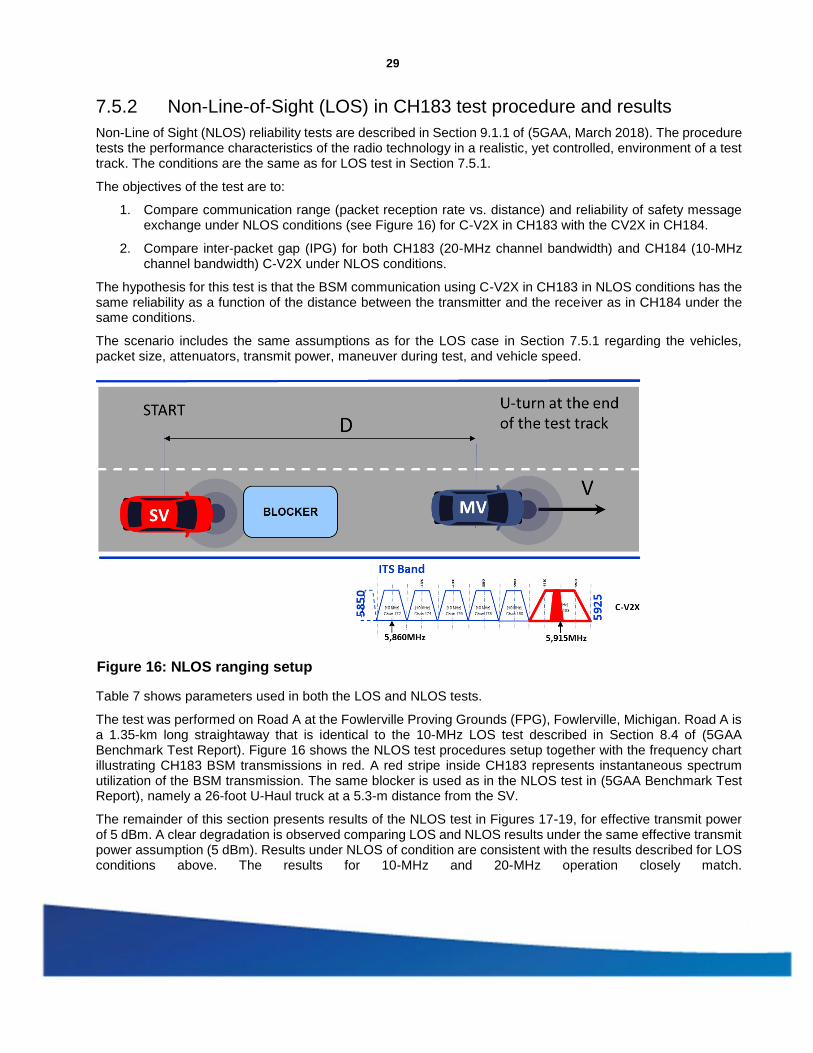
29
7.5.2 Non-Line-of-Sight (LOS) in CH183 test procedure and results Non-Line of Sight (NLOS) reliability tests are described in Section 9.1.1 of (5GAA, March 2018). The procedure tests the performance characteristics of the radio technology in a realistic, yet controlled, environment of a test track. The conditions are the same as for LOS test in Section 7.5.1.
The objectives of the test are to:
1. Compare communication range (packet reception rate vs. distance) and reliability of safety message exchange under NLOS conditions (see Figure 16) for C-V2X in CH183 with the CV2X in CH184.
2. Compare inter-packet gap (IPG) for both CH183 (20-MHz channel bandwidth) and CH184 (10-MHz channel bandwidth) C-V2X under NLOS conditions.
The hypothesis for this test is that the BSM communication using C-V2X in CH183 in NLOS conditions has the same reliability as a function of the distance between the transmitter and the receiver as in CH184 under the same conditions.
The scenario includes the same assumptions as for the LOS case in Section 7.5.1 regarding the vehicles, packet size, attenuators, transmit power, maneuver during test, and vehicle speed.
Figure 16: NLOS ranging setup
Table 7 shows parameters used in both the LOS and NLOS tests.
The test was performed on Road A at the Fowlerville Proving Grounds (FPG), Fowlerville, Michigan. Road A is a 1.35-km long straightaway that is identical to the 10-MHz LOS test described in Section 8.4 of (5GAA Benchmark Test Report). Figure 16 shows the NLOS test procedures setup together with the frequency chart illustrating CH183 BSM transmissions in red. A red stripe inside CH183 represents instantaneous spectrum utilization of the BSM transmission. The same blocker is used as in the NLOS test in (5GAA Benchmark Test Report), namely a 26-foot U-Haul truck at a 5.3-m distance from the SV.
The remainder of this section presents results of the NLOS test in Figures 17-19, for effective transmit power of 5 dBm. A clear degradation is observed comparing LOS and NLOS results under the same effective transmit power assumption (5 dBm). Results under NLOS of condition are consistent with the results described for LOS conditions above. The results for 10-MHz and 20-MHz operation closely match.
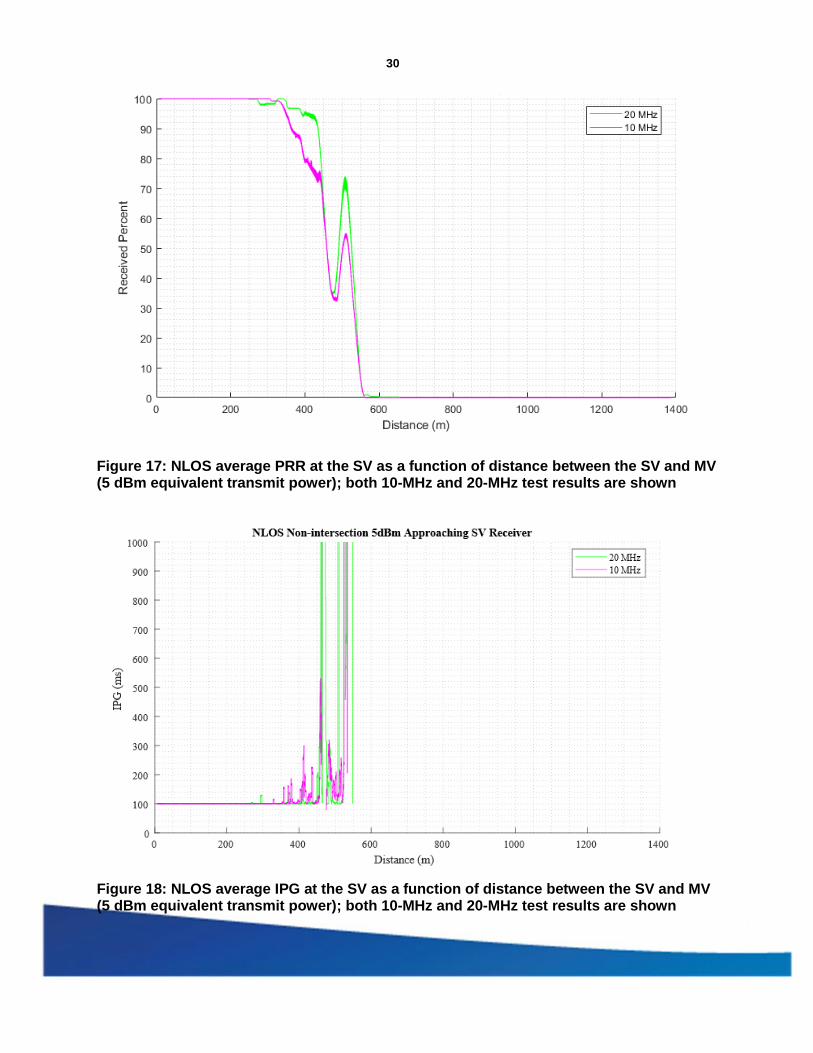
30
Figure 17: NLOS average PRR at the SV as a function of distance between the SV and MV (5 dBm equivalent transmit power); both 10-MHz and 20-MHz test results are shown
Figure 18: NLOS average IPG at the SV as a function of distance between the SV and MV (5 dBm equivalent transmit power); both 10-MHz and 20-MHz test results are shown
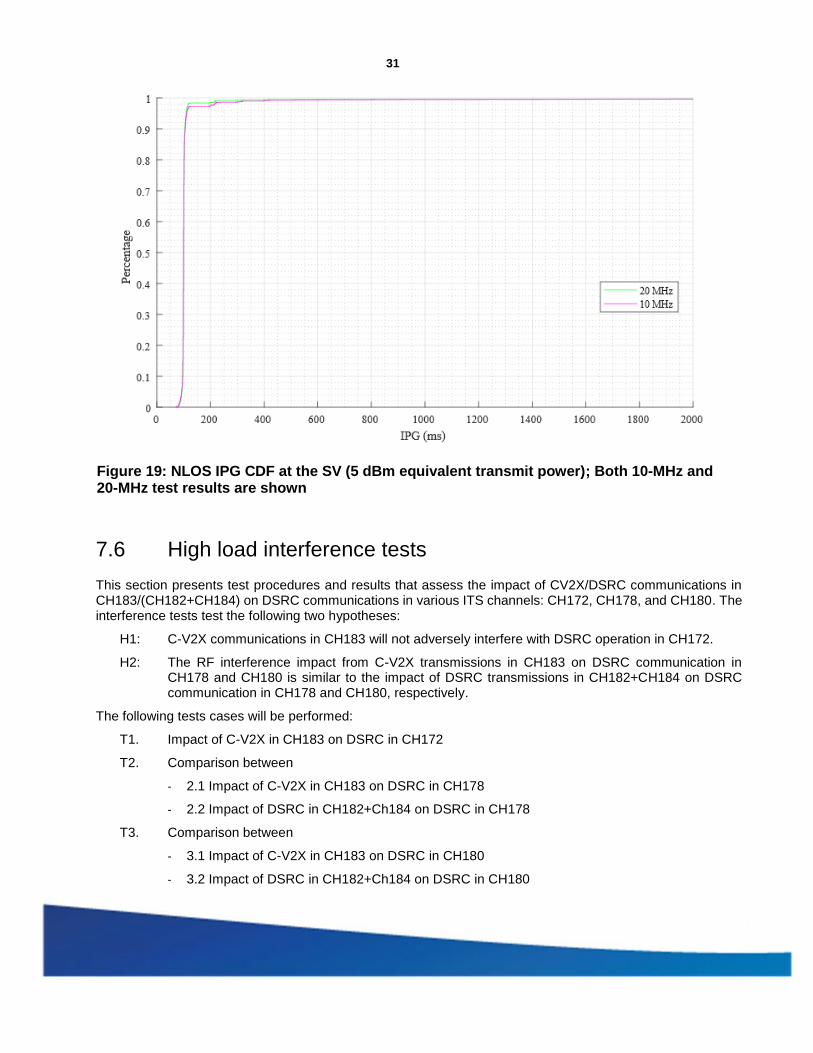
31
Figure 19: NLOS IPG CDF at the SV (5 dBm equivalent transmit power); Both 10MHz and 20-MHz test results are shown
7.6 High load interference tests This section presents test procedures and results that assess the impact of CV2X/DSRC communications in CH183/(CH182+CH184) on DSRC communications in various ITS channels: CH172, CH178, and CH180. The interference tests test the following two hypotheses:
H1: C-V2X communications in CH183 will not adversely interfere with DSRC operation in CH172.
H2: The RF interference impact from C-V2X transmissions in CH183 on DSRC communication in CH178 and CH180 is similar to the impact of DSRC transmissions in CH182+CH184 on DSRC communication in CH178 and CH180, respectively.
The following tests cases will be performed:
T1. Impact of C-V2X in CH183 on DSRC in CH172
T2. Comparison between
- 2.1 Impact of C-V2X in CH183 on DSRC in CH178
- 2.2 Impact of DSRC in CH182+Ch184 on DSRC in CH178
T3. Comparison between
- 3.1 Impact of C-V2X in CH183 on DSRC in CH180
- 3.2 Impact of DSRC in CH182+Ch184 on DSRC in CH180

32
7.6.1 High load characterization High load tests are designed to test the hypotheses that C-V2X transmissions in CH183 do not adversely affect DSRC safety channel communications in CH172, and, that C-V2X communications in CH183 will not have any larger potential for interference in the adjacent and non-adjacent channels than DSRC operating in the same 20-MHz bandwidth.
To test these hypotheses, a set of high load tests were designed which include two interference vehicles (IVs) each generating high load (~85%). Interference vehicle 1 (IV1) generated high traffic load in the lower half of CH183 while interference vehicle 2 (IV2) generated load in the upper half of CH183. When DSRC high load was tested, two (2) DSRC OBUs were used each operating in 10 MHz bandwidth. DSRC OBU in IV1 was tuned to CH182 which overlapped with the lower half of CH183 and DSRC OBU in IV2 was tuned to CH184 overlapping with the upper half of CH183.
The high loads described in this section are exaggerated and will rarely be experienced by a vehicle or RSU in realistic scenarios. As an example, the high load defined here could be compared to having a vehicle 10 m away transmitting at full power ~85% of the time. This was selected to test the worst-case scenario. Another related aspect of the high load setup is that both interference vehicles are transmitting at the constant high power.
In realistic scenarios, the interference at any point would be a result of many transmissions being received from various distances and thus at varying receive powers. This is another example of how the interference generated by the high load interference vehicles is significantly higher than what will be perceived in an actual deployment. Thus, the main purpose of the results below is to compare the impact of high load generated by the two technologies under worst-case conditions. In realistic situations, the receiving node is expected to see improved packet reception ratio and other KPIs.
7.6.1.1 DSRC channel occupancy in CH182 + CH184 To generate traffic in channels 182 and 184, two DRC OBUs were used. The channel occupancy time was targeted to achieve 85% for each transmitter in their individual channels. Each device was sending 1365 bytes every 4 ms at 3 Mbps.
Three different approaches were taken to verify the channel occupancy:
1. The transmit on/off intervals were measured on the Spectrum Analyzer in zero span configuration. The measurements revealed ON_Time ~ 3.6 ms and OFF_Time ~ 0.7 ms.
a. Approximate channel occupancy = 3.6/4.3 = 83.7%
2. The value of the reported channel busy period (CBP) was noted using DSRC RX OBU, in this case it was 83%.
3. Measurement based on number of received packets:
a. Average number of packets received per minute = 13606
b. Packet transmission time at 3 Mbps = 3.64 ms
c. Total time occupied for transmission of 13606 packets = 49525.84 ms
d. Channel occupancy = 49525.84/60000 = 82.54%
The above provided confidence that loading was indeed around 83% for the setup used. During the actual field tests, a Spectrum Analyzer was continuously monitoring the presence of the interfering signal.
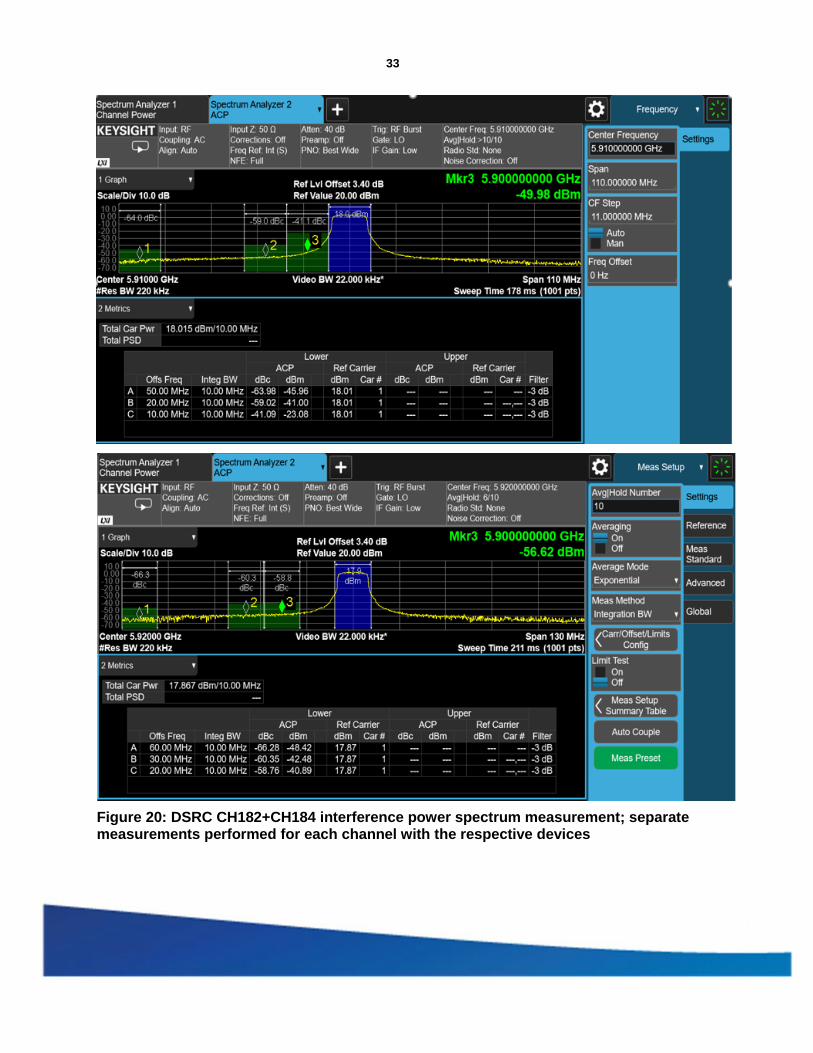
33
Figure 20: DSRC CH182+CH184 interference power spectrum measurement; separate measurements performed for each channel with the respective devices
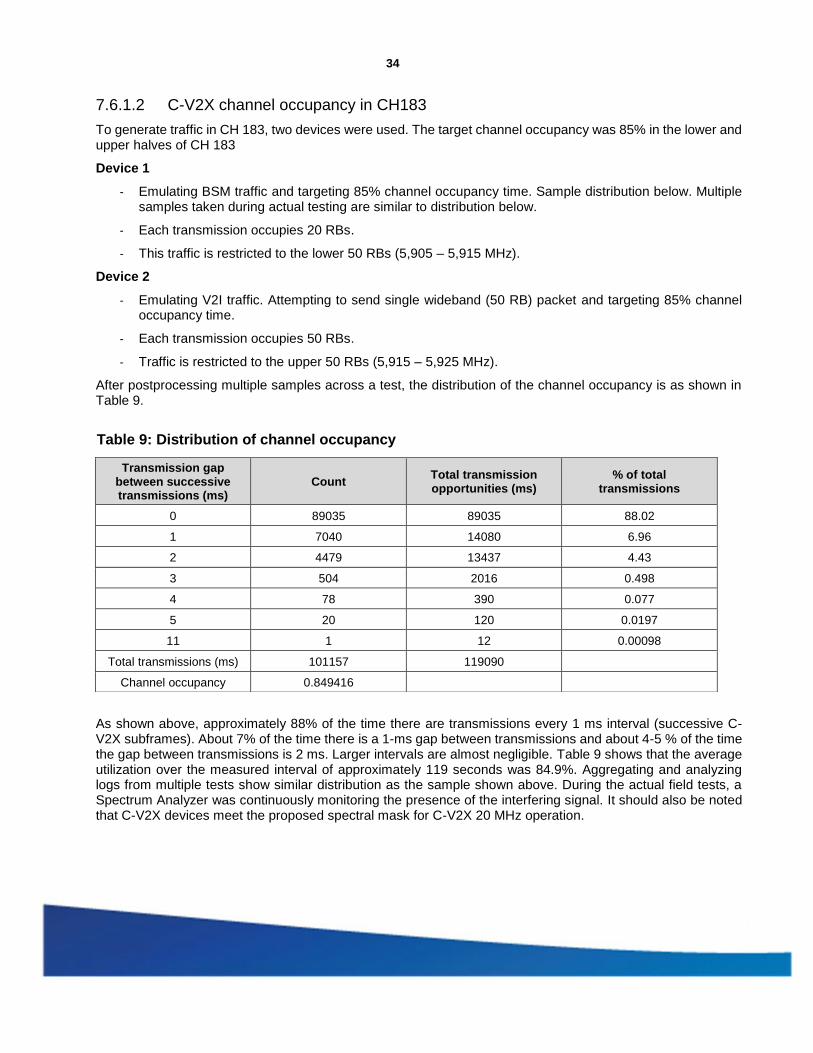
34
7.6.1.2 C-V2X channel occupancy in CH183 To generate traffic in CH 183, two devices were used. The target channel occupancy was 85% in the lower and upper halves of CH 183
Device 1
- Emulating BSM traffic and targeting 85% channel occupancy time. Sample distribution below. Multiple samples taken during actual testing are similar to distribution below.
- Each transmission occupies 20 RBs.
- This traffic is restricted to the lower 50 RBs (5,905 – 5,915 MHz).
Device 2
- Emulating V2I traffic. Attempting to send single wideband (50 RB) packet and targeting 85% channel occupancy time.
- Each transmission occupies 50 RBs.
- Traffic is restricted to the upper 50 RBs (5,915 – 5,925 MHz).
After postprocessing multiple samples across a test, the distribution of the channel occupancy is as shown in Table 9.
Table 9: Distribution of channel occupancy
As shown above, approximately 88% of the time there are transmissions every 1 ms interval (successive C-V2X subframes). About 7% of the time there is a 1-ms gap between transmissions and about 4-5 % of the time the gap between transmissions is 2 ms. Larger intervals are almost negligible. Table 9 shows that the average utilization over the measured interval of approximately 119 seconds was 84.9%. Aggregating and analyzing logs from multiple tests show similar distribution as the sample shown above. During the actual field tests, a Spectrum Analyzer was continuously monitoring the presence of the interfering signal. It should also be noted that C-V2X devices meet the proposed spectral mask for C-V2X 20 MHz operation.
Transmission gap between successive transmissions (ms)
Count Total transmission opportunities (ms)
% of total transmissions
0 89035 89035 88.02
1 7040 14080 6.96
2 4479 13437 4.43
3 504 2016 0.498
4 78 390 0.077
5 20 120 0.0197
11 1 12 0.00098
Total transmissions (ms) 101157 119090
Channel occupancy 0.849416
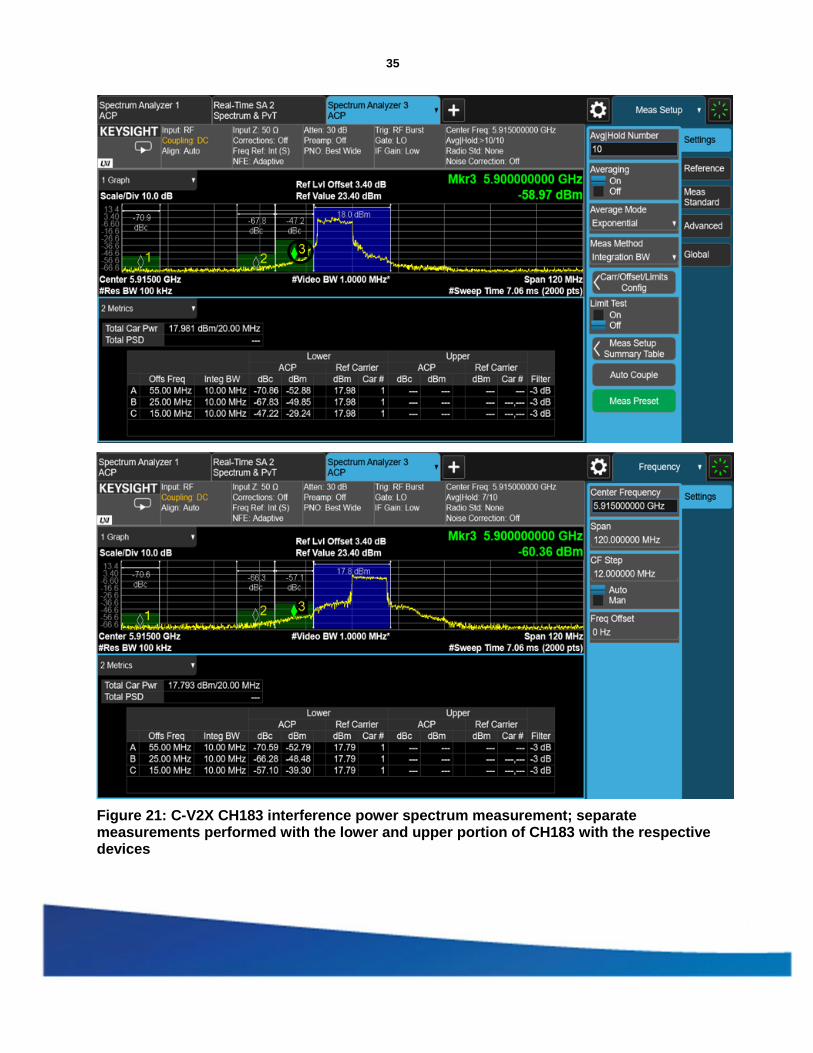
35
Figure 21: C-V2X CH183 interference power spectrum measurement; separate measurements performed with the lower and upper portion of CH183 with the respective devices

36
7.6.2 Impact on DSRC safety message traffic in CH172 from C-V2X/DSRC traffic in CH183/CH 182+184: test procedure and results
This test assesses the impact of C-V2X/DSRC communication on basic safety message exchange in CH172. The parameters of the test are shown in Table 8. The KPIs used for assessing the impact include range, reliability, and IPG. As discussed in Section 7.6.1 the traffic in CH183 runs at ~85% channel utilization.
Figure 22: C-V2X in CH183 interference on DSRC communication in CH172 test setup
To assess the impact on CH172 an LOS test for DSRC in CH172 needs to be performed without traffic in CH183 as a baseline. Figure 22 shows the test setup together with a frequency plan for the safety (CH172) and the interference channel (CH183) in blue and green, respectively. Two interfering vehicles (IVs) are lined up with SV at a 13 m distance as shown in Figure 20. The interfering vehicles have the same antennas as SV and MV, however, they do not need to be the same vehicle model (in the test SV/MV were Ford Fusions and IV1/IV2 were Ford Taurus each).
Similar to the LOS test, this test uses the following:
- One stationary and one moving vehicle (SV, MV) broadcasting BSM messages (packets) without security in CH172.
- Packets are fixed at 193 bytes.
- Transmit power fixed at the equivalent value of 18 dBm.
- MV is performing loops by moving away and returning towards the SV (see Figure 22). The two directions are referred to as receding and approaching. Each test consists of 6 loops.

37
- MV uses cruise control to maintain a constant speed of 20 mph or approximately 32 kph (except in the turns) per lap.
- Two IVs are stationary and are transmitting in both the lower 10 MHz and the upper 10 MHz of CH183. The total traffic load is ~85%. IV1 and IV2 transmit in the upper half and the lower half of CH183, respectively.
- The effective transmit power of the IVs is 18 dBm.
The remainder of this section (Figures 23-26) presents the results of the impact of high load interference from C-V2X/DSRC transmissions in CH183/(CH182+CH184) on DSRC BSM transmissions in CH172. Baseline tests represent the test with the interference turned off. It is observed that turning on the interference signal presented negligible to no impact on the reception of BSM messages in CH172. In Figure 26 well-known dips in RSSI predicted by the plane earth propagation loss model (see (Parsons, 1994)) are observed, which are dependent on the height of the antennas, in this case 1.6 m.
Figure 23: C-V2X/DSRC CH183/(CH182+CH184) interference on DSRC CH172 average PRR at the SV as a function of distance between the SV and MV; LOS PRR results shown on the right

38
Figure 24: C-V2X/DSRC CH183/(CH182+CH184) interference on DSRC CH172 average IPG vs. distance at the SV as a function of distance between the SV and MV
Figure 25: C-V2X/DSRC CH183/(CH182+CH184) interference on DSRC CH172 IPG CDF

39
Figure 26: C-V2X/DSRC CH183/(CH182+CH184) interference on DSRC in CH172 DSRC RSSI at the SV as a function of distance between the SV and MV
7.6.3 C-V2X/DSRC traffic in CH183/(CH182+CH184) and DSRC traffic in CH178: test procedure and results
This section presents test procedures and results assessing the impact of C-V2X/DSRC communications in (5,905-5,925) MHz on DSRC communication in channels CH178 (5885-5595 MHz), as illustrated in the hypothesis H2 and the test case T2 (Section 7.6). In DSRC, CH178 is planned to be used for I2V communications. Hence this section focuses on the impact to the I2V link.
The following test is planned in this section:
7.6.3.2 Interference Vehicles (IV) Moving: How moving IVs in the same lane with DSRC Moving Vehicles (MV) impact the I2V DSRC communication between the RSU and the Moving Vehicle (MV) in CH178. The interference vehicles (IV) transmit with either CV2X or DSRC based on the test scenarios.

40
7.6.3.1 Test scenario A signalized 4-way intersection with traffic lights is considered. There is a mixed crowd of DSRC and C-V2X equipped vehicles in the road which are moving towards and away from the intersection. It is assumed that a DSRC RSU is installed at the intersection.
It is assumed that there are CV2X vehicles stopped at the red light in the intersection, while there are DSRC vehicles crossing the intersection during the green phase. The C-V2X vehicles are transmitting in Channel 183, while DSRC vehicles and DSRC RSU are communicating I2V and V2I messages in Channel 178 and CH180, respectively. The purpose of this test is to evaluate the impact of CV2X/DSRC transmission on both DSRC channels 178 and 180. Independent test cases are illustrated for evaluating the interferences on DSRC CH178 and DSRC CH180 from C-V2X CH183 and DSRC CH182+184, respectively.
The performance metrics are Packet Reception Ratio (PRR), Received Signal Strength (RSSI) and Inter-Packet Gap (IPG). These metrics will be calculated at the DSRC OBU and RSU, C-V2X receiver performance is not evaluated.
Figure 27: Test scenario
7.6.3.2 Interference vehicles moving in same lane impacting the I2V DSRC communication between the RSU and moving DSRC vehicle in CH178
This test assesses the impact of C-V2X transmission in CH 183 and DSRC transmission in CH182 + CH184 on DSRC I2V communication in CH178. The parameters of the test are shown in Table 10. The KPIs include reliability in terms of PRR, RSSI and IPG. The channel load on CV2X in CH183 and DSRC in CH182 & CH184 are set up to 85% channel utilization. The RSU exchange I2V messages with the MV on DSRC CH178.
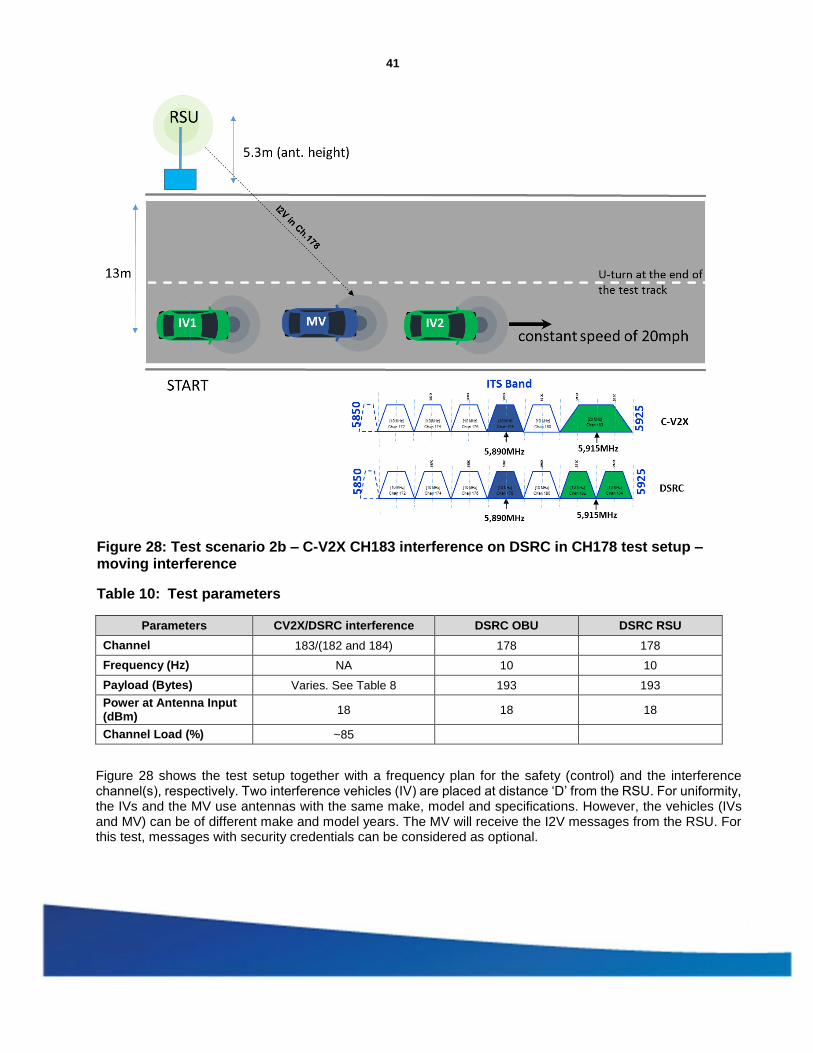
41
Figure 28: Test scenario 2b – C-V2X CH183 interference on DSRC in CH178 test setup – moving interference
Table 10: Test parameters
Parameters CV2X/DSRC interference DSRC OBU DSRC RSU
Channel 183/(182 and 184) 178 178 Frequency (Hz) NA 10 10 Payload (Bytes) Varies. See Table 8 193 193 Power at Antenna Input (dBm)
18 18 18
Channel Load (%) ~85
Figure 28 shows the test setup together with a frequency plan for the safety (control) and the interference channel(s), respectively. Two interference vehicles (IV) are placed at distance ‘D’ from the RSU. For uniformity, the IVs and the MV use antennas with the same make, model and specifications. However, the vehicles (IVs and MV) can be of different make and model years. The MV will receive the I2V messages from the RSU. For this test, messages with security credentials can be considered as optional.

42
Transmit power of all devices is set at the effective transmit power of 18 dBm as described in Section 7.2. It should be noted that due to the possibility of relatively higher power used by the RSU the I2V results are pessimistic compared to more realistic scenarios.
Figure 28 shows the setup and frequency diagram which illustrate the position of the control channel (CH178) and the interference channel (s) CH183/(CH182, CH184) used in this test.
7.6.3.2.1 Test procedure Step 1: Test setup
RSU
- Place RSU at one end of the track, preferably in a location that is not blocked or obstructed by a large tree, building or other structure. Set the RSU antenna mounted at a height of 5.3 meters above the roadway bed surface. Set the RSU configuration per Table 10.
MV
1. Place MV at one end of the test track, where the RSU has been placed. It is preferred to select a clear LOS environment for this test. Take note of any visible obstruction in the surrounding, for example, nearby large trees, building or structure that can cause signal attenuation and fading. Set the MV configuration per Table 10.
2. Before starting the test, make sure that the RSU is transmitting I2V messages in CH178 and the transmission data is logged properly at the RSU. Also make sure that the MV is receiving the I2V messages in CH178 and the received messages are logged properly at the MV.
3. The driver (and the observer) of the MV must be aware of the surroundings and should be comfortable with the driving conditions and test requirements. The observer may have wireless communication devices (walkie-talkie, mobile phone) in the MV to communicate with the test coordinator during the test.
IV
1. One IV is placed in front of the MV and the other IV is placed behind the MV. Both IVs maintain a safe distance of approximately 10 meters from the MV on either side.
2. It is preferred to select a clear LOS environment for this test. Take note of any visible obstruction in the surroundings, for example, nearby large trees, building or structure that can cause signal attenuation and fading from the IV to the RSU and the MV.
3. Set the IV configuration per Table 10.
4. Before starting the test, make sure that the IVs are transmitting in CH183 and the transmission data is logged properly.
5. Any observer(s) in the IVs should be aware of the surroundings and test requirements. The observers in the IVs should have wireless communication devices (walkie-talkie, mobile phone). However, placing observers in IVs is optional.
6. The IVs need to be configured to create a channel load of up to 85%.
43
Step 2: Test execution
Step 2a: CV2X interference in CH183
1. The MV and the IVs start from one end of the track where the RSU is placed. All vehicles recede from the RSU (see Figure 28), take a U-turn at the other end of the track (approximate length of 1400 meters) and approach the RSU at a constant speed maintained at 20 mph. Cruise control was used on IV1 to maintain approximately equal spacing between vehicles in the platoon. The same practice is applied in other moving interference tests in this Report.
2. The MV and IVs make multiple loops while receding from and approaching the RSU. Each test consists of 6 loops. At the end of 6 loops, test data is collected (wirelessly remote data collection and logging is also possible) from the data logging devices. Test data will be saved for further analyses.
3. The test resumes and is repeated independently for each payload size. The other test parameters are adjusted accordingly, if required, based on packet size.
4. All data is saved in secure storage for further analyses.
Step 2b: DSRC interference in CH182+CH184
- Repeat all the steps from Step 2a, except the IVs use DSRC technology in CH182, CH184.
Step 3: Test completion
1. At the end of all test cycles, make sure that the data from the test runs has been logged properly. It is prudent to run a few quick checks on the test data for any anomaly and abnormal behavior. If any anomaly is observed, it must be recorded and investigated for root cause analysis.
2. If photography/video is not permissible in the test track, a draft sketch of the track can be made for future reference and should be made available with the test data.
3. It is also recommended to record the local weather information during the test period and make it available with the test data.
7.6.3.2.2 Test results The test results are presented in this section. Figures 29-32 represent key performance indicators, for example packet reception ratio, inter-packet gap and RSSI as a function of distance between the RSU and the MV. The C-V2X (DSRC) interference vehicles (IV1 and IV2) are moving along the same lane with the DSRC MV. The distances between the MV and each IV is kept constant at 10 meters.
The specific test case in Section 7.6.3.2 involves I2V messaging, and it requires the DSRC MV to receive and decode the I2V messages as it approaches and recedes from the RSU. Therefore, the receiver performance has been evaluated only at the DSRC MV; the receiver performances at the RSU and at the CV2X OBUs were not considered as relevant for this test case.
For illustration purposes, each figure includes:
- Baseline performance without any interference by either C-V2X or DSRC
- Performance in the presence of interference from C-V2X CH183
- Performance in the presence of interference from DSRC in Channels 182 and 184.
The remainder of this section (Figures 29-32) presents results of the impact of high load interference from C-V2X/DSRC transmissions in CH183/(CH182+CH184) on DSRC transmissions in CH178 from the RSU to the MV. Baseline tests represent the test with the interference turned off however, the IVs were still moving with the MV and thus no dips in the RSSI plots. It is observed that turning on the interference signal presents negligible to no impact on the reception of messages in CH178, from the RSU to the MV, on the 1.4-km test track.

44
Figure 29: C-V2X/DSRC in CH183/(CH182+CH184) interference on DSRC in CH178 average PRR at the MV as a function of distance between the RSU and MV

45
Figure 30: C-V2X/DSRC in CH183/(CH182+CH184) interference on DSRC in CH178 average IPG at the MV as a function of distance between the RSU and MV
Figure 31: C-V2X/DSRC in CH183/(CH182+CH184) interference on DSRC in CH178 CDF of IPG vs. distance at the MV as a function of distance between the RSU and MV
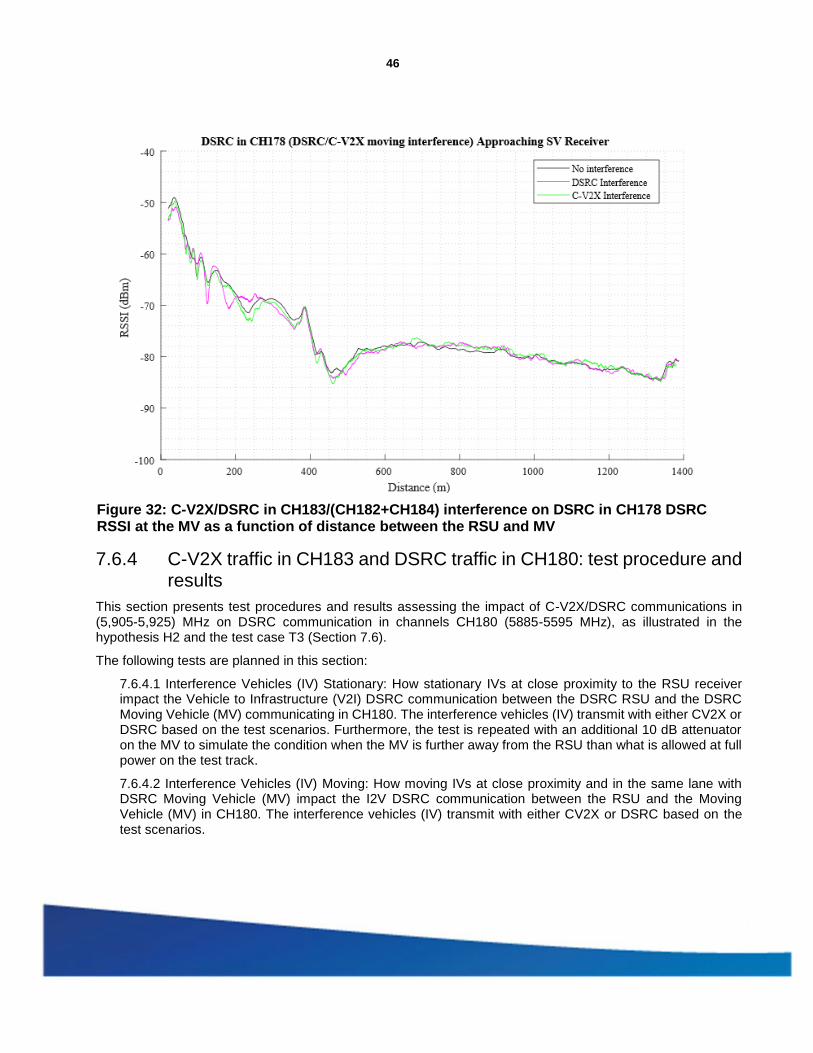
46
Figure 32: C-V2X/DSRC in CH183/(CH182+CH184) interference on DSRC in CH178 DSRC RSSI at the MV as a function of distance between the RSU and MV
7.6.4 C-V2X traffic in CH183 and DSRC traffic in CH180: test procedure and results
This section presents test procedures and results assessing the impact of C-V2X/DSRC communications in (5,905-5,925) MHz on DSRC communication in channels CH180 (5885-5595 MHz), as illustrated in the hypothesis H2 and the test case T3 (Section 7.6).
The following tests are planned in this section:
7.6.4.1 Interference Vehicles (IV) Stationary: How stationary IVs at close proximity to the RSU receiver impact the Vehicle to Infrastructure (V2I) DSRC communication between the DSRC RSU and the DSRC Moving Vehicle (MV) communicating in CH180. The interference vehicles (IV) transmit with either CV2X or DSRC based on the test scenarios. Furthermore, the test is repeated with an additional 10 dB attenuator on the MV to simulate the condition when the MV is further away from the RSU than what is allowed at full power on the test track.
7.6.4.2 Interference Vehicles (IV) Moving: How moving IVs at close proximity and in the same lane with DSRC Moving Vehicle (MV) impact the I2V DSRC communication between the RSU and the Moving Vehicle (MV) in CH180. The interference vehicles (IV) transmit with either CV2X or DSRC based on the test scenarios.
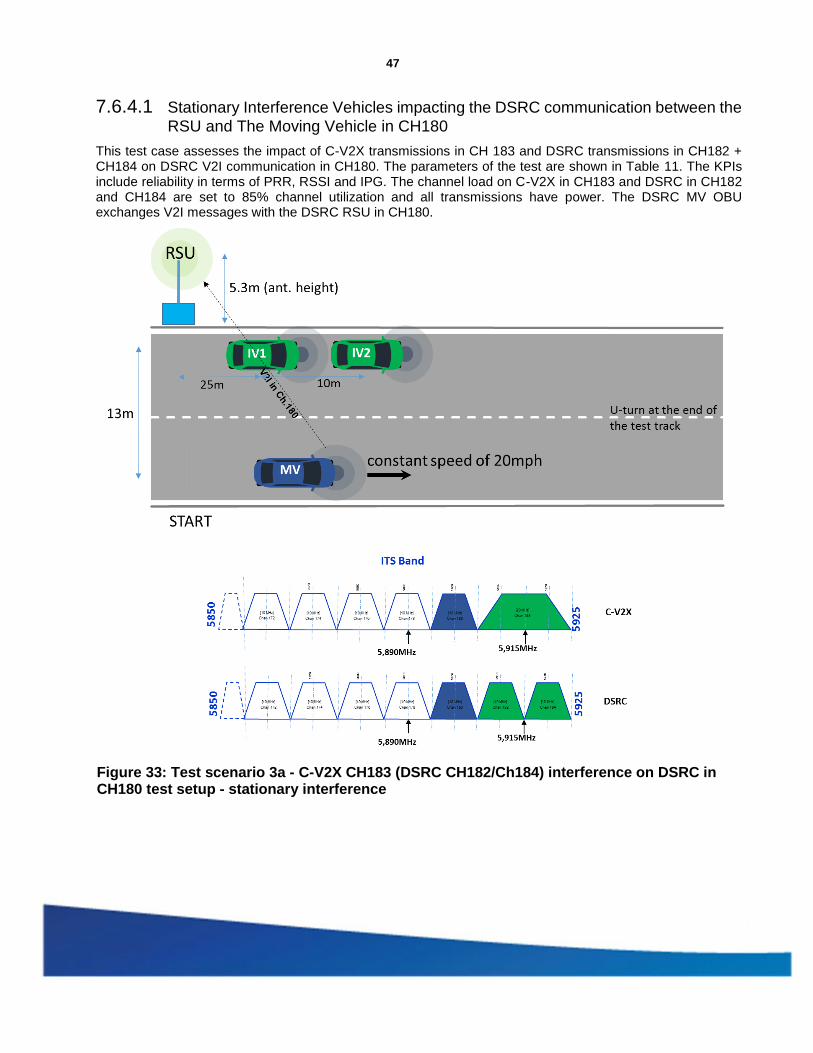
47
7.6.4.1 Stationary Interference Vehicles impacting the DSRC communication between the RSU and The Moving Vehicle in CH180
This test case assesses the impact of C-V2X transmissions in CH 183 and DSRC transmissions in CH182 + CH184 on DSRC V2I communication in CH180. The parameters of the test are shown in Table 11. The KPIs include reliability in terms of PRR, RSSI and IPG. The channel load on C-V2X in CH183 and DSRC in CH182 and CH184 are set to 85% channel utilization and all transmissions have power. The DSRC MV OBU exchanges V2I messages with the DSRC RSU in CH180.
Figure 33: Test scenario 3a - C-V2X CH183 (DSRC CH182/Ch184) interference on DSRC in CH180 test setup - stationary interference

48
Table 11: Test parameters
Parameters CV2X/DSRC Interference DSRC OBU DSRC RSU
Channel 183/(182 and 184) 180 180 Frequency (Hz) NA 10 10 Payload (Bytes) Varies. See Table 8 193 193 Power at Antenna Input (dBm) 18 18 18 Additional attenuation (dB) 0 0, 10 0 Channel Load (%) ~85%
Figure 33 shows the test setup together with a frequency plan for the safety (control) and the interference channel(s), respectively. Two interference vehicles (IVs) are placed at distance ‘D’ from the RSU. For uniformity, the IVs and the MV use antennas with the same make, model and specifications. However, the IVs and the MV can be of different make and model years. In this test IVs were both Ford Taurus’ and the MV was a Ford Fusion. The RSU receives the V2I messages from the MV. For this test, messages with security credentials can be considered optional.
Transmit power of all devices is set at the effective transmit power of 18 dBm as described in Section 7.2.
The frequency diagram in Figure 33 illustrates the position of the DSRC service channel (CH180) and the interference channel (s) CH183 (CH182, CH184) used in this test.
7.6.4.1.1 Test procedure Step 1: Test setup
RSU
- Place RSU at one end of the track, preferably in a location that is not blocked or obstructed by a large tree, building or other structure. Set the RSU antenna mounted at a height of 5.3 meters above the roadway bed surface. Set the RSU Configuration per Table 11.
MV
1. Place MV at one end of the test track, where the RSU has been placed. It is preferred to select a clear LOS environment for this test. Take note of any visible obstruction in the surrounding, for example, nearby large trees, building or structure which can cause signal attenuation and fading. Set the MV configuration as per Table 11.
2. Before starting the test, make sure that the MV is transmitting V2I messages in CH180 and the transmission data is logged properly at the MV. Also make sure that the RSU is receiving the V2I messages in CH180 and the received messages are logged properly at the RSU.
3. The driver (and the observer) of the MV must be aware of the surroundings and should be comfortable with the driving conditions and test requirements. The observer can have wireless communication devices (walkie-talkie, mobile phone) in the MV to communicate with the test coordinator during the test.

49
IV
1. One stationary position is used for the IV1 and IV2 at 25 m and 35 m from the RSU, respectively.
2. It is preferred to select a clear LOS environment for this test. Take note of any visible obstruction in the surroundings, for example, nearby large trees, building or structure that can cause signal attenuation and fading from the IV to the RSU and the MV.
3. Set the IV configuration per Table 11.
4. Before starting the test, make sure that the IVs are transmitting in CH183(CH182+CH184 for DSRC) and the transmission data is logged properly.
5. Any observer(s) in the IVs should be aware of the surrounding and test requirements. The observers in the IVs should have wireless communication devices (walkie-talkie, mobile phone). However, placing observers in IVs is optional.
6. The IVs need to be configured to create a channel load of up to 80%.
Step 2: Test execution
Step 2a: Interference from C-V2X in CH 183
1. The MV starts from one end of the track where the RSU has been placed. The MV starts receding from the RSU and IVs (see Figure 33) at a constant speed maintained at 20 mph.
2. The MV makes multiple loops while receding from and approaching the RSU and IVs. Each test consists of 6 loops. The approximate length of the track is 1400 meters.
3. At the end of 6 loops, test data is collected (wirelessly remote data collection and logging is also possible) from the data logging devices. Test data will be saved for further analyses.
4. All data will be saved in secure storage for further analyses.
Step 2b: Interference from DSRC in CH182+CH184
- Repeat all the steps from Step 2a except the IVs use DSRC technology in CH182 + CH184.
Step 3: Test completion
1. At the end of all test cycles, make sure that the data from the test runs has been logged properly. It is prudent to run a few quick checks on the test data for any anomaly and abnormal behavior. If any anomaly is observed, it must be recorded and investigated for root cause analyses and the tests should be repeated.
2. It is also recommended to record the local weather information during the test period and make it available with test data.
7.6.4.1.2 Test results The test results are presented in this section. Figures 34-41 represent key performance indicators, for example packet reception ratio, inter-packet gap and RSSI as a function of distance between the RSU and the MV. The C-V2X (DSRC) interference vehicles (IV1 and IV2) are stationary at distances 25 meters and 35 meters from the RSU, respectively.
The specific test case in Section 7.6.4.1 involves V2I messaging and requires the DSRC RSU to receive and decode the V2I messages as the DSRC MV approaches and recedes from the RSU. Therefore, the receiver performance has been evaluated only at the DSRC RSU; the receiver performances at the MV and at the CV2X OBUs were not considered as critical for this test case. Although not presented below, no impact was noticed on the I2V link for the length of the track in this use case.
50
For illustration purposes, each figure includes:
- Baseline performance without any interference by either C-V2X or DSRC
- Performance in the presence of interference from CV2X CH183
- Performance in the presence of interference from DSRC in Channels 182 and 184
Figures 34-37 presents results of the impact of high load interference from C-V2X/DSRC transmissions in CH183/(CH182+CH184) on DSRC transmissions in CH180 from the MV to the RSU. Baseline tests represent the test with the interference turned off. The dips in the RSSI plot are at different distances compared to plots in Figure 26 which can be explained by the higher elevation of the RSU antenna (5.3 m).
The results show that C-V2X interference gradually starts impacting reception at the RSU as the MV moves beyond 1000 m under these artificially high loading conditions. The 1000 m still provides more than adequate range for V2I and I2V applications under transitory periods of possible interference.
The result can be explained by the nature of the emissions roll off at the band edge. Overall, C-V2X interference has lower emissions in CH180 as compared to DSRC as shown in Figures 20 and 21; however, C-V2X transmission has a slightly higher emission at the edge of the band and then rolls off quickly as can be seen near marker three in Figure 21 for the device operating in the lower 50 RB’s. The DSRC PER (packet error rate) in CH180 depends on the number of DSRC sub-carriers impacted by the interfering signal. When the DSRC transmitter is close to the receiver, no impact is seen from either C-V2X or DSRC as the received signal is well above the interference. As the MV starts driving away, the received signal from the MV at RSU becomes weaker and starts to get impacted by the interferer. The impact is seen when the C-V2X interference aligns with the edge of the band, causing gradual impact to reception at the RSU. A sharp roll off in MV receptions at RSU is not observed as the C-V2X transmissions are not always aligning with the lower edge of the band. From the Figure 34 it can be noted that impact from DSRC interferer starts to be seen around 1300m. However, the end of the track is soon reached. It is hypothesized that as the MV continues to move further, the DSRC impact will be seen.
To test this hypothesis, a 10-dB attenuator is added to the MV, to simulate the MV moving beyond the current track. The results of this test are shown in Figure 35. It shows impact from DSRC interferer as compared to baseline proving that eventually DSRC interference would have impacted the link as well. It can also be noted that the C-V2X interferer has a more gradual impact to the communications between MV and RSU as compared to the DSRC interferer.

51
Figure 34: C-V2X/DSRC in CH183/(CH182+CH184) interference on DSRC in CH180 average PRR at the RSU as a function of distance between the RSU and MV
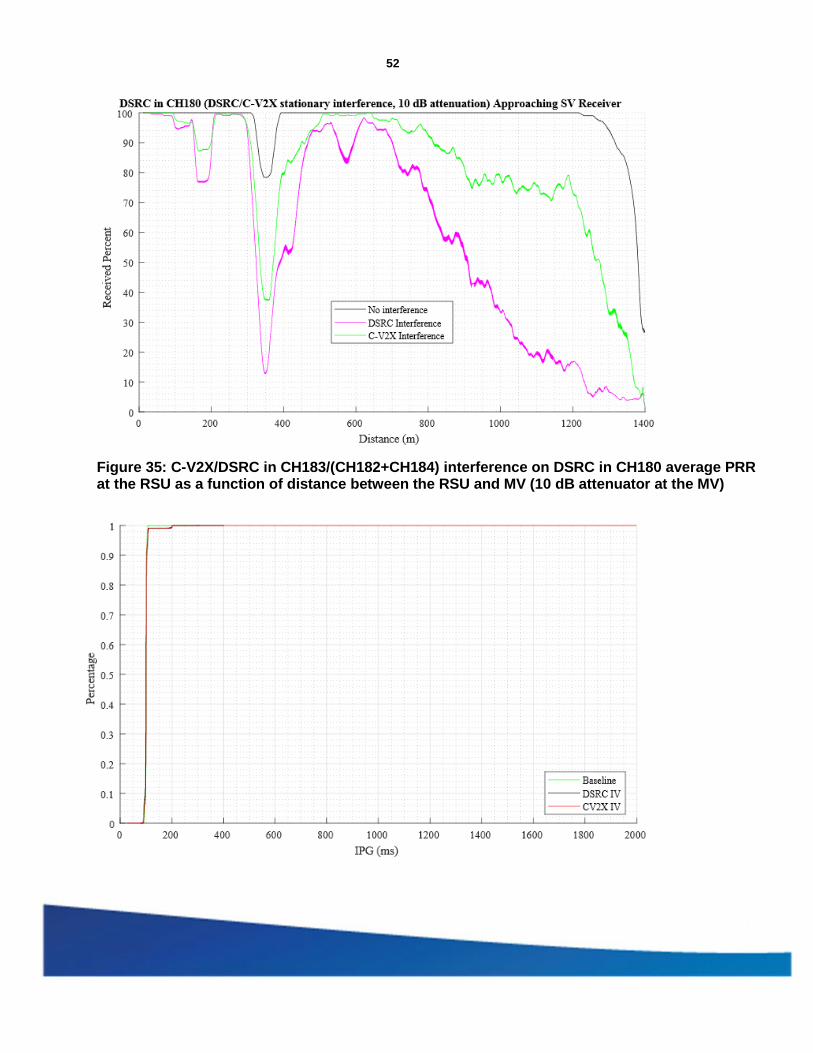
52
Figure 35: C-V2X/DSRC in CH183/(CH182+CH184) interference on DSRC in CH180 average PRR at the RSU as a function of distance between the RSU and MV (10 dB attenuator at the MV)

53
Figure 35: C-V2X/DSRC in CH183/(CH182+CH184) interference on DSRC in CH180 average IPG vs. distance at the RSU as a function of distance between the RSU and MV

54
Figure 37: C-V2X/DSRC in CH183/(CH182+CH184) interference on DSRC in CH180 average IPG vs. distance at the RSU as a function of distance between the RSU and MV (10 dB attenuator at the MV)
Figure 38: C-V2X/DSRC in CH183/(CH182+CH184) interference on DSRC in CH180 average Packet Reception Ratio at the RSU as a function of distance between the RSU and MV (8dBm MV power)
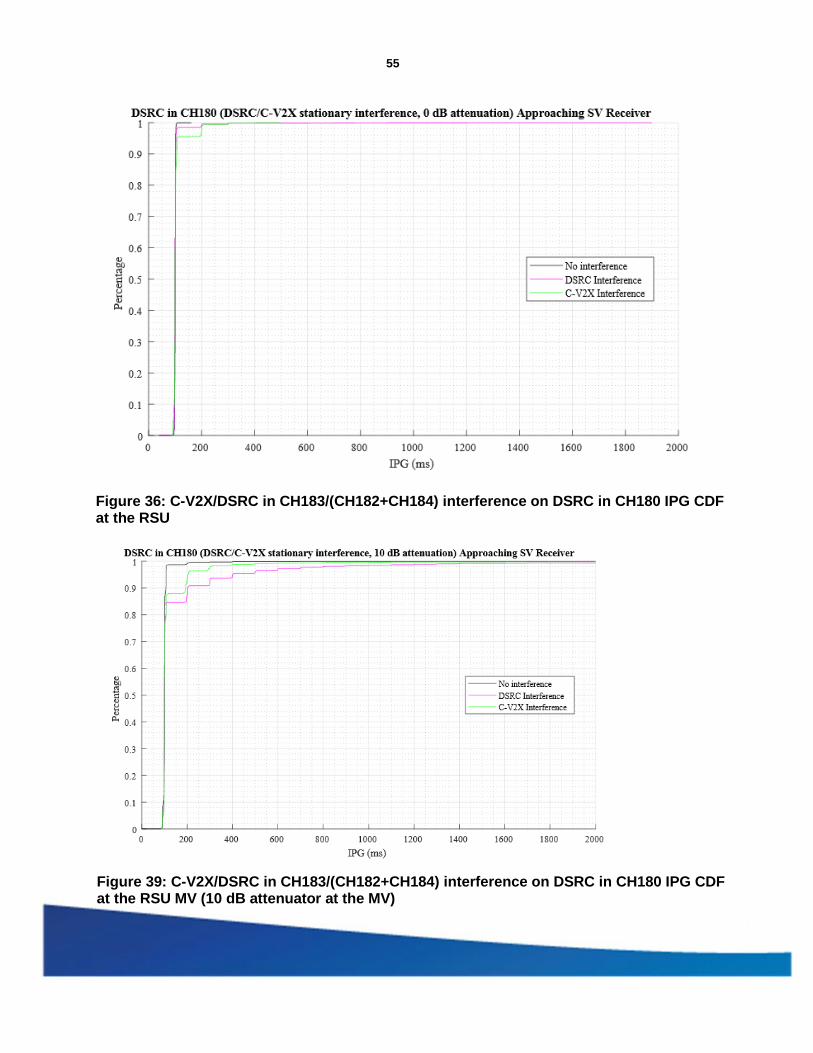
55
Figure 36: C-V2X/DSRC in CH183/(CH182+CH184) interference on DSRC in CH180 IPG CDF at the RSU
Figure 39: C-V2X/DSRC in CH183/(CH182+CH184) interference on DSRC in CH180 IPG CDF at the RSU MV (10 dB attenuator at the MV)

56
Figure 40: C-V2X/DSRC in CH183/(CH182+CH184) interference on DSRC in CH180 Inter-Packet Gap
CDF at the RSU (8dBm MV power)
Figure 40: C-V2X/DSRC in CH183/(CH182+CH184) interference on DSRC in CH180 RSSI vs. distance at the RSU as a function of distance between the RSU and MV
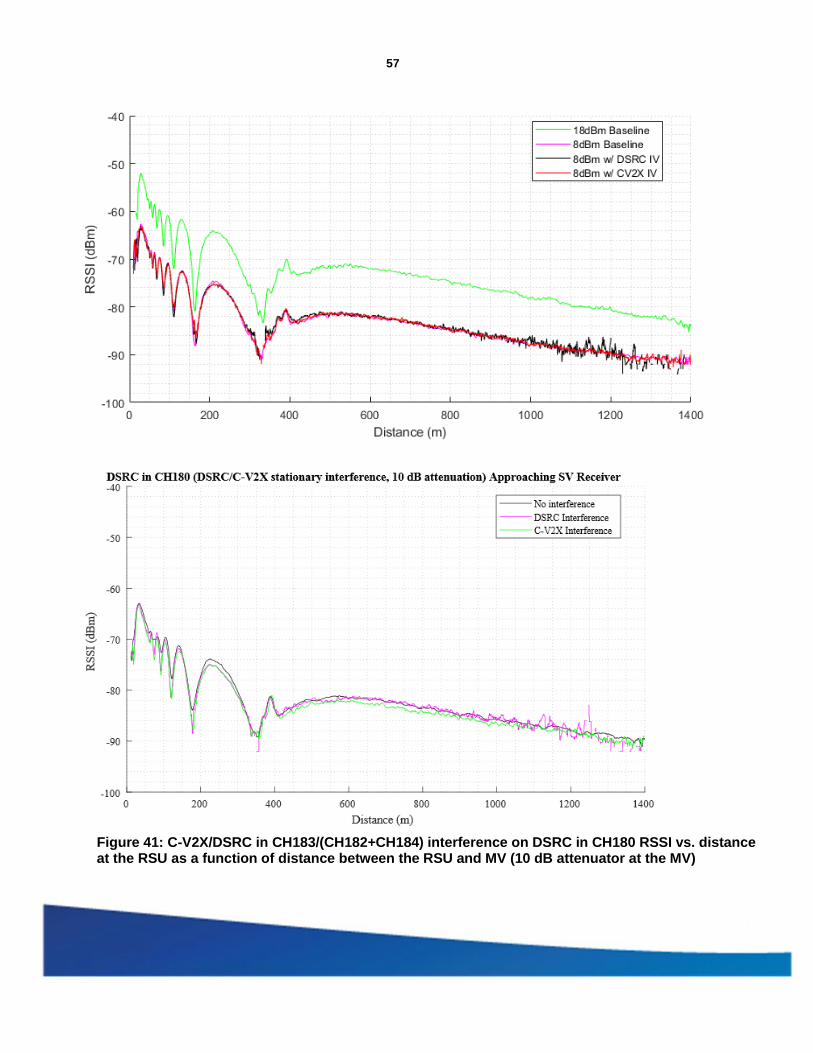
57
Figure 41: C-V2X/DSRC in CH183/(CH182+CH184) interference on DSRC in CH180 RSSI vs. distance at the RSU as a function of distance between the RSU and MV (10 dB attenuator at the MV)

58
7.6.4.2 Interference Vehicles move in the same lane with the DSRC MV impacting the V2I and I2V DSRC communication between the MV and the RSU in CH180
This test assesses the impact of C-V2X transmission in CH 183 and DSRC transmission in CH182 + CH184 on DSRC V2I and I2V communication in CH180 when the interference is in close proximity to the MV. The parameters of the test are shown in Table 12. The KPIs include reliability in terms of PRR, RSSI and IPG. The channel load on C-V2X in CH183 and DSRC in CH182 and CH184 are set up to 85% channel utilization. The MV exchanges V2I and I2V messages with the RSU in DSRC CH180.
Figure 42: Test scenario 3b - C-V2X CH183 (DSRC CH182/Ch184) interference on DSRC CH180 test setup - moving interference

59
Table 12: Test parameters
Parameters C-V2X/DSRC interference DSRC OBU DSRC RSU
Channel 183/(182 and 184) 180 180 Frequency (Hz) NA 10 10 Payload (Bytes) NA 193 193 Power at Antenna Input (dBm) 18 18 18 Additional attenuation (dB) 0 0 0 Channel Load (%) ~85
Figure 42 shows the test setup together with a frequency plan for the V2I and I2V safety (service) and the interference channel(s), i.e., CH180 and CH183, respectively. Two interference vehicles (IVs) are placed at distance of 15 m from the MV as shown in Figure 42. For uniformity, the IVs and the MV use antennas with the same make, model and specifications. However, the vehicles (IVs and MV) can be of different make and model years. The RSU receives the V2I messages from the MV and transmits I2V messages to the MV.
The effective transmit power of both DSRC OBU, DSRC RSU as well as the interference OBUs are maintained at 18 dBm.
The frequency diagram in Figure 42 illustrates the position of the DSRC service channel (CH180) and the interference channel (s) CH183 (CH182, CH184) used in this test.
7.6.4.2.1 Test procedure Step 1: Test setup
RSU
- RSU is placed at one end of the track, preferably in a location that is not blocked or obstructed by a large tree, building or other structure. Set the RSU antenna mounted at a height between 8 meters and 15 meters above the roadway bed surface. Set the RSU Configuration per Table 12.
MV
1. MV is placed at one end of the test track, next to the RSU. Clear LOS environment needs to be ensured. Take note of any visible obstruction in the surrounding, for example, nearby large trees, building or structure that can cause signal attenuation and fading. Set the MV configuration per Table 12.
2. Before starting the test, make sure that the MV is transmitting V2I messages in CH180 and the transmission data is logged properly at the MV. Also make sure that the RSU is receiving the V2I messages in CH180 and the received messages are logged properly at the RSU. The same procedure is followed for the I2V messages from RSU to the MV.
IV
1. One IV is placed in front of the MV and the other IV is placed behind the MV. Both IVs maintain a safe distance of approximately 15 meters from the B pillar to B pillar.
2. Clear LOS environment is used between all vehicle actors.
3. IV configuration is set per Table 12.
4. Before starting the test, ensure that the IVs are transmitting in CH183 and high load and the transmission data is logged properly.
5. The IVs need to be configured to create channel load of up to ~85%.
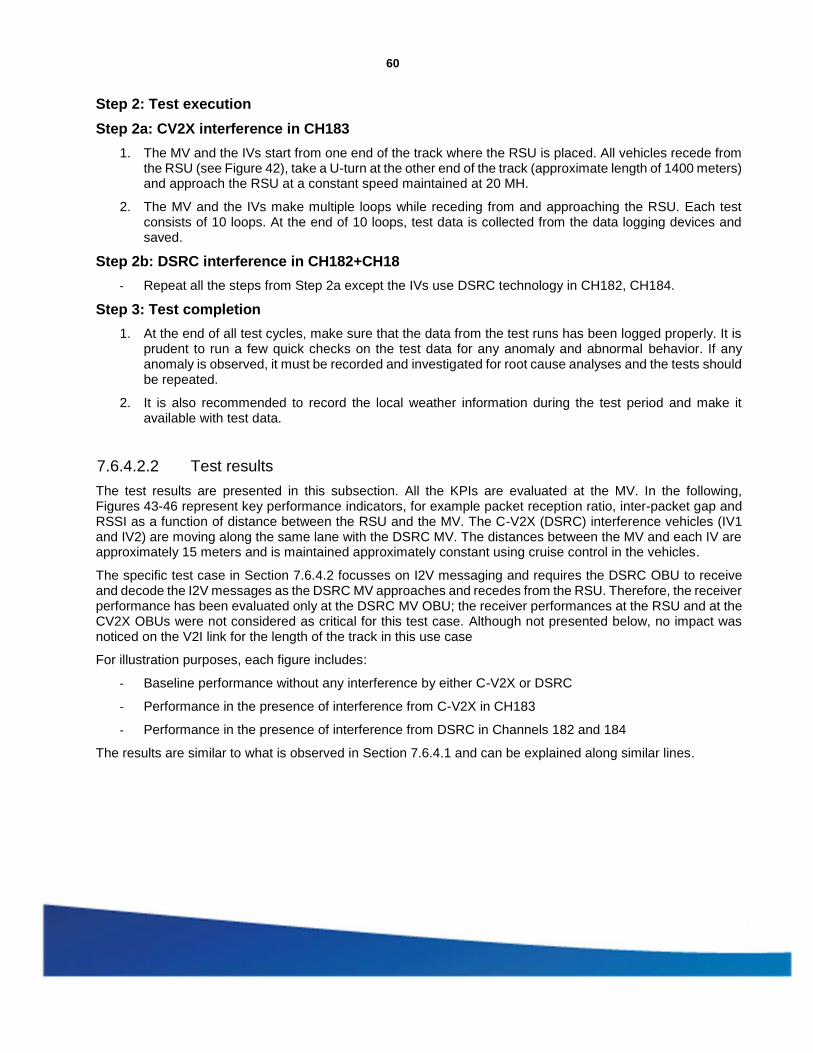
60
Step 2: Test execution
Step 2a: CV2X interference in CH183
1. The MV and the IVs start from one end of the track where the RSU is placed. All vehicles recede from the RSU (see Figure 42), take a U-turn at the other end of the track (approximate length of 1400 meters) and approach the RSU at a constant speed maintained at 20 MH.
2. The MV and the IVs make multiple loops while receding from and approaching the RSU. Each test consists of 10 loops. At the end of 10 loops, test data is collected from the data logging devices and saved.
Step 2b: DSRC interference in CH182+CH18
- Repeat all the steps from Step 2a except the IVs use DSRC technology in CH182, CH184.
Step 3: Test completion
1. At the end of all test cycles, make sure that the data from the test runs has been logged properly. It is prudent to run a few quick checks on the test data for any anomaly and abnormal behavior. If any anomaly is observed, it must be recorded and investigated for root cause analyses and the tests should be repeated.
2. It is also recommended to record the local weather information during the test period and make it available with test data.
7.6.4.2.2 Test results The test results are presented in this subsection. All the KPIs are evaluated at the MV. In the following, Figures 43-46 represent key performance indicators, for example packet reception ratio, inter-packet gap and RSSI as a function of distance between the RSU and the MV. The C-V2X (DSRC) interference vehicles (IV1 and IV2) are moving along the same lane with the DSRC MV. The distances between the MV and each IV are approximately 15 meters and is maintained approximately constant using cruise control in the vehicles.
The specific test case in Section 7.6.4.2 focusses on I2V messaging and requires the DSRC OBU to receive and decode the I2V messages as the DSRC MV approaches and recedes from the RSU. Therefore, the receiver performance has been evaluated only at the DSRC MV OBU; the receiver performances at the RSU and at the CV2X OBUs were not considered as critical for this test case. Although not presented below, no impact was noticed on the V2I link for the length of the track in this use case
For illustration purposes, each figure includes:
- Baseline performance without any interference by either C-V2X or DSRC
- Performance in the presence of interference from C-V2X in CH183
- Performance in the presence of interference from DSRC in Channels 182 and 184
The results are similar to what is observed in Section 7.6.4.1 and can be explained along similar lines.
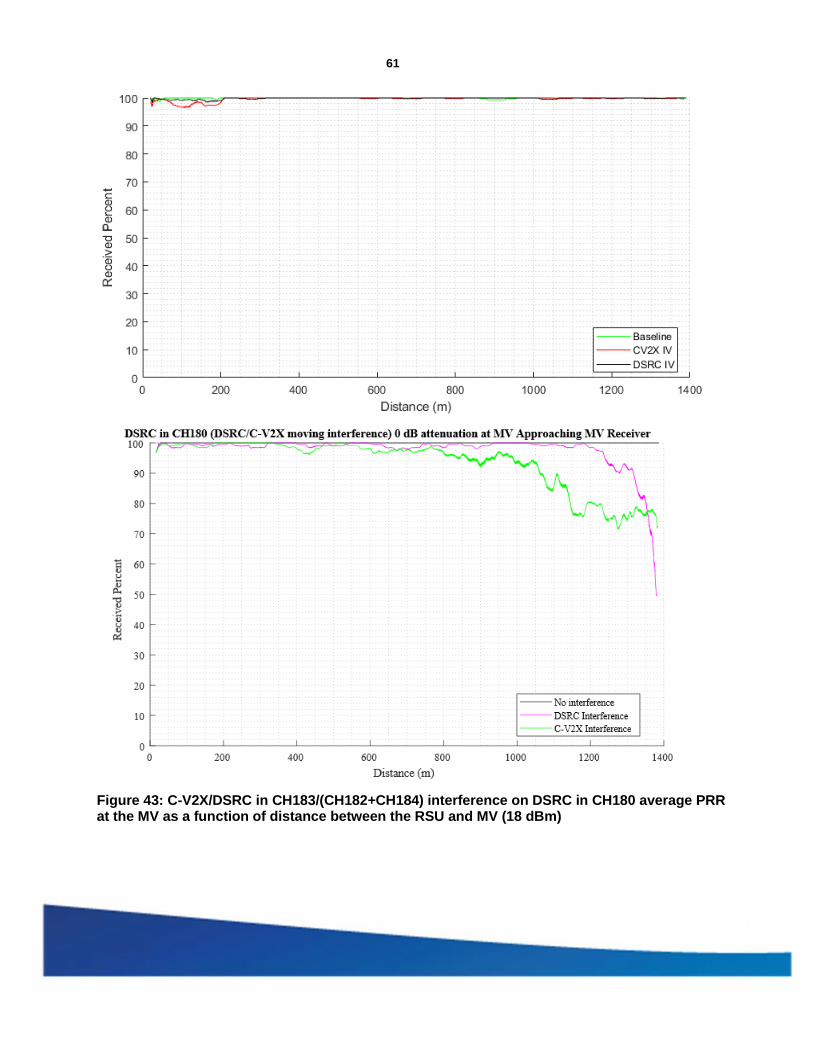
61
Figure 43: C-V2X/DSRC in CH183/(CH182+CH184) interference on DSRC in CH180 average PRR at the MV as a function of distance between the RSU and MV (18 dBm)
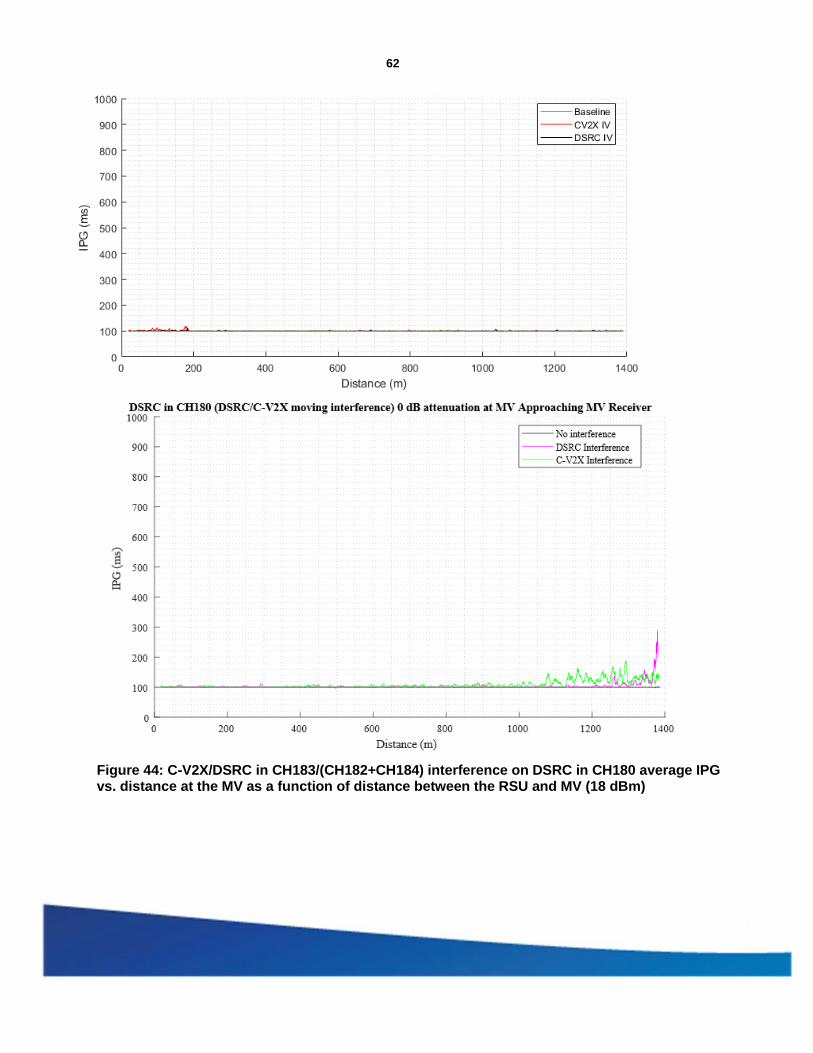
62
Figure 44: C-V2X/DSRC in CH183/(CH182+CH184) interference on DSRC in CH180 average IPG vs. distance at the MV as a function of distance between the RSU and MV (18 dBm)

63
Figure 45: C-V2X/DSRC in CH183/(CH182+CH184) interference on DSRC in CH180 IPG CDF at the MV (18 dBm)
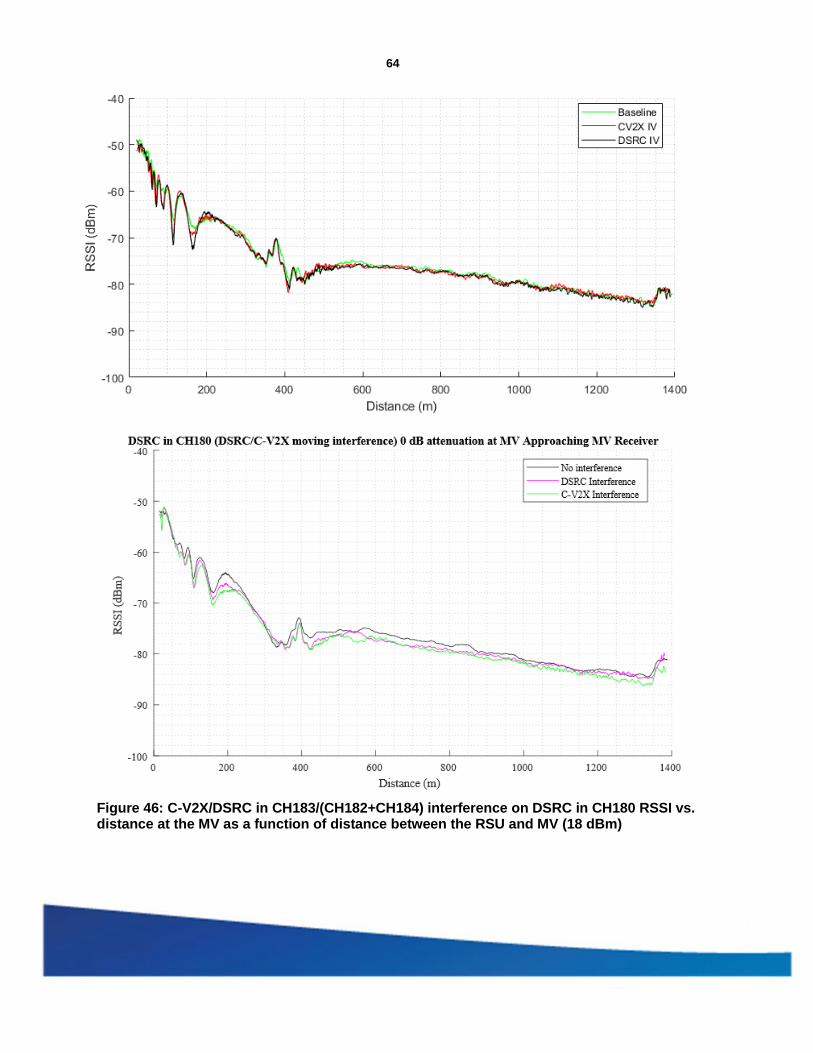
64
Figure 46: C-V2X/DSRC in CH183/(CH182+CH184) interference on DSRC in CH180 RSSI vs. distance at the MV as a function of distance between the RSU and MV (18 dBm)
65
7.7 Key takeaways The field tests address two hypotheses:
1. Reliability of the BSM message transmission in 20-MHz channel is the same as in the 10-MHz channel.
2. C-V2X transmissions in CH183 either:
a. Present no interference impact to DSRC communication or
b. Present minimal impact to DSRC communication in ranges of practical relevance
The field tests have confirmed that C-V2X performance in terms of reliability as a function of distance as well as IPG is unchanged between the 10-MHz and 20-MHz channel bandwidths.
The interference tests have shown that both C-V2X and DSRC high load interference present minimal impact to planned DSRC communications in CH172-CH180. In particular, no impact was observed from C-V2X transmissions in CH183 on DSRC basic safety communications in CH172. Furthermore, on the 1.4-km test track used no impact was observed on DSRC V2I and I2V communications in CH178 from either C-V2X or DSRC communication in the 20-MHZ bandwidth [5,905 MHz - 5,925 MHz] when the transmit power levels were the same for both the DSRC desired signal and the C-V2X/DSRC interference.
Some impact is seen on CH 180 beyond LOS range of 1000 m. The Tx-Rx distance of 1000 m is considered more than adequate range for V2I and I2V applications. It should also be noted that the interference used in this test is unrealistically high for reasons mentioned in section 7.6.1. In realistic scenarios the expected impact is less than what is observed here. This test was conducted with the same RSU power as for the OBUs, leaving room for impact reductions on the I2V link if the higher RSU power were to be used
8 Conclusion and Next Steps Following the 5GAA Benchmark Test Report (5GAA Benchmark Test Report), which presents the results of comparative testing between DSRC and C-V2X and shows range and interference resilience advantages for C-V2X, Ford and Qualcomm performed additional tests in support of the latest 5GAA petition for waiver with the FCC for C-V2X deployment.
The tests addressed two hypotheses:
1. Reliability of the C-V2X message transmissions in the 20-MHz channel is close to that measured in 10 MHz
2. C-V2X communications in the 20-MHz CH183 impacts existing V2X transmission in the neighboring adjacent and non-adjacent ITS channels similar to DSRC transmissions in the same 20 MHz with the same load and RF characteristics.
In a series of laboratory and field tests it is observed that:
- C-V2X communication in 20-MHz CH183 has the same reliability performance (Packet Reception Ratio vs. distance) as the identical BSM-like message transmission in 10-MHz CH184.
- Impact of C-V2X high load transmissions in CH183 on DSRC basic safety transmissions in CH172 is negligible up to a 1.4-km range in LOS conditions
- Impact of C-V2X high load transmissions in CH183 on V2I and I2V transmissions in CH178 is negligible up to a 1.4-km range in LOS conditions
- Impact of C-V2X high load transmissions in CH183 on V2I and I2V transmissions in CH180 is negligible up to 1 km in LOS Conditions

66
The interference selected for the tests is in excess of what will be experienced in a real deployment for several reasons:
- The load was high all the time (85% utilization);
- Interference power is always high for all transmissions;
- The distance of the interfering node to the DSRC receiver was always fixed between 10 and 35 meters depending upon the tests.
The tests in this document use these extreme loading conditions to stretch the receiving conditions for an extended time. If performance under these conditions is acceptable, the same is implied for less stringent conditions. In realistic scenarios, the interference at any point would be a result of many transmissions being received from various distances and thus at varying receive powers and would likely be transitory in nature. The significant interference allowed testing for corner cases and capturing results with high statistical confidence.
The testing of high load in CH183 for C-V2X and /CH182+CH184 for DSRC and its impact on DSRC operation in CH178 and CH180 has been done with 193-byte packets. Next set of tests could include larger DSRC payloads up to 1400 bytes with the same test procedures
Annex A: Change History Date Section Owner Note