v0l.x .relationship between road pavement failures
TRANSCRIPT

GLOW JOURNAL OF GEOLOGICAL SCIENCES v0L.x NO. 2.2005:399 - 108 lSW 1596-6798. COPYRIGHT BACHUDO SCIENCE CO. LTD. PRINTED IN NIGlWA
.RELATIONSHIP BETWEEN ROAD PAVEMENT FAILURES, ENGINEERING INDICES AND UNDERLMNG GEULOGY IN A TROPICAL ENVIRONMENT
(Received 19 December?OOZ; Revision accepted 3 1 May 2004) ABSTRACT
This article presents the results of a study carried out to relate the frequency of pavement failures, the engineering indices of the ? .')grade materials and the underlying geology. The results show a high variability in the indices such as the liquid limit, LL, the pidsticity index, PI, the maxirnum dry density, MDD, the optimum moisture content, OMC, compressibility and the California Yearing Ratio, CBR, between the different geologic units. Engineering indices having significant correlation with CBR (the major criteria for assessing the quality of subgrade materiais), are used to develop a scheme for evaluating the materials at different failure points along the Calabar-ltu Highway in Nigeria. The evaluation shows that locations exhibiting high failure rates are underlain by shaly or marly subgrade whereas locations characterised by low failure rates are underlain by weathered basement or sandy unit as subgrade. It is recommended that .maintenance and provision of drainage facilities will go a long way to reducing the rate of fsilure.
KEYWORDS: Engineering indices, Failure, Road pavement, Subgrade, Nigeria
The Government of Nigeria has over the .ast three decades, embarked on the construction of roads and highways tc inlprove tl.~e socio-ecot.~omic connections between towns an@ cities. I-iowever, the realisation of this objective is being threatened by the failures ot these pavements, with some of the pavements turning to 'death traps'. For instance the Nigerian Association of Road Transport Onwers ( NARTO), is plesently contemplating taking the Federal Government to 1. rrt for the poor stateJcondition of the nation's highway, attributing it to the main cause of road accidents' ( Nigerian Vanguard. July 6 2002).
The roads and highways in Nigeria, including the sluJy area, were desigl~sd to .meet certain objectives as slttlined .by Peattice (1978;. The,se include carrying traffic safely. conveniently slid sconomically over the design life of !3e pavement by protectiny the subgrade from !ile effects of ~ r a h ~ c and cliniate ana ,rlsurin, that no materials used in th& pavement suffer any unacceptable deterioration. These roads however, have not satisfied these objectives. The observed fa~lures which range from mild to severe (Plates 1 to 3), may be due to lack of maintenance, greater haulage loads !:,an ozslgnetl ror and the underlying geology of the high\;jys.
This study focused on the l~nderlying geology of the highway. It used engineering ~ndices of tne subgrades at observed failure polnts to evaluate the quality of the subgrades and underlying geologic materials.
.Studies by others have shown that the failure of pavements is variously linked to the inadequate provision of drainage facilities (Aciegoke-Anthony & A ~ a d a 1982; Akpan : 32); excessive haulage loads, rutting, pitting, asphalt bieediny. ~fisufficient compaction, insufficient pavemer~t thickness atid the shearing of flexible pavements (Adeniji 1984: A~lowar 1986): volurne chanaes due to seasonal water
on the performance of roads in 30 countries in tropical regions lnd~cates that he frequency of failure increases wiih pave ..ent age. In N~geria, some studies have been carried ,dt on the mfluence ot geology on pavement failures. These studies are, however, restr~cted to mono-lithologic units. such as the
crystalline basement (Adeniji 1984; Anowai 1986; Teme et al 1987), and shale and clay (Ola ,1983; Akpokodje 1986; Uduji et al 1994). The work of Gidigasu (1983) and Madedor (19831, however, gave a general outline-for the design of pavements, taking into consideration the environmental, soi; and geologic characteristics of the terrain.
STUDY SITE
The study site is located In a humla tropical cl~mate The area experiences two major seasons, the wet and the dry Meteorological data for the period 1990-2000 show that the temperature varies between 21.3 and 34.3" C and 21.? a i ~ d 35.2" C for the wet and dry seasons, respectively. The amount of rainfall varles between 0 and 286.3 mm and 5 4 a ~ l d 795.6 mm for the dry and wet seasons, respeclively.
The area comprises numerous lithologic sequences ranging in age from Precambrian to Tertiary. The rnajor geologic formations include the Precambrian Oban massif (gneiss, schist, granite, pegmatite etc), the Aptian-Albian Awi Sandstone (sandstone, siltstone), the Albian Mfamosing Limestone (various types of limestone), the Late Albiarl- Turonian Ekenkpon Shale (organic shale, calcerous mudstone). Coniancian #Jew Netim Marl (marl with minor calcerous siltstone beds), the Late Campanian-Maastrichtian Nkporo Shale (carbonaceous shale with rnudstone and gypsum beds), and the Tertiary Coastal Plain Sands (iravel, sand, silt, clay), as shown on Fig. 1 and In Table 1 (Ekb~ue~ne et al 1995).
table vanations ('\/an Der ~ e & . 1980): and expansive subgrades (Van Der Mewe & Ahronovilz 1973; Richards AND DESIGNATlONS
1973. Bullman 1980: Ola ,1983; Akpokodje 1986; Gourley & Newe111993: Gourley et al 1993; Uduji et al 1994). One of the The samples of subgrades were collected from ,nap; factois respons~ble f o ~ pavement failure in the tropical Pavelnellt fail11l.e points ~JSlng a hand auger to a depth of 1 nl, climales Is tile applicatio17 of temper~le region specifications in within different geologic units (Fig. 1, Table 1). The sanlples tcoprcal rey,ol-.s ( ~ ~ d ~ ~ ~ ~ ~ ~ 1~80 ) . The work of Tanner (1963) were analysed to determine their engineerrng parameters for
I
OFONIMEAKPAN, Department of Geology, University of Calabar, P. 0 . B 3609, Calabar, Nigeria. ANIEKAN EDET, ANlEKAN EDET, Department of Geology, University of Calabar, Calabar, Nigeria.

0 0 0 0"
0 0 0 0
0 0 0 0 '
0 0 0 0 0
O O O O O O
" 0 0
0 0 0 0
0 0 0 0 0
0 0 0 0
0 0 0
Cffae+al Plain Sand'
NOW Netim Marl
Ekonkpon Shale
Mfamosing Limestone
A w i Sandstone
Figure 1 Outline geology of study area including sample locations
Swelling b
Non Low Medium High Very High
50 -
# 4 0 -
'z w Montmori llonite C -
S? - * C
0 10 2 0 3 0 40 50 60 70 80 9 0 100
Liquid Limit %
Figure 2 Plot of plasticity index and liquid limit values on plasticity chart

- ~
the purposes of classification a ~ i d evaluation. The paran~eters included grain size, density, natural moisture conren:. Atterberg limits, maximum dry density (MDD), optinlu~n moisture content (OMC) and California Bearing Ratio (CBR), based on International standards (AASHTO 1978; BS 1990).
Samples were collected from the following geologic formations that make up the Calabar Flank: Coastal Plain Sands (samples 1 and 9); Ekenkpon Shale (san,~ples 2 and 3), New Netim Marl (samples 4 and 5); Nkporo Shale (samples 6;' 7 and 8) and Obaii msssif (sample 10). Samples were not collected from the Awi Sandstone and Mfamosing Limestone
Formations, since the study locations did not pass through these units and no failure points were observed on them. Locations 1 and 10 were used-:as controls because no failure occurred in them. In all cases the number of sampling points was determined by the frequenty of failure points.
PAVEMENT FAILURE PATTERN AND FREQUENCY Four major types of pavement failures were identified
us~!.~g the scheme of Teme et al (1987). These included: ( Distress evidenced by the loss of asphalt (locations 6,7.8 and 9), Plate 1
Sam* Failure L o c a l i frequency
Tm%srpRcero( Cashl Pbin Sands Gravel. sand. SIR. clay 1. 9 . none. 3
Llc canlwhm to MslrlrWti Nkpwo Shab
Dark carbbMceous shales 6. 7.8 18.23.17 +h mudslone and (lypsum beds
Ca\*c*n New NeHm Marl Grey foss~lirerous mnrl 4.5 1 0 . R
Dark friable. rssile shale M h intercalations 2.3 16. t I d mark, calcerws mutistone and oysfer beds
no sample
congbmsles. sandslane, riHslone. na sample rnuds~one. shale
Gneiss, nchst, granites, dmrites. grandi lcs. pcgmatites
Groin Size , mm
Figure 3 Range of grainsize curve
Clay Silt S a n d G r a v e l Cobbles
m 0
5 -.

. OFQlllMt AKBAH end AMIEKAN EDET
Plate 2 Wavy surface at location 4
Plate 3 A pothole near at location 7 extending to the subgrade
(ii) Wavy or heaving surface (locations2,3,4,5,6,7,8 and 9), (iv) Shear or massive failures or potholes extendir,? '-1 -5 -
Plate 2 the pavement into the
(iii) Pitting or minor dents, longitudinal cracks running parallel subgrade (locations 2,3.4,5.6 and 8), Plate 3
to the centre line of The frequency of failure, based on the a1:e-e;? - --I?- r:
the highway (locations 4,5 and 9) and failure polnts per km show that the highet: ---re- I- ' 2 I r e

Ire within the Ekenkpon and Nkporo Shales followed by w Netim Marl and Coastal Plain Sands (location 9) 1). No failures were observed at locations 1 (Coastal ands) and 10 (weathered basement). At location 9, the nvolved a complete and continous loss of the asphalt ) 1.5 km (Plate 1).
IERING INDICES
JPE CONTENT AND CONSISTENCY LIMITS The natural moisture content (wn) varied between a
n of 10% at location 1 and a maximum of 29% at I 6. These values reflect a variation .from one lithologic
another. The highest range of values 20-29 % erise the Ekenkpon and Nkporo Shale subgrade Is. The wn for the other subgrade materials include.: t 21-22 %, the Coastal Plain Sand at 10-11% and 16% :ambrian basement (Table 2). The relatively high wn for ement subgrade materials in comparison to the sandy le is due to the clayey nature of the weathered !nt subgrade.. The density of the sandy subgrade Is was in .the range 2.63-2.74 Mg m-' and was the The density range of between 2.60 and 2.65 Mg m",
tained for the shaly and basement subgrades. The ~bgrade materials had the lowest values from 2.54 to ~ m . . The liquid limit (LL), plasticity index (PI) and
je limit (SL) ranged from 53 to 66% 1 7 to 27% and 5.8 % respectively, fur the shaly subgrade materials. ndices were in the range from 54. to 55%, 12 to 17%
( N e w Net im Mar l )
and 6.85 to 7.95% respectively, for the marly subgrades. Sandy subgrades showed ranges from 20 to 41°h, 10 to 11% and 2.7 to 2.g0/o, respectively. The corresponding values for basement subgrades are 38%. 12% and 5.07% respectively. Qualitatively, these materials are described as having moderate (sandy, marly and basement subgrades) through moderate to high (shaly subgrades).plasticity (Table 3). A plot of LL and PI on the plasticity chart (Fig. 2), places the materials within the low (locations I. 7. 9 and 10) to medium (locations 2,3,4,5,6 and 8) swelling potential ranges. The low swelling potential of sample 7 may be due to the sandy natcrz.
Based on the consistency indices, the materials are very stiff, (Tables 2. 3). The clay activity (A) values show the shaly subgrade materials as mostly active, while the materials underlain by marly, sandy and weathered basement subgrades are inactive to normal clay types (Tables 2 and 3).
GRAIN SIZE AND CLASSIFICATION The grain size analyses indicate a predominance of
clayey (20-40 %) and silty (30-56 %) components in the shales and sands (22-73 %) in the other materials (Table 2;. The materials are well graded (Fig. 3).
Under the Unified Soil Classification System (USCS), the materials are classified variously as CL (low plasticity clay. sandy) for the sandy and basement subgrades; MH (high plasticity sandy silt with some gravel), and CH (high plasticity sandy clay with some gravel) and CL for shaly subgrades. On the basis of the American.Association of State Highway and Transportation Official (AASHTO), the sandy and basement subgrades materials are in the groups A-2-7(0-2) and A-2-
L o c a t ~ o n 3 (Ekenkpon S h a l e )
I I I I
8 10 12 14 16 18 20 22 24 26 2 8
Moisture Content '10
Figure 4 Compaction characteristics

104 . OFOMME AKPAN md ANlElAN W
Table 2 Engineering inclices ,
Natural Location Density water Liquid Plasticity Linear Xnsistenc! Activity Oh Clay % Si!: % Sand % Grav~
content limit Index shrinkage index (Mg m 3 (%) (%) (Oh/.) (%)
Tab!e 3 Q w l i i e character of the soil
Location Plasticity* ~onsisteq? ~c t i v i t y~ swellingh Compressibilily* Consolidationc
1 moderate very stiff normal low high oc 9 moderate .very stiff normal low high oc
2 moderate very stiff inactive moderate vwy high hc 3 high very stiff normal moderate vety.high hc
4 moderate very stiff normal moderate very higlr hc 5 moderate very stiff inactive moderate very high hc
6 high very stiff active moderate very high oc 7 high very stiff active Inoderate very high oc 8 high very stiff active moderate high oc
10 moderate very stiff normal low very high nc
nc normally consolidated. oc overcmsdidated. hc high level consolidation
%ell (9992). b~kempton (1944. 1953). 'Meam L Parcher (1963)
6(10) respectively. The marly subgrades are in group A-7-5(6- 7) , while the shaly subgrades are in groups A-7-5(7-11) and A-7-6(8), Table 4. This indicates that the sandy and basement materials are fair to good subgrades and shaly and marly materials are poor to very poor subgrades.
CONSOLIDATION CHARACTERISTICS The consolidation characteristics are based on
liquidity index (IL) defined as wn-PUP1 where Wn is the natural water content, PL is the plastic limit and PI is the plasticity index; and the compressibility using the relation Cc=0.009(LL- lo) , where Cc is the compression index and LL the liqu~d limit (Mean 8 Parcher 1963; Bell 1992). The I; values show that the marly and shaly subgrades (samples 2 and 3) are highly overconsolidated clays while the sandy subgrades and shaly subgrades (6,7 & 8) are overconsolidated. The basement subgrade mateiials are normally consolidated.
The C, values indicate the shaly, marly and basement subgrades to be of very high compressibility. Sandy subgrade
.and shaly suograde (sample 8) are of high compressibility. Tables 3 and 5.
COMPACTION CHARACTERISTICS The compaction characteristics of the materials were
evaluated for the different lithologic units using the Standard Proctor test (Table 5, Fig. 4). The mean maximum dry density (MDD) for the sandy subgrades ranged between 1.97 and 1.96 Mglrn3 with corresponding optimum moisture content (OMC) values of 11.8-12.0%. The basement subgrade showed MDD (1.91 Mglm3) and higher OMC (15.5%). A further decrease in MDD (1.80 to 1.82 Mglm') and increase in OMC (20.4 to 20.9%) characterised the marly subgrades. The lowest MDD (1.53 to 1.80) Mglm3) and the highest OMC ( 18.3 to 24.9%) characterised the shaly subgrades.
According to Gidigasu (1983). Gidigasu et al (1987) and Saha & Chattopadhyay . (1988), the conlpactiori characteristics of a soil are controlled by the index parameters. In this study, the MDD showed significant negative col.~.elal~on

with W , . LL, PI and the amount of clay and significant positive 0.626 at p=0.05 (Table 6). The soaking of these Samples correlation with the amount of sand. The reverse is, however, showed a reduction in tine CBR values with the highest the case for OMC (Table 6). The MDD decreased.as wn, LL, PI reduction of 90% for shaly subgrades and the lowest redxtion and %clay increased and increased as the amount of sand of 6% for sandy subgrades. increased. The opposite is the case for OMC.
CALIFORNIA BEARING RATIO DISCUSSION AND CONCLUSION
The mean values of California Bearing Ratio (CBR) for both soaked and unsoaked samples ranged from 5.5% for No pavement failures were observed at locations 1
and 10 used as control. Location 9 (sandy subgrade) is an old subgrade) to 20'50/0 for lo (basement river bed that was filled and compacted with lateritic matellals subgrade), Table 5. Significanf' correlation existed between incorporating drainage, These fill have bee,, CBR and the amount of sand with a correlation coefficient of away by flood and the drainage has collapsed. Thus the failure
Table 4 Sample classification
Location USCS AASH10 C;c?olo!j~c: t l t~sr:~~j~t io~r
Lean clay wilh sand Sandy lean clay wllli gravel
Sandy elaslic sill wilh gravel Sandy elastic sill
Saridy elaslic sill wilh gravel Sandy elaslic silt wilh gravel
Sandy fa1 &y wilh gravel Sandy elastic sill with gravel Sandy lean clay wilh gravel
Sandy lean clay will1 gravcl
A-2-7( 0 ) Silty sar~tl A-2-7( 2 ) Silly sand
A-7-6( 5 ) Silty clay A-7-5( 8 ) Clayey sill
A-7-5( 7) Claycy sill A-7-3 6 ) Clayey silt
A-7-5( 7 ) Clayey silly sa11d A-7-5( 1 1 ) Saridy silt A-7-5( 7 ) Silty clay
A-2-6( 10 ) Gravelly sar~tl
USCS Unified Soil Classificalion syslcrn AASHTO Amcr~carl Asr;oc.iallol~ of Slalc H~qhway and Transporlatioli Offic~aI
.Table 5 Consolidation,Compactian and CBR charateristics
Location Consolidation Compaction
--
CBR
Unscaked Soaked Unsoa~ed Soaked % reduction
Liquidity Compressibilty MOD OMC MOD OMC index I, Cc ( ~ g mS) (%) (~g 'm") (3,) (%) (?$)
(:$) . .
MD3 f?axinun dr-/dens.ry OHC sptimum dr): ,density C?? Caiihmia t +~ r i : ~g :x:o

Table 6 Spearman corrt'lnlio~r talwcett MOD. OMC. CBR ant1 socnt- ititlc'x ~)aramelc?ts
-----.-
Parameler Unils MDD OMC COR. --- -..- -- .. .
r P I I' I 11
W" LL PI LS
Clay Sill
Sand Gravel MDD QMC
c.
O h
% O h
O h
% O h
O h
To (My 111'3
%
r correlation coelficient and p pobahilrly
Table 7 Rali~rg IIW for evalr~atitin
Paratneler U11i1s Rnli~tg
Low Mr t t t t r ~~~ I Vcty I11gii L M H VH 1 2 3 1
CBR % < 10.0 10.0-15.0 15.0-30.0 30.0 LL O h > 70.0 50.0-70.0 30.0-50.0 30.0
' PI . % ' > 17.0 15.0-17.0 12.0-15.0 < 12.0 MOD (MQ m'3 < 1.80 1.80-1 -85 1.85- 1.90 > 1.90
c, > 0.35 0.30-0.35 0.25-0.30 < 0.25
Table 8 Evaluation of the materials different lailttrc p i n t s
at this point was not atbibuted to the undertying geology. The other locations (shaly and marly subgrades) are marked by mssive failures primarily due to heaving and swelling accompanied by the breakdown of installed drainage which then allow storm water to seep into the foundation. This tqpether with excessive haulage loads has resulted in failure of the pavements at locations 2, 3.4, 5, 6, 7 and 8.
In order to quantify the relati~nship between the frequency ..of pavement failure, index parameters and the,,. underlying geology, a semi-quantitative scheme was used. For this evaluation, only the' parameters that showed significant carrelation with CBR were used. These parsmeters are: liquid limit (LL), plasticity index (PI), maximum dry density (MDD) arld compression index (CC) (Table 6). The values of these parameters were divided into class ranges with qualitative ratings of low (L), medium (M), high (H) and very high (VH). The ratings were then assigned points with VH having the highest of 4 and L the lowest value of 1 (Table 7). Each sampled locatian was then evaluated using tke index parameters and the total points (TP) summed from the points
Localio~l U~lderlying CRR LL PI MI>D Cc Tol;tl f;t11111c.
ycologic r w i i ~ l l trc*rl~~~:r~cy tnalerisls - -. .. .
1 Coaslat Plain H (3) H (3) VH (4) VH (4) H (3) 20 IIOIII' 9 SanOs kt (3) 1-1 (3) VH (4) VH (4) H (3) - 20 :i
2 Ekenkpon L (1) M (2) M (2) L (1) L (1) 8 I 6 3 Shalc [.(I) M(2) L(1) M(%) ! . ( I > . . ,
4 NCW N~~IIII M (2) M (2) H (3) M (7) L (1) I L i l l
5 Marl M(2) M(2) VH(4) M(2) L(1) 13 ;I
6 Nkporo Shale L ( I ) M (2) L (1) L (1) L (1) 7 1 r! 7 L(1) M(2) L ( I ) L(1) L o ) 'i 2 .> 8 L (1) M (2) M (2) L (1) L (1) 8 17
L low, M 111edi11rn. H Iti(~li, VH very hiqti N~t~ntjt;r 111 l)c;tc;kct:i ~r!p~c::;r!lit t l t t ! r;1ti11q (%(!I* 'r;~lblv 7)
~~L&~#:.)~SO~?BE~WW i W & F a m &laOEIIBES, WOIIBEEHWSPICKSAND I N D E R L V l N G 1 8 L ~ I I # A ~ P EWVIRWMEm 1 07 P
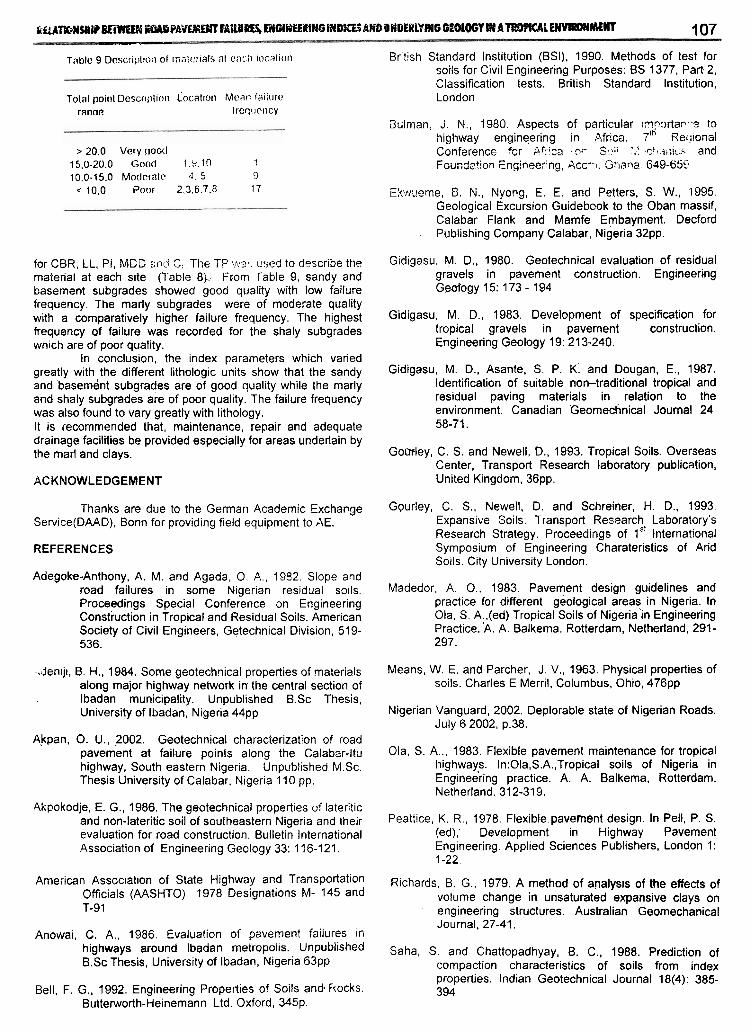
Tnblc 9 Dcscripitor~ 01 rria[(:r~als at c;~c:i localic~rl British Standard Institution (BSI). 1990. Methods of test for soiis for Civil Engineering Purposes: BS 1377, Part 2, Classification tests, British Standard Institution,
Tolal poitil Descr~l~i ior ~ocattoi i Mean {ailrrrc London ranat? ficrlitrncy
> 20.0 Very ~ o o c l 15.0-20.0 Good 1 .S. 19 1 10.0-15.0 Mo(lcra1c A . 5 9
c 10.0 Poor 2.3.6.7.6 17
for CBR, LL, PI, MCC sn$ Cr The TP wz: csed to describe the material at each site (Table 8)-- From Table 9, sandy and basement subgrades showed good quality with low failure frequency. The marly subgrades were of moderate quality with a comparatively higher failure frequency. The highest frequency of failure was recorded for the shaly subgrades which are of poor quality.
In conclusion, the index parameters which varied greatly with the different lithologic units show that the sandy and basement subgrades are of good quality while the marly and shaly subgrades are of poor quality. The failure frequency was also found to vary greatly with lithology. It is recommended that, maintenance, repair and adequate drainage facilities be provided especially for areas underlain by the marl and clays.
ACKNOWLEDGEMENT
Thanks are due to the German Academic Exchange Service(DAAD). Bonn for providing field equipment to PIE.
REFERENCES
Adegoke-Anthony, A. M. and Agada, 0. A,, 1982. Slope and road failures in some Nigerian residual soils. Proceedings Special Conference on Engineering Construction in Tropical and Residual Soils. American Society of Civil Engineers, Getechnical Division, 519- 536.
-,denljl, B. H., 1984. Some geotechnical properties of materials along major highway network in the central section of lbadan municipality. Unpublished B.Sc Thesis, University of Ibadan, Nigeria 44pp
Akpan, 0. U., 2002. Geotechnical characterization of road pavement at failure points along the Calabar-ltu highway, South eastern Nigeria. Unpublished M.Sc. Thesis University of Calabar, Nigeria 110 pp.
Akpokodje, E. G., 1986. The geotechnical properties of lateritic and non-lateritic soil of southeastern Nigeria and their evaluation for road construction. Bulletin International Association of Engineering Geology 33: 116-121.
American Assoclatlon of State Highway and Transportation Officials (AASHTO) 1978 Designations M- 145 and T-91
aulman, J. N., 1980. Aspects of particular ~-r?nrtar-2 to highway engineering in Akca. 7Ih ~ e c ~ ~ o n a l - . . . .
Conference far J r : j ~ a y s!,;; I: ,q'!.ii:i!:,; and Founde!ion Engineer'ng, Acc--I. Shaw 649-65S-
E:vb~.reme, 8. N., Nyong, E. E. and Petters, S. W., 1995. Geological Excursion Guidebook to the Oban massif. Calabar Flank and Mamfe Embayment. Decford Publishing Company Calabar, Nigeria 32pp.
Gidigasu, M. D., 1980. Geotechnical evaluation of residual gravels in pavement construction. Engineering Geology 15: 173 - 194
Gidigasu, M. D., 1983. Development of specification for tropical gravels in pavement construction. Engineering Geology 19: 21 3-240.
Gidigasu, M. D., Asante, S. P. K; and Dougan, E., 1987. Identification of suitable non-traditional tropical and residual paving materials in relation to the environment. Canadian Geomechnical Journal 24 58-71.
GoulJey, C. S. and Newell, D.. 1993. Tropical Soils. Overseas Center. Transport Research laboratory publication, United Kingdom, 36pp.
G~urley, C. S., Newell, D. and Schreiner, H. D., 1993. Expansive Soils: Transport Research Laboratory's Research Strategy. Proceedings of 1'' International Symposium of Engineering Charateristics of Arid Soils. City University London.
Madedor, A. O., 1983. Pavement design guidelines and practice for different geological areas in Nigeria. In Ola, S.A.,(ed) Tropical Soils of Nigeria'in Engineering Practice.'A. A. Balkema, Rotterdam, Netherland, 291- 297.
Means, W. E. and Parcher, J. V., 1963. Physical properties of soils. Charles E Merril, Columbus, Ohio, 476pp
Nigerian Vanguard, 2002. Deplorable state of Nigerian Roads. July 6 2002, p.38.
Ola, S. A,., 1983. Flexible pavement maintenance for tropical highways. In:Ola,S.A.,Tropical soils of Nigeria in Engineering practice. A. A. Balkema, Rotterdam, Netherland. 31 2-31 9.
Peattice, K. R., 1978. Flexible.pavement design. In Pell, P. S. (ed),' Development in Highway Pavement Engineering. Applied Sciences Publishers, London 1: 1-22.
Richards, B. G., 1979. A method of analysts of the effects of volume change in unsaturated expansive clays on engineering structures. Australian Geomechanical Journal, 27-41.
Anowai, C. A,, 1986. Evaluation of pavement failures in highways around lbadan unpublished Saha, S. and Chattopadhyay, B. C., 1988. Prediction of BSC Thesis, University of Ibadan, Nigeria 63pp compaction characteristics of soils from index
properties. Indian Geotechnical Journal 18(4): 385- Bell, F. G., 1992. Engineering Properties of Soils and. hocks. 394
Butterworth-Heinemann Ltd. Oxford, 345p.
- 108 - OFOHME M I A 1 1 4 AIIEKAU EDET
Sketnpton, A. W., 1944. Notes on the compressibility of clays. UduJi, G . R., Okagbue, C . 0. and Onyeobi, T. U. S., 1994. Quaterly Journal of Geological Society of London, Geotechnical properties of soils derived from the 119-135. Agwu and Mamu Formations in the Agwu-Ok;gwe
area of southeastern Nigeria and their relations to Skernpton, A. W., 1953. The colloidal activity of clays. engineering problems. Journal of Mining and Geology
Proceedings of 3'" international Conference on Soil 30(1): 117-123. Mechanics and Foundation Enginesring, Zurich 1: 57- 60. Vafl der Merwe, C. P.,1980. The deterioration of road
pa~errtents due to volumetric changes in the road lanner. J. S.. 1963. A review of the method of pavement 5ed. 7'' Regional Conference for Africa on Soil
design used in overseas territories and the Mechanics and Foundation Engineering, Accra, performance of roads constructed by the various Ghana, 823-829. design methods. 3rd Regional Conference for Africa on Soil Mechanics and Foundation Engineering. Van der Merwe, C. P. and Ahronovitz, M., 1973. The Salisbury. Rhodesia. 93-100. behaviour of flexible pavements on expansive soils in
Rhodesia. 3rd Conference on Expansive Soils,
Teme, S.C., Ajayi. 0. 0. and Anowai, C. A., 1987. Geological Jerusalem, Israel., 1-7.
control on highway pavement performance in southwestern Nigeria-A preliminary report. gth Regional Conference for Africa on Soil Mechanics and Foundation Engineering, Lagos, Nigeria., 565- 575