v. pavan d. b. stephenson the skill of multi-model
TRANSCRIPT
F. J. Doblas-Reyes Æ V. Pavan Æ D. B. Stephenson
The skill of multi-model seasonal forecasts of the wintertimeNorth Atlantic Oscillation
Received: 11 March 2002 / Accepted: 7 July 2003 / Published online: 27 September 2003� Springer-Verlag 2003
Abstract The skill assessment of a set of wintertimeNorth Atlantic Oscillation (NAO) seasonal predictionsin a multi-model ensemble framework has been carriedout. The multi-model approach consists in merging theensemble hindcasts of four atmospheric general circu-lation models forced with observed sea surface temper-atures to create a multi-model ensemble. Deterministic(ensemble-mean based) and probabilistic (categorical)NAO hindcasts have been considered. Two different setsof NAO indices have been used to create the hindcasts.A first set is defined as the projection of model anomaliesonto the NAO spatial pattern obtained from atmo-spheric analyses. The second set obtains the NAOindices by standardizing the leading principal compo-nent of each single-model ensemble. Positive skill isfound with both sets of indices, especially in the case ofthe multi-model ensemble. In addition, the NAO defi-nition based upon the single-model leading principalcomponent shows a higher skill than the hindcastsobtained using the projection method. Using the formerdefinition, the multi-model ensemble shows statisticallysignificant (at 5% level) positive skill in a variety ofprobabilistic scoring measures. This is interpreted as aconsequence of the projection method being less suitablebecause of the presence of errors in the spatial NAOpatterns of the models. The positive skill of the seasonalNAO found here seems to be due not to the persistenceof the long-term (decadal) variability specified in theinitial conditions, but rather to a good simulation of theyear-to-year variability. Nevertheless, most of the NAOseasonal predictability seems to be due to the correct
prediction of particular cases such as the winter of 1989.The higher skill of the multi-model has been explainedon the basis of a more reliable description of large-scaletropospheric wave features by the multi-model ensem-ble, illustrating the potential of multi-model experimentsto better identify mechanisms that explain seasonalvariability in the atmosphere.
1 Introduction
Early last century, meteorologists noticed that year-to-year fluctuations in wintertime air temperatures inWestern Greenland and Northern Europe were oftenout of phase with one another (Walker 1924; Loewe1937; van Loon and Rogers 1978; Stephenson et al.2003). When temperatures are below normal overGreenland, they tend to be above normal in Scandina-via, and vice versa. This climate phenomenon inspiredthe concept of what was later called the North AtlanticOscillation (NAO). The NAO is associated with signifi-cant changes in the intensity of the westerlies across theNorth Atlantic onto Europe, and so with a meridionaloscillation in atmospheric mass with centers of actionnear the Icelandic low and the Azores high (e.g., vanLoon and Rogers 1978). During the positive phase themean westerly flow over the North Atlantic and WesternEurope is stronger than usual. The Icelandic Low andthe Azores High, also known as the Atlantic dipole(Hastenrath 2002) are then more intense than normaland tend to be located slightly further north and east(Glowienka-Hensa 1985; Serreze et al. 1997). Thisanomalous flow increases the advection of warm andhumid air over Northwest Europe. The negative phaseof the NAO presents a weakened Atlantic dipole, withweakened westerly flow and increased advection ofwarm air over Greenland. The NAO is a mode that isrobustly present in every month of the year (Barnstonand Livezey 1987). It accounts on a month-by-monthbasis for the largest amount of interannual variability in
Climate Dynamics (2003) 21: 501–514DOI 10.1007/s00382-003-0350-4
F. J. Doblas-Reyes (&)ECMWF, Reading, UK,E-mail: [email protected]
V. PavanARPA-SMR, Bologna, Italy,
D. B. StephensonDepartment of Meteorology, University of Reading, Reading, UK,

monthly North Atlantic sea level pressure in all but fourmonths of the year (Rogers 1990). However, the NAO ismost pronounced in amplitude and areal coverage dur-ing winter (December to February) when it accounts formore than one third of the total variance in sea-levelpressure (Wallace and Gutzler 1981; Barnston and Liv-ezey 1987; Cayan 1992; Stephenson and Pavan 2003).
The NAO is linked to a wide range of climatic im-pacts. The changes in the mean circulation patterns overthe North Atlantic are accompanied by pronouncedshifts in the storm track (Rogers 1990; Hurrell 1995b)and associated synoptic eddy activity. This affects thetransport of atmospheric temperature and moisture andproduces changes in regional precipitation (Lamb andPeppler 1987; Cayan 1992; Hurrell 1995a). Hurrell(1995a) has shown that drier conditions occur overmuch of Eastern and Southern Europe and the Medi-terranean during high NAO index winters, while wetter-than-normal conditions occur from Iceland throughScandinavia. Winter snow depth and snow coverageduration over the Alps in the early 1990s, when theNAO was persistently positive, have been among thelowest recorded this century (Beniston and Rebetez1996), causing economic hardship on those industriesdependent on winter snowfall. Other phenomena asso-ciated with the NAO include significant wave height(Bacon and Carter 1993), changes in the LabradorCurrent transport (Marsh 2000), in the Arctic sea-iceextent (Fang and Wallace 1994), in the Davis Strait icevolume (Deser and Blackmon 1993), in the total ozonecolumn variability over the Northern Hemisphere(Orsolini and Doblas-Reyes 2003) and in dust transportfrom Africa across the Mediterranean and the subtrop-ical Atlantic (Moulin et al. 1997).
Atmospheric general circulation models (GCM),forced with both observed temporally varying (Rodwellet al. 1999) and constant (Barnett 1985; Glowienka-Hensa 1985; Marshall and Molteni 1993) sea surfacetemperature (SST), are able to display NAO-like fluc-tuations. From those simulations, it would seem that thefundamental mechanisms in the interannual time scaleof the NAO arise mostly from atmospheric processes(Hurrell 1995a). In contrast, its decadal variations mightbe slightly influenced by the local ocean (Marshall et al.2001). Bretherton and Battisti (2000) have pointed outthe consequences of forcing atmospheric models withprescribed SSTs in order to study the NAO predict-ability. Notably, they found an out-of-phase relation-ship between local surface fluxes and ocean heat content(measured through SST anomalies) at decadal timescales over the North Atlantic that would damp the SSTanomalies. Using a coupled atmosphere–ocean simpli-fied model, they detect a robust correlation of 0.4 for theseasonal average NAO, so that in this ideal experimentthe seasonal predictability limit is set to less than sixmonths.
A different process wherein atmospheric processesalone might produce strong interannual and perhapslonger-term variations in the intensity of the NAO
relies upon the connection between the strength of thestratospheric cyclonic winter vortex and the tropo-spheric circulation over the North Atlantic (Perlwitzand Graf 1995; Kodera et al. 1996; Ambaum andHoskins 2002). The strong link between the NorthPacific basin and the North Atlantic through theAleutian–Icelandic lows seesaw (Martineu et al. 1999;Honda et al. 2001) might be another source of poten-tial NAO variability. The NAO on interannual timescales appears to be a preferred mode of the atmo-sphere that can be excited in a number of differentways. For instance, the NAO interannual variabilityseems to be linked to the large-scale atmospheric cir-culation (Shabbar et al. 2001) and, to some extent, totropical (Czaja and Frankignoul 1999; Hoerling et al.2001) and extratropical SST (Drevillon et al. 2001)through the modulation of the storm track activity(Peng and Whitaker 1999; Drevillon et al. 2003).
The nature of climate variability implies that, even ifthe global SST could be exactly prescribed, the associ-ated NAO evolution would not be uniquely determinedin a model given the diversity of strong interactionstaking place. The chaotic nature of atmosphericdynamics would amplify any initial uncertainty blurringthe NAO predictability. If links between SST anomaliesand NAO variability exist, previous studies indicate thatthey are likely to be weak. Hence, the overall change ofthe atmospheric state with regard to climatology overthe North Atlantic region associated with specified SSTanomalies may not be large. Therefore, the amount ofpredictable signal associated with the boundary condi-tions will be small compared with the climatologicalvariance (Palmer and Sun 1985). In practice, an estimateof the atmospheric probability density function (PDF)can be determined from a set of integrations of a model(Epstein 1969a; Leith 1974; Brankovic and Palmer1997). This led to the concept of ensemble forecasting,whose basic idea is to run not just one deterministicmodel but to run a model many times with slightly dif-ferent initial conditions. The set of initial conditions isobtained by introducing perturbations that sample thesystem uncertainty in the phase space. To tackle uncer-tainty in the generation of an initial state, multi-analysisforecasts have also been considered in medium-rangeweather forecasting (Richardson 2001). Examples ofseasonal ensemble integrations have been discussed inBrankovic et al. 1994, Palmer and Anderson (1994),Stern and Miyakoda (1995), Barnett (1995) and Palmerand Shukla (2000).
Initial conditions are not the only source of uncer-tainty in seasonal forecasting. There are many contri-butions to the error in a numerical forecast: truncationerror, simplification in the model parametrizations, etc.A basic way of dealing with this kind of uncertainty is touse a multi-model approach (Tracton and Kalnay 1993;Vislocky and Fritsch 1995; Fritsch et al. 2000; Palmeret al. 2000; Krishnamurti et al. 1999, 2000; Kharin andZwiers 2002; Stefanova and Krishnamurti 2002). Themulti-model approach consists of merging forecasts
502 Doblas-Reyes et al.: The skills of multi-model seasonal forecasts of the wintertime
from different models, either with the same initial con-ditions or not, to develop a wider range of possibleoutcomes that will allow for a better estimate of theatmospheric PDF. Model combination has already beenapplied in the development of better standards of ref-erence (Murphy 1992) or the forecast improvement byindependent forecast combination (Thompson 1977).Using several models in an ensemble is a way of takinginto account our uncertainty about the atmosphericlaws, since different models make different assumptionsshowing different performance in their variability simu-lation. Each model can as well produce an ensemble ofsimulations. This may be considered as yet another formof ensemble and is referred to as multi-model ensemble(Harrison et al. 1995; Atger 1999; Doblas-Reyes et al.2000; Evans et al. 2000; Pavan and Doblas-Reyes 2000).By merging several single model ensembles into a uniquemulti-model ensemble, the effect of perturbations inboth initial state and model formulation can be in-cluded, sampling in this way part of both sources oferror. Long-range forecasting is probably one area offruitful application for model merging, as forecasts frommany different models are already available.
Given that large-scale climate features are more pre-dictable than smaller scale anomalies, this study inves-tigates the skill of seasonal NAO hindcasts, as a proxy todeliver seasonal forecasts over the Euro-Atlantic region,in a multi-model framework. In Sect. 2 we introduce theexperiment. Section 3 describes the hindcast accuracyover the European region. The verification of differentsets of NAO hindcasts is made in Sect. 4, and, finally, adiscussion of the most important results is drawn alongwith the main conclusions in Sect. 5.
2 Experimental design
2.1 Data
The 500-hPa geopotential height (Z500) analyses were obtainedfrom the 53-year (1948–2000) NCEP-NCAR reanalyses (Kalnayet al. 1996) as 2.5� horizontal resolution and twice per day data.The calculations were also repeated with the 1979–93 EuropeanCentre for Medium-Range Weather Forecasts (ECMWF) reanal-yses (Gibson et al. 1997) to check the validity of the results.
2.2 Model experiment
The multi-model seasonal ensemble hindcasts which have beenanalysed here, were run as part of the European project PROVOST(PRediction Of climate Variations On Seasonal to interannualTime scales) by four different institutions: the European Centre forMedium-Range Weather Forecasts (ECMWF), the Met Office(MetO), Meteo-France (MetFr), and Electricite de France (EDF).The different models and the experiment are fully described inPalmer et al. (2000), Doblas-Reyes et al. (2000), and Pavan andDoblas-Reyes (2000).
The atmospheric models were run for 120 days with nine-member ensembles for the period 1979 to 1993. The only differencebetween the EDF and MetFr runs is the horizontal resolution (T63instead of T42). Initialization was the same for all models. Theatmosphere and soil variables were initialized on nine subsequent
days from 12 GMT ERA (ECMWF Re-Analyses) analyses (Gib-son et al. 1997), starting from the tenth day preceding the firstmonth of the season covered (December, January, February, andMarch). This method is known as the lagged average forecastmethod (Hoffman and Kalnay 1983; Molteni et al. 1988). Allhindcasts end on the last day of the fourth month of integration, sothat the first integration was 128-day long, while the last one was120-day long. Daily observed SST and sea-ice extent were pre-scribed using either ERA-15 or GISST data, so that there was nointeractive ocean model in this experiment, SST being updateddaily in the integrations. It is likely that the model skill for theforced experiment can be regarded as an upper bound for the skillof current coupled ocean–atmosphere models (Latif and Barnett1996), at least as far as the hypothesis of a negligible feedback fromthe ocean at the seasonal time scale is accepted. However, Suttonand Mathieu (2002) suggest that ocean heat content anomalies mayprovide a better representation of the impact of the extratropicalocean on the atmosphere than SSTs.
The model bias, computed as the difference between the long-term climatology of the model and the verification, is shown to beof the order of the anomaly being predicted. Some hindcast biasesare described in Doblas-Reyes et al. (2000), Brankovic and Palmer(2000), Pavan and Doblas-Reyes (2000), and Pavan et al. (2000). Inshort, over the Euro-Atlantic region ECMWF, MetFr, and EDFruns present a too strong meridional gradient of Z500 in midlati-tudes, producing a strong zonality. MetO shows a more realisticcirculation, with a zonal flow weaker than normal over NorthAmerica and the Western Atlantic. There is also an overall excessof eastward penetration of the Atlantic storm track and a generalunderestimation of the intraseasonal variability, in particularblocking frequency.
Due to the model biases described, the raw value of a forecast inlong-range forecasting is in principle not useful (Deque 1991), sothat anomalies have to be computed. Anomalies are expressed asdepartures from the corresponding long-term climatology. Giventhe short length of the time series available (14 years), calculationof both model and observed anomalies as well as the forecastverification has been carried out in cross-validation mode (Wilks1995). This implies eliminating from the computation the targetyear. Hindcasts have been verified using seasonal averages for theperiods extending from months 1 to 3 (December to February,DJF) and 2 to 4 (January to March, JFM), though for brevity thestudy has been focused on the second period, less affected by theinitial conditions (Pavan and Doblas-Reyes 2000).
2.3 Forecast quality
Forecast verification is an important component of the forecastformulation process (Jolliffe and Stephenson 2003). It consists ofsummarizing and assessing the overall forecast quality as a statis-tical description of how well the forecasts match the verificationdata. Forecast quality has been evaluated by assessing hindcastskill, including measures of reliability and accuracy. The ensemblemean has been considered as the deterministic hindcast of a con-tinuous variable and time correlation has been used to evaluate itsskill. The evaluation of probabilistic forecasts is a more complextask. Three sources of uncertainty in common scoring metrics ofprobabilistic forecasts are: improper estimates of probabilities fromsmall-sized ensembles, insufficient number of forecast cases, andimperfect reference values due to observation uncertainties. A wayto alleviate this problem consists of using several scoring measures.Forecast quality is a multidimensional concept described by severaldifferent scalar attributes, which provide useful information aboutthe performance of a forecasting system. Thus, no single measure issufficient for judging and comparing forecast quality. Conse-quently, a whole suite of verification measures to assess the prob-abilistic hindcasts quality has been used here: ranked probabilityskill score (RPSS), receiver operating characteristic (ROC) areaunder the curve, Peirce skill score (PSS), and odds ratio skill score(ORSS). All the skill measures used are briefly described in theAppendix.
Doblas-Reyes et al.: The skills of multi-model seasonal forecasts of the wintertime 503

3 Model skill over Europe
Given our interest in the Euro-Atlantic region, the skillof the experiment has been assessed over a regionextending from 35�N to 87.5�N and from 60�W to42.5�E. Skill over the area is generally smaller than forthe whole Northern Hemisphere, but the wintertimemulti-model ensemble results are slightly better than orof the same order of the best single model, as shown byPavan and Doblas-Reyes (2000). The geographical dis-tribution of the ensemble-mean skill over this area hasan uneven distribution. Figure 1 shows the JFM Z500grid-point correlation for the four single-model ensem-ble mean hindcasts and the multi-model ensemble mean.In general, two maxima are present over the southwestAtlantic, Northern Africa and Northern Europe, whilethe lowest skill is found over Western Europe. Themulti-model ensemble mean presents in general the bestresults. To better illustrate the multi-model ensembleimprovement, Fig. 2a shows the PDF of the Z500 grid-point correlation over the Euro-Atlantic region. All themodels present a PDF biased towards positive values(mean value of 0.28, 0.29, 0.26, 0.26 and 0.33 for EC-MWF, MetO, MetFr, EDF and the multi-modelensemble, respectively), though this bias is stronger forthe multi-model ensemble.
The probabilistic hindcast skill has been assessedusing the RPSS for three equiprobable categories. The
categories are defined by the terciles of either the hind-cast or verification anomalies. Tercile boundaries havebeen computed in cross-validation mode using two dif-ferent methods. A simple way of estimating the quantilesof a sample consists in ranking the values and finding theboundaries that create equally populated bins. We willrefer to this method as ‘‘counting’’. A more sophisti-cated method relies upon a Gaussian-kernel estimator ofthe population PDF (Silverman 1986) that allows for ahigh-resolution estimate. In this case, once the PDF hasbeen estimated, the tercile boundaries are computed asthe two values distributing the variable in three equi-probable sections. As mentioned, there is an inherentuncertainty in these estimates that translates into anincreased uncertainty in the skill assessment process.However, no RPSS differences have been found in theresults obtained for each method. The geographicaldistribution of the RPSS displays essentially the samepattern as the ensemble mean skill, with larger areas ofnegative skill (not shown). However, the improvementprovided by the multi-model ensemble is more evidentthan in the ensemble-mean results. Figure 2b shows thePDF of grid-point RPSS over the region for the multi-model and the single-model ensembles. The mean RPSSis –10.0, –4.2, –5.8, –8.3 and 3.4 for ECMWF, MetO,MetFr, EDF and the multi-model ensemble, respec-tively. The main RPSS improvement for the multi-model ensemble consists of a reduction of the verynegative values and an important increase of the
Fig. 1 The 500-hPageopotential height correlationcoefficient for a the multi-model, b ECMWF, c MetO,d MetFr and e EDF over theEuro-Atlantic region for the2–4 month ensemble meanhindcasts. Contour interval is0.2 and the zero line has beenomitted. Negative values aredashed
504 Doblas-Reyes et al.: The skills of multi-model seasonal forecasts of the wintertime
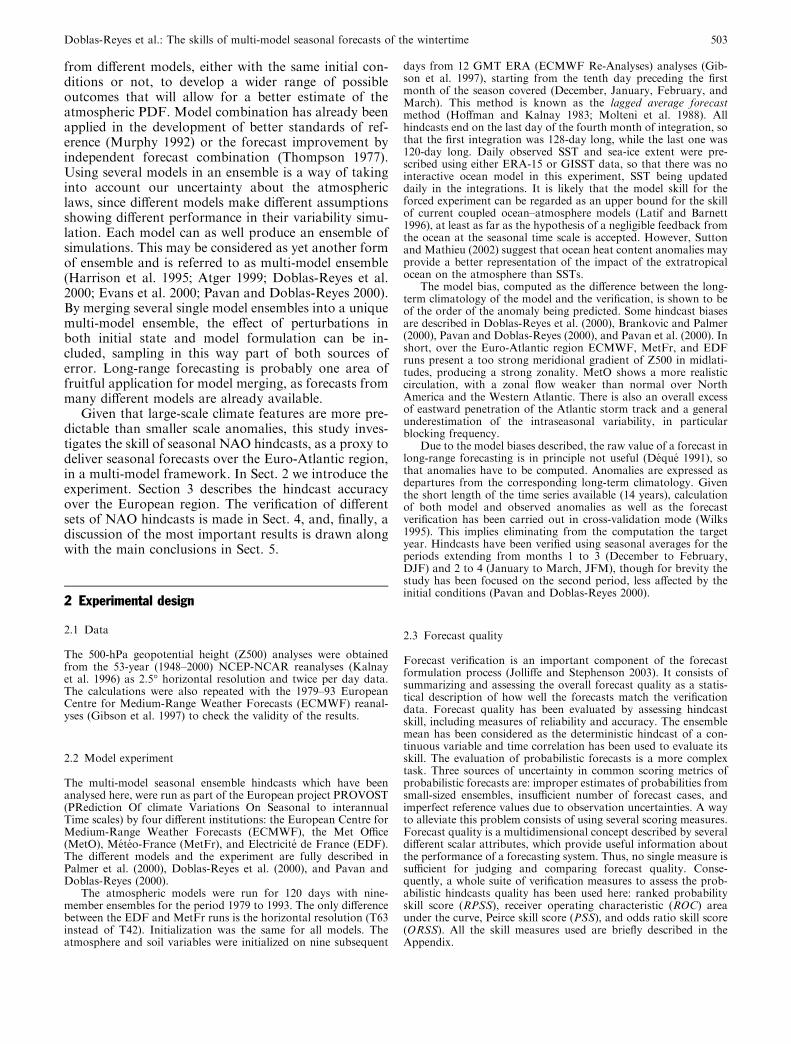
probability in the range of positive RPSS, which ex-plains the increase of the potential value of the multi-model ensemble hindcasts (Palmer et al. 2000). No clearimprovement appears in the high RPSS range. The lowscores of the single models in the probabilistic case maybe due to the difficulty in obtaining good estimates of thePDF with a nine-member ensemble. Thus, part of themulti-model ensemble improvement with the probabi-listic hindcasts may well be due to the increase inensemble size.
The poor skill found over the European region on agrid-point basis may strongly reduce the value of thehindcasts. Pavan and Doblas-Reyes (2000) have sug-gested that an alternative way of extracting informationwith significant skill might consist in using large-scalepatterns as predictors. This hypothesis is checked in thenext section in the case of the NAO. It is neverthelessimportant to bear in mind that other modes as theEastern Atlantic or the Scandinavian patterns also havea strong impact on European climate (Qian et al. 2000;Massacand and Davies 2001; Castro-Dıez et al. 2002)and their predictability should also be assessed in futurestudies.
4 NAO hindcast skill
4.1 Tropospheric anomalies associated with the NAO
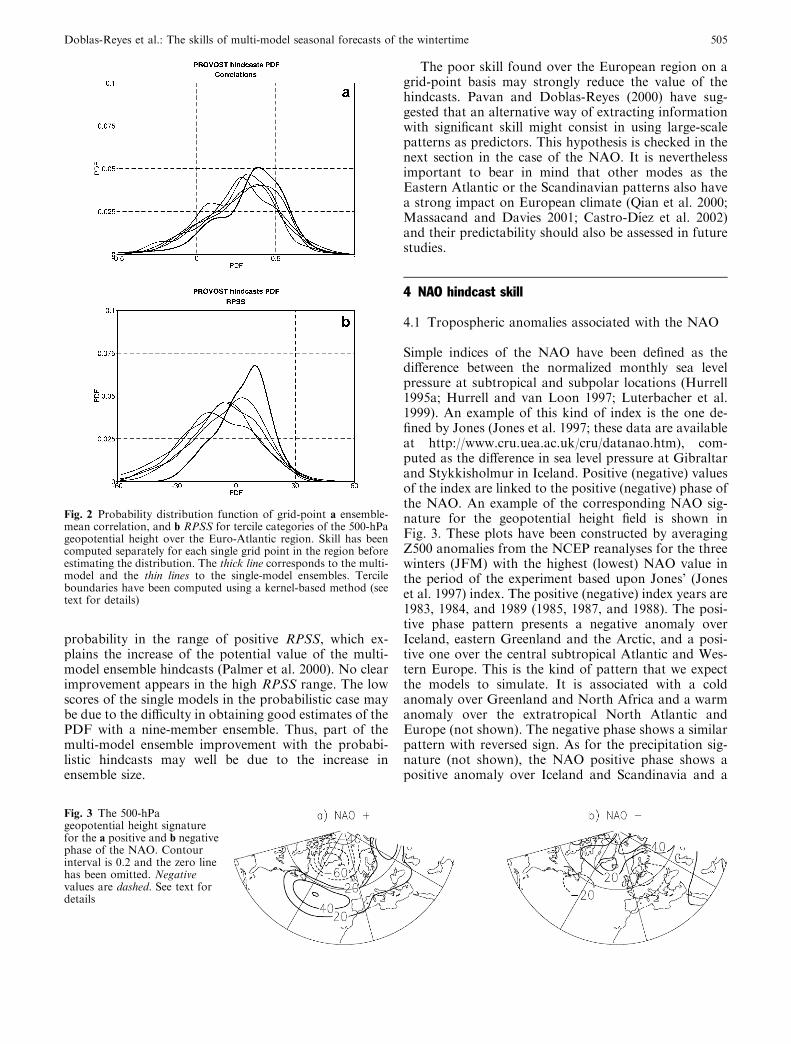
Simple indices of the NAO have been defined as thedifference between the normalized monthly sea levelpressure at subtropical and subpolar locations (Hurrell1995a; Hurrell and van Loon 1997; Luterbacher et al.1999). An example of this kind of index is the one de-fined by Jones (Jones et al. 1997; these data are availableat http://www.cru.uea.ac.uk/cru/datanao.htm), com-puted as the difference in sea level pressure at Gibraltarand Stykkisholmur in Iceland. Positive (negative) valuesof the index are linked to the positive (negative) phase ofthe NAO. An example of the corresponding NAO sig-nature for the geopotential height field is shown inFig. 3. These plots have been constructed by averagingZ500 anomalies from the NCEP reanalyses for the threewinters (JFM) with the highest (lowest) NAO value inthe period of the experiment based upon Jones’ (Joneset al. 1997) index. The positive (negative) index years are1983, 1984, and 1989 (1985, 1987, and 1988). The posi-tive phase pattern presents a negative anomaly overIceland, eastern Greenland and the Arctic, and a posi-tive one over the central subtropical Atlantic and Wes-tern Europe. This is the kind of pattern that we expectthe models to simulate. It is associated with a coldanomaly over Greenland and North Africa and a warmanomaly over the extratropical North Atlantic andEurope (not shown). The negative phase shows a similarpattern with reversed sign. As for the precipitation sig-nature (not shown), the NAO positive phase shows apositive anomaly over Iceland and Scandinavia and a
Fig. 2 Probability distribution function of grid-point a ensemble-mean correlation, and b RPSS for tercile categories of the 500-hPageopotential height over the Euro-Atlantic region. Skill has beencomputed separately for each single grid point in the region beforeestimating the distribution. The thick line corresponds to the multi-model and the thin lines to the single-model ensembles. Tercileboundaries have been computed using a kernel-based method (seetext for details)
Fig. 3 The 500-hPageopotential height signaturefor the a positive and b negativephase of the NAO. Contourinterval is 0.2 and the zero linehas been omitted. Negativevalues are dashed. See text fordetails
Doblas-Reyes et al.: The skills of multi-model seasonal forecasts of the wintertime 505
negative one over the Iberian Peninsula and WesternMediterranean, eastern Greenland and eastern sub-tropical Atlantic (Hurrell 1995a; Hurrell and van Loon1997). This corresponds to an increase of storm trackactivity (not shown) over northern Europe (Serreze et al.1997; Rodwell et al. 1999). The negative phase shows anincrease of cyclone activity over the central NorthAtlantic leading towards the Bay of Biscay.
4.2 NAO indices: reference and hindcasts
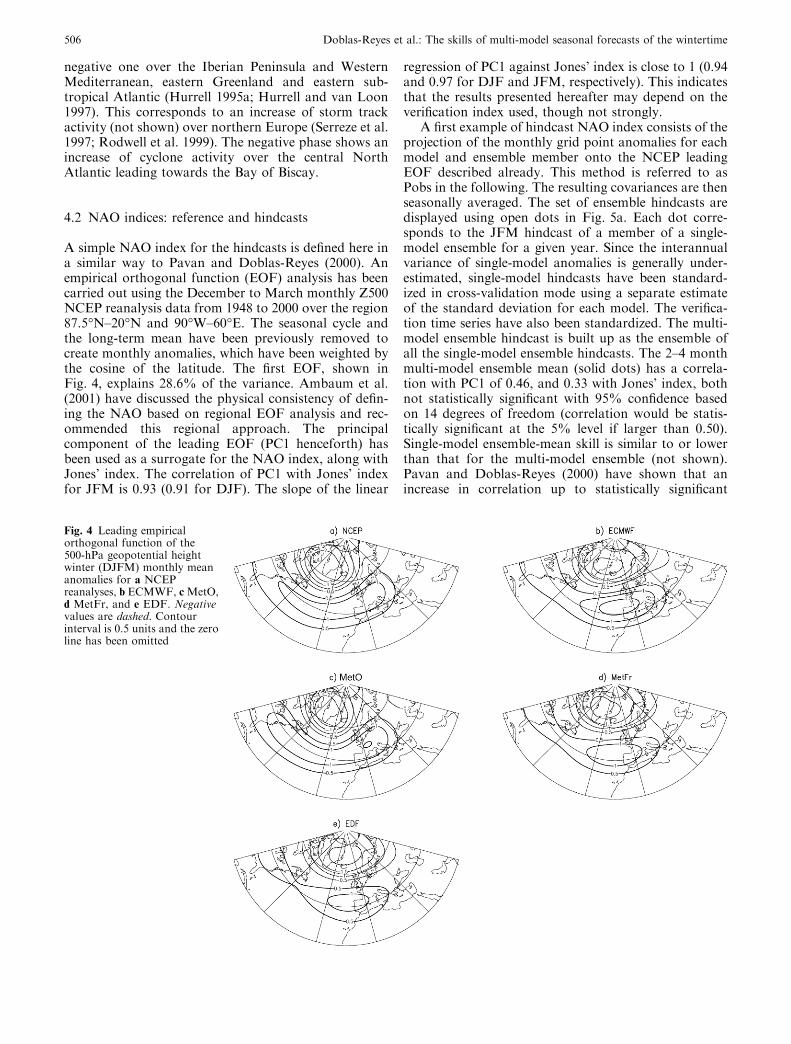
A simple NAO index for the hindcasts is defined here ina similar way to Pavan and Doblas-Reyes (2000). Anempirical orthogonal function (EOF) analysis has beencarried out using the December to March monthly Z500NCEP reanalysis data from 1948 to 2000 over the region87.5�N–20�N and 90�W–60�E. The seasonal cycle andthe long-term mean have been previously removed tocreate monthly anomalies, which have been weighted bythe cosine of the latitude. The first EOF, shown inFig. 4, explains 28.6% of the variance. Ambaum et al.(2001) have discussed the physical consistency of defin-ing the NAO based on regional EOF analysis and rec-ommended this regional approach. The principalcomponent of the leading EOF (PC1 henceforth) hasbeen used as a surrogate for the NAO index, along withJones’ index. The correlation of PC1 with Jones’ indexfor JFM is 0.93 (0.91 for DJF). The slope of the linear
regression of PC1 against Jones’ index is close to 1 (0.94and 0.97 for DJF and JFM, respectively). This indicatesthat the results presented hereafter may depend on theverification index used, though not strongly.
A first example of hindcast NAO index consists of theprojection of the monthly grid point anomalies for eachmodel and ensemble member onto the NCEP leadingEOF described already. This method is referred to asPobs in the following. The resulting covariances are thenseasonally averaged. The set of ensemble hindcasts aredisplayed using open dots in Fig. 5a. Each dot corre-sponds to the JFM hindcast of a member of a single-model ensemble for a given year. Since the interannualvariance of single-model anomalies is generally under-estimated, single-model hindcasts have been standard-ized in cross-validation mode using a separate estimateof the standard deviation for each model. The verifica-tion time series have also been standardized. The multi-model ensemble hindcast is built up as the ensemble ofall the single-model ensemble hindcasts. The 2–4 monthmulti-model ensemble mean (solid dots) has a correla-tion with PC1 of 0.46, and 0.33 with Jones’ index, bothnot statistically significant with 95% confidence basedon 14 degrees of freedom (correlation would be statis-tically significant at the 5% level if larger than 0.50).Single-model ensemble-mean skill is similar to or lowerthan that for the multi-model ensemble (not shown).Pavan and Doblas-Reyes (2000) have shown that anincrease in correlation up to statistically significant
Fig. 4 Leading empiricalorthogonal function of the500-hPa geopotential heightwinter (DJFM) monthly meananomalies for a NCEPreanalyses, b ECMWF, cMetO,d MetFr, and e EDF. Negativevalues are dashed. Contourinterval is 0.5 units and the zeroline has been omitted
506 Doblas-Reyes et al.: The skills of multi-model seasonal forecasts of the wintertime
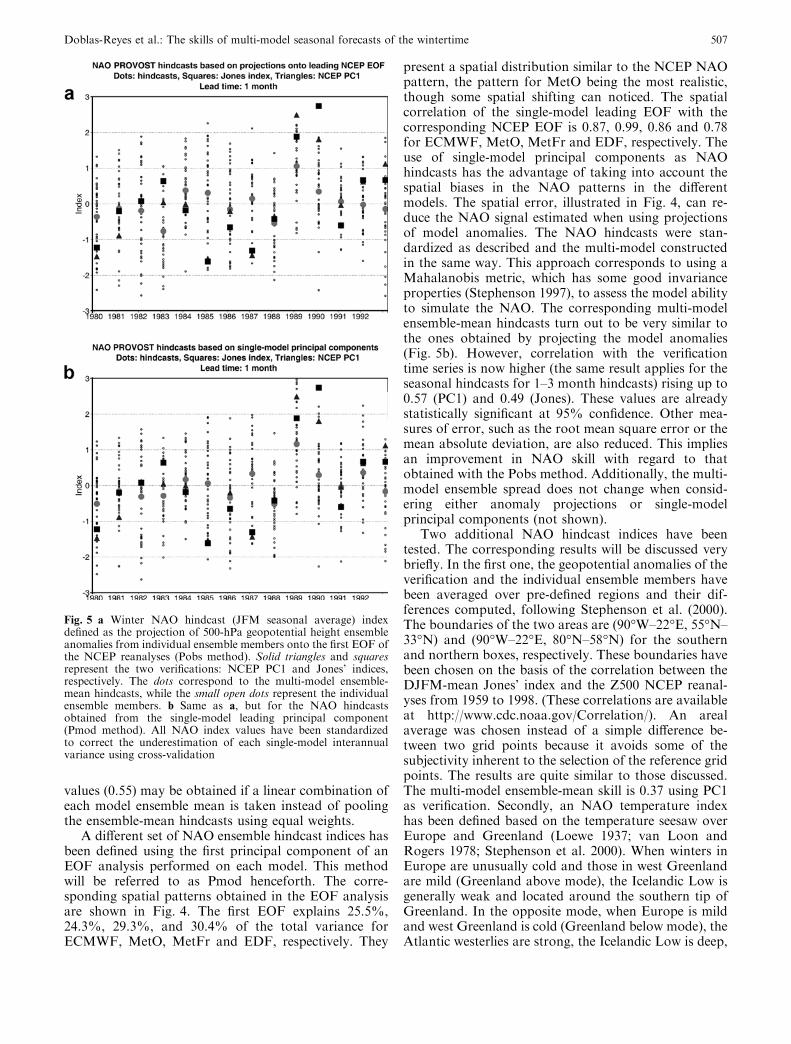
values (0.55) may be obtained if a linear combination ofeach model ensemble mean is taken instead of poolingthe ensemble-mean hindcasts using equal weights.
A different set of NAO ensemble hindcast indices hasbeen defined using the first principal component of anEOF analysis performed on each model. This methodwill be referred to as Pmod henceforth. The corre-sponding spatial patterns obtained in the EOF analysisare shown in Fig. 4. The first EOF explains 25.5%,24.3%, 29.3%, and 30.4% of the total variance forECMWF, MetO, MetFr and EDF, respectively. They
present a spatial distribution similar to the NCEP NAOpattern, the pattern for MetO being the most realistic,though some spatial shifting can noticed. The spatialcorrelation of the single-model leading EOF with thecorresponding NCEP EOF is 0.87, 0.99, 0.86 and 0.78for ECMWF, MetO, MetFr and EDF, respectively. Theuse of single-model principal components as NAOhindcasts has the advantage of taking into account thespatial biases in the NAO patterns in the differentmodels. The spatial error, illustrated in Fig. 4, can re-duce the NAO signal estimated when using projectionsof model anomalies. The NAO hindcasts were stan-dardized as described and the multi-model constructedin the same way. This approach corresponds to using aMahalanobis metric, which has some good invarianceproperties (Stephenson 1997), to assess the model abilityto simulate the NAO. The corresponding multi-modelensemble-mean hindcasts turn out to be very similar tothe ones obtained by projecting the model anomalies(Fig. 5b). However, correlation with the verificationtime series is now higher (the same result applies for theseasonal hindcasts for 1–3 month hindcasts) rising up to0.57 (PC1) and 0.49 (Jones). These values are alreadystatistically significant at 95% confidence. Other mea-sures of error, such as the root mean square error or themean absolute deviation, are also reduced. This impliesan improvement in NAO skill with regard to thatobtained with the Pobs method. Additionally, the multi-model ensemble spread does not change when consid-ering either anomaly projections or single-modelprincipal components (not shown).
Two additional NAO hindcast indices have beentested. The corresponding results will be discussed verybriefly. In the first one, the geopotential anomalies of theverification and the individual ensemble members havebeen averaged over pre-defined regions and their dif-ferences computed, following Stephenson et al. (2000).The boundaries of the two areas are (90�W–22�E, 55�N–33�N) and (90�W–22�E, 80�N–58�N) for the southernand northern boxes, respectively. These boundaries havebeen chosen on the basis of the correlation between theDJFM-mean Jones’ index and the Z500 NCEP reanal-yses from 1959 to 1998. (These correlations are availableat http://www.cdc.noaa.gov/Correlation/). An arealaverage was chosen instead of a simple difference be-tween two grid points because it avoids some of thesubjectivity inherent to the selection of the reference gridpoints. The results are quite similar to those discussed.The multi-model ensemble-mean skill is 0.37 using PC1as verification. Secondly, an NAO temperature indexhas been defined based on the temperature seesaw overEurope and Greenland (Loewe 1937; van Loon andRogers 1978; Stephenson et al. 2000). When winters inEurope are unusually cold and those in west Greenlandare mild (Greenland above mode), the Icelandic Low isgenerally weak and located around the southern tip ofGreenland. In the opposite mode, when Europe is mildand west Greenland is cold (Greenland below mode), theAtlantic westerlies are strong, the Icelandic Low is deep,
Fig. 5 a Winter NAO hindcast (JFM seasonal average) indexdefined as the projection of 500-hPa geopotential height ensembleanomalies from individual ensemble members onto the first EOF ofthe NCEP reanalyses (Pobs method). Solid triangles and squaresrepresent the two verifications: NCEP PC1 and Jones’ indices,respectively. The dots correspond to the multi-model ensemble-mean hindcasts, while the small open dots represent the individualensemble members. b Same as a, but for the NAO hindcastsobtained from the single-model leading principal component(Pmod method). All NAO index values have been standardizedto correct the underestimation of each single-model interannualvariance using cross-validation
Doblas-Reyes et al.: The skills of multi-model seasonal forecasts of the wintertime 507

and a strong maritime flow extends into Europe (Hurrelland van Loon 1997; Serreze et al. 1997). The areas se-lected are (90�W–0�, 72�N–50�N) and (0�–90�E, 72�N–50�N). As expected, a strong anticorrelation betweenthis temperature and the geopotential indices describedabove is found. A higher correlation of the multi-modelensemble-mean hindcasts (0.47) is obtained withthe temperature index, but this might be just due tothe prescription of observed SSTs in the experiment. Theskill of the two areal-average indices confirms thatthe positive multi-model ensemble-mean correlation is arobust feature. In the rest of this work only results fromthe more successful Pobs and Pmod methods will bediscussed.
Some statistical properties of the NAO ensemblehindcasts have also been analyzed. Skewness is a mea-sure of the asymmetry of a distribution about its mean.Distributions with positive and negative skewness rep-resent asymmetric distributions with a larger tail to theright or left respectively. Positive kurtosis indicates arelatively peaked distribution with long tails (leptokur-tic). Negative kurtosis indicates a relatively flat distri-bution with short tails (platykurtic). Measures ofskewness for the 2–4 month NAO hindcasts are negativefor both the multi-model ensemble and some of thesingle models. This is because more negative than posi-tive NAO hindcasts are found in the ensemble. Never-theless, this is not the case for the 1–3 month hindcasts.Instead, the hindcast time series present a negativekurtosis at both lead times and for all the models. Thisplatykurtic behavior indicates that the tails of thehindcast distribution present a low probability. Finally,Fig. 5 gives hints of the ensemble distribution beingskewed to values with the same sign as the observedanomaly when the multi-model ensemble mean is farfrom zero. This can be interpreted as an indication ofpredictive skill, especially for the years 1988 and 1989,although longer samples are needed to extract moredefinite conclusions.
4.3 Probabilistic NAO hindcasts
Deterministic predictions based on only the ensemblemean do not include all the information provided by the
individual members within the ensemble. Instead, it ismore useful to provide hindcasts for given categories interms of probability forecasts. The skill scores describedin the Appendix have been used to assess the skill ofthese hindcasts. Table 1 summarizes the results for thehindcasts obtained from the single-model principalcomponents with Jones’ index as verification. Similarresults have been found for the different sets of hindcastsand verification data available.
Three events have been considered here: anomaliesabove the upper tercile, above the mean, and belowthe lower tercile. The hindcast probability bias was in therange [0.8, 1.2] for the three categories, which forthe short length of the sample corresponds to low-biasedhindcasts. This indicates that a simple bias correction bystandardizing the time serie provides quite reliablehindcasts. Nevertheless, a longer time series would allowfor a systematic correction of the conditional biases.
RPSS is an appropriate measure of the quality ofmultiple category forecasts as it takes into account theway the probability distribution shifts toward the ex-tremes within a particular category. The RPSS for NAOhindcasts is very low, as shown in Table 1. This shouldbe expected for an event with a low signal-to-noise ratio(Kumar et al. 2001), as in the case of the seasonal NAO.However, the values tend to be positive, indicating thatthe ensemble hindcasts provide slightly better estimatesof the tercile probabilities than climatology. The multi-model ensemble shows the highest skill score. Moreinterestingly, the RPSS is generally not significantlydifferent from zero for the single models, but it turns outto be statistically significant at 5% level for the multi-model ensemble, regardless of the verification data used(not shown).
An assessment of hindcast quality for binary eventshas also been undertaken. Several events had to beconsidered because the measures of accuracy of binaryevents do not take into account the severity of errorsacross categories (Jolliffe and Stephenson 2003). Forinstance, if category one were observed, calculations ofthe false alarm rate would not discriminate if eithertercile two or three were forecast, the second case beingless desirable. In addition, the estimation of the scoresfor various events allows for an evaluation of therobustness of hindcast quality. The values of the ROC
Table 1 Ranked probability skill score (RPSS), area under theROC curve (ROC), Peirce skill score (PSS), odds ratio (OR), andodds ratio skill score (ORSS) for the JFM NAO probabilistichindcasts. 95% statistically significant values appear in bold (see
the text for information about the tests applied). The three eventsconsidered are: hindcasts above the upper tercile (1), above themean (2), and below the lower tercile (3)
RPSS ECMWF MetO MetFr EDF S–E
–18.2 9.3 4.0 3.8 13.1
1 2 3 1 2 3 1 2 3 1 2 3 1 2 3
ROC 0.63 0.56 0.46 0.57 0.50 0.74 0.53 0.52 0.70 0.80 0.63 0.59 0.66 0.60 0.66PSS 0.12 0.06 –0.03 0.11 0.03 0.13 0.04 0.06 0.19 0.23 0.12 0.05 0.13 0.07 0.09OR 1.68 1.28 0.88 1.63 1.12 1.76 1.12 1.28 2.32 2.86 1.63 1.25 1.83 1.31 1.52ORSS 0.25 0.12 –0.06 0.24 0.06 0.28 0.08 0.12 0.40 0.48 0.24 0.11 0.29 0.13 0.21
508 Doblas-Reyes et al.: The skills of multi-model seasonal forecasts of the wintertime
area under the curve are in most of the cases above theno-skill value of 0.5. The multi-model ensemble does notalways have the highest score, single models showing ahigher value for some events. However, the multi-modelskill is similar for the different events taken into account,which is not the case for the single models. The homo-geneous ROC area values for the multi-model ensemblemight partly be a consequence of the ROC score beingalmost invariant with the set of probability thresholds(Stephenson 2000). Thus, the ROC area shows that, as inthe case of the ensemble-mean correlation, there is aconsistent positive skill in the NAO multi-model hind-casts, though it does not tend to be statistically signifi-cant at the 5% level (it appears to be the case only forthe upper tercile event). Similar conclusions are drawnfor the other skill measures. Table 1 also shows the re-sults for PSS, OR, and ORSS. The multi-modelensemble again displays the best results. Although thePSS is a measure that could be affected by the hindcastbias, it shows statistically significant skill in the samecases as the other measures do, proving that the NAOhindcasts are not only accurate, but also reliable. Thesimilarity between ROC area and OR values can be ex-plained through the parameterization of the ROC curvedescribed in Stephenson (2000). As a general rule, ORSSseems to be the most stringent skill score. ORSS isindependent of the marginal distributions, so that it isable to strongly discriminate the cases with and withoutassociation between hindcasts and observations. It isimportant to note that the skill for the event ‘‘above themean’’ seems to be always quite low. This might be dueto the lack of robustness of the estimated mean as aconsequence of the short sample used (Kharin andZwiers 2002).
5 Concluding remarks
Given the low seasonal hindcast skill at grid-point scaleover the Euro-Atlantic region, a means of extractinggreater predictability by reference to larger scale featuresshould prove to be useful. This study suggests thatpredictions of the NAO may provide an alternative torelying on GCM direct output. A comprehensiveassessment of the NAO seasonal hindcast skill has beencarried out. This approach to the assessment of predic-tive skill presents advantages over the analysis of thepredictability of a few case studies (Dong et al. 2000;Elliott et al. 2001), although the analysis of specific casesallows for the identification of sources of predictability.The skill evaluation has been done using a multi-modelframework. The multi-model approach used here con-sisted of merging a set of ensemble hindcasts from fouratmospheric models.
Both deterministic (ensemble mean) and probabilistic(categorical) hindcasts have been considered and evidenceof themulti-model ensemble skill being superior to that ofthe singlemodel ensembles has been presented. It has beenshown that the NAO multi-model ensemble-mean
hindcasts may have significant skill (at the 5% level) whenthe NAO indices are defined as the standardized leadingprincipal component of the single-model ensembles(Pmod method). The skill for probabilistic hindcasts ofthe NAO indices falling in the outer tercile categories andalso for the ‘‘above-the-mean’’ event has been computed.Because different verification scores measure differentaspects of the forecasting system, a set of probabilisticskill measures has been used to estimate probabilisticforecast quality in this paper. A consistent positive skill toforecasting probabilistically NAO terciles has beenfound. A strong agreement has been observed in the re-sults obtained using two independent verification sets: thesea level pressure NAO index defined by Jones (Joneset al. 1997) and the principal component of the 500-hPageopotential height leading EOF computed with NCEPmonthly-mean data for the period 1948–2000. In addi-tion, the two methods described above to compute thetercile boundaries (counting and Gaussian-kernel PDFestimate) also presented similar results (not shown). Asfor the ensemble mean, an overall degradation of theprobabilistic forecast quality has been observed for theNAO hindcasts computed as projections of monthlyanomalies of the individual ensemble members onto theleading EOF of the 500-hPa geopotential height monthlymean NCEP analyses (Pobs method) when compared tothose of the Pmod method. This may be due to the modelanomaly projection method being less suitable because ofthe model systematic error leading to spatial shifts of thesimulated NAO patterns, which would generate differentvalues of the index for a similar type of signal in eachmodel.
Given the short time scale of the sample, some ofthe skill might be due to decadal variability in theinitial conditions or from the strong predictability ofparticular winters. A simple way of removing artificialskill due to long-term trends is to verify year-to-yeardifferences in the time series. Differences remove thelow-frequency variability from the time series, so thatthe skill in year-to-year changes can be assessed(Stephenson et al. 2000). The correlation of the back-ward differences for the ensemble-mean hindcast basedon the standardized first principal component is 0.19,0.62, –0.01, 0.33 and 0.35 for ECMWF, MetO, MetFr,EDF and the multi-model ensemble, respectively.Correlations are much higher for the 1–3 monthhindcasts. Thus, despite these low correlations, theNAO skill in these experiments is partly due to thecorrect simulation of year-to-year variations.
The contribution to the positive skill from specificyears is an important issue because of the small sampleused in this study. The case of JFM 1989 is particularlyinteresting. The multi-model ensemble shows anextraordinarily good forecast for this winter. When thisyear is removed from the time series, the skill is sub-stantially reduced (the multi-model ensemble-meancorrelation drops to 0.12 from values close to 0.5 andsimilar reductions in correlation are found for the singlemodels). The probabilistic score measures seem to be less
Doblas-Reyes et al.: The skills of multi-model seasonal forecasts of the wintertime 509
affected though. For instance, RPSS takes the value 7.1(compared with 13.1 in Table 1) and is marginally sig-nificant at the 5% level, whilst the odds ratio takesvalues around 1.4, which are not significant. Scores arequite insensitive to the removal of other years. For in-stance, the correlation is 0.46 when the year 1985 is nottaken into account. Thus, a substantial part of the skillpresented here comes from the correct simulation of theatmospheric circulation over the North Atlantic in JFM1989. It is then important to try to understand the rea-sons why some years are so well forecast while others arenot.
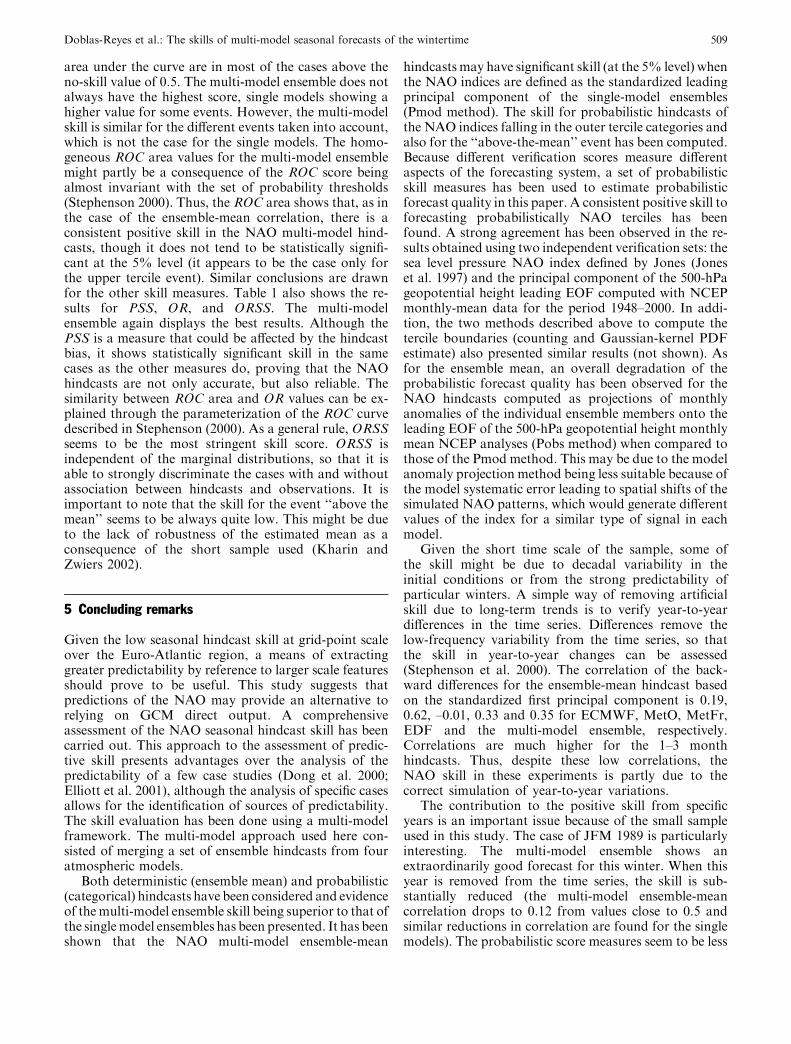
One of the possible dynamical reasons for 1989anomalies being correctly predicted may be depictedusing an estimate of the barotropic refraction index forthe 1985 and 1989 JFM hindcasts as done in Pavan et al.(2000). These two years have an opposite sign NAO(Fig. 5), which is mainly due to the presence of positive(negative) geopotential anomalies (not shown) over thesubtropical Atlantic in 1989 (1985). The multi-modelensemble mean displays the right pattern north of 45�Nin both cases. Nevertheless, anomalies are misplaced in1985 over the region south of 45�N, which is not the casein 1989 (not shown). This explains the bad NAO pre-diction for the former year (Fig. 5), with the multi-model ensemble evenly distributed around zero, and thehighly satisfactory 1989 hindcasts, with a positivelyskewed multi-model ensemble. Figure 6 shows thebarotropic refraction index for the verification and themulti-model ensemble for both years. This index, whichgives an indication of the propagation of large-scalewaves in the extratropics, corresponds to the criticalwave number separating the meridionally confinedwaves from those with a propagating structure profile.That is, the minima of the function give an indication ofpossible meridional confinement of the waves. Therefraction index for the verification (solid line) has a verysimilar behavior north of 45�N in both years. This fea-ture agrees well with the strong resemblance of theanomaly patterns over that sector. However, a clearconfinement of the waves with wave number greaterthan 3 in the latitudinal range 35�N–45�N is evidencedin the analyses for 1989, though not for 1985. This im-plies that all sort of large-scale waves can propagate intothe subtropical Atlantic in 1985, the confinement ofwaves with wave number greater than 2 being found justnorth of 60�N. Figure 6b presents evidence of a sub-stantial number of members of the multi-model-ensem-ble correctly showing some sort of confinement south of45�N in 1989 (31 out of 36 members have a local mini-mum in this region; they are depicted using dashedlines). Nevertheless, an important latitudinal spread ofthe minima is found, so that the ensemble mean of theindex may give the misleading impression of confine-ment not taking place. In the other hand, a substantialnumber of ensemble members (26 out of 36, depictedusing dashed lines) seem to unrealistically confine large-scale waves in a wide range of latitudes south of 45�Nin 1985 (Fig. 6a). This emphasizes the importance of
correctly simulating the structure of large-scale waves, inorder to produce skilful NAO hindcasts. In addition,this diagnostic only makes sense if an ensemble is used;in other words, a single-member simulation or the use ofthe ensemble mean would not have led to the sameconclusions. Furthermore, the use of a multi-modelensemble also takes partly into account the differentsystematic errors of the single models when simulatingthe processes dynamically related to the NAO. As aconsequence, the probabilistic formulation of multi-model seasonal NAO hindcasts may be able to make abetter use of all this information than a deterministicformulation based on a single model.
Although there is some evidence of NAO skill in thehindcasts presented here, the skill is quite low. Moreresearch should be carried out to better understand thephysical reasons for the positive skill found. The highagreement among the different accuracy and skill mea-sures for the multi-model seems to be encouraging anddeserves further investigation with improved models andlarger samples. The results presented strengthenthe prospects and expected utility of the present-day
Fig. 6 Refraction index as a function of the latitude for a JFM1985 and b JFM 1989. The solid line corresponds to the verification,the dashed lines to the ensemble members having a local minimumbetween 30�N and 45�N and the dotted lines to the rest of theensemble members
510 Doblas-Reyes et al.: The skills of multi-model seasonal forecasts of the wintertime

state-of-the-art seasonal forecast systems. It is alsointeresting to emphasize that the methodology describedhere may provide even better results when applied toother large-scale phenomena, either over the NorthAtlantic region (given the limited amount of variabilityexplained by the NAO) or elsewhere. At present, themethod is being used to assess the skill of the multi-model ensemble hindcasts carried out in the frameworkof the DEMETER project (Palmer et al. submitted toBull Am Meteorol Soc 2003) and in the operationalseasonal forecasts at ECMWF. DEMETER is a EU-Funded project intending to assess the hindcast skill andpotential value of a multi-model ensemble-based systemfor seasonal-to-interannual prediction, including inno-vative examples of the application of multi-model sea-sonal ensemble information in malaria incidence andcrop yield forecasting. Full information about the pro-ject can be found at http://www.ecmwf.int/research/demeter).
Acknowledgements This study was undertaken when the firstauthor worked at the Centre Nationale de Recherches Meteo-rologiques, Meteo-France (Toulouse, France). VP has receivedsupport from the Progetto Strategico SINAPSI funded by theMinistero dell’Istruzione, dell’Universita’e della Ricerca (MIUR)and Consiglio Nazionale di Ricerca (CNR). The authors wish tothank David Anderson, Magdalena Balmaseda, Michel Deque,Thomas Jung, Alexia Massacand, Laura Ferranti, and TimPalmer for reviews of early drafts and constructive advice.Richard Graham and an anonymous reviewer are especiallyacknowledged for their significant contribution to the improve-ment of the scientific quality and readability of the paper. Thiswork was in part supported by the EU-funded DEMETERproject (EVK2-1999-00197).
Appendix 1: scoring rules
A tool commonly used to evaluate the association between ensemble-mean hindcasts and verification is the time correlation coefficient.This measure is independent of the mean and variance of bothvariables. As in the rest of the study, different climatologies forhindcasts and verification were computed using the cross-validationtechnique, making the correlation estimator unbiased (Deque 1997).
A set of verification measures has been used to assess the qualityof the probabilistic hindcasts: the ranked probability skill score(RPSS), the receiver operating characteristic (ROC) area under thecurve, the Peirce skill score (PSS), and the odds ratio skill score(ORSS). Most of them, along with estimates of the associated er-ror, are described in Stephenson (2000), Zhang and Casey (2000),and Thornes and Stephenson (2001), where the reader is referred tofor more specific definitions and properties.
The accuracy measure for RPSS is the ranked probability score(RPS). RPS was first proposed by Epstein (1969b) and simplifiedby Murphy (1971). This score for categorical probabilistic forecastsis a generalization of the Brier score for ranked categories. For Jranked categories, the RPS can be written:
RPSðr; dÞ ¼ 1
J � 1
XJ
i¼1
Xi
k¼1rk �
Xi
k¼1dk
!2
ð1Þ
where the vector r ¼ ðr1; . . . ; rJ ÞðPJ
k¼1 rk ¼ 1Þrepresents an esti-mate of the forecast PDF and d = (d1, …, dJ) corresponds to theverification PDF where dk is a delta function which equals to 1 ifcategory k occurs and 0 otherwise. By using cumulative probabil-ities, it takes into account the ordering of the categories, though for
finite ensemble sizes, the estimated probabilities for the event to bein different categories strongly depend on the estimate of the cat-egory thresholds. RPS can be accumulated for several time steps orgrid points over a region, or both. The RPSS expresses the relativeimprovement of the forecast against a reference score. The refer-ence score used here has been the climatological probability hind-cast, which, under the assumption of a Gaussian distribution of theobservations, is the forecast without any skill that minimises theRPS (Deque et al. 1994). The RPSS is defined as:
RPSS ¼ 100 1� RPSforecastRPSclimatol
� �ð2Þ
Such skill score is 100 for a perfect forecast, 0 for a probabilisticforecast which is no more accurate than a trivial forecast usinglong-term climatology, and negative for even worse forecasts, asrandom or biased values. To provide an estimate of the skillscore significance, the calculations were repeated 100 times for agiven time series (either a grid point or the NAO index). Eachtime, the order of the individual hindcasts was scrambled (thispreserves the PDF of the variable), then computing the skillscore, and finally taking the 5% upper threshold of the resultingskill distribution.
RPSS can be a too stringent measure of skill by requiring acorrect estimate of a simplified PDF. Then, a set of simple accuracymeasures for binary events is made based upon the hit rate H, orthe relative number of times an event was forecast when it oc-curred, and the false alarm rate F, or the relative number of timesthe event was forecast when it did not occur (Jolliffe and Ste-phenson 2003). They are based on the likelihood-base rate factor-ization of the joint probability distribution of forecasts andverifications (Murphy and Winkler 1987). To derive them, a con-tingency table is computed, wherein the cells are occupied by thenumber of hits (a, number of cases when an event is forecast and isalso observed), false alarms (b, number of cases the event is notobserved but is forecast), misses (c, number of cases the event isobserved but not forecast), and correct rejections (d, number of no-events correctly forecast) for every ensemble member. Then, the hitrate and the false alarm rate take the form:
H ¼ aaþ c
F ¼ bbþ d
ð3Þ
The previous scheme allows for the definition of a reliabilitymeasure, the bias B. Reliability is another attribute of forecastquality and corresponds to the ability of the forecast system toaverage probabilities equal to the frequency of the observed event.The bias indicates whether the forecasts of an event are being issuedat a higher rate than the frequency of observed events. It reads:
B ¼ aþ baþ c
ð4Þ
A bias greater than 1 indicates over-forecasting, i.e., the modelforecasts the event more often than it is observed. Consequently, abias lower than 1 indicates under-forecasting.
The Peirce skill score (PSS) is a simple measure of skill thatequals to the difference between the hit rate and the false alarmrate:
PSS ¼ H � F ð5Þ
When the score is greater than zero, the hit rate exceeds the falsealarm rate so that the closer the value of PSS to 1, the better. Thestandard error formula for this score assumes independence of hitand false alarm rates and, for large enough samples, it is computedas:
rPSS ¼ffiffiffiffiffiffiffiffiffiffiffiffiffiffiffiffiffiffiffiffiHð1� HÞ
aþ c
rþ F ð1� F Þ
bþ dð6Þ
The odds ratio (OR) is an accuracy measure that compares theodds of making a good forecast (a hit) to the odds of making a badforecast (a false alarm):
Doblas-Reyes et al.: The skills of multi-model seasonal forecasts of the wintertime 511
OR ¼ H1� H
1� FF
ð7Þ
The ratio is greater than one when the hit rate exceeds the falsealarm rate, and is unity when forecast and reference values areindependent. It presents the advantage of being independent of theforecast bias. Furthermore, it has the property that the naturallogarithm of the odds ratio is asymptotically normally distributedwith a standard error of 1/(nh)
1/2 where
1
nh¼ 1
aþ 1
bþ 1
cþ 1
dð8Þ
To test whether there is any skill, one can test against the nullhypothesis that the forecasts and verifications are independent withlog odds of zero. A simple skill score, the odds ratio skill score(ORSS), ranging from –1 to +1, where a score of zero representsno skill, may be obtained from the odds ratio through theexpression:
ORRS ¼ OR� 1
ORþ 1¼ H � F
H þ F � 2HFð9Þ
Thornes and Stephenson (2001) provide a useful table with theminimum values of ORSS needed to have significant skill at dif-ferent levels of confidence depending on the value of nh.
The ROC (Swets 1973) is a signal-detection curve plotting thehit rate against the false alarm rate for a specific event over arange of probability decision thresholds (Evans et al. 2000;Graham et al. 2000; Zhang and Casey 2000). Basically, it indi-cates the performance in terms of hit and false alarm ratestratified by the verification. The probability of detection is aprobability decision threshold that converts probabilistic binaryforecasts into deterministic binary forecasts. For each probabilitythreshold, a contingency table is obtained from which the hitand false alarm rates are computed. For instance, consider aprobability threshold of 10%. The event is forecast in those caseswhere the probability is equal to or greater than 10%. Thiscalculation is repeated for thresholds of 20%, 30%, up to 100%(or whatever other selection of intervals, depending mainly onthe ensemble size). Then, the hit rate is plotted against the falsealarm rate to produce a ROC curve. Ideally, the hit rate willalways exceed the false alarm rate and the curve will lie in theupper-left-hand portion of the diagram. The hit rate increases byreducing the probability threshold, but at the same time the falsealarm rate is also increased. The standardized area enclosedbeneath the curve is a simple accuracy measure associated withthe ROC, with a range from 0 to 1. A system with no skill(made by either random or constant forecasts) will achieve hitsat the same rate as false alarms and so its curve will lie along the45� line and enclose a standardized area of 0.5. As the ROC isbased upon a stratification by the verification it provides noinformation about reliability of the forecasts, and hence thecurves cannot be improved by improving the climatology of thesystem. The skill score significance was assessed, as in the case ofRPSS, by Monte Carlo methods.
References
Ambaum MHP, Hoskins BJ (2002) The NAO troposphere–stratosphere connection. J Clim 15: 1969–1978
Ambaum MHP, Hoskins BJ, Stephenson DB (2001) Arctic Oscil-lation or North Atlantic Oscillation? J Clim 14: 3495–3507
Atger F (1999) The skill of ensemble prediction systems. MonWeather Rev 127: 1941–1953
Bacon S, Carter DJT (1993) A connection between mean waveheight and atmospheric pressure gradient in the North Atlantic.Int J Climatol 13: 423–436
Barnett TP (1985) Variations in near-global sea level pressure.J Atmos Sci 42: 478–501
Barnett TP (1995) Monte Carlo climate forecasting. J Clim 8: 1005–1022
Barnston AG, Livezey RE (1987) Classification, seasonality andpersistence of low-frequency atmospheric circulation patterns.Mon Weather Rev 115: 1083–1126
Beniston M, Rebetez M (1996) Regional behavior of minimumtemperatures in Switzerland for the period 1979–1993. TheorAppl Climatol 53: 231–243
Brankovic C, Palmer TN (1997) Atmospheric seasonal predict-ability and estimates of ensemble size. Mon Weather Rev 125:859–874
Brankovic C, Palmer TN (2000) Seasonal skill and predictability ofECMWF PROVOST ensembles. Q J R Meteorol Soc 126:2035–2068
Brankovic C, Palmer TN, Ferranti L (1994) Predictability of sea-sonal atmospheric variations. J Clim 7: 217–237
Bretherton CS, Battisti DS (2000) An interpretation of the resultsfrom atmospheric general circulation models forced by the timehistory of the observed sea surface temperature distributions.Geophys Res Lett 27: 767–770
Castro-Dıez Y, Pozo-Vazquez D, Rodrigo FS, Esteban-Parra MJ(2002) NAO and winter temperature variability in southernEurope. Geophys Res Lett 29(8): 1–14
Cayan DR (1992) Latent and sensible heat flux anomalies over thenorthern oceans: the connection to monthly atmospheric cir-culation. J Clim 5: 354–369
Czaja A, Frankignoul D (1999) Influence of the North AtlanticSST on the atmospheric circulation. Geophys Res Lett 26:2969–2972
Deque M (1991) Removing the model systematic error in extendedrange forecasting. Ann Geophys 9: 242–251
Deque M (1997) Ensemble size for numerical seasonal forecasts.Tellus 49A: 74–86
Deque M, Royer JF, Stroe R (1994) Formulation of Gaussianprobability forecasts based on model extended-range integra-tions. Tellus 46A: 52–65
Deser C, Blackmon ML (1993) Surface climate variations over theNorth Atlantic Ocean during winter: 1900–1989. J Clim 6:1743–1753
Doblas-Reyes FJ, Deque M, Piedelievre JP (2000) Multi-modelspread and probabilistic seasonal forecasts in PROVOST. Q JR Meteorol Soc 126: 2069–2088
Dong BW, Sutton RT, Jewson SP, O’Neill A, Slingo JM (2000)Predictable winter climate in the North Atlantic sector duringthe 1997–1999 ENSO cycle. Geophys Res Lett 27: 985–988
Drevillon M, Cassou CH, Terray L (2003) Model study of theNorth Atlantic region atmosperic response to autumn tropicalAtlantic sea-surface-temperature anomalies. Quart J Roy Me-terol Soc 129:2591–2611
Drevillon M, Terray L, Rogel P, Cassou C (2001) Mid latitudeAtlantic SST influence on European winter climate variabilityin the NCEP reanalysis. Clim Dyn 18: 331–344
Elliott JR, Jewson SP, Sutton RT (2001) The impact of the 1997/98El Nino event on the Atlantic Ocean. J Clim 14: 1069–1077
Epstein ES (1969a) Stochastic dynamic prediction. Tellus 21: 739–759
Epstein ES (1969b) A scoring system for probability forecasts ofranked categories. J Appl Meteorol 8: 985–987
Evans RE, Harrison MSJ, Graham RJ, Mylne KR (2000) Jointmedium-range ensembles from the Met. Office and ECMWFsystems. Mon Weather Rev 128: 3104–3127
Fang Z, Wallace JM (1994) Arctic sea-ice variability on a time scaleof weeks and its relation to atmospheric forcing. J Clim 7: 1897–1914
Fritsch JM, Hilliker J, Ross J, Vislocky RL (2000) Model con-sensus. Weather Forecast 15: 571–582
Gibson JK, Kallberg P, Uppala S, Hernandez A, Nomura A,Serrano E (1997) ERA description. ECMWF re-analysis projectreport series 1. ECMWF Tech Rep, pp 872
Glowienka-Hensa R (1985) Studies on the variability of the Ice-landic Low and Azores High between 1881 and 1983. ContribAtmos Phys 58: 160–170
512 Doblas-Reyes et al.: The skills of multi-model seasonal forecasts of the wintertime
Graham RJ, Evans ADL, Mylne KR, Harrison MSJ, RobertsonKB (2000) An assessment of seasonal predictability usingatmospheric general circulation models. Q J R Meteorol Soc126: 2211–2240
Harrison MSJ, Palmer TN, Richardson DS, Buizza R, PetroliagisT (1995) Joint ensembles from the UKMO and ECMWFmodels. In: Proc Seminar Predictability, ECMWF, Reading,UK, 2: 61–120
Hastenrath S (2002) Dipoles, temperature gradients, and tropicalclimate anomalies. Bull Am Meteorol Soc 83: 735–738
Hoerling MP, Hurrell JW, Xu T (2001) Tropical origins for recentNorth Atlantic climate change. Science 292: 90–92
Hoffman NR, Kalnay E (1983) Lagged average forecasting, analternative to Monte Carlo forecasting. Tellus 35A: 100–118
Honda M, Nakamura H, Ukita J, Kousaka I, Takeuchi K (2001)Interannual seesaw between the Aleutian and Icelandic lows.Part I: seasonal dependence and life cycles. J Clim 13: 1029–1042
Hurrell JW (1995a) Decadal trends in the North Atlantic Oscilla-tion regional temperatures and precipitation. Science 269: 676–679
Hurrell JW (1995b) Transient eddy forcing of the rotational flowduring northern winter. J Atmos Sci 52: 2286–2301
Hurrell JW, van Loon H (1997) Decadal variations in climateassociated with the North Atlantic oscillation. Clim Change 36:301–326
Jolliffe IT, Stephenson DB, eds (2003) Forecast verification: apractitioner’s guide in atmospheric science. Wiley and Sons,Chichester, UK, pp 240
Jones PD, Jonsson T, Wheeler D (1997) Extension to the NorthAtlantic Oscillation using early instrumental pressure observa-tions from Gibraltar and south-west Iceland. Int J Climatol 17:1433–1450
Kalnay E, Kanamitsu M, Kistler R, Collins W, Deaven D, GandinL, Iredell M, Saha S, White G, Woollen J, Zhu Y, Leetmaa A,Reynolds B, Chelliah M, Ebisuzaki W, Higgins W, Janowiak J,Mo KC, Ropelewski C, Wang J, Jenne R, Joseph D (1996) TheNCEP/NCAR 40-year reanalysis project. Bull Am MeteorolSoc 77: 437–472
Kharin VV, Zwiers FW (2002) Climate prediction with multimodelensembles. J Clim 15: 793–799
Kodera K, Chiba M, Koide H, Kitoh A, Nikaido Y (1996) Inter-annual variability of winter stratosphere and troposphere in theNorthern Hemisphere. J Meteorol Soc Jpn 74: 365–382
Krishnamurti TN, Kishtawai CM, LaRow T, Bachiochi DR,Zhang Z, Williford CE, Gadgil S, Surendran S (1999) Improvedweather and seasonal climate forecasts from multimodel supe-rensemble. Science 285: 1548–1550
Krishnamurti TN, Kishtawai CM, Zhang Z, LaRow T, BachiochiD, Williford CE (2000) Multimodel ensemble forecasts forweather and seasonal climate. J Clim 13: 4196–4216
Kumar A, Barnston AG, Hoerling MP (2001) Seasonal prediction,probabilistic verifications, and ensemble size. J Clim 14: 1671–1676
Lamb PJ, Peppler RA (1987) North Atlantic Oscillation: conceptand an application. Bull Am Meteorol Soc 68: 1218–1225
Latif M, Barnett TP (1996) Decadal variability over the NorthPacific and North America: dynamics and predictability. J Clim9: 2407–2423
Leith CE (1974) Theoretical skill of Monte Carlo forecasts. MonWeather Rev 102: 409–418
Loewe F (1937) A period of warm winters in western Greenlandand the temperature see-saw between western Greenland andEurope. Q J R Meteorol Soc 63: 365–371
Luterbacher J, Schmutz C, Gyalistras D, Xoplaki E, Wanner H(1999) Reconstruction of monthly NAO and EU indices back toAD 1675. Geophys Res Lett 26: 2745–2748
Marsh R (2000) Recent variability of the North Atlantic thermo-haline circulation inferred from surface heat and freshwaterfluxes. J Clim 13: 3239–3260
Marshall JC, Molteni F (1993) Towards a dynamical understand-ing of weather regimes. J Atmos Sci 50: 1792–1818
Marshall JC, Johnson H, Goodman J (2001) A study of theinteraction of the North Atlantic Oscillation with ocean circu-lation. J Clim 14: 1399–1421
Martineu C, Caneill JY, Sadourny R (1999) Potential predictabilityof European winters from the analysis of seasonal simulationswith an AGCM. J Clim 12: 3033–3061
Massacand AC, Davies HU (2001) Interannual variability ofEuropean winter weather: the potential vorticity insight. AtmosSci Lett doi:10.1006/asle.2001.0026, http://www.ideali-brary.com/links/toc/asle/0/0/0
Molteni F, Cubash U, Tibaldi S (1988) 30- and 60-day forecastexperiments with the ECMWF spectral models. In: Chagas C,Puppi G (eds) Persistent meteo-oceanographic anomalies andteleconnections. Pontificae Academiae Scientiarum ScriptaVaria, Vatican City, 69: 505–555
Moulin C, Lambert CE, Dulac F, Dayan U (1997) Atmosphericexport of dust from North Africa: control by the North AtlanticOscillation. Nature 387: 691–694
Murphy AH (1971) A note on the ranked probability score. J ApplMeteorol 10: 155–156
Murphy AH (1992) Climatology, persistence, and their linearcombination as standards of reference in skill scores. WeatherForecast 7: 692–698
Murphy AH, Winkler RL (1987) A general framework for forecastverification. Mon Weather Rev 115: 1330–1338
Orsolini Y, Doblas-Reyes FJ (2003) Ozone signatures of climatepatterns over the Euro-Atlantic sector in spring. Q J R Mete-orol Soc (in press)
Palmer TN, Sun Z (1985) A modelling and observational study ofthe relationship between sea surface temperature anomalies inthe northwest Atlantic and the atmospheric general circulation.Q J R Meteorol Soc 111: 947–975
Palmer TN, Anderson DLT (1994) The prospect for seasonalforecasting – a review paper. Q J R Meteorol Soc 120: 755–793
Palmer TN, Shukla J (2000) Editorial to DSP/PROVOST specialissue. Q J R Meteorol Soc 126: 1989–1990
Palmer TN, Brankovic C, Richardson DS (2000) A probability anddecision-model analysis of PROVOST seasonal multi-modelensemble integrations. Q J R Meteorol Soc 126: 2013–2034
Pavan V, Doblas-Reyes FJ (2000) Multi-model seasonal forecastsover the Euro-Atlantic: skill scores and dynamic features. ClimDyn 16: 611–625
Pavan V, Molteni F, Brankovic C (2000) Wintertime variability inthe Euro-Atlantic region in observations and in ECMWF sea-sonal ensemble experiments. Q J RMeteorol Soc 126: 2143–2173
Peng S, Whitaker JS (1999) Mechanisms determining the atmo-spheric response to midlatitude SST anomalies. J Clim 12:1393–1408
Perlwitz J, Graf HF (1995) The statistical connection betweentropospheric and stratospheric circulation of the NorthernHemisphere in winter. J Clim 8: 2281–2295
Qian B, Corte-Real J, Xu H (2000) Is the North Atlantic Oscilla-tion the most important atmospheric pattern for precipitationin Europe? J Geophys Res 105: 11,901–11,910
Richardson DS (2001) Measures of skill and value of ensembleprediction systems, their interrelationship and the effect ofensemble size. Q J R Meteorol Soc 127: 2473–2489
Rodwell MJ, Rowell DP, Folland CK (1999) Oceanic forcing of thewintertime North Atlantic oscillation and European climate.Nature 398: 320–323
Rogers JC (1990) Patterns of low-frequency monthly sea levelpressure variability (1899–1986) and associated wave cyclonefrequencies. J Clim 3: 1364–1379
Serreze MC, Carse F, Barry RG, Rogers JC (1997) Icelandic lowcyclone activity: climatological features, linkages with theNAO, and relationship with recent changes in the NorthernHemisphere circulation. J Clim 10: 453–464
Shabbar A, Huang J, Higuchi K (2001) The relationship betweenthe wintertime North Atlantic Oscillation and blocking epi-sodes in the North Atlantic. Int J Climatol 21: 355–369
Silverman BW (1986) Density estimation for statistics and dataanalysis. Chapman and Hall, New York, USA
Doblas-Reyes et al.: The skills of multi-model seasonal forecasts of the wintertime 513

Stefanova L, Krishnamurti TN (2002) Interpretation of seasonalclimate forecast using Brier skill score, the Florida StateUniversity superensemble, and the AMIP-I dataset. J Clim 15:537–544
Stephenson DB (1997) Correlation of spatial climate/weather mapsand the advantages of using the Mahalanobis metric in pre-diction. Tellus 49A: 513–527
Stephenson DB (2000) Use of the ‘‘odds ratio’’ for diagnosingforecast skill. Weather Forecast 15: 221–232
Stephenson DB, Pavan V (2003) The North Atlantic Oscillation incoupled climate models: a CMIP1 evaluation. Clim Dyn (inpress)
Stephenson DB, Pavan V, Bojariu R (2000) Is the North AtlanticOscillation a random walk? Int J Climatol 20: 1–18
Stephenson DB, Wanner H, Bronnimann S, Luterbacher J (2003)The history of scientific research on the North Atlantic Oscil-lation. In: Hurrell JW, Kushnir Y, Ottersen G, Visbeck M (eds)The North Atlantic Oscillation. AGU Geophysical MonographSeries, 134
Stern W, Miyakoda K (1995) Feasibility of seasonal forecastinferred from multiple GCM simulations. J Clim 8: 1071–1085
Sutton R, Mathieu PP (2002) Response of the atmosphere–oceanmixed layer system to anomalous ocean heat flux convergence.Q J R Meteorol Soc 128:1259–1275
Swets JA (1973) The relative operating characteristic in psychol-ogy. Science 182: 990–1000
Thompson PD (1977) How to improve accuracy by combiningindependent forecasts. Mon Weather Rev 105: 228–229
Thornes JE, Stephenson DB (2001) How to judge the quality andvalue of weather forecast products. Meteorol Appl 8: 307–314
Tracton MS, Kalnay E (1993) Operational ensemble prediction atthe National Meteorological Center. Practical aspects. WeatherForecast 8: 379–398
van Loon H, Rogers JC (1978) The seesaw in winter temperaturesbetween Greenland and Northern Europe. Part I: generaldescription. Mon Weather Rev 106: 296–310
Vislocky RL, Fritsch JM (1995) Improved model output statisticsforecast through model consensus. Bull Am Meteorol Soc 76:1157–1164
Walker GT (1924) Correlations in seasonal variations of weatherIX. Mem. 24: 275–332, Indian Meteorological Department,Pune, India
Wallace JM, Gutzler DS (1981) Teleconnections in the geopotentialheight field during the Northern Hemisphere winter. MonWeather Rev 109: 784–812
Wilks DS (1995) Statistical methods in the atmospheric sciences.Academic Press, (1st edn)
Zhang H, Casey T (2000) Verification of categorical probabilityforecasts. Weather Forecast 15: 80–89
514 Doblas-Reyes et al.: The skills of multi-model seasonal forecasts of the wintertime