v management (compass ii) staff. aluing the resources … results - hecht-v2.pdf · joy hecht -...
TRANSCRIPT
October 2005
International Resource
This publication was produced for review by the United States Agency for Development. It was prepared by Community Partnerships for SustainableManagement (COMPASS II) staff.
VALUING THE RESOURCES OF MULANJE MOUNTAIN CURRENT AND PROJECTED USE UNDER ALTERNATE MANAGEMENT SCENARIOS
OCCASIONAL PAPER NO. 14 COMMUNITY PARTNERSHIPS FOR SUSTAINABLE RESOURCE MANAGEMENT (COMPASS II)
April 2006
This publication was produced for review by the United States Agency for International Development. It was prepared by Dr. Joy Hecht, on contract to Development Alternatives, Inc.

AUTHORITY Prepared for USAID/Malawi under Contract Number 690-C-00-04-00090-00 awarded 30 April 2004, entitled Community Partnerships for Sustainable Resource Management in Malawi (COMPASS II)
The views expressed and opinions contained in this report are those of the COMPASS II field team and are not intended as statements of policy of either USAID or the contractor companies.
PREPARED BY:
and:
COMMUNITY PARTNERSHIPS FOR SUSTAINABLE
RESOURCE MANAGEMENT IN MALAŴI
MMUULLAANNJJEE MMOOUUNNTTAAIINN CCOONNSSEERRVVAATTIIOONN TTRRUUSSTT
AUTHOR: JOY HECHT
CREDITS: COVER PHOTOS, TEXT EDITING, AND REPORT LAYOUT AND DESIGN: JOHN DICKINSON COMPASS II IMPLEMENTING PARTNERS:
Development Alternatives, Inc Private Bag 20, 1st floor Able House 7250 Woodmont Ave., Suite 200 #8 Hannover Ave at Chilembwe Road Bethesda, MD 20814, USA Blantyre, MALAWI Tel: +1-301-718-8699 Telephone: +265 (0)1-622-800 Fax: +1-301-718-7968 Fax: +265 (0)1 622 852 email: [email protected] email: [email protected] With: Wildlife & Environmental Society of Malawi (WESM) +265-1-643-502 Private Bag 578, Limbe, Malawi Spectrum Media +1-617-491-4300 271 Willow Ave., Somerville MA 02144 US MULANJE MOUNTAIN CONSERVATION TRUST:
Mulanje Mountain Conservation Trust (MMCT) +265-1-466282 P.O. Box 139, Mulanje MALAWI
E-mail: [email protected] Fax: +265-1-466241 [email protected]; [email protected] http://www.mountmulanje.org.mw/index.php
Additional copies of this report and associated materials are available from COMPASS II, MMCT, or on the web at http://www.joyhecht.net.
VALUING THE RESOURCES OF MULANJE MOUNTAIN
CURRENT AND PROJECTED USE UNDER ALTERNATE MANAGEMENT SCENARIOS
DISCLAIMER The views expressed in this publication do not necessarily reflect the views of the United States Agency for International Development or the United States Government.
Table of contents Executive Summary..................................................................................................................iii 1. Introduction .................................................................................................................1 2. About the Study ...........................................................................................................2 3. Data Sources and Valuation Methods . .........................................................................7 4. Results ......................................................................................................................17 5. Recommendations .....................................................................................................28 References ............................................................................................................................32 Individuals Consulted ............................................................................................................36 List of tables Table 1. Land cover in the Mulanje Forest Preserve and the 7-km buffer zone ........................5 Table 2. Value of Mulanje resources, 2005, in kwacha .........................................................17 Table 3. Lifespan of Woodlands ...........................................................................................19 Table 4. Demand for Fuelwood at five-year intervals, in cubic meters ...................................20 Table 5. Demand for and supply of wood, in cubic meters ...................................................21 Table 6. Monetary Values of Mulanje Mountain Resources, in 2005 kwacha ........................23 Table 7. Net Present Values Under Two Discount Rates .......................................................24 List of figures Figure 1. Land cover in the Mulanje Mountain Forest Reserve, 2002 ......................................4 Figure 2. Land cover in the 7-km buffer zone, 2002 ................................................................4
Joy Hecht - Valuation of Mulanje Mountain COMPASS / MMCT, April 2006 ii
Executive summary The resources provided by Malawi’s Mount Mulanje are under threat. This area of unique biodiversity and endemic species is being encroached upon by cultivators, harvesters of timber, charcoal-makers, fire-setting hunters, and, according to some, even staff of the Forest Department responsible for its sustainable management. At the same time, the mountain provides a broad range of natural resources and environmental services to the people who live near it, including food, fuel, medicines, and, most importantly, pure clean water from its many rivers and streams. If the encroachment is not stopped, all of the other services will be stopped, to the detriment of those who live in Mulanje and Phalombe Districts. The cost of replacing those services is likely to be much greater than the costs of preventing encroachment, and the benefits reaped in the short run by those responsible for encroachment are likely to be far lower than the benefits of sustainable use of the mountain. This study looks at the values of Mount Mulanje from an economic perspective, in order to estimate how much the mountain contributes to the economic well-being of the surrounding community, and how those contributions will evolve over time under several different management scenarios. Several interesting results emerge from this work:
The total value of flows from the mountain in 2005 is estimated to be close to six hundred million kwachas, of which more than half comes from domestic use of fuelwood. Cedar harvesting, most of which is illegal, comes a distant second at about seventy million kwachas, and drinking water is a close third. Tourism, which is sometimes expected to create economic incentives for resource conservation, is estimated at less than three million kwachas in 2005, so it is not likely to achieve the goals sometimes expected of it.
In 2005 the use of fuelwood from the protected area exceeded its sustainable yield
including the dead wood shed by the trees by about a factor of three. Fuelwood demand is going to grow with population growth, while the current excess of demand over supply means that the stock of forest must be mined rather than harvested sustainably. Supply will therefore decline over time until there is no forest left.
If business continues as usual in the region, we anticipate that miombo woodlands on the
mountain will be gone by 2011, and afromontane forests by 2016. With greatly improved forest management and improved Forest Department operations, the lifespan of miombo may be extended to 2014 and of afromontane until past 2023, which is the endpoint of our projections. Once the forests are gone, we assume that most of the other non-timber forest products will also be depleted.
This suggests that strategies designed to improve management of natural woodlands cannot
prevent them from being destroyed. Instead, we must look to strategies to reduce demand for fuelwood, by developing other sources of energy for the region.
The data from which we have arrived at these conclusions are very imprecise. If any management decisions are to be made based on this work, it is essential that this study be followed up with collection of primary data in the Mulanje area to assess the validity of our results. All of the results of this study, including the spreadsheets and full text of the underlying references, are being distributed on CD through COMPASS and MMCT, and are available on the web at www.joyhecht.net.
Joy Hecht - Valuation of Mulanje Mountain COMPASS / MMCT, April 2006 iii

1. Introduction The resources provided by Malawi’s Mount Mulanje are under threat. This area of unique biodiversity and endemic species is being encroached upon by cultivators, harvesters of timber, charcoal-makers, fire-setting hunters, and, according to some, even staff of the Forest Department responsible for its sustainable management. At the same time, the mountain provides a broad range of natural resources and environmental services to the people who live near it, including food, fuel, medicines, and, most importantly, pure clean water from its many rivers and streams. If the encroachment is not stopped, all of the other services will be stopped, to the detriment of those who live in Mulanje and Phalombe Districts. The cost of replacing those services is likely to be much greater than the costs of preventing encroachment, and the benefits reaped in the short run by those responsible for encroachment are likely to be far lower than the benefits of sustainable use of the mountain. This study looks at the values of Mount Mulanje from an economic perspective. We are interested in understanding who receives economic benefits from the mountain now, through their direct consumption of the products of its forests or use of the abundant water flowing in its streams and rivers. While these things are not sold for hard cash, and so are not included in national economic statistics, they nevertheless have considerable economic value to those who use them, and can be understood as “income in kind.” If nature did not provide those resources, residents of local communities would have to find the funds to buy them, and would be that much poorer as a result. When we know the economic value of the mountain, we know what its neighbors will lose if the resources continue to be destroyed, and what we can hope to retain indefinitely if the mountain can be managed sustainably. The aim of this study, therefore, is to develop the economic information with which to show what Mount Mulanje gives us now, and what we will lose if we do not show better stewardship in the coming year. This study has been a joint effort of COMPASS II and the Mulanje Mountain Conservation Trust (MMCT). Both organizations are interested not only in the results of this work, but in expanding the application of economic approaches to resources management in Malawi. For this reason, we are making all of the materials underlying this work available to interested users, including the complex spreadsheet in which the underlying data are stored, the assumptions embedded, and the calculations made. We are also distributing all of the references from which we obtained data or background information in digital form, so users of this work can see where our inputs come from. For copies of the CD containing this material, please contact COMPASS or MMCT. All of this material is also available on the web at http://www.joyhecht.net.
Joy Hecht - Valuation of Mulanje Mountain COMPASS / MMCT, April 2006 1
2. About the Study What are we studying? This study is estimating the economic value of the resources being used from the Mount Mulanje Forest Reserve. We begin by estimating how much was used in the base year, 2005, and calculating its economic value. We then project physical availability and monetary value of the resources provided by the natural forests (though not the plantations) under four different scenarios. Business as Usual: This scenario assumes that management of the forest is unchanged. Demand for resources will increase with population growth, to a point at which they will be completely depleted because demand exceeds sustainable yield. Scenario 2, Improved Forest Management: Under this scenario, the combined effect of a number of different projects and activities designed to increase resource-dependent incomes and improve forest management is anticipated to raise the mean annual increment for miombo woodlands throughout the protected area from a current level of 2.0 cubic meters per hectare to an extremely optimistic level of 4.5 cubic meters per hectare. In addition, introduction of improved cookstoves and compressed rather than baked bricks will reduce demand somewhat, and the expansion of efficient resource-dependent economic activities will increase incomes from aquaculture and irrigated agriculture at least for as long as there are still forests on the mountain. Scenario 3, More Effective Forest Department Role: In addition to the assumptions of scenario 2, this scenario assumes that the Forest Department is able to play a more effective role on the mountain than it does at present. We assume that management of the plantations is turned over to a private concessionaire, so Forest Department staff can devote their time to management of the natural forests. We further assume that the Forest Department is able to retain the revenues they receive for logging permits and other fees, and that they collect all that is owed including all of the fees for removing headloads of wood from the protected area. This would greatly increase their revenues, as the headload fees would amount to over forty million kwachas per year. We then assume that with its greater resources and more limited responsibilities, the Forest Department staff are able to reduce forest fires, illegal cedar cutting, charcoal burning, agricultural encroachment, and other harm to the resources. Scenario 4, Additional Plantations: The last scenario assumes that in addition to the previous changes, about 7700 hectares of now-vacant land within the protected area is planted with eucalyptus to be used for fuelwood. This scenario makes some unrealistic assumptions, notably that even if miombo is still available at little or not cost, local residents can be induced to burn eucalyptus instead. Moreover it does not address the question of whether the eucalyptus would be sold, or would be available at no price for people to simply harvest and use; by not factoring in a price elasticity of demand it implicitly assumes the latter. This makes it rather unrealistic. It does show, however, that if demand were shifted away from the miombo woodlands, they would survive much longer, buying time to address the problem of finding alternatives to fuelwood as a source of household energy. Scale of the analysis Four distinct scales could be relevant to this study:
Joy Hecht - Valuation of Mulanje Mountain COMPASS / MMCT, April 2006 2
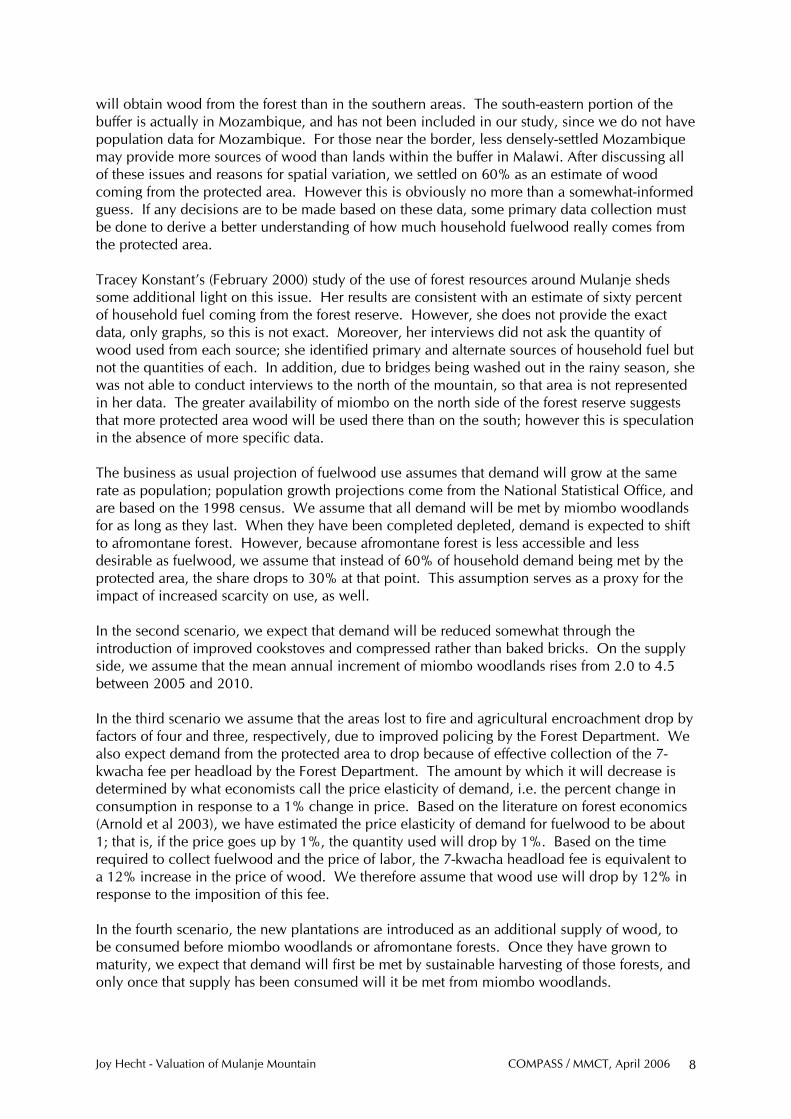
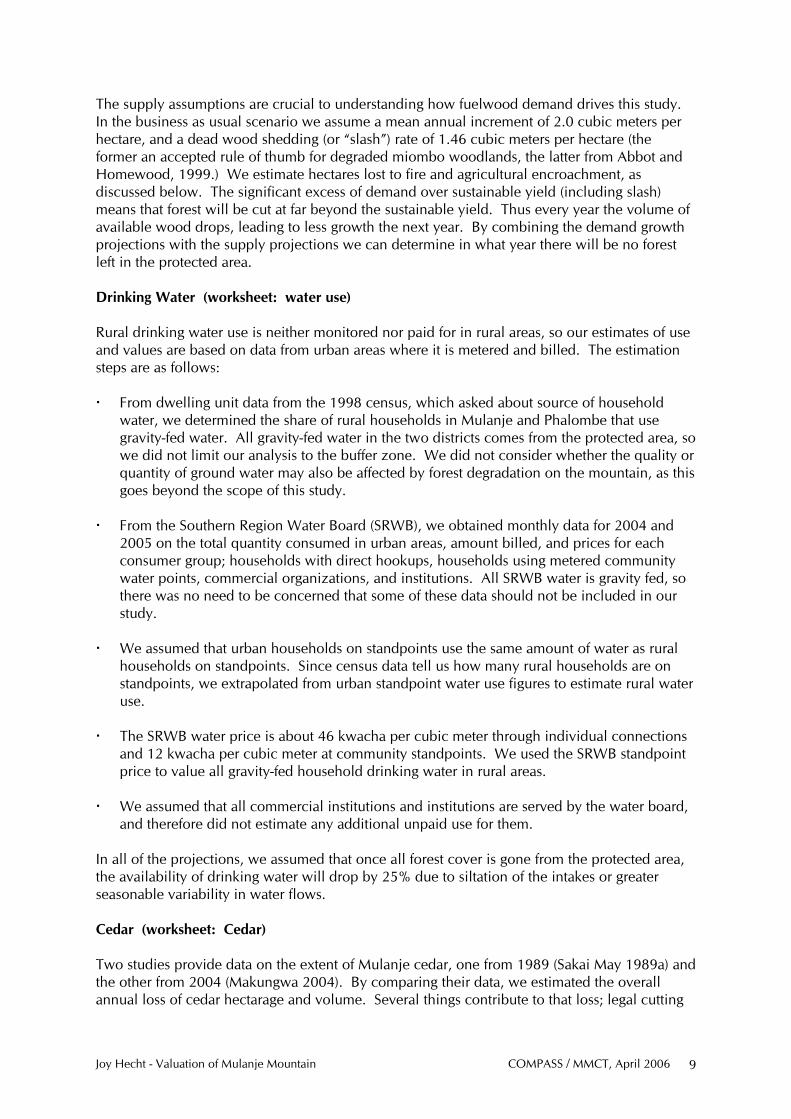
The Forest Reserve. This is the area whose value we are trying to estimate; it is where the degradation is occurring and endemic species still survive. Hardly anyone lives in the reserve, but many people engage in economic activities there. The immediate mountain region. This is the area from which people will walk to the mountain to gather resources, and is the area that the Mount Mulanje Conservation Trust (MMCT) uses to define scope the scope of its activities. People who live in this region comprise most of the direct users of resources from the mountain. They also cause much of the degradation of the mountain, through unsustainable harvesting practices; therefore in addition to being users, they are potential protectors of the resources. This region has been defined as a seven-kilometer buffer around the boundary of the protected area. People who use gravity-fed water. People throughout the districts of Mulanje and Phalombe obtain their water from the mountain, through gravity-fed systems or directly from watercourses. These people benefit from protection of the forests on the mountain, even if they live too far from the mountain to make direct use of other resources. The country as a whole. This includes users and suppliers of resources such as charcoal, ecotourism services, products marketed outside the region, and minerals if they were to be exploited. The study focuses on the second and third groups, since they include the communities that benefit most directly from the mountain’s resources. Our data on the circulation of mountain resources outside of the local region are extremely limited; further data on this group would be of considerable interest if they were available, however. Background Spatial Data This study depends on a set of spatial imagery about the forest reserve and the 7 kilometer buffer around it, developed for us by DAI staff in the United States. (Bouvier 2006) This showed the outline of the protected area and the buffer and land cover within them. From the National Statistical Office, we obtained data on the population and number of households in the districts of Mulanje and Phalombe and the population and number of households in the buffer. We assumed that only people within the buffer zone would actually walk to the protected area to obtain resources, although we did not assume that everyone in the buffer obtained their resources from the mountain. The calculation or estimation of the share of buffer zone households using each resource is one of the areas of uncertainty in certain key results of the study. Figures 1 and 2 show the land cover in the protected area and the buffer. While they are difficult to interpret in black and white, a few items can be observed. The darkest areas in Figure 1 are afromontane forest, and the lightest shaded area forming a band on the northern and eastern slides of the mountain are miombo woodlands. The very narrow strip of slightly darker shading at the northeast edge of the protected area is assumed to be agricultural encroachment. The white spots are cloud cover, while the medium shading covering most of the mountaintops is high grassland. In the buffer zone, the quite small dark areas where unprotected land juts into the protected area are miombo woodlands, while the medium shaded areas south of the mountain are tea plantations.
Joy Hecht - Valuation of Mulanje Mountain COMPASS / MMCT, April 2006 3
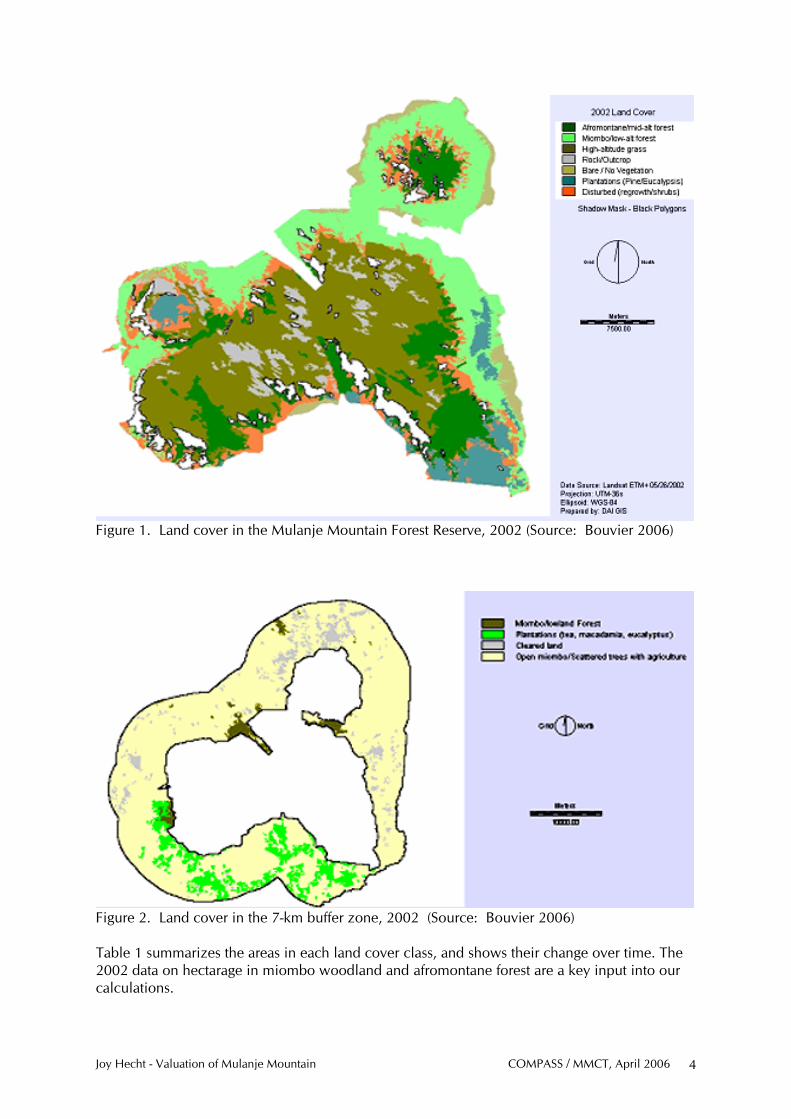
Figure 1. Land cover in the Mulanje Mountain Forest Reserve, 2002 (Source: Bouvier 2006)
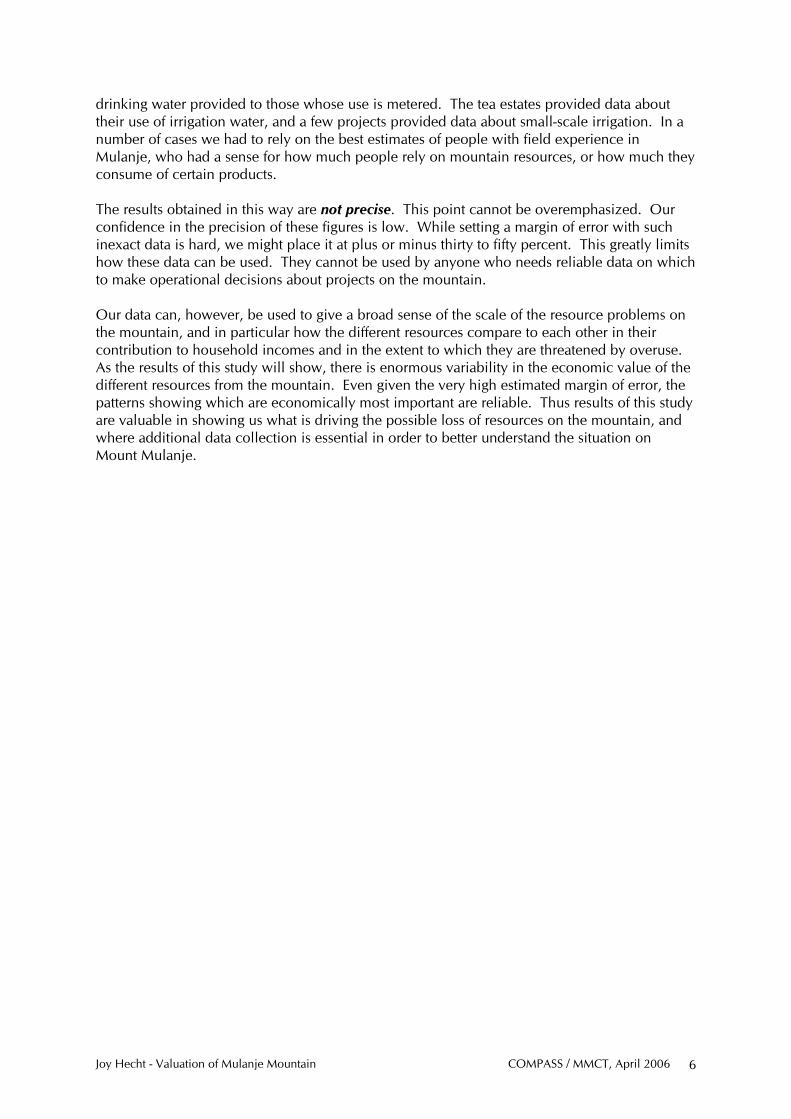
Figure 2. Land cover in the 7-km buffer zone, 2002 (Source: Bouvier 2006) Table 1 summarizes the areas in each land cover class, and shows their change over time. The 2002 data on hectarage in miombo woodland and afromontane forest are a key input into our calculations.
Joy Hecht - Valuation of Mulanje Mountain COMPASS / MMCT, April 2006 4
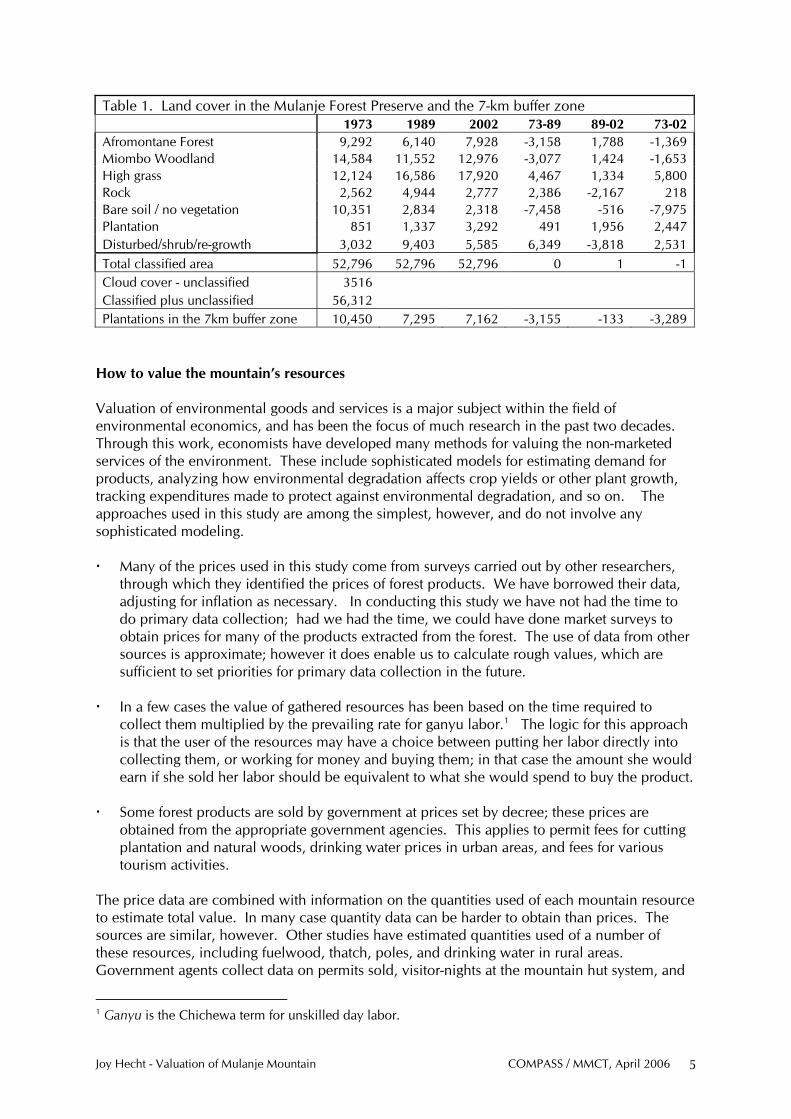
Table 1. Land cover in the Mulanje Forest Preserve and the 7-km buffer zone 1973 1989 2002 73-89 89-02 73-02 Afromontane Forest 9,292 6,140 7,928 -3,158 1,788 -1,369 Miombo Woodland 14,584 11,552 12,976 -3,077 1,424 -1,653 High grass 12,124 16,586 17,920 4,467 1,334 5,800 Rock 2,562 4,944 2,777 2,386 -2,167 218 Bare soil / no vegetation 10,351 2,834 2,318 -7,458 -516 -7,975 Plantation 851 1,337 3,292 491 1,956 2,447 Disturbed/shrub/re-growth 3,032 9,403 5,585 6,349 -3,818 2,531 Total classified area 52,796 52,796 52,796 0 1 -1 Cloud cover - unclassified 3516 Classified plus unclassified 56,312 Plantations in the 7km buffer zone 10,450 7,295 7,162 -3,155 -133 -3,289
How to value the mountain’s resources Valuation of environmental goods and services is a major subject within the field of environmental economics, and has been the focus of much research in the past two decades. Through this work, economists have developed many methods for valuing the non-marketed services of the environment. These include sophisticated models for estimating demand for products, analyzing how environmental degradation affects crop yields or other plant growth, tracking expenditures made to protect against environmental degradation, and so on. The approaches used in this study are among the simplest, however, and do not involve any sophisticated modeling. Many of the prices used in this study come from surveys carried out by other researchers,
through which they identified the prices of forest products. We have borrowed their data, adjusting for inflation as necessary. In conducting this study we have not had the time to do primary data collection; had we had the time, we could have done market surveys to obtain prices for many of the products extracted from the forest. The use of data from other sources is approximate; however it does enable us to calculate rough values, which are sufficient to set priorities for primary data collection in the future.
In a few cases the value of gathered resources has been based on the time required to
collect them multiplied by the prevailing rate for ganyu labor.1 The logic for this approach is that the user of the resources may have a choice between putting her labor directly into collecting them, or working for money and buying them; in that case the amount she would earn if she sold her labor should be equivalent to what she would spend to buy the product.
Some forest products are sold by government at prices set by decree; these prices are
obtained from the appropriate government agencies. This applies to permit fees for cutting plantation and natural woods, drinking water prices in urban areas, and fees for various tourism activities.
The price data are combined with information on the quantities used of each mountain resource to estimate total value. In many case quantity data can be harder to obtain than prices. The sources are similar, however. Other studies have estimated quantities used of a number of these resources, including fuelwood, thatch, poles, and drinking water in rural areas. Government agents collect data on permits sold, visitor-nights at the mountain hut system, and
1 Ganyu is the Chichewa term for unskilled day labor.
Joy Hecht - Valuation of Mulanje Mountain COMPASS / MMCT, April 2006 5
drinking water provided to those whose use is metered. The tea estates provided data about their use of irrigation water, and a few projects provided data about small-scale irrigation. In a number of cases we had to rely on the best estimates of people with field experience in Mulanje, who had a sense for how much people rely on mountain resources, or how much they consume of certain products. The results obtained in this way are not precise. This point cannot be overemphasized. Our confidence in the precision of these figures is low. While setting a margin of error with such inexact data is hard, we might place it at plus or minus thirty to fifty percent. This greatly limits how these data can be used. They cannot be used by anyone who needs reliable data on which to make operational decisions about projects on the mountain. Our data can, however, be used to give a broad sense of the scale of the resource problems on the mountain, and in particular how the different resources compare to each other in their contribution to household incomes and in the extent to which they are threatened by overuse. As the results of this study will show, there is enormous variability in the economic value of the different resources from the mountain. Even given the very high estimated margin of error, the patterns showing which are economically most important are reliable. Thus results of this study are valuable in showing us what is driving the possible loss of resources on the mountain, and where additional data collection is essential in order to better understand the situation on Mount Mulanje.
Joy Hecht - Valuation of Mulanje Mountain COMPASS / MMCT, April 2006 6
3. Data Sources and Valuation Methods The data in this study were obtained largely from the literature and from government records. This section provides an overview of how we estimated current use and value of each resource, and how we did projected each under the four scenarios. For the full detail on our methodology, it is essential to study in detail the spreadsheet through which this analysis was conducted; this is available from COMPASS II or MMCT or on the web at www.jhecht.net. Fuelwood (worksheet: Hhold wood) The value of fuelwood was estimated in a number of steps, with a few key assumptions: We located four different studies that estimated how much fuelwood is used per household
in Malawi, and two that estimated prices for fuelwood.2 We essentially averaged these, to arrive at an annual household use figure of 2,371 kilos and a market value of 2.35 kwachas per kilo, or an annual value per household of 5,567 kwacha. Of course this is not household expenditure on wood; very few households in this area buy fuelwood. Rather, it is the market equivalent of resources that they obtain in kind, by expending their own labor to collect it.
Using measurements of the weight of miombo species (Abbot and Lowore 1999), we
estimated the volume of wood used per household at 2.486 cubic meters per year. Converting weight to volume is essential to compare household use with forest growth, because the latter is typically measured in volume.
The total household consumption in the buffer zone, based on these estimates, would be
241,500 cubic meters per year. However, we do not think that everyone in the buffer zone obtains all their fuelwood from the protected area; other sources include community wood lots, tea wood, crop residues, miombo woodlands outside the protected area, and so on. We assumed that 60% of household fuelwood comes from the protected area and the remaining 40% from other sources. This gave us a 2005 volume of wood from the protected area of about 145,000 cubic meters, valued at about 323 million kwacha.
The assumption that 60% of household fuelwood comes from the protected area is crucial to all of the analysis that follows. It is an estimate, based on the impressions of MMCT staff who work closely with communities in Mulanje and Phalombe; it is not a measured value. A number of factors went into the decision to use this figure. There is very little wood growing in the buffer zone, so some of the MMCT staff initially assumed that all fuelwood had to come from the protected area. However, seven kilometers is a fairly long distance to walk to collect wood, so we thought those on the outskirts of the buffer might be looking for wood elsewhere. We also expected considerable variation across the buffer zone. The southern side of the mountain is very steep, and has very little of the preferred miombo woodland growing on it. Obtaining wood in that part of the forest would be very difficult. However that portion of the buffer zone houses most of the tea plantations, which are in the process of ripping out old tea and replacing it with higher-performing clonal species. The old tea wood is given to the workers to burn, and constitutes a significant source of energy for some households. The northern and eastern sides of Mulanje and Mchesi (which is also part of the protected area) are still heavily covered with miombo woodlands, so we expected that more people in those areas
2 Brouwer et al 1997; Simons cited in Lowore 2003; Killy Sichinga (COMPASS II staff) personal communication; Abbot and Homewood 1999.
Joy Hecht - Valuation of Mulanje Mountain COMPASS / MMCT, April 2006 7
will obtain wood from the forest than in the southern areas. The south-eastern portion of the buffer is actually in Mozambique, and has not been included in our study, since we do not have population data for Mozambique. For those near the border, less densely-settled Mozambique may provide more sources of wood than lands within the buffer in Malawi. After discussing all of these issues and reasons for spatial variation, we settled on 60% as an estimate of wood coming from the protected area. However this is obviously no more than a somewhat-informed guess. If any decisions are to be made based on these data, some primary data collection must be done to derive a better understanding of how much household fuelwood really comes from the protected area. Tracey Konstant’s (February 2000) study of the use of forest resources around Mulanje sheds some additional light on this issue. Her results are consistent with an estimate of sixty percent of household fuel coming from the forest reserve. However, she does not provide the exact data, only graphs, so this is not exact. Moreover, her interviews did not ask the quantity of wood used from each source; she identified primary and alternate sources of household fuel but not the quantities of each. In addition, due to bridges being washed out in the rainy season, she was not able to conduct interviews to the north of the mountain, so that area is not represented in her data. The greater availability of miombo on the north side of the forest reserve suggests that more protected area wood will be used there than on the south; however this is speculation in the absence of more specific data. The business as usual projection of fuelwood use assumes that demand will grow at the same rate as population; population growth projections come from the National Statistical Office, and are based on the 1998 census. We assume that all demand will be met by miombo woodlands for as long as they last. When they have been completed depleted, demand is expected to shift to afromontane forest. However, because afromontane forest is less accessible and less desirable as fuelwood, we assume that instead of 60% of household demand being met by the protected area, the share drops to 30% at that point. This assumption serves as a proxy for the impact of increased scarcity on use, as well. In the second scenario, we expect that demand will be reduced somewhat through the introduction of improved cookstoves and compressed rather than baked bricks. On the supply side, we assume that the mean annual increment of miombo woodlands rises from 2.0 to 4.5 between 2005 and 2010. In the third scenario we assume that the areas lost to fire and agricultural encroachment drop by factors of four and three, respectively, due to improved policing by the Forest Department. We also expect demand from the protected area to drop because of effective collection of the 7-kwacha fee per headload by the Forest Department. The amount by which it will decrease is determined by what economists call the price elasticity of demand, i.e. the percent change in consumption in response to a 1% change in price. Based on the literature on forest economics (Arnold et al 2003), we have estimated the price elasticity of demand for fuelwood to be about 1; that is, if the price goes up by 1%, the quantity used will drop by 1%. Based on the time required to collect fuelwood and the price of labor, the 7-kwacha headload fee is equivalent to a 12% increase in the price of wood. We therefore assume that wood use will drop by 12% in response to the imposition of this fee. In the fourth scenario, the new plantations are introduced as an additional supply of wood, to be consumed before miombo woodlands or afromontane forests. Once they have grown to maturity, we expect that demand will first be met by sustainable harvesting of those forests, and only once that supply has been consumed will it be met from miombo woodlands.
Joy Hecht - Valuation of Mulanje Mountain COMPASS / MMCT, April 2006 8
The supply assumptions are crucial to understanding how fuelwood demand drives this study. In the business as usual scenario we assume a mean annual increment of 2.0 cubic meters per hectare, and a dead wood shedding (or “slash”) rate of 1.46 cubic meters per hectare (the former an accepted rule of thumb for degraded miombo woodlands, the latter from Abbot and Homewood, 1999.) We estimate hectares lost to fire and agricultural encroachment, as discussed below. The significant excess of demand over sustainable yield (including slash) means that forest will be cut at far beyond the sustainable yield. Thus every year the volume of available wood drops, leading to less growth the next year. By combining the demand growth projections with the supply projections we can determine in what year there will be no forest left in the protected area. Drinking Water (worksheet: water use) Rural drinking water use is neither monitored nor paid for in rural areas, so our estimates of use and values are based on data from urban areas where it is metered and billed. The estimation steps are as follows: From dwelling unit data from the 1998 census, which asked about source of household
water, we determined the share of rural households in Mulanje and Phalombe that use gravity-fed water. All gravity-fed water in the two districts comes from the protected area, so we did not limit our analysis to the buffer zone. We did not consider whether the quality or quantity of ground water may also be affected by forest degradation on the mountain, as this goes beyond the scope of this study.
From the Southern Region Water Board (SRWB), we obtained monthly data for 2004 and
2005 on the total quantity consumed in urban areas, amount billed, and prices for each consumer group; households with direct hookups, households using metered community water points, commercial organizations, and institutions. All SRWB water is gravity fed, so there was no need to be concerned that some of these data should not be included in our study.
We assumed that urban households on standpoints use the same amount of water as rural
households on standpoints. Since census data tell us how many rural households are on standpoints, we extrapolated from urban standpoint water use figures to estimate rural water use.
The SRWB water price is about 46 kwacha per cubic meter through individual connections
and 12 kwacha per cubic meter at community standpoints. We used the SRWB standpoint price to value all gravity-fed household drinking water in rural areas.
We assumed that all commercial institutions and institutions are served by the water board,
and therefore did not estimate any additional unpaid use for them. In all of the projections, we assumed that once all forest cover is gone from the protected area, the availability of drinking water will drop by 25% due to siltation of the intakes or greater seasonable variability in water flows. Cedar (worksheet: Cedar) Two studies provide data on the extent of Mulanje cedar, one from 1989 (Sakai May 1989a) and the other from 2004 (Makungwa 2004). By comparing their data, we estimated the overall annual loss of cedar hectarage and volume. Several things contribute to that loss; legal cutting
Joy Hecht - Valuation of Mulanje Mountain COMPASS / MMCT, April 2006 9
of dead cedar, illegal cutting of live and dead cedar, fire, and aphids (a parasite that kills live cedar). We assumed that the same overall rate of cedar loss would continue under the business as usual scenario; the challenge is to estimate the causes of cedar loss. We had two data sources on permits to remove dead cedar, one from Makungwa, who averaged data over several years, and the other from the Mulanje Forest Department, for 2004. We used the Makungwa figures, as he had access to more primary data than we did. This accounted for 400 cubic meters of a total annual loss of 5611 cubic meters. Based on discussions with Julian Bayliss, MMCT ecologist, we estimated that of the remaining 5211 cubic meters lost, 4800 is live cedar, and of that, 2400 is illegally cut and the rest lost equally to fires and parasites. Of the 411 cubic meters of lost dead cedar that is not harvested legally, we assumed that half is harvested illegally and the rest lost to fires. Based on his research on cedar, Julian estimated a mean annual increment of 1 cubic meter per hectare. Based on these numbers, we calculated for how many years cedar would continue to be available under the business as usual scenario. The second scenario does not make any change, but in the third and fourth scenarios we assume that the Forest Department will prevent all illegal cutting, and loss to fire will drop due to improved Forest Department fire prevention. Thatch (worksheet: Hhold NTFPs) From Simons (1997), cited in Lowore (2003), we have data on the number of bunches of thatch used per year in an average household and the price of a bunch of thatch in 1997. We updated the price to 2005 kwacha to determine average household expenditure now. Based on discussion with Gerard Meke at FRIM we assumed that 80% of thatch in the buffer zone comes from the protected area. This allowed us to calculate the total number of bunches and value of thatch from the protected area. We project thatch use to increase with population growth in all four scenarios. Agricultural Encroachment (worksheet: encroachment) Although agricultural encroachment harms the forest and reduces yields from fuelwood and NTFPs, it creates agricultural revenue as well, and must therefore be included in the analysis. We estimated the area encroached on so far using the 2002 satellite imagery developed by DAI (Bouvier 2006). We assumed that bare land at the edges of the protected area is in fact agricultural encroachment; based on this, we calculated that 1,934 hectares of land in the protected area are now being cultivated. The value of this land was calculated by assuming a maize yield of 800 kilos per hectare, and a price of 1,000 kwacha per 50-kg bag. Prices are higher in drought years (like this one); this is a typical price. Based on this price we estimated the total value of maize grown within the protected area. We experimented with two methods for estimating the land area lost to agricultural encroachment. The first calculates encroachment based on population increase, assuming that availability of non-encroached land becomes increasingly tight so the rate of encroachment will be higher in the future than it has been in the past. The second projects the rate of encroachment based on land cover change from 1973 to 1989 to 2002 (Bouvier 2006). We used the first method in subsequent calculations, because we expect land supply to be more restricted in the future than it has been in the past. In particular, the 1990s saw decreasing population in Mulanje and Phalombe as many of the Mozambican refugees fleeing the civil war in their country returned home, so encroachment rates were very low. We therefore assumed
Joy Hecht - Valuation of Mulanje Mountain COMPASS / MMCT, April 2006 10
that in the future 15% of the new households formed because of population growth would encroach into the protected area in order to obtain land on which to grow crops. This rate does not change in the second scenario. In the third and fourth scenarios, however, we assume that the Forest Department is more effective in preventing encroachment, so only 5% of new households are expected to cultivate protected area land. Poles (worksheet: Hhold NTFPs) We have data from Simons (1997), cited in Lowore (2003), on the average days of labor required to gather the poles needed for an average traditional house. We multiplied the labor figure by the price of ganyu labor in the Mulanje area to obtain the value of poles per house. We used NSO data from the 1998 census to calculate the number of households in the buffer zone who live in traditional structures. Of those we assumed that 50% obtain their poles from the protected area. We further assumed that a traditional pole and mud house must be replaced every two years. This enabled us to calculate the number of new houses built each year, and therefore the value of poles used in new home construction each year. We expect the use of poles to increase with population growth in all of the projections. Tea Irrigation (worksheets: water use, Tea estate irr.) Quantifying the water used for tea irrigation was easy, as the manager of Lujeri generously provided his full data on 2004 irrigation. We used this to estimate irrigation of clonal tea on Eastern Produce estates as well. Only newly planted clonal teas are irrigated; the traditional teas are rain-fed. We have data from both companies on their hectarage in clonal tea, so we could calculate water used per hectare by Lujeri and apply that rate to Eastern Produce. Estimating the value of that water is more difficult. The tea estates purchase permits to extract water for irrigation, but the permit price is a flat fee and is not based on the amount of water extracted. Each year the estates replace up to 2% per tea of their total tea area with clonal teas; this enabled us to estimate a growth rate for tea irrigation for all four projection scenarios. We assumed that the availability of irrigation water would drop gradually as forest on the mountain degrades, leveling off at 25% starting levels once there is no forest left on the mountain. This assumption is consistent across the four projections. In agricultural economics, the ordinary way to estimate the value of an input such as water would be to calculate the value of the crop with and without that input, and attribute the difference in value to the additional input. This was not possible, for two reasons. First, we do not have any financial data on the tea estates. More importantly, however, irrigated and non-irrigated teas are two different varieties. The difference in value, therefore, cannot be attributed only to the water inputs; it is also due to introduction of a new variety of tea. Very few countries charge for irrigation water. Where they do, the fee is generally intended to cover the costs of delivery rather than the scarcity value of water. The tea estates have installed their own irrigation systems and do not depend on public infrastructure such as dams, so they have borne the delivery costs already. It is not clear whether irrigation water is in fact scarce, and therefore whether any scarcity pricing system would be justified. To determine that, we
Joy Hecht - Valuation of Mulanje Mountain COMPASS / MMCT, April 2006 11

would need to carry out hydrological studies on Mulanje which are beyond the scope of this project, and which have not been conducted by anyone to our knowledge.3 When farmers do pay for irrigation water, they generally pay much lower prices than domestic users. With that in mind, we have estimated the value of tea irrigation water at half the price of rural water use, or about 6 kwacha per cubic meter. Compared with other irrigation water prices this is probably too high. The issue of tea irrigation water pricing is important if we are interested in encouraging water users to protect the forests that now contribute to the quality of that water. If the forests are degraded, those who use gravity-fed water for drinking, irrigation, or aquaculture will lose some or all of the water on which they depend. Depending on how much they use, the value of that water in their activities, and the alternatives to using that water, they may be willing to pay to ensure that the gravity-fed water will continue to be available. Since the tea estates use more water than any other individuals, and may have more financial resources available for source water protection, the question of how much they might be willing to pay to ensure access to water is an important one. We do not have enough information to assess whether or how much water users (particularly the tea estates, but aquaculturalists and drinking water users as well) might be willing to pay for water. Discussions with the directors of Lujeri and Eastern Produce in November 2005 suggest that neither feels the profitability of their tea is threatened by forest degradation on the slopes above them, in which case they will not feel it necessary to invest further in watershed protection. They also suggest that their profit margins are small, as Malawi tea is a small player subject to world prices. If source water protection seems useful, this may warrant more investigation in the future. Fuelwood for Brick Burning (worksheet: Bricks) We have data on use of fuelwood in burning bricks from two studies, one of Uganda and the other of Malawi. (World Bank/UNDP et al 1989, Zingani 2005, respectively). In Uganda they appear to use much larger bricks than in Malawi, as each one weighs 5.85 kilos. However, the Uganda study indicates how many bricks are needed to make houses according to the number of rooms in the house, whereas the Malawi study does not allow us to estimate how many bricks would be used, only the quantity of wood required to fire them. We have, therefore, used the Ugandan rather than the Malawian data, although we have provided both sets of information in the spreadsheet and the references. The Uganda study provides data on the quantity of wood required to fire a load of bricks, the number of bricks per load, and the number of bricks required to build houses of sizes varying from one to six rooms. From the 1998 census, we have data on the number of permanent houses in the same size classes for Mulanje and Phalombe. Assuming that 80% of permanent houses are made of burnt brick, we calculated the number of permanent houses of each size in the buffer zone, the bricks required to build those houses, and the quantity of wood required to fire those bricks. Since commercial brick-makers are known to buy fuelwood from plantations in the region, and Konstant (2000) reports that in 2000 brick burning did not affect the availability of fuelwood resources, we assumed that only 20% of wood for firing bricks comes from the protected area. Based on this assumption, we calculated the quantity and value of wood from the protected area used to fire brick. Because we assumed that only 20% of wood
3 A team funded by the Scottish Executive and organized by Paul Shaw (www.geovision.co.uk) may be undertaking such work in the next six months; however their funding is not yet certain.
Joy Hecht - Valuation of Mulanje Mountain COMPASS / MMCT, April 2006 12
for brick burning comes from the protected area, our numbers are relatively low. A lot of other wood is required for these bricks; however it does not affect the protected area under our assumptions. In the business as usual scenario, we expect the use of wood to rise with population growth. In the second scenario, we expect it to drop somewhat as some burnt bricks are replaced with compressed bricks. We do not anticipate any further change in fuel use for brick manufacture in the third and fourth scenarios. Beekeeping (worksheet: honey) Estimates of the current level of beekeeping activity were provided by Moffat Kayembe of MMCT. Data on the cost structure of beekeeping activity, including consolidation, transport, and retailing, come from a study carried out by Kadale Consultants (2005). We applied the Kadale data to estimate beekeeping revenue within the Mulanje area and elsewhere in the country. In the business as usual scenario, we assume that the level of beekeeping in the region will be unchanged. In the second scenario, we initially anticipated that it would increase and become more profitable, as the Malawi gold standard techniques are applied by beekeepers. However, the beekeeping experts who conducted the gold standard analysis considered productivity in the Mulanje area to be too low to support expanded honey production. We therefore projected no increases in output under any scenario. In all four projections, we assume that once the protected area forests are gone, all beekeeping will end, since the pasture for the bees will have been destroyed. Tourism (worksheet: tourism) We have data on visitor nights in the huts on Mount Mulanje from two sources, the Forest Department offices in Mulanje and Phalombe, and InfoMulanje, a visitor center in Mulanje BOMA. Although both sets of data are fully presented in the worksheet, the consensus of MMCT staff was that the Forest Department data would incorporate all of the InfoMulanje data, so our calculations are based only on Forest Department data. We are missing data on visits to the mountain by members of the Blantyre-based Mulanje Mountain Club (MMC). Club members pay for hut nights through the club, not through the Forest Department, and we were not able to obtain the MMC records for this study. Our figures are therefore somewhat underestimated. Although the Forest Department data are in some respects insufficient, we estimated the number of visitor nights, the number of days for which porters and guides were hired, forest entry fees, and parking fees. Porter and guide fees go to community members; all other fees go to the Forest Department. This enabled us to estimate annual community and Forest Department revenue for 2004. In the business as usual scenario we assume no growth of tourism over time. In the other three scenarios we assume a 3% growth in tourism revenue per year, as a result of increased efforts to market Mulanje as a destination. In all four projections we assume that once the forest cover is gone, tourism will drop off by 25%. Crafts (Worksheet: crafts)
Joy Hecht - Valuation of Mulanje Mountain COMPASS / MMCT, April 2006 13
The data on returns to woodcarving and crafts sales are based on discussions with the vendors at the Mulanje Forest Department headquarters in Likhabula. They provided a basis for estimating their costs and net income and the size of the industry as a whole. This is probably an underestimate, since it does not include curio sellers whose wares are not sold through shops in either Likhabula or Chitikale. It also does not include the revenues to merchants who purchase in the Mulanje area for sale elsewhere in Malawi or in other countries. We do not anticipate any increase in craft sales in any of the projections. Charcoal (Worksheet: charcoal) Our data on current charcoal use are based on estimates of current volume by Carl Bruessow of MMCT; thus they are very crude guesses. In the business as usual scenario, we project that they will increase at twice the population growth rate of Blantyre. We do not expect any change in the second scenario, but in the third and fourth scenarios we anticipate that with improved Forest Department performance charcoal burning will be controlled somewhat. In those scenarios we expect it to increase by the change in Blantyre population rather than twice that change. Aquaculture (Worksheet: aquaculture) Our data on the cost structure for aquaculture come from two sources, the National Strategic Aquaculture Plan (Malawi Department of Fisheries 2005) and a study carried out by ICLARM (ICLARM 1991). We obtained estimates of the quantity of aquaculture activity in Mulanje and Phalombe from John Makina of the Shire Highlands Sustainable Livelihoods Programme in Mulanje. In the business as usual scenario, we assume that there will be no growth in aquaculture. In the subsequent scenarios, projections of future returns to aquaculture are based on the cost structure developed in conjunction with the Malawi gold standard for aquaculture and estimates of how many fish farmers would adopt the gold standard techniques in Mulanje and Phalombe. We further assume that once all of the forest on the mountain is gone, the resulting degradation of water quality due to sedimentation will make aquaculture impossible. Rope (Worksheet: Household NTFPs) We have estimates of household use of and expenditure for rope from a study by Gacheke Simons, cited in Lowore 2003. We assumed that half of the rope used by households in the buffer zone comes from plants in the protected area. In all four projections we assume that use of rope will grow with population, and that once all of the forest cover is gone the supply of rope will be gone as well. Plantation sawlogs, poles, and fuelwood (Worksheet: Comm. wood) We have data on quantities sold and revenues received for sawlogs, poles, and fuelwood (and associated permit revenues) from the Forest Departments in Mulanje and Phalombe. We have assumed that these will not change in the business as usual scenario or scenario 2. However Scenarios 3 and 4 assume that the management of plantations in the protected area will be privatized, in which case the Forest Department will no longer receive these revenues. Fires (Worksheet: forest fires)
Joy Hecht - Valuation of Mulanje Mountain COMPASS / MMCT, April 2006 14
Fires on the mountain, deliberately set by hunters and Forest Department staff, accidentally set by pitsawyers or through fire break management, or naturally set by storms, have burned much of the Mulanje forests. We obtained data from the Forest Department offices in Mulanje and Phalombe concerning the areas damaged and completely destroyed in protected area plantations between 1992 and 2004, and compared them with similar data from the FORINDECO study (2000). We equated one hectare of damaged forest with 0.5 hectare of destroyed forest to come up with an average area destroyed each year over that time period, and to calculate the share of the plantation land burning each year. Through discussions with Gerard Meke (FRIM), we estimated that plantation burns much faster than miombo woodlands and somewhat faster than afromontane forests. Assuming that fire strikes evenly throughout the forest, we assumed that if (based on our calculations) 4.5% of the plantations burn each year, then 3.0% of afromontane forests would burn and 1.0% of miombo woodlands. Applying these ratios, we calculated the amount of miombo and afromontane forest expected to burn each year. We projected forest loss due to fire in the business as usual scenario and scenario 2 by applying these rates of loss. In scenarios 3 and 4 we assumed that better management by the Forest Department would reduce the hectares lost to 25% of the initial levels. Missing data We have no data on several NTFPs of interest; mushrooms, grazing, wild honey, gathered fruits, medicinal plants, and hunting. Of these, medicinal plants may be of the great economic interest, because they are exported to South Africa, Mozambique, and other countries in the region. Returns to hunting are probably very low; however the harm caused by fires set by hunters is high, so additional information about hunting would be of interest. Bauxite The possibility of mining bauxite on Mount Mulanje is conspicuously absent from this study. Bauxite is known to exist under the south western part of the mountain, and its mining has been under discussion in the country for several decades. In 1994 a Canadian company, Met-Chem, prepared a feasibility study for the exploitation of this resource. (Met-Chem 1994) Since then, the project has been included in the government’s investment plan, but no one has followed up on it. We have chosen not to include bauxite in this study for two reasons. First, an analysis of the possible returns to bauxite mining, or benefits of the project to the country or the Mulanje region, goes far beyond both the scope of our effort and the skills we bring to the work. It might be feasible to estimate the loss of mountain resources that would result from mining, but we could not balance that with estimates of the revenue it would bring. Second, perhaps conveniently, no mining company has expressed interest in pursuing these resources. They are located on top of the plateau, at 2000 meters, and it is a given in the Met-Chem study that a road could not be built up the mountain to bring in machinery and workers or remove ores. Bringing the resources from Mulanje to a port would be costly as well; the nearest one would be a full day’s drive away at Beira in Mozambique. Moreover, there is an effort underway to declare Mulanje a world heritage site. If this happens, then any efforts to mine the bauxite would likely meet with strong resistance from international NGOs. While they do not always succeed in blocking projects, international NGOs can create considerable delay and bad publicity. All of these factors are probably contributing to the lack of commercial interest in Mulanje bauxite. The resource is not rare, and there are surely easier places to mine
Joy Hecht - Valuation of Mulanje Mountain COMPASS / MMCT, April 2006 15

than on the top of a very steep 2000 meter plateau with no access to ports and the potential for vocal international opposition. We have, therefore, concluded that the mining of Mulanje bauxite is not a serious threat, and have omitted it from our work.
Joy Hecht - Valuation of Mulanje Mountain COMPASS / MMCT, April 2006 16
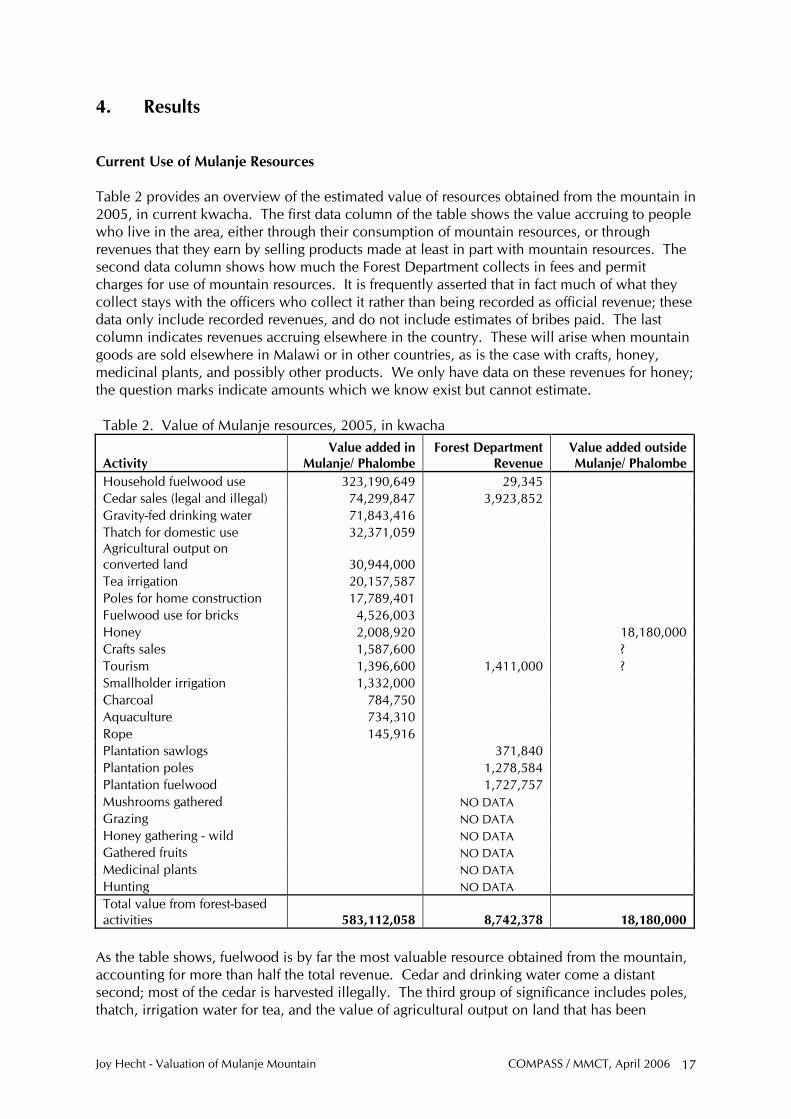
4. Results Current Use of Mulanje Resources Table 2 provides an overview of the estimated value of resources obtained from the mountain in 2005, in current kwacha. The first data column of the table shows the value accruing to people who live in the area, either through their consumption of mountain resources, or through revenues that they earn by selling products made at least in part with mountain resources. The second data column shows how much the Forest Department collects in fees and permit charges for use of mountain resources. It is frequently asserted that in fact much of what they collect stays with the officers who collect it rather than being recorded as official revenue; these data only include recorded revenues, and do not include estimates of bribes paid. The last column indicates revenues accruing elsewhere in the country. These will arise when mountain goods are sold elsewhere in Malawi or in other countries, as is the case with crafts, honey, medicinal plants, and possibly other products. We only have data on these revenues for honey; the question marks indicate amounts which we know exist but cannot estimate. Table 2. Value of Mulanje resources, 2005, in kwacha
Activity Value added in
Mulanje/ Phalombe Forest Department
Revenue Value added outside Mulanje/ Phalombe
Household fuelwood use 323,190,649 29,345 Cedar sales (legal and illegal) 74,299,847 3,923,852 Gravity-fed drinking water 71,843,416 Thatch for domestic use 32,371,059 Agricultural output on converted land 30,944,000 Tea irrigation 20,157,587 Poles for home construction 17,789,401 Fuelwood use for bricks 4,526,003 Honey 2,008,920 18,180,000 Crafts sales 1,587,600 ? Tourism 1,396,600 1,411,000 ? Smallholder irrigation 1,332,000 Charcoal 784,750 Aquaculture 734,310 Rope 145,916 Plantation sawlogs 371,840 Plantation poles 1,278,584 Plantation fuelwood 1,727,757 Mushrooms gathered NO DATA Grazing NO DATA Honey gathering - wild NO DATA Gathered fruits NO DATA Medicinal plants NO DATA Hunting NO DATA Total value from forest-based activities 583,112,058 8,742,378 18,180,000
As the table shows, fuelwood is by far the most valuable resource obtained from the mountain, accounting for more than half the total revenue. Cedar and drinking water come a distant second; most of the cedar is harvested illegally. The third group of significance includes poles, thatch, irrigation water for tea, and the value of agricultural output on land that has been
Joy Hecht - Valuation of Mulanje Mountain COMPASS / MMCT, April 2006 17
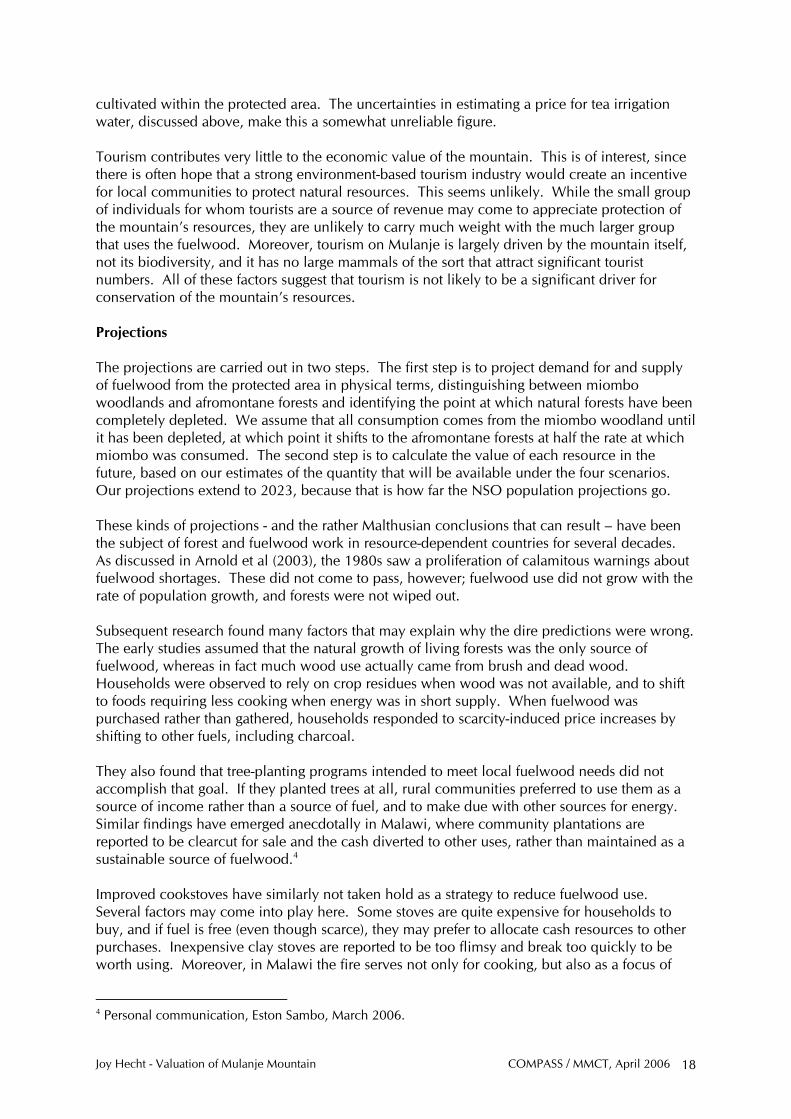
cultivated within the protected area. The uncertainties in estimating a price for tea irrigation water, discussed above, make this a somewhat unreliable figure. Tourism contributes very little to the economic value of the mountain. This is of interest, since there is often hope that a strong environment-based tourism industry would create an incentive for local communities to protect natural resources. This seems unlikely. While the small group of individuals for whom tourists are a source of revenue may come to appreciate protection of the mountain’s resources, they are unlikely to carry much weight with the much larger group that uses the fuelwood. Moreover, tourism on Mulanje is largely driven by the mountain itself, not its biodiversity, and it has no large mammals of the sort that attract significant tourist numbers. All of these factors suggest that tourism is not likely to be a significant driver for conservation of the mountain’s resources. Projections The projections are carried out in two steps. The first step is to project demand for and supply of fuelwood from the protected area in physical terms, distinguishing between miombo woodlands and afromontane forests and identifying the point at which natural forests have been completely depleted. We assume that all consumption comes from the miombo woodland until it has been depleted, at which point it shifts to the afromontane forests at half the rate at which miombo was consumed. The second step is to calculate the value of each resource in the future, based on our estimates of the quantity that will be available under the four scenarios. Our projections extend to 2023, because that is how far the NSO population projections go. These kinds of projections - and the rather Malthusian conclusions that can result – have been the subject of forest and fuelwood work in resource-dependent countries for several decades. As discussed in Arnold et al (2003), the 1980s saw a proliferation of calamitous warnings about fuelwood shortages. These did not come to pass, however; fuelwood use did not grow with the rate of population growth, and forests were not wiped out. Subsequent research found many factors that may explain why the dire predictions were wrong. The early studies assumed that the natural growth of living forests was the only source of fuelwood, whereas in fact much wood use actually came from brush and dead wood. Households were observed to rely on crop residues when wood was not available, and to shift to foods requiring less cooking when energy was in short supply. When fuelwood was purchased rather than gathered, households responded to scarcity-induced price increases by shifting to other fuels, including charcoal. They also found that tree-planting programs intended to meet local fuelwood needs did not accomplish that goal. If they planted trees at all, rural communities preferred to use them as a source of income rather than a source of fuel, and to make due with other sources for energy. Similar findings have emerged anecdotally in Malawi, where community plantations are reported to be clearcut for sale and the cash diverted to other uses, rather than maintained as a sustainable source of fuelwood.4 Improved cookstoves have similarly not taken hold as a strategy to reduce fuelwood use. Several factors may come into play here. Some stoves are quite expensive for households to buy, and if fuel is free (even though scarce), they may prefer to allocate cash resources to other purchases. Inexpensive clay stoves are reported to be too flimsy and break too quickly to be worth using. Moreover, in Malawi the fire serves not only for cooking, but also as a focus of
4 Personal communication, Eston Sambo, March 2006.
Joy Hecht - Valuation of Mulanje Mountain COMPASS / MMCT, April 2006 18
social activity, as people congregate around its warmth and light to chat in the evening. An efficient stove that emits no light or excess heat will not provide the focus for a social gathering that a cooking fire does; indeed, households with efficient stoves may still wish to build the fire for social reasons.5
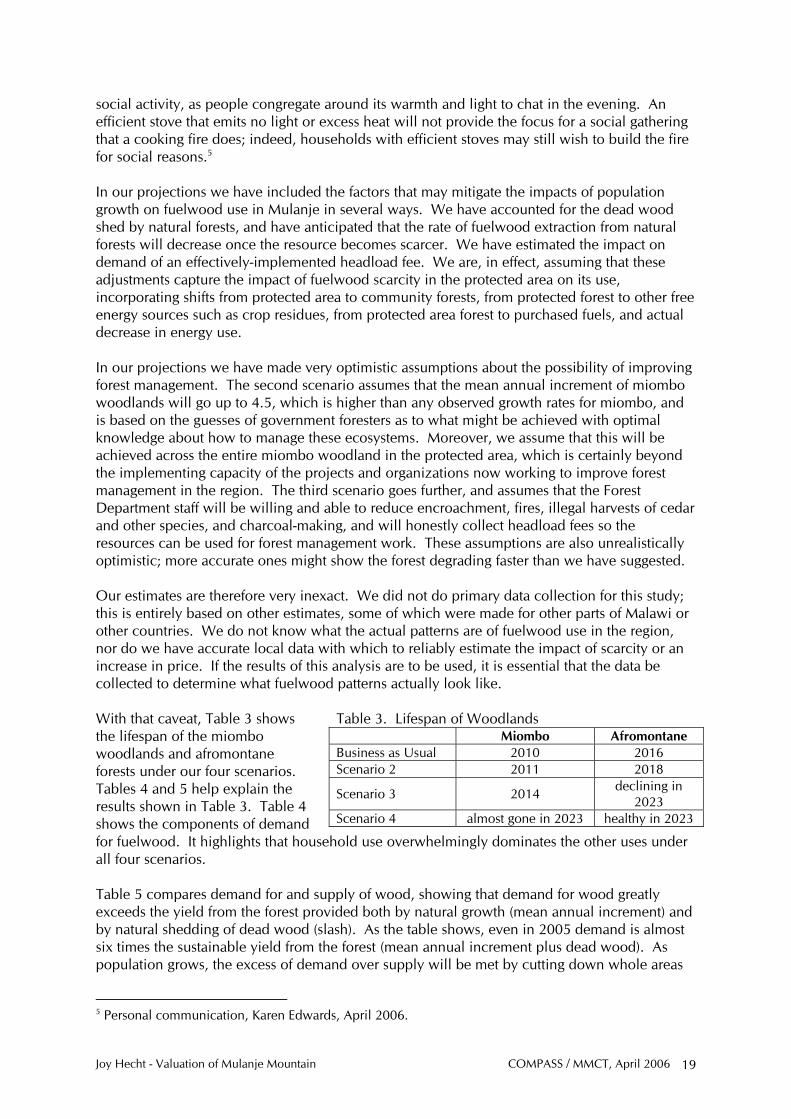
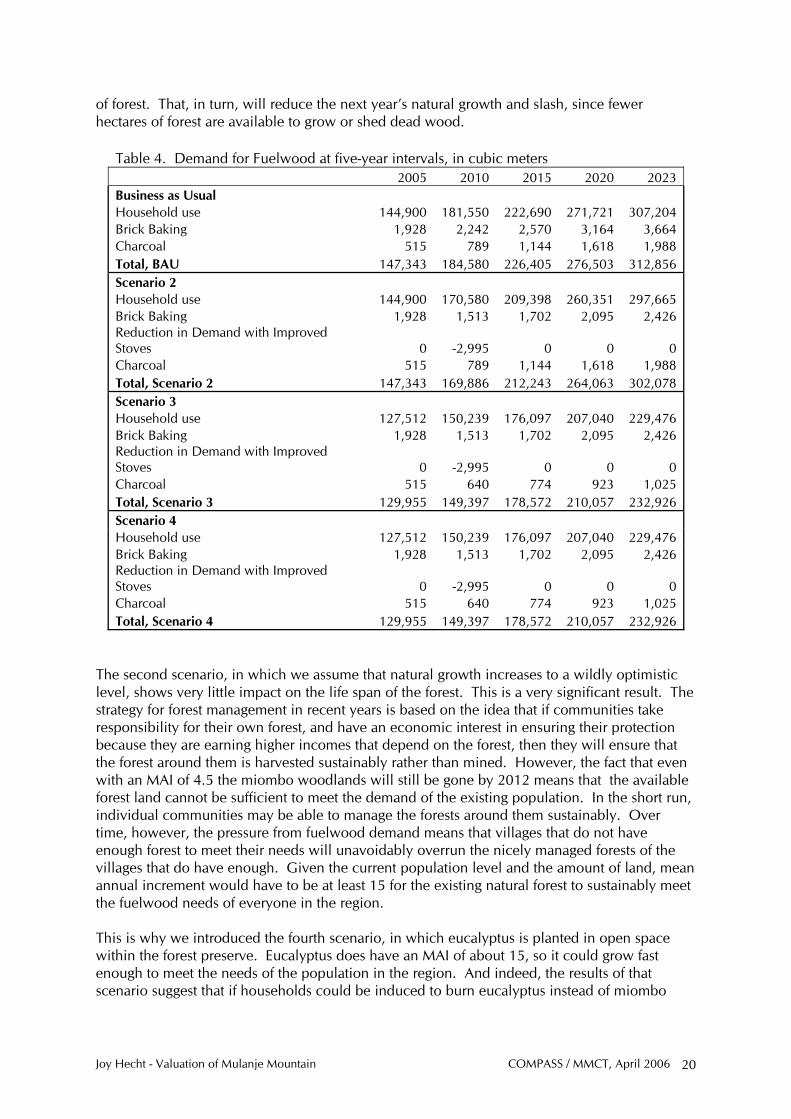
In our projections we have included the factors that may mitigate the impacts of population growth on fuelwood use in Mulanje in several ways. We have accounted for the dead wood shed by natural forests, and have anticipated that the rate of fuelwood extraction from natural forests will decrease once the resource becomes scarcer. We have estimated the impact on demand of an effectively-implemented headload fee. We are, in effect, assuming that these adjustments capture the impact of fuelwood scarcity in the protected area on its use, incorporating shifts from protected area to community forests, from protected forest to other free energy sources such as crop residues, from protected area forest to purchased fuels, and actual decrease in energy use. In our projections we have made very optimistic assumptions about the possibility of improving forest management. The second scenario assumes that the mean annual increment of miombo woodlands will go up to 4.5, which is higher than any observed growth rates for miombo, and is based on the guesses of government foresters as to what might be achieved with optimal knowledge about how to manage these ecosystems. Moreover, we assume that this will be achieved across the entire miombo woodland in the protected area, which is certainly beyond the implementing capacity of the projects and organizations now working to improve forest management in the region. The third scenario goes further, and assumes that the Forest Department staff will be willing and able to reduce encroachment, fires, illegal harvests of cedar and other species, and charcoal-making, and will honestly collect headload fees so the resources can be used for forest management work. These assumptions are also unrealistically optimistic; more accurate ones might show the forest degrading faster than we have suggested. Our estimates are therefore very inexact. We did not do primary data collection for this study; this is entirely based on other estimates, some of which were made for other parts of Malawi or other countries. We do not know what the actual patterns are of fuelwood use in the region, nor do we have accurate local data with which to reliably estimate the impact of scarcity or an increase in price. If the results of this analysis are to be used, it is essential that the data be collected to determine what fuelwood patterns actually look like. With that caveat, Table 3 shows the lifespan of the miombo woodlands and afromontane forests under our four scenarios. Tables 4 and 5 help explain the results shown in Table 3. Table 4 shows the components of demand for fuelwood. It highlights that household use overwhelmingly dominates the other uses under all four scenarios.
Table 3. Lifespan of Woodlands Miombo Afromontane Business as Usual 2010 2016 Scenario 2 2011 2018
Scenario 3 2014 declining in 2023
Scenario 4 almost gone in 2023 healthy in 2023
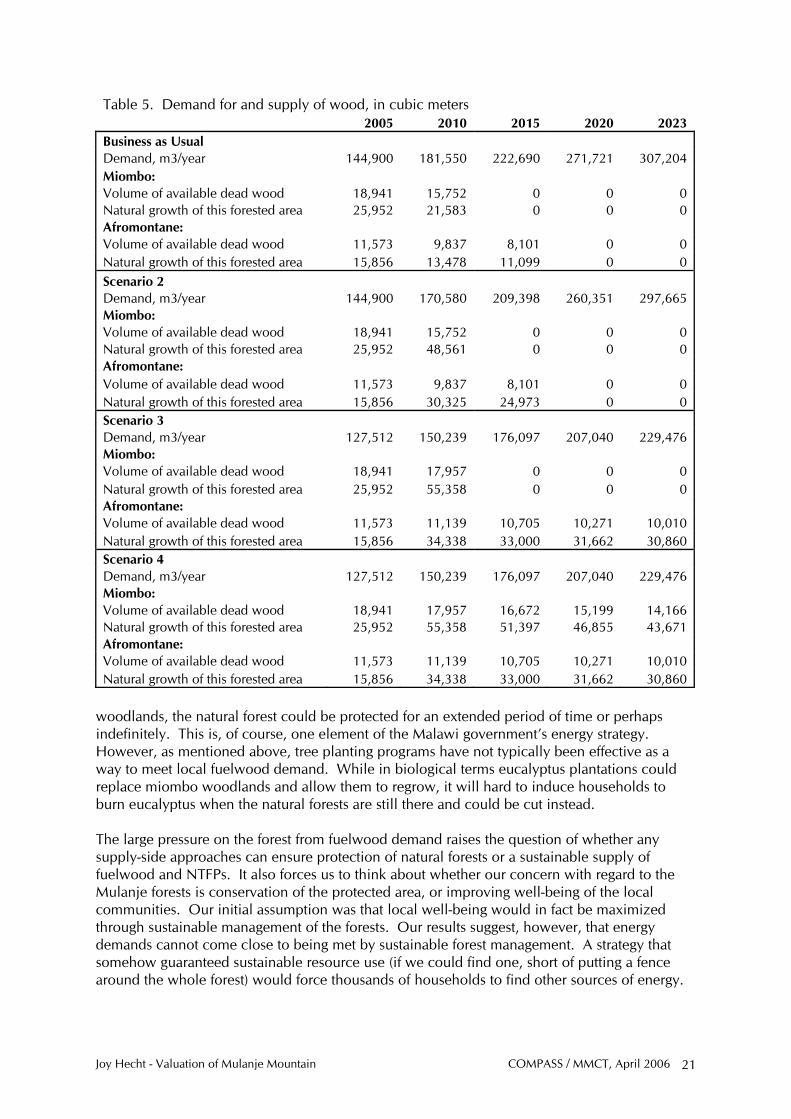
Table 5 compares demand for and supply of wood, showing that demand for wood greatly exceeds the yield from the forest provided both by natural growth (mean annual increment) and by natural shedding of dead wood (slash). As the table shows, even in 2005 demand is almost six times the sustainable yield from the forest (mean annual increment plus dead wood). As population grows, the excess of demand over supply will be met by cutting down whole areas
5 Personal communication, Karen Edwards, April 2006.
Joy Hecht - Valuation of Mulanje Mountain COMPASS / MMCT, April 2006 19
Joy Hecht - Valuation of Mulanje Mountain COMPASS / MMCT, April 2006 20
of forest. That, in turn, will reduce the next year’s natural growth and slash, since fewer hectares of forest are available to grow or shed dead wood.
Table 4. Demand for Fuelwood at five-year intervals, in cubic meters 2005 2010 2015 2020 2023 Business as Usual Household use 144,900 181,550 222,690 271,721 307,204 Brick Baking 1,928 2,242 2,570 3,164 3,664 Charcoal 515 789 1,144 1,618 1,988 Total, BAU 147,343 184,580 226,405 276,503 312,856 Scenario 2 Household use 144,900 170,580 209,398 260,351 297,665 Brick Baking 1,928 1,513 1,702 2,095 2,426 Reduction in Demand with Improved Stoves 0 -2,995 0 0 0 Charcoal 515 789 1,144 1,618 1,988 Total, Scenario 2 147,343 169,886 212,243 264,063 302,078 Scenario 3 Household use 127,512 150,239 176,097 207,040 229,476 Brick Baking 1,928 1,513 1,702 2,095 2,426 Reduction in Demand with Improved Stoves 0 -2,995 0 0 0 Charcoal 515 640 774 923 1,025 Total, Scenario 3 129,955 149,397 178,572 210,057 232,926 Scenario 4 Household use 127,512 150,239 176,097 207,040 229,476 Brick Baking 1,928 1,513 1,702 2,095 2,426 Reduction in Demand with Improved Stoves 0 -2,995 0 0 0 Charcoal 515 640 774 923 1,025 Total, Scenario 4 129,955 149,397 178,572 210,057 232,926
The second scenario, in which we assume that natural growth increases to a wildly optimistic level, shows very little impact on the life span of the forest. This is a very significant result. The strategy for forest management in recent years is based on the idea that if communities take responsibility for their own forest, and have an economic interest in ensuring their protection because they are earning higher incomes that depend on the forest, then they will ensure that the forest around them is harvested sustainably rather than mined. However, the fact that even with an MAI of 4.5 the miombo woodlands will still be gone by 2012 means that the available forest land cannot be sufficient to meet the demand of the existing population. In the short run, individual communities may be able to manage the forests around them sustainably. Over time, however, the pressure from fuelwood demand means that villages that do not have enough forest to meet their needs will unavoidably overrun the nicely managed forests of the villages that do have enough. Given the current population level and the amount of land, mean annual increment would have to be at least 15 for the existing natural forest to sustainably meet the fuelwood needs of everyone in the region. This is why we introduced the fourth scenario, in which eucalyptus is planted in open space within the forest preserve. Eucalyptus does have an MAI of about 15, so it could grow fast enough to meet the needs of the population in the region. And indeed, the results of that scenario suggest that if households could be induced to burn eucalyptus instead of miombo
Joy Hecht - Valuation of Mulanje Mountain COMPASS / MMCT, April 2006 21
Table 5. Demand for and supply of wood, in cubic meters 2005 2010 2015 2020 2023 Business as Usual Demand, m3/year 144,900 181,550 222,690 271,721 307,204 Miombo: Volume of available dead wood 18,941 15,752 0 0 0 Natural growth of this forested area 25,952 21,583 0 0 0 Afromontane: Volume of available dead wood 11,573 9,837 8,101 0 0 Natural growth of this forested area 15,856 13,478 11,099 0 0 Scenario 2 Demand, m3/year 144,900 170,580 209,398 260,351 297,665 Miombo: Volume of available dead wood 18,941 15,752 0 0 0 Natural growth of this forested area 25,952 48,561 0 0 0 Afromontane: Volume of available dead wood 11,573 9,837 8,101 0 0 Natural growth of this forested area 15,856 30,325 24,973 0 0 Scenario 3 Demand, m3/year 127,512 150,239 176,097 207,040 229,476 Miombo: Volume of available dead wood 18,941 17,957 0 0 0 Natural growth of this forested area 25,952 55,358 0 0 0 Afromontane: Volume of available dead wood 11,573 11,139 10,705 10,271 10,010 Natural growth of this forested area 15,856 34,338 33,000 31,662 30,860 Scenario 4 Demand, m3/year 127,512 150,239 176,097 207,040 229,476 Miombo: Volume of available dead wood 18,941 17,957 16,672 15,199 14,166 Natural growth of this forested area 25,952 55,358 51,397 46,855 43,671 Afromontane: Volume of available dead wood 11,573 11,139 10,705 10,271 10,010 Natural growth of this forested area 15,856 34,338 33,000 31,662 30,860
woodlands, the natural forest could be protected for an extended period of time or perhaps indefinitely. This is, of course, one element of the Malawi government’s energy strategy. However, as mentioned above, tree planting programs have not typically been effective as a way to meet local fuelwood demand. While in biological terms eucalyptus plantations could replace miombo woodlands and allow them to regrow, it will hard to induce households to burn eucalyptus when the natural forests are still there and could be cut instead. The large pressure on the forest from fuelwood demand raises the question of whether any supply-side approaches can ensure protection of natural forests or a sustainable supply of fuelwood and NTFPs. It also forces us to think about whether our concern with regard to the Mulanje forests is conservation of the protected area, or improving well-being of the local communities. Our initial assumption was that local well-being would in fact be maximized through sustainable management of the forests. Our results suggest, however, that energy demands cannot come close to being met by sustainable forest management. A strategy that somehow guaranteed sustainable resource use (if we could find one, short of putting a fence around the whole forest) would force thousands of households to find other sources of energy.
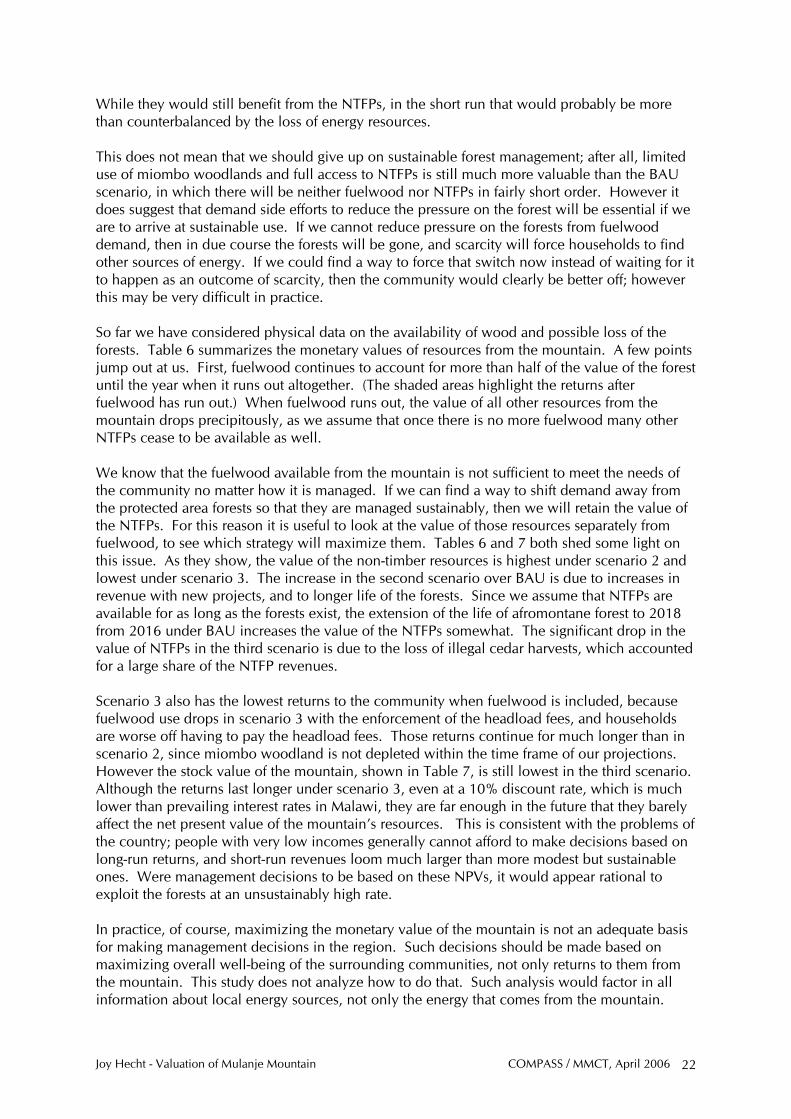
Joy Hecht - Valuation of Mulanje Mountain COMPASS / MMCT, April 2006 22
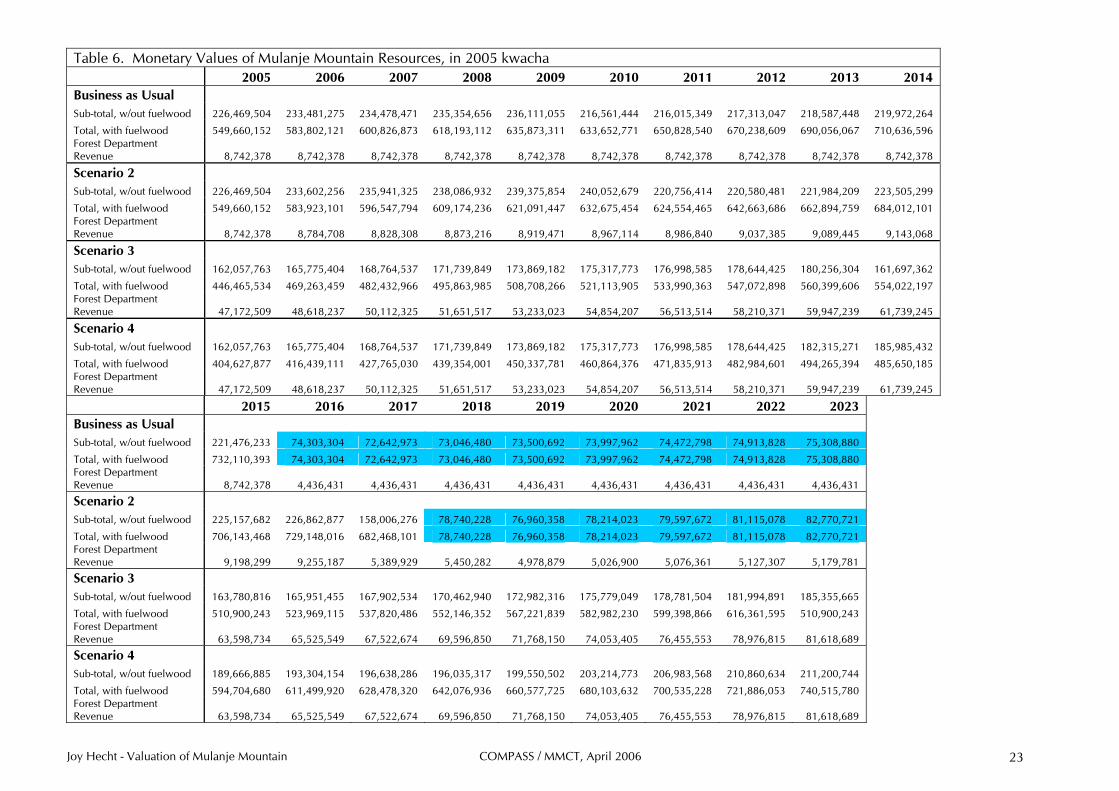
While they would still benefit from the NTFPs, in the short run that would probably be more than counterbalanced by the loss of energy resources. This does not mean that we should give up on sustainable forest management; after all, limited use of miombo woodlands and full access to NTFPs is still much more valuable than the BAU scenario, in which there will be neither fuelwood nor NTFPs in fairly short order. However it does suggest that demand side efforts to reduce the pressure on the forest will be essential if we are to arrive at sustainable use. If we cannot reduce pressure on the forests from fuelwood demand, then in due course the forests will be gone, and scarcity will force households to find other sources of energy. If we could find a way to force that switch now instead of waiting for it to happen as an outcome of scarcity, then the community would clearly be better off; however this may be very difficult in practice. So far we have considered physical data on the availability of wood and possible loss of the forests. Table 6 summarizes the monetary values of resources from the mountain. A few points jump out at us. First, fuelwood continues to account for more than half of the value of the forest until the year when it runs out altogether. (The shaded areas highlight the returns after fuelwood has run out.) When fuelwood runs out, the value of all other resources from the mountain drops precipitously, as we assume that once there is no more fuelwood many other NTFPs cease to be available as well. We know that the fuelwood available from the mountain is not sufficient to meet the needs of the community no matter how it is managed. If we can find a way to shift demand away from the protected area forests so that they are managed sustainably, then we will retain the value of the NTFPs. For this reason it is useful to look at the value of those resources separately from fuelwood, to see which strategy will maximize them. Tables 6 and 7 both shed some light on this issue. As they show, the value of the non-timber resources is highest under scenario 2 and lowest under scenario 3. The increase in the second scenario over BAU is due to increases in revenue with new projects, and to longer life of the forests. Since we assume that NTFPs are available for as long as the forests exist, the extension of the life of afromontane forest to 2018 from 2016 under BAU increases the value of the NTFPs somewhat. The significant drop in the value of NTFPs in the third scenario is due to the loss of illegal cedar harvests, which accounted for a large share of the NTFP revenues. Scenario 3 also has the lowest returns to the community when fuelwood is included, because fuelwood use drops in scenario 3 with the enforcement of the headload fees, and households are worse off having to pay the headload fees. Those returns continue for much longer than in scenario 2, since miombo woodland is not depleted within the time frame of our projections. However the stock value of the mountain, shown in Table 7, is still lowest in the third scenario. Although the returns last longer under scenario 3, even at a 10% discount rate, which is much lower than prevailing interest rates in Malawi, they are far enough in the future that they barely affect the net present value of the mountain’s resources. This is consistent with the problems of the country; people with very low incomes generally cannot afford to make decisions based on long-run returns, and short-run revenues loom much larger than more modest but sustainable ones. Were management decisions to be based on these NPVs, it would appear rational to exploit the forests at an unsustainably high rate. In practice, of course, maximizing the monetary value of the mountain is not an adequate basis for making management decisions in the region. Such decisions should be made based on maximizing overall well-being of the surrounding communities, not only returns to them from the mountain. This study does not analyze how to do that. Such analysis would factor in all information about local energy sources, not only the energy that comes from the mountain.
- Valuation of Mulanje Mountain COMPASS / MMCT, April 2006 23
Table 6. Monetary Values of Mulanje Mountain Resources, in 2005 kwacha 2005 2006 2007 2008 2009 2010 2011 2012 2013 2014Business as Usual Sub-total, w/out fuelwood 226,469,504 233,481,275 234,478,471 235,354,656 236,111,055 216,561,444 216,015,349 217,313,047 218,587,448 219,972,264
Total, with fuelwood 549,660,152 583,802,121 600,826,873 618,193,112 635,873,311 633,652,771 650,828,540 670,238,609 690,056,067 710,636,596Forest Department Revenue 8,742,378 8,742,378 8,742,378 8,742,378 8,742,378 8,742,378 8,742,378 8,742,378 8,742,378 8,742,378
Scenario 2
Sub-total, w/out fuelwood 226,469,504 233,602,256 235,941,325 238,086,932 239,375,854 240,052,679 220,756,414 220,580,481 221,984,209 223,505,299
Total, with fuelwood 549,660,152 583,923,101 596,547,794 609,174,236 621,091,447 632,675,454 624,554,465 642,663,686 662,894,759 684,012,101Forest Department Revenue 8,742,378 8,784,708 8,828,308 8,873,216 8,919,471 8,967,114 8,986,840 9,037,385 9,089,445 9,143,068
Scenario 3
Sub-total, w/out fuelwood 162,057,763 165,775,404 168,764,537 171,739,849 173,869,182 175,317,773 176,998,585 178,644,425 180,256,304 161,697,362
Total, with fuelwood 446,465,534 469,263,459 482,432,966 495,863,985 508,708,266 521,113,905 533,990,363 547,072,898 560,399,606 554,022,197Forest Department Revenue 47,172,509 48,618,237 50,112,325 51,651,517 53,233,023 54,854,207 56,513,514 58,210,371 59,947,239 61,739,245
Scenario 4
Sub-total, w/out fuelwood 162,057,763 165,775,404 168,764,537 171,739,849 173,869,182 175,317,773 176,998,585 178,644,425 182,315,271 185,985,432
Total, with fuelwood 404,627,877 416,439,111 427,765,030 439,354,001 450,337,781 460,864,376 471,835,913 482,984,601 494,265,394 485,650,185Forest Department Revenue 47,172,509 48,618,237 50,112,325 51,651,517 53,233,023 54,854,207 56,513,514 58,210,371 59,947,239 61,739,245
2015 2016 2017 2018 2019 2020 2021 2022 2023Business as Usual Sub-total, w/out fuelwood 221,476,233 74,303,304 72,642,973 73,046,480 73,500,692 73,997,962 74,472,798 74,913,828 75,308,880
Total, with fuelwood 732,110,393 74,303,304 72,642,973 73,046,480 73,500,692 73,997,962 74,472,798 74,913,828 75,308,880 Forest Department Revenue 8,742,378 4,436,431 4,436,431 4,436,431 4,436,431 4,436,431 4,436,431 4,436,431 4,436,431
Scenario 2
Sub-total, w/out fuelwood 225,157,682 226,862,877 158,006,276 78,740,228 76,960,358 78,214,023 79,597,672 81,115,078 82,770,721
Total, with fuelwood 706,143,468 729,148,016 682,468,101 78,740,228 76,960,358 78,214,023 79,597,672 81,115,078 82,770,721 Forest Department Revenue 9,198,299 9,255,187 5,389,929 5,450,282 4,978,879 5,026,900 5,076,361 5,127,307 5,179,781
Scenario 3
Sub-total, w/out fuelwood 163,780,816 165,951,455 167,902,534 170,462,940 172,982,316 175,779,049 178,781,504 181,994,891 185,355,665
Total, with fuelwood 510,900,243 523,969,115 537,820,486 552,146,352 567,221,839 582,982,230 599,398,866 616,361,595 510,900,243 Forest Department Revenue 63,598,734 65,525,549 67,522,674 69,596,850 71,768,150 74,053,405 76,455,553 78,976,815 81,618,689
Scenario 4
Sub-total, w/out fuelwood 189,666,885 193,304,154 196,638,286 196,035,317 199,550,502 203,214,773 206,983,568 210,860,634 211,200,744
Total, with fuelwood 594,704,680 611,499,920 628,478,320 642,076,936 660,577,725 680,103,632 700,535,228 721,886,053 740,515,780 Forest Department Revenue 63,598,734 65,525,549 67,522,674 69,596,850 71,768,150 74,053,405 76,455,553 78,976,815 81,618,689
Joy Hecht
Table 7. Net Present Values Under Two Discount Rates
Scenario:
Improved Forest
Management
Improved Forest
Department Plantations BAU 2 3 4 Discount Rate: 10% Community Revenue Without Fuelwood 1,610,147,784 1,716,481,939 1,430,183,570 1,500,595,215 Community Revenue With Fuelwood 4,216,379,960 4,532,035,868 3,947,853,392 4,023,959,384 Forest Department Revenue 65,077,778 68,937,395 482,421,707 482,421,707 Community and FD Revenue 4,281,457,738 4,600,973,263 4,430,275,099 4,430,275,099 Discount Rate: 27% Community Revenue Without Fuelwood 802,104,246 826,011,023 619,502,580 630,060,947 Community Revenue With Fuelwood 2,105,366,972 2,143,811,627 1,622,300,668 1,633,815,775 Forest Department Revenue 31,053,592 31,886,963 193,271,327 193,271,327 Community and FD Revenue 2,136,420,563 2,175,698,589 1,815,571,996 1,827,087,102
Although we can speculate about other energy sources, and some studies (e.g. Konstant 2000) shed some non-quantitative light on the question, we are not including that in our calculations, nor would we have enough information to do so had that been our aim. An analysis of the economic well-being of the surrounding communities would have to consider whether alternative energy sources are free or must be bought; if they are not paid for in cash, the analysis would have to factor in the labor required to collect or grow them. When fuelwood runs out on the mountain, all energy will have to come from other sources, which are likely to be more expensive than gathering wood from the mountain. Indeed, assuming that local citizens are rational decision-makers, the alternate energy sources must be more expensive (or inferior); otherwise households would use them instead of wood from the mountain.
Joy Hecht - Valuation of Mulanje Mountain COMPASS / MMCT, April 2006 24
5. Recommendations: Where do we go from here? This study has provided an interesting framework for analyzing the use and value of resources from the Mulanje forest reserve, and has generated provocative, if imprecise, results. Several next steps may be useful for those who wish to apply and build on this work. Confirm these results with better data on household resource use in Mulanje We have made major assumptions about the use of fuelwood and other resources from the protected area. If any decisions are to be considered based on this work, it is essential to collect reliable primary data with which to confirm or contradict our assumptions. Such a data collection effort need not be a huge project, but it does need to be designed with considerable attention to issues of which data are needed, and how and where to collect them. In general, we want to know how much households use of each of the available sources of energy, where they get each source, and what they use it for. Everyone uses energy for cooking and in some seasons heating; some households may also use it for activities such as fish smoking, beer-making, or other economic activities. For each energy source (e.g. fuelwood, charcoal, paraffin, crop residues, electricity, etc.) we would like to know whether they purchase, collect, or cultivate it; where they get it; how much they pay; or how much time they spend collecting or cultivating. For wood, we would like to know how much of each species they use. As we think about data collection, we must consider how broadly we want to cast the net on the information sought. Since this study considers NTFPs as well as fuelwood, it will certainly make sense also to ask questions about poles, thatch, fruits, mushrooms, medicinal plants, and other possible forest products while we are doing survey work. It is also useful to consider whether we want to expand our survey design to capture information of use for other related studies. For those interested in gender issues, for example, knowing who collects and uses each product, particularly differentiated by gender, will be interesting. For those interested in the impacts of HIV/AIDS, identifying differences based on household composition or (if it is possible to find out) the presence of people with the disease, may also be important. While these issues are beyond the scope of the present study, it is possible that the marginal cost of asking additional questions will be very low, whereas the resulting database might have much greater value to a broad group of analysts if they were included. We would not want to take on all the data collection needs of other researchers, of course; however if modest additions to our survey are of great value to others, it is important to consider whether they are possible. A number of different strategies may be adopted for gathering this information, as evidenced by the work of others who have surveyed fuel use in Malawi (e.g. Brouwer et al 1997, Abbot and Homewood 1999, Chikoko 2002, Fisher 2002, Konstant 2000, personal communication with Killy Sichinga). Among the data collection strategies, we may identify: Select a sample of households and measure energy sources and use within each home.
Weigh and measure all wood coming into the household when it arrives. Each day at the same time of day measure the size of the household wood pile to determine how much has been used. Identify the species of wood and ask household members where it came from and how much time they spent collecting it. Survey household members about any other energy sources and about energy purchases. Spend a week (or thereabouts) in each household to obtain a reasonable sample of its energy use. This is time-consuming, which would limit the number of households that can be surveyed; however the information should be quite reliable.
Joy Hecht - Valuation of Mulanje Mountain COMPASS / MMCT, April 2006 25
Travel with women when they collect wood, to determine exactly where and how far they go, which species they collect, how much time they spend collecting wood. Weigh and measure their headloads. This might be combined with the first strategy, so the women accompanied are those from the households in which the data collectors are based.
Position the data collectors on trails or roads and intercept people carrying wood. Ask them
where they wood came from, whether they paid a headload fee, and where they are going with it. Measure and weigh the wood, identify species. This may be more difficult than the previous strategy for obtaining data on wood actually collected, as people intercepted on the trail may be suspicious of the data collectors. On the other hand, it could be a more efficient way to collect information than forming ties to individual households to observe their fuel use patterns. Information collected on the trails would not tell us about uses of other energy sources, however, so it would have to be supplemented with household surveys or observation.
Survey households to collect the desired data, but do not actually observe their practices to
verify what they report. This is much simpler and quicker than the previous strategies, but the information gathered will be less reliable.
In choosing among these options and identifying additional ones, it may be useful to contact some of the researchers who have done similar work, to talk about the choice of data collection strategy and determine which is most effective for different information needs. The design of a data collection system will also have to consider where to collect the information. We know that there is significant variation in resources around the mountain, and we will need to ensure that we have a representative sample. The Konstant (2000) study distinguishes among some of the regions around the mountain; her classifications should provide at least a point of departure for identifying different use patterns for our data collection work. The more care we take to distinguish among regional patterns, the more accurate our data will be; however there is a tradeoff between this kind of precision and the time required to collect the data. Once we have identified regions for data collection, we will face the challenge of choosing villages and households within villages. One of the issues of interest is how far people really walk to take resources from the protected area, so we would like our sample within each region to capture villages at a range of distances. Again, there will be a tradeoff between data accuracy and time required for data collection. It may be better to survey only a few households in each village, so that the villages surveyed can have great spatial dispersion; however this will require building a base of trust in more communities, and will therefore take more time. There will also be seasonal variation in the use of resources from the mountain. This may provide more challenges than some of the other issues, because it may not be appropriate for this data collection to extend over a full year. The tradeoffs between obtaining the information quickly and understanding seasonal variation must be considered in designing the study, as well. Practical considerations arise in how such survey work can be carried out. At present neither MMCT nor COMPASS has funding to collect this information. MMCT has conducted some survey work in the Mkhumba region; however the data collected will not be useful for our purposes because of the way in which the questions were asked. COMPASS has resources to collect data in TA Laston-Njema, and MMCT will be carrying out that work. Those resources could be used to build one small part of the database in which we are interested. If that is to be done, however, the data collection work must be designed with the whole study in mind, to ensure that the piece collected with the available funds will end up being compatible with what
Joy Hecht - Valuation of Mulanje Mountain COMPASS / MMCT, April 2006 26
we hope might be collected later with other resources in other parts of the region. This is not as easy as it sounds. When an individual project collects data, it can be hard to convince them to think beyond their own immediate needs and constraints in the design of the data collection effort; indeed, we were unable to do so with the MMCT survey work in Mkhumba. The same problem is sure to arise with the Laston-Njema survey work. If this survey work is done, it is essential that the resulting database be easily available to anyone interested in using it, as long as confidentiality of individual respondents is protected. Availability of statistical data is a major constraint on policy analysis in Malawi. Investments in data collection are largely wasted if the data area not made available to all who wish to use them. Too often, they are hoarded by those who collect them, and only completed analyses are made public. Other primary data collection In addition to surveying households about their resource use, we are interested in obtaining information about several other topics. Charcoal is one of these. To understand how the forests are likely to evolve, we need better information about how much charcoal is now being taken out of the forest, and how this is changing with the new road from Mulanje to Blantyre, and how it may change with the planned road from Zomba to Phalombe. In other parts of the country urban demand for wood and charcoal has depleted natural forests with unexpected rapidity. We have not anticipated such depletion in our study, but it is a possibility that should be investigated. We have also flagged several NTFPs about which we have no data; hunting, medicinal plants, mushrooms, fruits, and livestock grazing. Without any data, we have no way to estimate which of these may have the greatest economic value. However we do know that medicinal plants from Malawi are sold throughout southern Africa, suggesting that this may be an area worth investigating further. We also know that there is very little wildlife to hunt on Mulanje, but the fires set by hunters cause consider environmental damage. This may, therefore, also be an area that warrants further investigation. Energy Options Analysis One of the major conclusions of this study is that sustainable use of the forest will depend on the strategies to reduce demand for fuelwood and encourage use of other sources of energy. To follow up on that observation, we must understand more about the energy options available to people in the Mulanje area, their costs, and the economic, social, and cultural factors influencing energy choices by the local population. These issues have certainly been studied by other organizations, projects and analysts, so we should not reinvent the wheel in investigating them for the Mulanje area. Learning more about the options, and perhaps tailoring the findings to the region of interest to us, will be essential in following up on this work. Part of the analysis of energy options will involve assessing how Mulanje households would respond to fuelwood scarcity. Their strategies may involve reducing energy use altogether, changing their diets to foods requiring less cooking, or burning crop residues or other waste. They may change the way in which they manage community forests, relying on them for their own energy rather than as an asset to be sold in case of sudden need for cash. If people are forced to buy energy sources, this may affect the choices they make between fuelwood, charcoal, and other fuels. Growth in demand for marketed fuelwood may lead to increased imports from Mozambique or from relatively forest-rich regions of Malawi. It could also lead to interest in exploiting Malawian coal as a source of household energy.
Joy Hecht - Valuation of Mulanje Mountain COMPASS / MMCT, April 2006 27

There is interest in developing small-scale hydropower plants on Mulanje, and rural electrification or solar power might become options in the region. Any of these strategies would require analysis of the household costs involved in shifting to electricity as a source of energy, since this would require considerable outlay for electric cookers. These factors must also be factored into the analysis of energy options in the region as well. Student work One of the reasons for carrying out this study has been to broaden Malawian understanding of the utility of economic approaches to environmental issues. For that reason, this work has been presented to students at Chancellor College, the Malawi College of Forestry, and Bunda College of Agriculture, and we have met with faculty from Mzuzu University although we were not able to travel that far to meet with their students. Some of the topics raised in this study lend themselves well to master’s theses or PhD dissertations; indeed, much of the primary data collection on Malawian forestry has been done in the context of PhD dissertations (e.g. Fisher 2000, Chikoko 2002, Orr 2000). MMCT interns may also be well equipped to undertake some of this research. Students and interns are of course a mixed bag from the employers’ perspective. They can be a source of free labor, but they require much more supervision than professional staff. Moreover, for students in particular the work has to lead to a meaningful thesis topic; they cannot be simply treated as data collectors. If appropriate supervision is available and their topics can be defined clearly, however, engaging students in some of the data collection and research coming out of this study may be a beneficial strategy both for the students and for MMCT and COMPASS. Several topics may be particularly suited to student work: Data collection and analysis of fuelwood use, as described above. A year-long survey of
wood collection and use could provide the basis for a dissertation that would actually be of use to others beyond the student.
Analysis of the economics of charcoal manufacture on the mountain and the distribution
network once it leaves the region. Since charcoal manufacture is not legal without a permit, obtaining data may be difficult; however it is a topic worth considering.
Value chain analysis for medicinal plants from Malawi, not necessarily limited to those from
Mulanje. This would take the researcher beyond Malawi, since one of the main purposes would be to understand how much is being earned outside the country from Malawian medicinals.
Value chain analysis of crafts. Although not very important in our study, Mulanje crafts are
exported to other regions of the country and perhaps internationally. A value chain analysis in this are would provide the basis for building broader markets for these products and ensuring that the revenues flow back to the manufacturers.
Development of a better database on tourism visits and expenditures in the Mulanje area.
This may not furnish a solid research topic of interest to a student, but may be a useful task for one of the MMCT tourism interns to undertake. In particular, it involves collecting the data from the hut logbooks, as they apparently provide the most complete record of visitor nights on the mountain.
Determining how natural resource use responds to changes in both price and income.
These values would be useful inputs into the design of policy strategies for managing natural resources and increasing incomes in the region.
Joy Hecht - Valuation of Mulanje Mountain COMPASS / MMCT, April 2006 28
Detailed financial analysis of the energy options open to residents of Mulanje and Phalombe, in order to better understand how they would respond to changes in the availability of fuelwood from the protected area.
User Pay Approach to Natural Resources One of the questions underlying this study has been whether users of NTFPs might be willing or able to pay for their resource use, and the funds used to ensure sustainable management of the forest. Among the users, the tea estates seem most likely to have the funds. They also have the largest financial interest in guaranteeing their access to the resources since clonal tea cannot survive without irrigation. Whether this is a realistic scenario depends on two issues. First, would the tea estates be willing to pay for water, and if so how much? Second, and perhaps more importantly, how would the money be used and could the availability of funds actually ensure protection of the forested buffers around water intakes? This study has not provided enough information to answer this question. We did discuss it with the directors of Lujeri and Eastern Produce, neither of whom seemed to feel that forest degradation posed a serious threat to their estates. To the extent that it is a concern, they are focused on technical solutions to ensure their own access to water, such as the construction of reservoirs or restricting access to the forests immediately upstream from their estates. They are aware that for all intents and purposes they do not pay for water. However, because they have constructed their own water intakes and pipes, and water fees generally pay for water distribution rather than the water itself, they would certainly argue that they should not be paying for the water itself because no one else is required to do that. On the other hand, if they felt that forest degradation threatened their irrigation water supplies in ways beyond their own control, and if some sort of community fund could prevent that threat, they might be willing to contribute to it if they could be guaranteed that it would reduce the risk. We were, of course, unable to access financial information with which to estimate their ability to pay for water protection, since such data are confidential. If they were willing to contribute, the resources would probably go to strategies to reduce demand for wood rather than to ensure sustainable forest management, since sustainable management will not be able to meet all the needs of the community. On the other hand, the tea estates will not be concerned about source water protection in areas away from their lands, so their contribution to such a fund is not likely to address the problem elsewhere in the region of the mountain. This issue may bear further investigation, but it does not seem likely to be a significant source of funds with which to undertake activities to reduce pressure on the mountain. Applying the approach elsewhere The response to this work so far suggests that it has been interesting and provocative. An appropriate next step may be to take a similar approach to considering resources elsewhere the country. The watersheds of Lake Chilwa and Lake Malawi are good candidates for similar analysis, as are other protected areas subject to over-exploitation. By making the full details of this study public, we hope that it will serve as an example to others interested in undertaking the same kind of analysis, with USAID support or through other venues. Future analyses of this type may benefit from our work in several ways. First, of course, we have made useful headway in collecting studies that provide data for valuation of Malawian natural resources; this will save time for future researchers. Second, by modifying our spreadsheets rather than building their own from scratch, other researchers may save time and effort in constructing their analysis frameworks.
Joy Hecht - Valuation of Mulanje Mountain COMPASS / MMCT, April 2006 29
Future work may also want to change our approach in certain ways. We have focused on the value of the mountain itself, not on the economic well-being of the community of which the mountain is a part. This might be handled differently in future work. For example, we have approached the projections in terms of how much fuelwood and NTFPs would be from the protected area under the four scenarios. Instead, we could have looked at broader energy and resource consumption patterns in the surrounding community to see how they would change under different protected area management strategies. This would engage us in considering the broader economic structure of the region in relation to the protected area, rather than focusing narrowly on the use of resources only from the forest preserve itself. Future studies in at least some parts of the country may be able to use our results to plan for primary data collection in the initial phases of their work, as well. One reason why we did not collect primary data was that we did not know at the start of our effort which resources would be most valuable, and therefore in what areas data collection would be cost-effective. With hindsight, domestic fuelwood use clearly poses the greatest need for better data. Other researchers in communities dominated by forests (rather than, say, Lake Malawi), may use our experience to plan for such data collection from the start. Conclusion However future work is done, we do hope that this study will lead to a broader use of economic approaches to understanding use of non-marketed natural resources in Malawi. We also hope that future work will build on what we have done insofar as possible, treating it not as a stand-alone study but as a building block to be used by others working in the same arena.
Joy Hecht - Valuation of Mulanje Mountain COMPASS / MMCT, April 2006 30
References6
Abbot, Joanne I. O and Katherine Homewood, 1999. “A History of Change: Causes of Miombo Woodland Decline in a Protected Area in Malawi.” The Journal of Applied Ecology, Vol. 36, No. 3, pp. 422-433. Abbot-Homewood-Miombo-Decline-1999.pdf Abbot, Joanne I. O. and Ruth Mace, 1999. “Managing Protected Woodlands: Fuelwood Collection and Law Enforcement in Lake Malawi National Park.” Conservation Biology, Vol. 13, No. 2, pp. 418-421. Abbott-Mace-ManagingProtectedWoodlands.1999.pdf Abbot, Patrick G. and Jimmy D. Lowore, 1999. “Characteristics and management potential of some indigenous firewood species in Malawi.” Forest Ecology and Management, Vol. 119, pp. 111-121. Abbot-Lowore-IndigenousFirewood.pdf Agar, Jason, 2002. “The Tea Sector in Malawi.” Produced by Kadale Consultants and Imani Development, Blantyre. Agar-MalawiTeaSectorReport-2002.pdf Arnold, Michael, Gunnar Köhlin, Reidar Persson, and Gillian Shepherd, 2003. Fuelwood Revisited: What Has Changed in the Last Decade? CIFOR Occasional Paper No. 39 (Bogor, Indonesia: Center for International Forestry Research, 2003) Arnold-et-al-CIFOR-FuelwoodRevisited-2003.pdf Bouvier, Ioana, January 2006. “Mount Mulanje Land Cover Time Series Analysis.” Short-term Technical Assistance Draft Report for COMPASS II. Bouvier-Ioana.Mulanje.LC.TimeSeries.2006.pdf Brouwer, Inge D., Jan C. Hoorweg, Marti J. van Liere, 1997 “When Households Run Out of Fuel: Responses of Rural Houses to Decreasing Fuelwood Availability, Ntcheu District, Malawi.” World Development, Vol. 25, No. 2, pp. 255-266. Brouwer-et-al-DecreasingFuelwood.pdf Chapola, Gabriel B. J. and Mzoma R. Ngulube, 1991. “Productivity and Wood Properties of Some Eucalypts at Kasungu Flue Cured Tobacco Authority, Malawi.” FRIM Report NO. 91008. Forestry Research Institute of Malawi, Zomba. Chapola-Ngulube-EucProductivity-1991.pdf Chilima, Clement, May 1989. “Cinara cupressi: A Pest of Mulanje Cedar and Cypress Trees in Malawi.” FRIM Report No. 89009. Forest Research Institute of Malawi. Chilima-Cedar-Pest-1989.pdf Chikoko, Mercy Gwazeni, 2002. A Comparative Analysis of Household Woodlots and Fuelwood SufficiencyBetween Female and Male Headed Households: A Pilot Study in Rural Malawi. PhD Dissertation, Oregon State University. Chikoko-dss-gender-fuelwood.pdf Chomitz, Ken and Kanta Kumari, May 1996. The Domestic Benefits of Tropical Forests: A Critical Review Emphasizing Hydrological Functions.” World Bank Policy Research Paper No. 1601. (Washington, D.C.: The World Bank, Policy Research Department, Environment, Infrastructure, and Agriculture Division) Chomitz-Kumari-Forest-Benefits-Review-1996.pdf Dewees, Peter, 1994. “Social and Economical Aspects of Miombo Woodland Management in Southern Africa: Options and Opportunities for Research” CIFOR Occasional Paper No. 2. (Bogor, Indonesia: Center for International Forestry Research) Dewees-miombo-mgmt.pdf Dewees, Peter, 1995. “Trees on Farms in Malawi: Private Investment, Public Policy, and Farmer Choice.” World Development, Vol. 23, No. 7, pp. 1085-l 102. 1995 Dewees-Trees-Farms.pdf
6 Note: File names after the references in this list refer to the names of the files stored on the CD through which the results of this project are being distributed. All of these papers may also be accessed on the web through www.joyhecht.net.
Joy Hecht - Valuation of Mulanje Mountain COMPASS / MMCT, April 2006 31
Edwards, Ian, November 1982a. “Regeneration of Miombo Woodlands and their Potential for the Production of Fuelwood.” FRIM Report No. 82036. Forestry Research Institute of Malawi, Zomba. Edwards-Miombo-1982a.pdf Edwards, Ian, November 1982b. “A Report on Mulanje Cedar (Widdringtonia nodiflora) Resources on Mulanje Mountain.” FRIM Report No. 82035. Forestry Research Institute of Malawi, Zomba. Edwards-Cedar-1982b.pdf Ferguson, Anne E. and Wapulumuka O. Mulwafu, 2005. “Irrigation reform in Malawi: exploring critical land-water intersections.” Presented at the International Workshop on African Water Laws: Plural Legislative Frameworks for Rural Water Management in Africa, 26-28 January, 2005, Johannesburg, South Africa. Ferguson-Mulwafa-IrrigationReform-2005.pdf Fisher, Monica, 2002. Explaining Forest Degradation in Malawi: Asset Poverty, Income Shocks, and Activity Choice. PhD Dissertation, Purdue University. Fisher-dss-ForestUse.pdf Fisher, Monica, 2004. “Household Welfare and Forest Dependence in Southern Malawi.” Environment and Development Economics, Vol. 9, No. 2, pp. 135-154. Fisher-HouseholdForestDependence Mulanje.pdf Fisher, Monica and Gerald Shively, 2005. “Can Income Programs Reduce Tropical Forest Pressure? Income Shocks and Forest Use in Malawi.” World Development, Vol. 33, No. 7, pp. 1115-128. Fisher-Shively-Income-TropicForestPressure.pdf Fisher, Monica, Gerald E. Shively, and Steven Buccola, “Activity Choice, Labor Allocation, and Forest Use in Malawi.” Unpublished paper, 2004-5 Fisher-et-al-Forests-ActivityChoice-Mulanje.pdf FORINDECO, March 2000. “Second Draft Report on Forest Productivity (Plantations and Mulanje Cedar)” Prepared for Mulanje Mountain Conservation Trust by FORINDECO, Flatdal, Norway. FORINDECO-Mulanje-Forest.pdf French, David “Confronting an Unsolvable Problem: Deforestation in Malawi.” World Development, Vol. 14, No. 4, pp. 531-540, 1986. French-Deforestation-Malawi.pdf Hill, J. L. and C. H. R. Kidd, August 1980. “Rainfall-Runoff Relationships for 47 Malawi Catchments.” Water Resources Branch, Department of Lands, Valuation and Water, Lilongwe. Hill-Kidd-RainfallRunoff-1980.pdf International Center for Living Aquatic Resources Management (ICLARM), 1991. The Context of Small-Scale Integrated Agriculture-Aquaculture Systems in Africa: A Case Study of Malawi. (ICLARM: Manila) ICLARM-Aquaculture-1991.pdf Kadale Consultants, 2005. “Honey Sub-sector Initial Report.” Prepared for COMPASS II. Kadale-honey-subsector-2005.pdf Kleemeier, Elizabeth, 2001. “The Role of Government in Maintaining Rural Water Supplies: Caveats from Malawi’s Gravity Schemes.” Public Administration and Development, Vol. 21, pp. 245-257. Kleemeier-gravity-fed-water.pdf Konstant, Tracey, February 2000. “Non-Timber Forest Products: Curent and potential value on Mulanje Mountain.” Final Report prepared for the DFID/MMCT Mulanje Massif Project. Konstant-NTFPs-Mulanje-2000.pdf Lawrence, M.J., A. Oshina, and C. Chinguwo, October 1994. “Mulanje Cedar (Widdringtonia cupressoides Endlicher) Inventory.” FRIM Report no. 94010. Forestry Research Institute of Malawi, Zomba. Lawrence-et-al-Cedar-1994.pdf
Joy Hecht - Valuation of Mulanje Mountain COMPASS / MMCT, April 2006 32
Limwado, G. M., 1995. “The Economics of Clonal Replanting on Tea Estates in Malawi.” In A.M. Whittle and F.R.B. Khumalo, eds., proceedings of the1st Regional Tea Research Seminar. Tea Research Foundation (Central Africa), 23-25 March 1995, Blantyre, Malawi. Limwado.Econ.ClonalTea.pdf Lowore, Janet, 2003. “Miombo Woodlands and Rural Livelihoods in Malawi.” Prepared for the Center for International Forestry, Harare, Zimbabwe. Lowore-Miombo-Livelihoods-2003.pdf Lowore, Jimmy D., 1999. “Coppice Regeneration in Some Miombo Woodlands of Malawi.” FRIM Report No. 99001. Forest Research Institute of Malawi. Lowore-Coppice-Regeneration-1999.pdf Lowore, Jimmy D. and Patrick G. Abbot, “Stackwood Volume Estimations for Miombo Woodlands in Malawi.” FRIM Report No. 93009. Forest Research Institute of Malawi. Lowore-Abbot-Volume-1993.pdf Makungwa, Stephen David, March 1997. “Charcoal Production Study in Blantyre Area” FRIM Report No. 97003. Forest Research Institute of Malawi, Zomba. Makungwa-charcoal-1997.pdf Makungwa, Stephen David (University of Malawi, Bunda College), October 2004 “Inventory Results of Mulanje Cedar Resources on Mulanje Mountain” Prepared for Mulanje Mountain Conservation Trust. Malawi Department of Fisheries, July 2005 “National Aquaculture Strategic Plan.” Produced by SSC System Science Consultants, Inc., for the Ministry of Mines, Natural Resources and Environment, Department of Fisheries with support from the Japan International Cooperation Agency. Not available digitally. Marshall, Nina T., David Mulolani, and Louisa Sangalakula, June 2000. “A Preliminary Assessment of Malawi’s Woodcarving Industry.” TRAFFIC East/Southern Africa Report, c/0 WWF SARPO, Harare. Prepared with USAID support through the IUCN Regional Office for Southern Africa, Harare. Marshall-et-al-Woodcarving-2000.pdf Met-chem Canada, Inc. 1994. “Feasibility Study for Mulanje Mountain Bauxite in Malawi. Volume V, Environmental Impact Assessment.” Montreal, Quebec. Not available in digital format; copy available in the MMCT library. Mkanda, Francis Xavier, 2001. Farmers’ Survival Strategies and Soil Erosion in the Lake Malawi/Niassa/Nyasa Basin – in the Context of Biodiversity Conservation in the Lake; the Case of Linthipe River Catchment. PhD Dissertation, Department of Geography, University of Manitoba, Winnipeg, Canada. Mkanda-dss-Survival-SoilErosion-lakeBiodiv.pdf Mulwafu, W., G. Chavula, C. Chipeta, A. Ferguson, G. Chilima, B. Nkhoma, May 2002. “The Status of Water Demand Management in Malawi and Strategies for Promoting It” BASIS Water Resources Research Team, University of Malawi, Chancellor College. Mulwafu&al-WaterDemMgmt-2002.pdf Orr, Barron Joseph, 2000. More Users and More Uses: Choosing Between Land and Forest in Malawi’s Protected Areas. PhD Dissertation, University of Arizona Orr-ProtectedAreas-Dss-2000.pdf Pelham, A. P. K., 1996. “Non-timber products as miombo resources: a Malawi case study with special reference to bark fibre.” Referenced in Lowore 2003. "Renewable Energy for Development", July 1997, Vol. 10, No. 2 Issue devoted to wood fuel issues in Africa and elsewhere in the developing world. RenewalEnergyDevt-July1997-AfricaWood.pdf Sakai, Isao, May 1989a. “A Report on the Mulanje Cedar Resources and the Present Crisis.” Forestry Research Record No. 65. Forestry Research Institute of Malawi, Zomba. Sakai-Deforestation-Mulanje-May89a.pdf Sakai, Isao, May 1989b. “A Report on the Deforestation of Non-Cedar Forest on Outer Slopes of Mulanje Mountain.” FRIM Report No. 89005. Forestry Research Institute of Malawi, Zomba. Sakai-Cedar-Crisis-May89b.pdf
Joy Hecht - Valuation of Mulanje Mountain COMPASS / MMCT, April 2006 33
Sakai, Isao, June 1989. “Preliminary Study on the Growth of Natural Mulanje Cedar on Mulanje Mountaon.” FRIM Report No. 89008. Forestry Research Institute of Malawi, Zomba. Sakai-Cedar-Growth-June89.pdf Simons, G., 1997. “Community-Based Natural Resources Management in Mwanza East: A Study on Utilization and Marketing of Non-Timber Forest Products (NTFPs).” Volume II. Referenced in Lowore 2003. Sosola-Banda, Bruce G. and F. H. Johnsen, 2005. “Rural livelihoods on bamboo handicraft making and culm vending in Mvera, Malawi.” Journal of Bamboo and Rattan. Vol. 4, No. 1, pp. 93-105. Sosola-Banda-rattan-2005.pdf R. J. G. Steele, J. L Bosworth, S. J. Gossage, and C. Mataya, June 1997. “The Tea Plantations of Malawi: The Report of the Tea Estate Surveys 1996 and 1997.” Malawi Estate Land Utilisation Study. Steele-et-al-TeaSurvey.pdf UNDP/World Bank Energy Sector Management Assistance Program (ESMAP), June 2001. “ Sustainable Woodfuel Supplies from the Dry Tropical Woodlands.” WB-ESMAP-Fuelwood-supply.pdf Warren, Amy, Jaakko Kosonen, Mangani Katundu, and Bridget Matinga, 2001. “Causes and Consequences of Anthropogenic Fire in Mulanje Mountain Forest Reserve, Southern Malawi: Report Following ‘Mulanje Fire Research’ Expedition, 2001” Submitted in partial fulfilment for the degree of MSc Environmental Anthropology, University of Kent at Canterbury. Warren-et-al-MulanjeFires-2001.pdf World Bank/UNDP/Bilateral Aid Energy Sector Management Assistance Program, March 1989. “Uganda: Energy Efficiency Improvement in the Brick and Tile Industry” Brick-mfg-Uganda.pdf
Zingano, Bernard, 2005. “The Problem of Fuel Wood Energy Demand in Malawi with Reference to the Construction Industry.” Zingano-fuelwood-bricks-2005.pdf
Joy Hecht - Valuation of Mulanje Mountain COMPASS / MMCT, April 2006 34
Individuals Consulted MMCT Staff: Julian Bayliss Director, Mt. Mulanje Biodiversity Survey and Ecological Monitoring Project
09-469-711 Carl Bruessow Executive Director, Mulanje Mountain Conservation Trust 09-035-920 Moffat Kayembe Program Officer, Mulanje Mountain Conservation Trust 08-891-426 Hastings Moloya Public Education Specialist David Nangoma Ecological Monitoring Specialist COMPASS II Staff and Consultants: Todd Johnson Chief of Party John Pratt Enterprise Development Specialist Killy Sichinga Monitoring and Evaluation Specialist John Wilson Consultant in Fisheries Development and Management of Natural Resources Mulanje and Phalombe: Glynnis Chapota General Manager, Smallholder Tea Company 01 466 257 / 01 466 244 / 09 950
462 Major M. R. Gundaphiri Chairman, Smallholder Tea Growers Trust Mr. R. H. Kabambe Member, Smallholder Tea Growers Trust Evans Jiya Kaboto SRWB Rural Water Supply, Mulanje Mr. S. Kholowa Member, Smallholder Tea Growers Trust 08-504-644 Mr. F. D. Kalonga Head of Finance, Smallholder Tea Company 09-950-469 Mr. Kalonga Urban water, SRWB, Mulanje John Makina Programme Cooordinator, Shire Highlands Sustainable Livelihood Programme,
Mulanje 08-835-036 Mr. Manyamba District Forest Officer, Phalombe 08-356-884 Justin Mbetwea Forest Co-management, Phalombe, WESM Jim Melrose Managing Director, Lujeri Tea Estates 09-962-062 Christoph Messinger GTZ Food security project, 08 860 937 Wellings Mwalabu Blantyre Synod Projects Office, Phalombe 08-302-530 Herbert Mwarukomo Forest Co-management, Phalombe, WESM 08-850-590 Nathaniel Nthala Forestry District Director, Mulanje 09-288-657 Richard Tilley Managing Director, Eastern Produce Malawi Limited 09 962 600 Mr. Salwi SRWB, Mulanje. Urban water. Blantyre/Thyolo/Zomba: Jason Agar Director, Kadale Consultants 08-823-669 Karen Edwards EU Sustainable Livelihoods Project, Blantyre Office Gary Holm Resource Team Leader, COMWASH, Thyolo 08-891-343 Daulos Maumbeta Executive Director, Wildlife and Environmental Society of Malawi 09-914-540 Edward Mbesa SRWB-Zomba 1 526 908 (?) DL, 1 525 311 [email protected] Nigel Mitchell Managing Director, Tea Brokers Central Africa 08-854-894 James Ndawala Assistant Commissioner of Statistics, NSO, Zomba 09-957-101 Bright Piyo Engineer, SRWB, Thyolo 09-362-554
Joy Hecht - Valuation of Mulanje Mountain COMPASS / MMCT, April 2006 35
Forestry Research Institute of Malawi: Tembo Chanyanga Forester Clement Chilima Deputy Directory Dennis Kayamazinthu Director Gerard Meke Forester Universities and Colleges: Sostan Chiotha Department of Biology, Chancellor College 09-358-870 Elizabeth Henry Department of Chemistry, Chancellor College, Chair, Masters in Environmental
Science Program 09-937-310 Patrick Kambewa Chancellor College, Economics Department 08 864 579 Victor Kasulo Mzuzu University Steve Makungwa Bunda College of Agriculture, University of Malawi Teddy Nakhumwa Bunda College of Agriculture, University of Malawi Eston Sambo Chancellor College (and chair of MMCT Board) 09-912-084 Trinitas Senganimalunje Principal, Malawi College of Forestry, Dedza 08 868 988, [email protected] Lilongwe area: Alex Banda Lilongwe – WESM consultant, Beekeeping Expert, 08 399 002 Keith Dolman Forest Privatisation Initiative 01-774-985 Christopher Guta Director General, Malawi Industrial Research and Technology Development
Centre Raphael P. Kabwaza Malawi Director of Environmental Affairs Mr. P. W. R. Kaluwa Chief Hydrologist, Head of Hydrology Section, Water Department, Lilongwe Matthews Manda Ministry of Agriculture, Land Resource Conservation Department Simon Mkwinda Land Management Training, Land Resources Department, Ministry of
Agriculture Stephen Nanthambwe Land Surveys and Evaluation, Land Resources Department, Ministry of
Agriculture John Ngalande Deputy Director of Forestry, Lilongwe Autman Tembo USAID Mark Visocky USAID
Joy Hecht - Valuation of Mulanje Mountain COMPASS / MMCT, April 2006 36