uzarowskil-use of fwd, gpr and ip in combination on ... · use of fwd, gpr and ip in combination on...
TRANSCRIPT

Use of FWD, GPR and IP in combination on complex pavement projects – including case studies
Ludomir Uzarowski, Senior Pavement and Materials Engineer, Golder Associates Ltd. Vimy Henderson, Pavement and Materials Engineer, Golder Associates Ltd.
Rabiah Rizvi, Pavement and Materials Engineer, Golder Associates Ltd. Karim Mohammad, City of Calgary Venkat Lakkavalli, City of Calgary
Paper prepared for presentation at the Innovations in Pavement Management, Engineering and Technologies Session
of the 2016 Conference of the Transportation Association of Canada
Toronto, ON
2
ABSTRACT
The pavement structure may include variable materials (type, thickness and condition). Conventional borehole investigation and pavement inspection may not be enough for more complex cases.
The FWD/GPR/IP data combined with the results of borehole investigation, laboratory testing and pavement inspection provides powerful information about the existing pavement. It allows to explain the behaviour of the pavement and then to determine the necessary design. Often the pavement structures are placed on variable soils that undergo seasonal variation in moisture conditions. The evaluation of pavement condition and designing the most effective and at the same time reliable pavement rehabilitation can be a challenge. The conventional borehole investigation and pavement conditions visual inspection provide very important information but this may not be enough for more complex cases, particularly for pavement carrying heavy, variable traffic.
Falling Weight Deflectometer (FWD), Ground Penetrating Radar (GPR) and pavement profilers have been used in pavement engineering for some time. This paper will describe the use of FWD, GPR and inertial or other types of profilers in combination on complex pavement projects. On some projects Grip Tester was also added to measure the frictional characteristics of the pavement.
The authors of this paper have been doing pavement condition investigation and rehabilitation for years and on large number of projects and have concluded that on complex projects combing the data from all three devices and conventional investigation is critical to put the puzzle together. It allows to explain the behaviour of the pavement and then to design the optimum solution. This paper includes real life examples of the investigations on municipal and airport projects.

3
1.0 INTRODUCTION
Often pavement structures are placed on variable soils that undergo seasonal variation in moisture conditions. The pavement structure itself may include variable materials in terms of type, thickness and condition. The evaluation of pavement condition, and designing the most effective and at the same time reliable pavement rehabilitation can be a challenge. The conventional borehole investigations and pavement visual condition inspections provide very important information; however, this may not be enough for more complex cases, particularly for pavement carrying heavy and variable traffic.
Falling Weight Deflectometer (FWD), Ground Penetrating Radar (GPR) and pavement profilers have been used in pavement engineering for some time. On some complex projects complementing the FWD and GPR data with the data from inertial or other profilers (IP) has worked very well. In some cases a Grip Tester was also added to measure the frictional characteristics of the pavement.
The application of FWD and GPR was described by the authors in previous Transportation Association of Canada (TAC) conference proceedings. The FWD is used to determine the structural capacity of the overall pavement structure and individual pavement layers, including subgrade soils. The GPR results, calibrated against cores and boreholes, provides an excellent continuous picture of the layer type and thickness. IP provides the surface profile of the pavement and allows the determination of International Roughness Index (IRI) for the pavement, or allows determination of the locations of surface irregularities. This data combined with the results of conventional borehole investigation, laboratory testing and pavement visual condition inspection provides powerful information about the existing pavement structure. This is then used, together with the traffic loading information, to identify and design the most cost effective and feasible pavement rehabilitation design.
2.0 FALLING WEIGHT DEFLECTOMETER (FWD)
Pavement surface deflections provide valuable information on the structural condition of pavement systems. As would be expected, stronger pavements, with thick layers of high quality materials,deflect less under a load pulse, as comp than weaker pavements with thin or deteriorated layers. The FWD is a nondestructive testing device, shown in Figure 1, that is the most widely accepted for structural evaluation of pavements based on their deflection responses. The FWD is used for collecting pavement surface deflection data and providing information for mechanistic empirical pavement design, and determining material properties. Layer stiffness and subgrade resilience can be backcalculated using the magnitude and shape of the FWD deflection basin. Deflection testing of existing pavements using the FWD is described in greater detail in reference [1]. In the last 20 years, the FWD has become an essential tool for the evaluation of the structural capacity and integrity of existing, rehabilitated and newly constructed pavements [2].
The FWD applies a range of dynamic loads to a pavement surface, simulating the effect of a loaded wheel tire and electronically recording the deflection profile [4]. Although pavement deflections are sometimes used to determine the structural condition of the pavement (in a way similar to the Benkelman beam), the FWD load/deflection data is typically used in backcalculation analysis to determine the strength of the individual pavement layers. This allows the pavement engineer to evaluate the pavement structure in the same manner that other engineering structures are evaluated by using mechanistic-empirical design methods. In this approach, it is also possible
4
to determine the remaining service life of the pavement structure and design the rehabilitation treatments necessary.
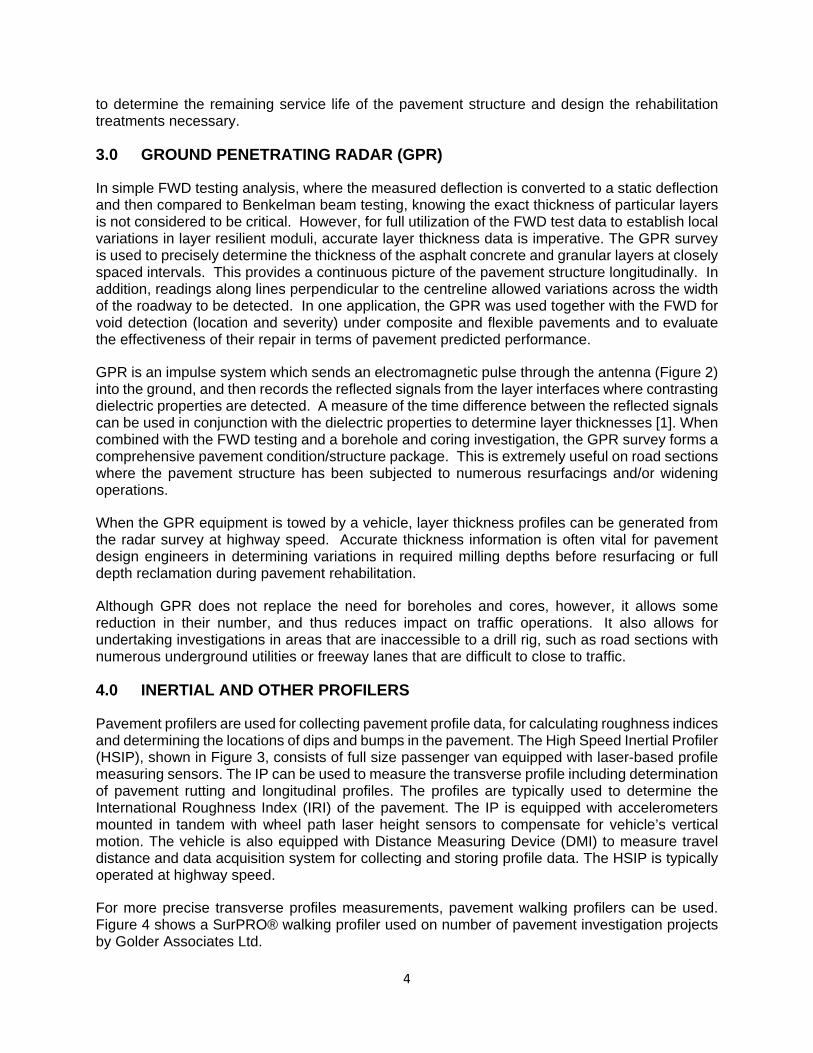
3.0 GROUND PENETRATING RADAR (GPR)
In simple FWD testing analysis, where the measured deflection is converted to a static deflection and then compared to Benkelman beam testing, knowing the exact thickness of particular layers is not considered to be critical. However, for full utilization of the FWD test data to establish local variations in layer resilient moduli, accurate layer thickness data is imperative. The GPR survey is used to precisely determine the thickness of the asphalt concrete and granular layers at closely spaced intervals. This provides a continuous picture of the pavement structure longitudinally. In addition, readings along lines perpendicular to the centreline allowed variations across the width of the roadway to be detected. In one application, the GPR was used together with the FWD for void detection (location and severity) under composite and flexible pavements and to evaluate the effectiveness of their repair in terms of pavement predicted performance.
GPR is an impulse system which sends an electromagnetic pulse through the antenna (Figure 2) into the ground, and then records the reflected signals from the layer interfaces where contrasting dielectric properties are detected. A measure of the time difference between the reflected signals can be used in conjunction with the dielectric properties to determine layer thicknesses [1]. When combined with the FWD testing and a borehole and coring investigation, the GPR survey forms a comprehensive pavement condition/structure package. This is extremely useful on road sections where the pavement structure has been subjected to numerous resurfacings and/or widening operations.
When the GPR equipment is towed by a vehicle, layer thickness profiles can be generated from the radar survey at highway speed. Accurate thickness information is often vital for pavement design engineers in determining variations in required milling depths before resurfacing or full depth reclamation during pavement rehabilitation.
Although GPR does not replace the need for boreholes and cores, however, it allows some reduction in their number, and thus reduces impact on traffic operations. It also allows for undertaking investigations in areas that are inaccessible to a drill rig, such as road sections with numerous underground utilities or freeway lanes that are difficult to close to traffic.
4.0 INERTIAL AND OTHER PROFILERS
Pavement profilers are used for collecting pavement profile data, for calculating roughness indices and determining the locations of dips and bumps in the pavement. The High Speed Inertial Profiler (HSIP), shown in Figure 3, consists of full size passenger van equipped with laser-based profile measuring sensors. The IP can be used to measure the transverse profile including determination of pavement rutting and longitudinal profiles. The profiles are typically used to determine the International Roughness Index (IRI) of the pavement. The IP is equipped with accelerometers mounted in tandem with wheel path laser height sensors to compensate for vehicle’s vertical motion. The vehicle is also equipped with Distance Measuring Device (DMI) to measure travel distance and data acquisition system for collecting and storing profile data. The HSIP is typically operated at highway speed.
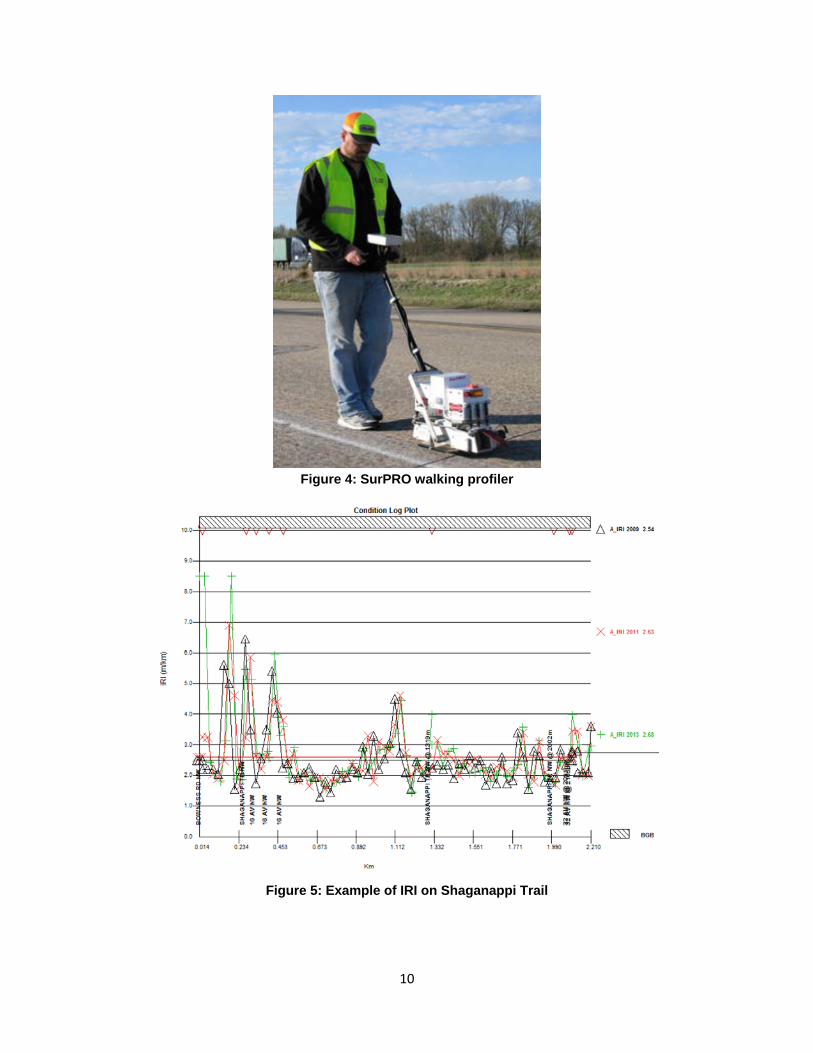
For more precise transverse profiles measurements, pavement walking profilers can be used. Figure 4 shows a SurPRO® walking profiler used on number of pavement investigation projects by Golder Associates Ltd.

5
5.0 USING FWD, GPR AND IP IN COMBINATION
Typical pavement project includes field investigation (borehole investigation and coring), laboratory testing and pavement visual condition inspection. On more complex pavement projects FWD testing, GPR survey and IP survey provides very valuable complementing information.
While FWD evaluates structural capacity of the entire pavement as well as individual layers and subgrade, the GPR provides a continuous picture of the existing pavement structure. It also allows more complex FWD layer analysis. The two combined allows pavement engineers to precisely locate potential pavement issues that should be addressed during the pavement rehabilitation design. The IP not only gives information about the roughness of the pavement, typically in terms of IRI, but it also allows precise determination of the location of the problem, often with the accuracy of meters.
The following section of this paper shows how the use of the combination of FWD, GPR and IP, or other profiles, allowed identification of the pavement issues and precisely locating them. Although there can be some additional cost and the amount of collected data may be overwhelming for inexperienced personnel, for an experienced pavement engineer this can be a critical source of information. The savings due to optimized designs and lowering initial capital cost of construction, as well as improved pavement performance, compensates for the somewhat higher cost of testing.
6.0 REAL LIFE EXAMPLES
The real life examples of the use of the combination of FWD, GPR and IP for pavement investigation is divided into two groups: street and highways; and airports.
6.1 Streets and Highways
6.1.1 Shaganappi Trail in the City of Calgary
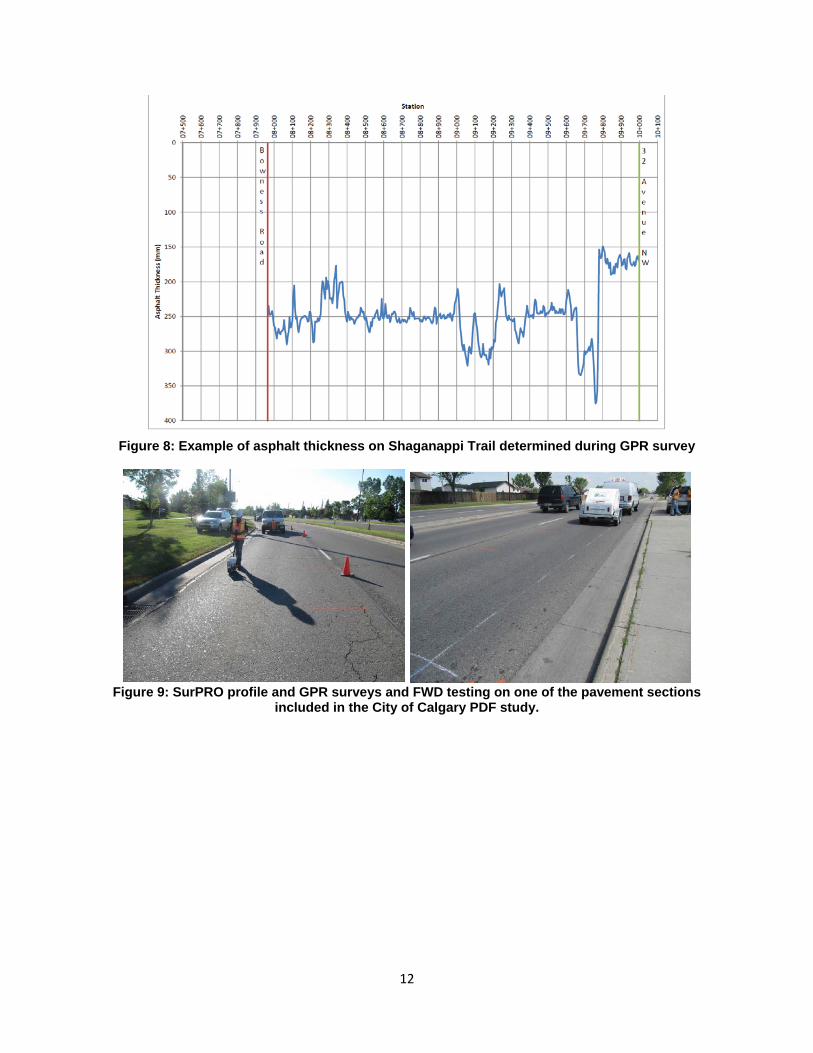
The project included the pavement rehabilitation of the asphalt pavement on Shaganappi Trail in the City of Calgary. The City provided the results of IRI survey from 2009 to 2013. An example of IRI on the investigated section of the street is shown in Figure 5. The pavement visual condition inspection indicated that the pavement exhibits severe distresses in terms of cracking (alligator and block cracking) and deformation, mainly rutting. The borehole investigation clearly indicated that the pavement structure was very variable in terms of pavement layers type and thickness. FWD testing and GPR survey were included in the pavement investigation. Figures 6 and 7 shows the examples of the measured deflections and determined pavement surface modulus. Figure 8 shows the thickness of the asphalt layers on this road section.
The information obtained from the geotechnical investigation and coring, laboratory testing, pavement visual condition inspection, FWD testing, GPR survey, and the IRI profiles was used to determine the most cost effective method of rehabilitating the pavement on the project road section. Due to the very busy urban environment the elevation could not be changed. Of numerous options considered, the most cost effective in terms of Life Cycle Cost was milling the existing pavement to the depth of 90 mm, repairing the weak areas identified during the structural testing and layer thickness survey, and placing 90 mm of the new asphalt. Precise location and type of repair was the key to this solution and proper pavement performance.
6
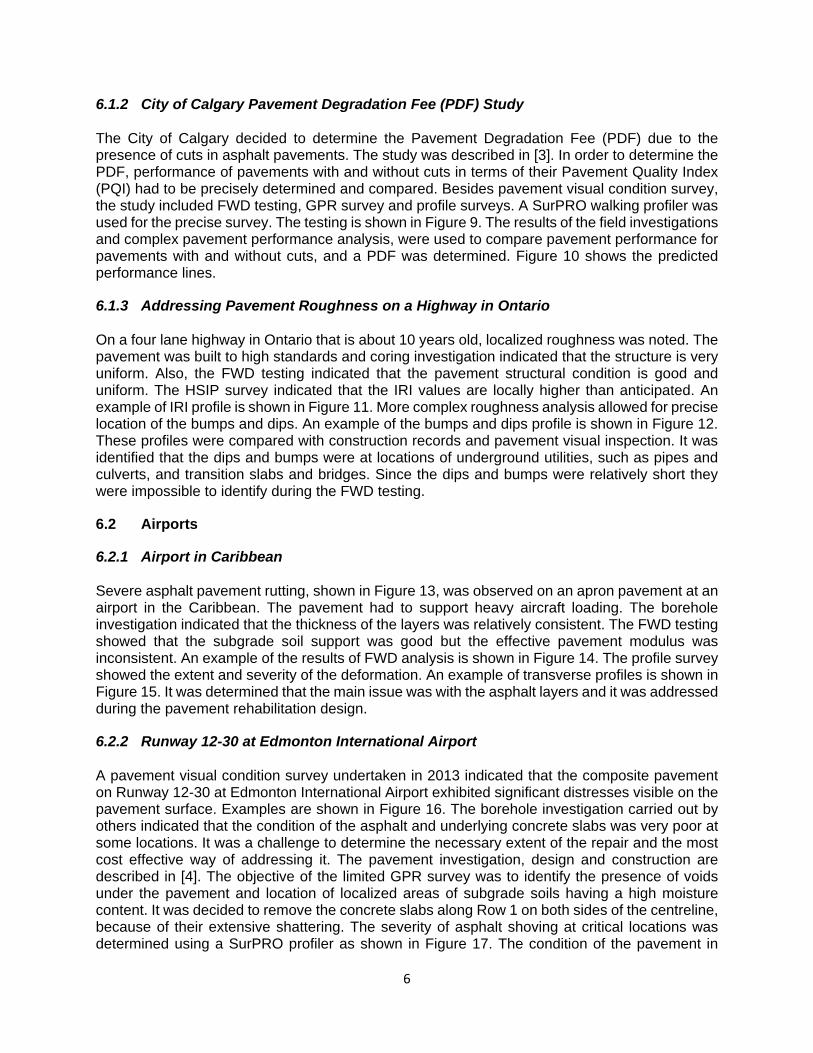
6.1.2 City of Calgary Pavement Degradation Fee (PDF) Study
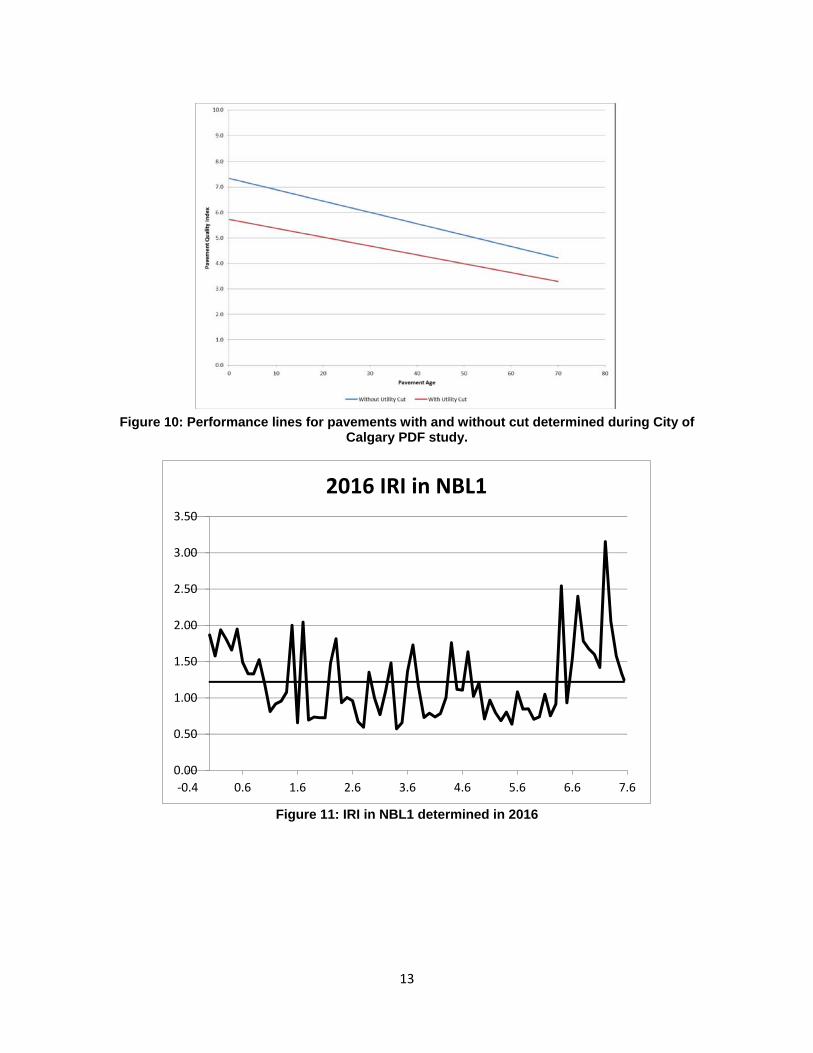
The City of Calgary decided to determine the Pavement Degradation Fee (PDF) due to the presence of cuts in asphalt pavements. The study was described in [3]. In order to determine the PDF, performance of pavements with and without cuts in terms of their Pavement Quality Index (PQI) had to be precisely determined and compared. Besides pavement visual condition survey, the study included FWD testing, GPR survey and profile surveys. A SurPRO walking profiler was used for the precise survey. The testing is shown in Figure 9. The results of the field investigations and complex pavement performance analysis, were used to compare pavement performance for pavements with and without cuts, and a PDF was determined. Figure 10 shows the predicted performance lines.
6.1.3 Addressing Pavement Roughness on a Highway in Ontario
On a four lane highway in Ontario that is about 10 years old, localized roughness was noted. The pavement was built to high standards and coring investigation indicated that the structure is very uniform. Also, the FWD testing indicated that the pavement structural condition is good and uniform. The HSIP survey indicated that the IRI values are locally higher than anticipated. An example of IRI profile is shown in Figure 11. More complex roughness analysis allowed for precise location of the bumps and dips. An example of the bumps and dips profile is shown in Figure 12. These profiles were compared with construction records and pavement visual inspection. It was identified that the dips and bumps were at locations of underground utilities, such as pipes and culverts, and transition slabs and bridges. Since the dips and bumps were relatively short they were impossible to identify during the FWD testing.
6.2 Airports
6.2.1 Airport in Caribbean
Severe asphalt pavement rutting, shown in Figure 13, was observed on an apron pavement at an airport in the Caribbean. The pavement had to support heavy aircraft loading. The borehole investigation indicated that the thickness of the layers was relatively consistent. The FWD testing showed that the subgrade soil support was good but the effective pavement modulus was inconsistent. An example of the results of FWD analysis is shown in Figure 14. The profile survey showed the extent and severity of the deformation. An example of transverse profiles is shown in Figure 15. It was determined that the main issue was with the asphalt layers and it was addressed during the pavement rehabilitation design.
6.2.2 Runway 12-30 at Edmonton International Airport
A pavement visual condition survey undertaken in 2013 indicated that the composite pavement on Runway 12-30 at Edmonton International Airport exhibited significant distresses visible on the pavement surface. Examples are shown in Figure 16. The borehole investigation carried out by others indicated that the condition of the asphalt and underlying concrete slabs was very poor at some locations. It was a challenge to determine the necessary extent of the repair and the most cost effective way of addressing it. The pavement investigation, design and construction are described in [4]. The objective of the limited GPR survey was to identify the presence of voids under the pavement and location of localized areas of subgrade soils having a high moisture content. It was decided to remove the concrete slabs along Row 1 on both sides of the centreline, because of their extensive shattering. The severity of asphalt shoving at critical locations was determined using a SurPRO profiler as shown in Figure 17. The condition of the pavement in

7
other rows was determined using the FWD; the FWD test allowed determination of the weak locations where the existing asphalt had to be removed. The exposed concrete slabs were inspected and Load Transfer Efficiency (LTE) across the cracks was determined using the FWD. An example of the results is shown in Figure 18. The slabs with a severe crack having LTE less that 50 were removed and replaced with the new ones. The slabs with a crack having LTE higher than 50 were stitched. This is shown in Figure 19. The project was completed successfully in 2013 and the performance of the pavement is excellent.
7.0 SUMMARY
The FWD, GPR and IP or other profilers have been used for a long period of time. They provide a lot of useful, often critical information for pavement designers. It is used to assess structural capacity of the pavement structure and its individual layers, its condition and locations of weak or failed areas that have to be addressed, but may not be easily identified during a visual condition inspection or borehole investigation.
Using FWD, GPR and IP in combination should be considered for more complex pavement projects. It complements the data obtained during conventional borehole and coring investigations, laboratory testing and pavement visual condition inspection. It allows for proper optimization of pavement rehabilitation designs and makes them more cost effective. It can lead to significant cost savings due to precise allocation of construction costs to address the identified pavement issues and improved long term pavement performance.
8
REFERENCES
1. Uzaorwski, L., , M. Maher, and A. Balasundaram, “Practical Application of GPR to Supplement Data from FWD for Quick Pavment Performance Prediction’, Trasnportation Association of Canada (TAC) confernce, Calgary 2005.
2. Transportation Association of Canada, “Pavement Asset Management and Design Guide”, December 2013.
3. Mohammad, K., R. Rizvi, V. Henderson, L. Uzarowski, and J. Chyc-Cies, “Effect of Utility Cuts
on Serviecability of Pavement Assets – A Case Study from the City of Calgary”, Transportation Association of Canada, 2014 Annual Conference Proceedings.
4. Uzarowski, L., R. Rizvi, D. Schuster, F. Salgado, and C. Bello, “Advanced Pavement
Technology Used for Rehabilitation of Runways at Edmonton International Airport”, Canadian Technical Asphalt Association, 2014 Annual Conference Proceedings.

9
FIGURES
Figure 1: Falling Weight Deflectometer
Figure 2: GPR two component system- the 500 MHz radar followed by the 1000 MHz radar
Figure 3: High speed inertial profiler
10
Figure 4: SurPRO walking profiler
Figure 5: Example of IRI on Shaganappi Trail

11
Figure 6: Pavement FWD deflections on Shaganappi Trail
Figure 7: Example of pavement surface modulus on Shaganappi Trail
12
Figure 8: Example of asphalt thickness on Shaganappi Trail determined during GPR survey
Figure 9: SurPRO profile and GPR surveys and FWD testing on one of the pavement sections
included in the City of Calgary PDF study.
13
Figure 10: Performance lines for pavements with and without cut determined during City of
Calgary PDF study.
Figure 11: IRI in NBL1 determined in 2016
0.00
0.50
1.00
1.50
2.00
2.50
3.00
3.50
‐0.4 0.6 1.6 2.6 3.6 4.6 5.6 6.6 7.6
2016 IRI in NBL1

14
Figure 12: Bumps in deeps in NBL1 determined in 2016
Figure 13: Severe apron asphalt pavement rutting
‐30
‐20
‐10
0
10
20
30
40
0+000 1+000 2+000 3+000 4+000 5+000 6+000 7+000
2016 BUMPS AND DEEPS NBL1

15
Figure 14: Example of subgrade resilient modulus and pavement effective modulus of apron
asphalt pavement determined from FWD testing
Figure 15: Examples of transverse profiles of apron asphalt pavement rutting

16
Figure 16: Severe asphalt shoving and cracking on Runway 12-30 at Edmonton International
Airport observed in 2013
Figure 17: SurPRO survey of shoving profiles on asphalt on Runway 12-30 at Edmonton
International Airport in 2013
Figure 18: Example of crack and joint load transfer efficiency (LTE) determined during FWD
testing on Runway 12-30 at Edmonton International Airport in 2013

17
Figure 19: Stitched concrete slab before placement of asphalt overlay on Runway 12-30 at
Edmonton International Airport in 2013.