uva-dare (digital academic repository) how to deal with ... · although in most hospital...
TRANSCRIPT

UvA-DARE is a service provided by the library of the University of Amsterdam (http://dare.uva.nl)
UvA-DARE (Digital Academic Repository)
How to deal with fluctuations in hospital processes to improve accessibility?
Joustra, P.E.
Link to publication
Citation for published version (APA):Joustra, P. E. (2011). How to deal with fluctuations in hospital processes to improve accessibility?
General rightsIt is not permitted to download or to forward/distribute the text or part of it without the consent of the author(s) and/or copyright holder(s),other than for strictly personal, individual use, unless the work is under an open content license (like Creative Commons).
Disclaimer/Complaints regulationsIf you believe that digital publication of certain material infringes any of your rights or (privacy) interests, please let the Library know, statingyour reasons. In case of a legitimate complaint, the Library will make the material inaccessible and/or remove it from the website. Please Askthe Library: http://uba.uva.nl/en/contact, or a letter to: Library of the University of Amsterdam, Secretariat, Singel 425, 1012 WP Amsterdam,The Netherlands. You will be contacted as soon as possible.
Download date: 14 Jun 2018

The medical faculty is a collaborative effort of the Academic Medical Center and the University of Amsterdam
“Even small healthcare institutions are complex, barely manageable places.large healthcare institutions may be the most complex organisations in human history.”
Peter Drucker

1CHAPTER
General Introduction

9
GENERAL INTRODUCTION
1.1 The relevance of cost-effective ways for improving the accessibility of hospital care
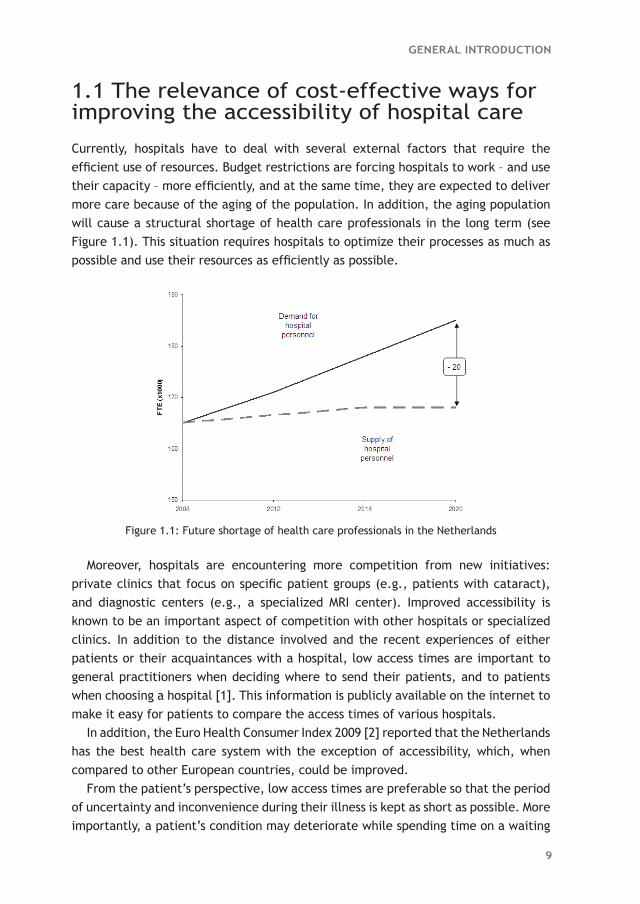
Currently, hospitals have to deal with several external factors that require the efficient use of resources. Budget restrictions are forcing hospitals to work – and use their capacity – more efficiently, and at the same time, they are expected to deliver more care because of the aging of the population. In addition, the aging population will cause a structural shortage of health care professionals in the long term (see Figure 1.1). This situation requires hospitals to optimize their processes as much as possible and use their resources as efficiently as possible.
Moreover, hospitals are encountering more competition from new initiatives: private clinics that focus on specific patient groups (e.g., patients with cataract), and diagnostic centers (e.g., a specialized MRI center). Improved accessibility is known to be an important aspect of competition with other hospitals or specialized clinics. In addition to the distance involved and the recent experiences of either patients or their acquaintances with a hospital, low access times are important to general practitioners when deciding where to send their patients, and to patients when choosing a hospital [1]. This information is publicly available on the internet to make it easy for patients to compare the access times of various hospitals.
In addition, the Euro Health Consumer Index 2009 [2] reported that the Netherlands has the best health care system with the exception of accessibility, which, when compared to other European countries, could be improved.
From the patient’s perspective, low access times are preferable so that the period of uncertainty and inconvenience during their illness is kept as short as possible. More importantly, a patient’s condition may deteriorate while spending time on a waiting
Figure 1.1: Future shortage of health care professionals in the Netherlands

10
CHAPTER 1
list. For example, O’Rourke [3] concluded that lung cancer patients may become more seriously ill while waiting for radiotherapy treatment, therefore potentially requiring more complex treatment and/or decreasing the chance of full recovery. Furthermore, Huang et al. [4] concluded that for both breast cancer and head and neck cancer, the local recurrence rate was significantly higher for patients who had to wait longer for radiotherapy treatment.
Prentice and Pizer reported that the mortality rate within a 6-month follow-up period was significantly higher for patients who had to wait more than 31 days for an appointment at a geriatric outpatient clinic [5].
With respect to cardiac surgery, Plomp et al. [6] concluded that the causes and circumstances of death are waiting list-related for approximately 100 patients per year in the Netherlands. Moreover, Rexius et al. [7] concluded that long waiting lists for coronary artery bypass grafting are associated with considerable mortality, and the risk of death increases significantly with waiting time.
1.2 Why is it advisable to use quantitative decision support?
There are often multiple solutions available for improving the accessibility of hospitals. At the same time, the impact of a solution in a specific hospital setting cannot be known beforehand. To reduce the risk of implementing a solution that will not have the preferred impact on accessibility, it would thus be highly advisable to have quantitative decision support. With this quantitative support, the impact of each potential solution (or combination of solutions) could be predicted accurately before actually implementing the solution in practice. Moreover, it would provide an objective way of comparing alternative solutions before selecting the most cost-effective solution for meeting the performance target.
1.3 Why do waiting times occur?
There are different kinds of waiting times in hospitals: access times, throughput times, and in the waiting room. Waiting times are generally perceived as occurring due to a mismatch between demand and capacity. This is true to a certain extent. If demand structurally exceeds capacity, it is logical there will be waiting times. However, the mismatch between demand and capacity in hospitals is often only temporary and is caused by fluctuations – from day to day and week to week – in both demand as well as capacity. Although in most hospital departments the average capacity is sufficient for meeting the average demand, these temporary mismatches

11
GENERAL INTRODUCTION
do indeed result in waiting times for patients (see the example in Table 1.1). Note that because capacity that remained unused in the past cannot be used in the future, the average number of patients on the waiting list will keep growing.
To limit waiting times, management should add some slack capacity to compensate for the temporary mismatches due to fluctuations in demand and capacity. For example, if the capacity in Table 1.1 had been 7 instead of 6, the average number of patients on the waiting list would have been 0.7 instead of 2.7, though adding slack capacity results in a utilization rate of resources that is lower than 100%. The lower the preferred waiting times, the more slack capacity that should be added, and thus the lower the resulting utilization rate will be (see Figure 1.2). Therefore, urgent patients require more slack capacity than elective patients, and so an increase in the percentage of urgent patients in an outpatient department or operating room results in a lower utilization rate.
Although access times are often too high in practice, in most hospital settings they have been fairly stable over the past few years. This implies that capacity is sufficient for meeting demand (i.e., the utilization rate is below 100%). If the backlog could be reduced, often only a limited amount of slack capacity would have to be added to maintain these low access times.
Figure 1.2: Relationship between utilization rate and waiting time
Table 1.1: Effect of fluctuating demand on waiting list
Week
1 2 3 4 5 6 7 8 9 10 Avg.
Capacity 6 6 6 6 6 6 6 6 6 6 6
Demand 3 5 8 10 6 4 3 7 6 8 6
No. of patients on waiting list 0 0 2 6 6 4 1 2 2 4 2.7
12
CHAPTER 1
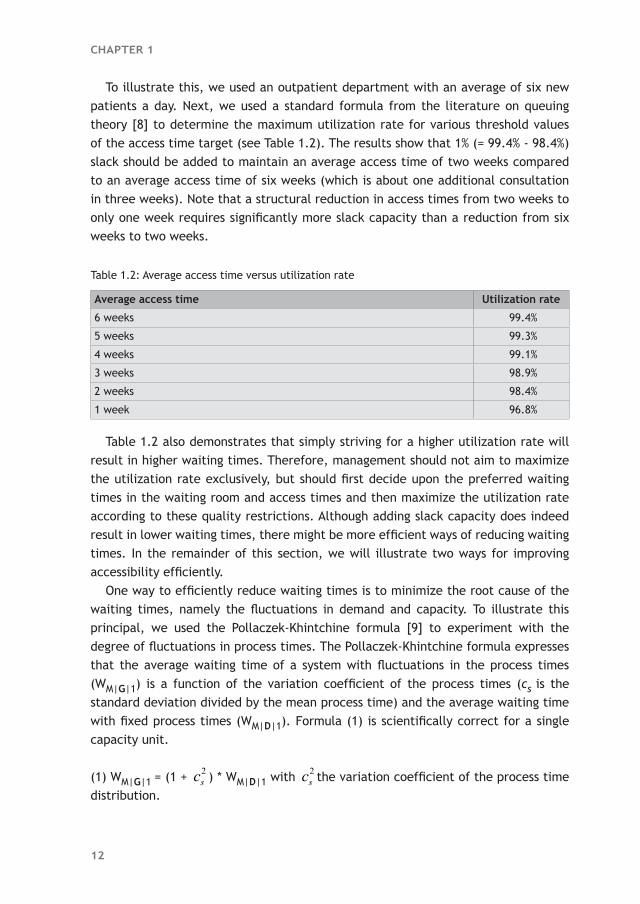
To illustrate this, we used an outpatient department with an average of six new patients a day. Next, we used a standard formula from the literature on queuing theory [8] to determine the maximum utilization rate for various threshold values of the access time target (see Table 1.2). The results show that 1% (= 99.4% - 98.4%) slack should be added to maintain an average access time of two weeks compared to an average access time of six weeks (which is about one additional consultation in three weeks). Note that a structural reduction in access times from two weeks to only one week requires significantly more slack capacity than a reduction from six weeks to two weeks.
Table 1.2: Average access time versus utilization rate
Average access time Utilization rate
6 weeks 99.4%
5 weeks 99.3%
4 weeks 99.1%
3 weeks 98.9%
2 weeks 98.4%
1 week 96.8%
Table 1.2 also demonstrates that simply striving for a higher utilization rate will result in higher waiting times. Therefore, management should not aim to maximize the utilization rate exclusively, but should first decide upon the preferred waiting times in the waiting room and access times and then maximize the utilization rate according to these quality restrictions. Although adding slack capacity does indeed result in lower waiting times, there might be more efficient ways of reducing waiting times. In the remainder of this section, we will illustrate two ways for improving accessibility efficiently.
One way to efficiently reduce waiting times is to minimize the root cause of the waiting times, namely the fluctuations in demand and capacity. To illustrate this principal, we used the Pollaczek-Khintchine formula [9] to experiment with the degree of fluctuations in process times. The Pollaczek-Khintchine formula expresses that the average waiting time of a system with fluctuations in the process times (WM|G|1) is a function of the variation coefficient of the process times (cs
is the standard deviation divided by the mean process time) and the average waiting time with fixed process times (WM|D|1). Formula (1) is scientifically correct for a single capacity unit.
(1) WM|G|1 = (1 + 2sc ) * WM|D|1 with 2
sc the variation coefficient of the process time distribution.

13
GENERAL INTRODUCTION
Table 1.3: Scenarios with variations in process times
Scenario cs2 Utilization rate Avg. waiting time
Basic 1.0 95.0% 19
Alternative 1 0.5 95.0% 14
Alternative 2 0.5 96.2% 19
Alternative 3 0.5 95.6% 16
Table 1.3 contains four scenarios we used to illustrate the effect of a reduction in fluctuations in process times. The basic scenario has high fluctuations in process times (i.e., 2
sc = 1) and the utilization rate is 95%, which results in an average waiting time of 19 (see Table 1.3). The first alternative scenario shows that fewer fluctuations in process times (i.e., 2
sc = 0.5) with an equal utilization rate results in a lower average waiting time. The second alternative scenario demonstrates that the variation reduction in process times can also be used to increase the utilization rate while maintaining the same average waiting time as in the basic scenario. The final alternative scenario shows that a combination of both advantages – higher utilization rate and lower average waiting time – is also possible.
A second way to efficiently reduce waiting times is to pool various patient groups. The capacity of shared resources of central diagnostic departments in particular is often subdivided among many patient groups that differ from a medical perspective. It might be more efficient, though, to pool logistically similar patient groups. To illustrate the effect of increased economy of scope, we defined four scenarios. The basic scenario contains two patient groups with similar process times; each group has one dedicated capacity unit, and the utilization rate of both capacity units is 95%. Using a standard formula from the literature on queuing theory [8], this results in an average waiting time of 19 for both patient groups (see Table 1.4).
Table 1.4: Effect of increased economy of scope on waiting times
Scenario No. of capacity units Utilization rate Avg. waiting time
Basic 2 x 1 95.0% 19
Alternative 1 1 x 2 95.0% 9
Alternative 2 1 x 2 97.5% 19
Alternative 3 1 x 2 96.6% 14
Alternative 1 shows that if we were to pool the two patient groups, the average waiting time for the pooled group would decrease to 9. Alternative 2 shows that the advantage of the increased economy of scope can also be used to increase the utilization rate to 97.5% while maintaining the same average waiting time as in the basic scenario. The last alternative scenario shows that a combination of both advantages – higher utilization rate and lower average waiting time – is also possible.
14
CHAPTER 1
1.4 Settings
The research contained in this thesis was performed at the Academic Medical Center (AMC) in Amsterdam, the Netherlands. The AMC is an academic hospital with 1,002 beds, and 356,000 outpatient hospital visits and 55,000 surgical procedures in 2009. Nearly all departments use McKesson’s X/Care hospital appointment system to schedule the outpatient visits, and most surgical procedures are scheduled using the OKplus operating room information system. Elective patients are allowed to walk in without an appointment for only a small number of consultations and examinations.
To improve accessibility by reducing fluctuations in demand and capacity, we first need to know what types of fluctuations frequently occur in hospitals. An overview of these types is given in this section. We start by identifying the fluctuations that occur in all hospitals followed by the additional fluctuations in teaching hospitals and academic hospitals.
As is common in all hospitals, the number of patients referred to the various outpatient departments by general practitioners and other physicians fluctuate from day to day and week to week. Some outpatient departments may even have a seasonal pattern in the number of referrals. Also, the number of follow-up consultations may differ per patient, and the average number of follow-up consultations often differs significantly per subspecialty and/or per individual physician. As well as elective patients, physicians also have to see urgent patients. All these fluctuations in demand generally lead to access times for a first, a follow-up, or an urgent (or semi-urgent) consultation, even with a stable capacity. However, the capacity in terms of the number of available consultations also fluctuates heavily from day to day and week to week. In addition, all outpatient departments within the AMC experience a seasonal pattern in capacity due to holiday periods. On the operational level, a physician’s starting time and the arrival time of a patient with an appointment vary, which results in waiting time in the waiting room. At specific outpatient departments, patients need some preparation before a consultation (e.g., at an ophthalmology department), which causes even more fluctuations in the arrival time of patients in the consultation/examination room. Moreover, the actual duration of a consultation may differ per patient, and the average duration might differ per subspecialty and/or per individual physician.
There are more fluctuations in teaching hospitals than in non-teaching hospitals. For example, the average number of follow-up consultations done by a resident physician is likely to be higher than those done by an attending physician, and also the average number of follow-up consultations among the resident physicians probably differs more than those among the attending physicians. There are more fluctuations in teaching hospitals on an operational level as well. For example, due to a lack of experience, the duration of consultations performed by a resident physician

15
GENERAL INTRODUCTION
is likely to fluctuate more than those performed by an attending physician. Moreover, if an attending physician is also seeing patients during the supervision period – which is often the case in the AMC – this supervision of a resident physician will cause interruptions in both their schedules and therefore more fluctuations in the duration of consultations.
Physicians in academic hospitals are likely to be absent more frequently due to other reasons (such as attending conferences and teaching medical students), which causes more fluctuations in the weekly number of available consultations. Also, academic hospitals have a more diverse and complex patient-mix compared to general hospitals. This often results in a higher degree of subspecialization and thus smaller groups of physicians per subspecialty, which reduces robustness and therefore often results in higher access times due to less flexibility in allocating the available capacity. On the operational level, the more diverse and complex diseases probably cause more fluctuations in the duration of consultations. In addition, research may require that specific patients are examined more extensively, which leads to more fluctuations in the duration of consultations.
Table 1.5 summarizes the types of fluctuations that occur in an outpatient department. The degree of fluctuations depends on the type of hospital; in general, academic hospitals show a higher degree of fluctuation than teaching hospitals, which in turn show more fluctuations than general hospitals.
The same types of fluctuations that occur in outpatient departments also occur in emergency departments, central diagnostic or therapeutic departments, and operating rooms.
Table 1.5: Types of fluctuations on tactical and operational levels
Types of fluctuations in an outpatient department
On a tactical level
Number of patients per day, per week, per month
Number of follow-up consultations per patient, per subspecialty, per individual physician
Various urgency levels
Weekly number of available consultations
Subspecialty required by patient
On an operational level
Physician’s starting time
Patient’s arrival time
Preparation time for a patient
Actual duration of a consultation per patient, per subspecialty, per individual physician
Attending physicians versus resident physicians
Supervision of a resident physician by an attending physician

16
CHAPTER 1
1.5 Research question
The overall research objective of this thesis is to show the added value of quantitative methods such as queuing theory, discrete event simulation, and regression analysis for generally applied process improvement methods, in a complex hospital setting, in particular for decision support on a strategic level.
In addition to the overall research objective, this thesis aims to answer the following specific research questions: 1. How can waiting times, access times, and throughput times be reduced cost-
effectively a. by decreasing the various fluctuations in health care processes and/or b. by pooling or separating various patient groups?
2. How can hospital processes be made more predictable so that management is able to anticipate future developments proactively, and structurally improve the hospital’s key performance indicators?
1.6 Methodology
Based on the different types of fluctuations that frequently occur in hospitals, we explored different methods for decreasing these fluctuations or minimizing the negative effect of these fluctuations on waiting and access times.
Generally applied process improvement methods such as Business Process Redesign [10], Total Quality Management [11], Theory of Constraints [12], Lean Management [13], and Six Sigma [14] give insights into which process steps to focus on to reduce waiting and access times or throughput times. Unfortunately, none of these methods quantitatively supports the expected impact of a potential solution on the waiting and access times before implementation in practice, nor do these methods quantitatively support the selection of alternative solutions.
Each of our research studies required quantitative decision support. Therefore, we have searched for quantitative methods that could be applied in situations where various fluctuations significantly influence a system’s performance, as is the case in hospitals. Queuing theory is an appropriate method for analyzing waiting times, and was frequently applied in health care settings [15, 16]. Discrete event simulation was often used for more complex hospital problems [17-19].
Though both of these methods were used to solve problems on an operational or tactical level, we did not find any articles where queuing theory or discrete event simulation were used for decision support on a strategic level.

17
GENERAL INTRODUCTION
1.7 Outline of this thesis
Chapters 2 through 8 are based on articles. Because this thesis should be seen as applied research, the order in which they are presented here is based primarily on the application area. Therefore, we have chosen to arrange the chapters according to hospital departments rather than the methodology. Subsequently, we arranged the articles so that sets of articles used to answer the same specific research question were combined wherever possible.
This reasoning led to the following order:Chapter 2 Capacity Variability Reduction: A case study for a multi-step radiotherapy
process.Chapter 3 To pool or not to pool in hospitals: A theoretical and practical comparison
for a radiotherapy outpatient department.Chapter 4 Reduce access times for an endoscopy department by an iterative
combination of computer simulation and Linear Programming. Chapter 5 Reducing MRI access times by tackling the appointment-scheduling
strategy.Chapter 6 How to reduce waiting times at the MRI of a University Radiology
Department. Chapter 7 Can statisticians beat surgeons at the planning of operations? Chapter 8 How to juggle with priorities? An interactive tool to provide quantitative
support for strategic patient-mix decisions.
Chapters 2 and 3 illustrate two alternative solutions for efficiently reducing access times in the AMC radiotherapy outpatient department to be able to meet the throughput time targets for radiotherapy treatment. The next three chapters all describe case studies of a central diagnostic department, namely the endoscopy department (Chapter 4) and the MRI department (Chapters 5 and 6). Chapters 4 and 5 demonstrate how to reduce access times for an endoscopic procedure and an MRI scan respectively. In Chapter 6, we evaluate various alternative scenarios to reduce waiting time in the waiting room of an MRI department. Finally, the last two chapters of this thesis focus mainly on the performance of the operating room. Chapter 7 explores how to improve the accuracy of the predicted duration of surgical procedures in order to limit the risk of overtime and the number of cancellations due to overruns of previous surgeries. Chapter 8 describes an interactive tool for supporting medical management with strategic patient-mix decisions, and takes the key performance indicators into account. In our case study of the AMC ophthalmology department we focused on the bottleneck, namely the operating room.

18
CHAPTER 1
Chapters 2, 4, and 6 were used to answer research question 1a. These studies demonstrate how decreasing the various fluctuations in health care processes result in lower throughput times, access times, and waiting times in the waiting room respectively. Chapter 2 explores the effect of a reduction in the fluctuations of capacity in the multi-step radiotherapy process in order to decrease the total throughput times. Chapter 4 also shows how a reduction in fluctuations in capacity could improve the accessibility of (in this case) an endoscopy department. Chapter 6 demonstrates two examples of variability reduction of MRI durations, namely reducing the supervision by radiologists, and scheduling patients at high risk of unexpected issues (e.g., patients with claustrophobia) for the open MRI scanner or at the end of the schedule for the regular MRI scanners. Chapters 3, 4, and 5 deal with the question of whether to pool or separate patient groups (research question 1b) for two different reasons and three different departments. More specifically, Chapter 3 explores the situations in which semi-urgent and elective patient groups should be pooled or separated. Furthermore, Chapters 4 and 5 both investigate whether pooling different groups of elective patients would reduce the access times for an endoscopic procedure and an MRI scan respectively.
To answer research question 2, we conducted the research described in Chapters 6, 7, and 8. In Chapter 6, we used variability reduction as well as improved predictability to reduce waiting times in the waiting room of an MRI department. Finally, Chapters 7 and 8 aim to improve the predictability of hospital processes so that management is able to anticipate future developments proactively instead of reactively.
With respect to methodology, in Chapters 2 and 3 we used a combination of queuing theory and computer simulation; in Chapters 4 through 6 we used only computer simulation. Finally, to improve predictability we applied regression analysis; in Chapter 8 we combined this with computer simulation.
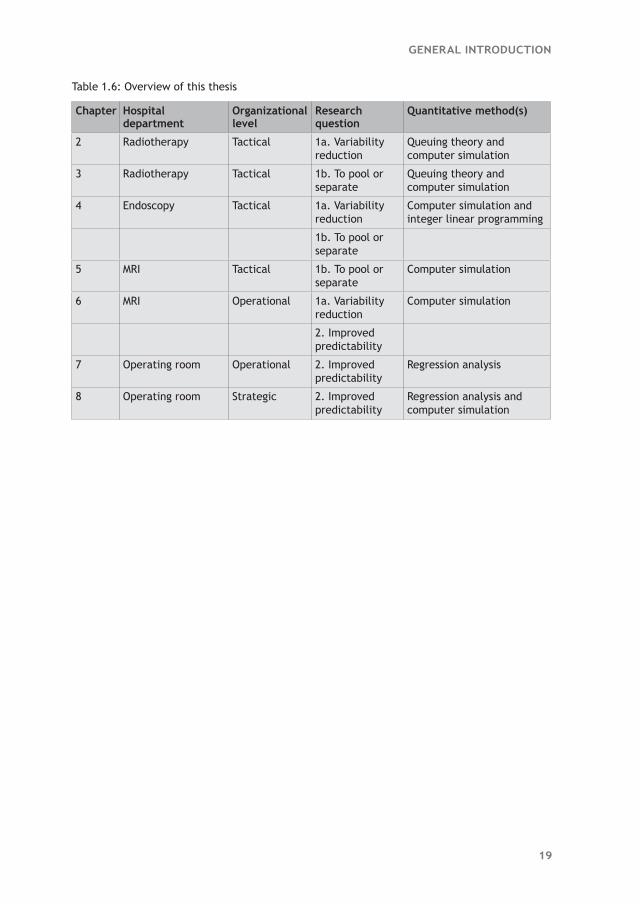
Table 1.6 provides an overview of this thesis including the research question, hospital department, organizational level, research question and quantitative method(s) per chapter.
19
GENERAL INTRODUCTION
Table 1.6: Overview of this thesis
Chapter Hospital department
Organizational level
Research question
Quantitative method(s)
2 Radiotherapy Tactical 1a. Variability reduction
Queuing theory and computer simulation
3 Radiotherapy Tactical 1b. To pool or separate
Queuing theory and computer simulation
4 Endoscopy Tactical 1a. Variability reduction
Computer simulation and integer linear programming
1b. To pool or separate
5 MRI Tactical 1b. To pool or separate
Computer simulation
6 MRI Operational 1a. Variability reduction
Computer simulation
2. Improved predictability
7 Operating room Operational 2. Improved predictability
Regression analysis
8 Operating room Strategic 2. Improved predictability
Regression analysis and computer simulation
20
CHAPTER 1
References 1. Faber M, Bosch M, Wollersheim H, Leatherman S, Grol R (2009) Public reporting in health
care: how do consumers use quality-of-care information? A systematic review. Med Care 47:1-8.
2. Euro Health Consumer Index 2009 by Health Consumer Powerhouse (January 10th, 2009).
3. O’Rourke N, Edwards R (2000) Lung cancer treatment waiting times and tumour growth. Clin Oncol 12:141-144.
4. Huang J, Barbera L, Brouwers M, Browman G, Mackillop WJ (2003) Does delay in starting treatment affect the outcomes of radiotherapy? A systematic review. J Clin Oncol 21:555-563.
5. Prentice JC, Pizer SD (2007) Delayed access to health care and mortality. Health Serv Res. 42(2):644-662.
6. Plomp J, Redekop WK, Dekker FW, Geldorp van TR, Haalebos M, Jambroes G, Kingma J, Zijlstra F, Tijssen J (1999) Death on the waiting list for cardiac surgery in the Netherlands in 1994 and 1995. Heart 81(6):593-597.
7. Rexius H, Brandrup-Wognsen G, Odén A, Jeppsson A (2004) Mortality on the waiting list for coronary artery bypass grafting: incidence and risk factors. Ann Thorac Surg 77:769-774.
8. Cooper RB (1984) Introduction to queueing theory. Elsevier Science Publishing, New York, 2nd edn.
9. Pollaczek F (1957) Problèmes stochastiques posés par le phénomène de formation d’une queue d’attente à un guichet et par des phenomenes apparentés. Gauthier Villars, Paris.
10. Hammer M (1990) ‘Reengineering work: don’t automate, obliterate’. Harvard Business Review, 68, 4, July-August, 104-112.
11. Hammet P (2000). The Philosophy of TQM.
12. Goldratt EM (1990) What is this thing called Theory of Constraints. North River Press, New York
13. Womack JP, Jones DT (1996) Lean Thinking: Banish Waste and Create Wealth in Your Corporation.
14. Pyzdek T and Keller PA (2009). The Six Sigma Handbook, 3rd edn. McGraw-Hill, New York.
15. Worthington DJ (1987) Queueing models for hospital waiting lists. The J of Oper Res Soc 38(5):413-422.
16. Fomundam S and Herrmann JW (2007) A survey of queuing theory applications in healthcare. Technical report, University of Maryland.
17. Brailsford SC, Harper PR, Patel B, Pitt M (2009) An analysis of the academic literature on simulation and modelling in health care. J of Simul 3:130–140.
18. Jacobson H, Hall S, Swisher J (2006) Discreet-Event Simulation of Health Care Systems. In Hall, R. (Ed.), Patient Flow: Reducing Delay in Healthcare Delivery (pp. 210-252). Springer, NY.
19. Fone D, Hollinghurst S, Temple M, Round A, Lester N, Weightman A, Roberts K, Coyle E, Bevan G, Palmer S (2003) Systematic review of the use and value of computer simulation modelling in population health and health care delivery. J of Public Health Med 25:325-335.