uva-dare (digital academic repository) exploring ... · carried out by the x-ray telescope aboard...
TRANSCRIPT

UvA-DARE is a service provided by the library of the University of Amsterdam (http://dare.uva.nl)
UvA-DARE (Digital Academic Repository)
Exploring subluminous X-ray binaries
Degenaar, N.D.
Link to publication
Citation for published version (APA):Degenaar, N. D. (2010). Exploring subluminous X-ray binaries
General rightsIt is not permitted to download or to forward/distribute the text or part of it without the consent of the author(s) and/or copyright holder(s),other than for strictly personal, individual use, unless the work is under an open content license (like Creative Commons).
Disclaimer/Complaints regulationsIf you believe that digital publication of certain material infringes any of your rights or (privacy) interests, please let the Library know, statingyour reasons. In case of a legitimate complaint, the Library will make the material inaccessible and/or remove it from the website. Please Askthe Library: http://uba.uva.nl/en/contact, or a letter to: Library of the University of Amsterdam, Secretariat, Singel 425, 1012 WP Amsterdam,The Netherlands. You will be contacted as soon as possible.
Download date: 16 Jul 2018

6A four-year baseline Swift study ofenigmatic X-ray transients located
near the Galactic centre
N. Degenaar and R. Wijnands
Astronomy & Astrophysics in press
Abstract – We report on continued monitoring observations of the Galactic centrecarried out by the X-ray telescope aboard the Swift satellite in 2008 and 2009. Thiscampaign revealed activity of the five known X-ray transients AX J1745.6–2901,CXOGC J174535.5–290124, GRS 1741–2853, XMM J174457–2850.3 and CXOGCJ174538.0–290022. All these sources are known to undergo very faint X-ray out-bursts with 2–10 keV peak luminosities of Lpeak
X ∼ 1034−36 erg s−1, although the twoconfirmed neutron star low-mass X-ray binaries AX J1745.6–2901 and GRS 1741–2853 can also become brighter (Lpeak
X ∼ 1036−37 erg s−1). We discuss the observedlong-term lightcurves and X-ray spectra of these five enigmatic transients. In 2008,AX J1745.6–2901 returned to quiescence following an unusually long accretion out-burst of ∼ 1.5 years. GRS 1741–2853 was active in 2009 and displayed the bright-est outburst ever recorded for this source, reaching up to a 2–10 keV luminosity ofLX ∼ 1 × 1037 (D/7.2 kpc)2 erg s−1. We find that the unclassified transient XMMJ174457–2850.3 becomes bright only during short episodes (days) and is often foundactive in between quiescence (LX ∼ 1032 erg s−1) and its maximum outburst lumi-nosity of LX ∼ 1036 erg s−1. CXOGC J174535.5–290124 and CXOGC J174538.0–290022, as well as three other transients that were detected by this campaign in 2006,have very low time-averaged mass-accretion rates of . 2 × 10⁻¹² M� yr−1. Despitehaving obtained two years of new data, no new X-ray transients were detected.
101

6 A four-year baseline Swift study of enigmatic X-ray transients
6.1 Introduction
Starting in 2006 February, the Swift satellite has been monitoring the Galactic centre(GC) with the onboard X-ray telescope (XRT; Burrows et al. 2005). In this campaign,short (∼ 1 ks) pointings are carried out on an almost daily basis1, covering a field of∼ 26′ × 26′ of sky around Sgr A∗ (Kennea & The Swift/XRT team 2006; Degenaar &Wijnands 2009). This is an ideal setting for detecting transient X-ray sources in oneof the most active X-ray regions in the Milky Way.
X-ray transients alternate periods of quiescence, that have a typical duration ofyears to decades and are characterised by 2–10 keV luminosities of ∼ 1030−33 erg s−1,with occasional outbursts during which the X-ray luminosity increases by a factor& 100 for weeks to months. A large fraction of the galactic X-ray transients can beidentified with neutron stars or black holes accreting matter from a companion star inan X-ray binary. Based on the nature of the donor star, we can distinguish low-massX-ray binaries (LMXBs; Mdonor . 1 M�, spectral type later than B) or high-massX-ray binaries (HMXBs; Mdonor & 10 M�, spectral type O or B).
In LMXBs, matter is generally transferred because the donor star fills its Roche-lobe, a process that involves the formation of an accretion disc. In such systems, thetransient behaviour is explained in terms of a thermal-viscous instability that causesthe disc to oscillate between a cold, neutral state (quiescence), and one in which itis hot and ionized, causing a strong increase in the mass-accretion rate and resultingin an X-ray outburst (e.g., King & Ritter 1998; Lasota 2001). During quiescence,the disc regains the mass that was lost during the outburst and the cycle repeats.Symbiotic X-ray binaries form a small sub-class of LMXBs in which the compactprimary, most likely a neutron star, is accreting matter from the wind of an M-typegiant companion (e.g., Masetti et al. 2007).
Amongst the transient HMXBs, most of the currently known systems are Be/X-ray binaries. In such systems, the compact primary is in a wide and eccentric orbitaccreting matter from the circumstellar disc surrounding a main sequence Oe or Bestar around periastron passage (e.g., Negueruela 2004). However, recently Integraland RXTE have unveiled a new class of transient HMXBs, called Supergiant FastX-ray transients (SFXTs; e.g., Negueruela et al. 2006), in which the compact staris capturing the strong stellar wind of an O or B supergiant companion. In thesesystems, the transient behaviour is thought to be caused by clumpy or anisotropicwinds (e.g., Sidoli 2009).
The temporal and spectral properties of the brightest galactic X-ray transients,which have 2–10 keV peak luminosities of Lpeak
X ∼ 1036−39 erg s−1, are well estab-
1Except during the months November–February, when the GC is too close (within 45 degrees) tothe Sun.
102

6.2 Observations and data analysis
lished through the work of numerous past and present X-ray missions. However,much less is known about transient sources that manifest themselves with lower 2–10 keV peak luminosities of ∼ 1034−36 erg s−1 (e.g., Sidoli et al. 1999; Muno et al.2005b; Porquet et al. 2005b; Wijnands et al. 2006a; Campana 2009; Heinke et al.2009a). It is only with the advent of the current generation of sensitive X-ray instru-ments that the properties of such objects can be studied in detail. To date, a few tensof low-luminosity transients are known in our Galaxy. As for the brighter systems,many of these are expected to harbour accreting neutron stars or black holes, but theirnature and the underlying mechanism producing their subluminous outbursts is notunderstood well.
The hypothesis that a significant fraction of the low-luminosity transients are X-ray binaries, gains credence by the detection of thermonuclear X-ray bursts fromseveral of these systems (e.g., in ’t Zand et al. 1991; Maeda et al. 1996; Cocchi et al.1999; Cornelisse et al. 2002; Chelovekov & Grebenev 2007; Del Santo et al. 2007b;Wijnands et al. 2009). This establishes that these objects harbour accreting neutronstars, most likely in an LMXB configuration. The observed low X-ray luminositiesin combination with estimates of their recurrence times, suggest that these systemshave very low time-averaged mass-accretion rates (e.g., Degenaar & Wijnands 2009).This might pose a challenge to explain the existence of these LMXBs without havingto invoke exotic evolutionary scenarios (e.g., King & Wijnands 2006).
Many low-luminosity transients are located within a few arcminutes of Sgr A∗
(e.g., Muno et al. 2005b; Wijnands et al. 2006a; Degenaar & Wijnands 2009). TheSwift/GC monitoring program thus provides an excellent setting to detect new low-luminosity transients and to study the long-term behaviour of known systems. Thisopens up the possibility to gain more insight into their duty cycles and the energeticsof their outbursts, and thereby to refine estimates of their average mass-accretionrates. This is an important parameter for understanding their evolution (e.g., King &Wijnands 2006), as well as the properties of thermonuclear X-ray bursts occurring atlow accretion luminosities (e.g., in’t Zand et al. 2005b; Peng et al. 2007; Cooper &Narayan 2007).
In a previous paper, we discussed a total of seven transients that were found activeduring Swift/XRT monitoring observations of the GC, carried out in 2006 and 2007(Degenaar & Wijnands 2009). Here, we discuss the data accumulated over the years2008 and 2009, which revealed activity of five previously known X-ray transients.
6.2 Observations and data analysis
We obtained all 2008 and 2009 XRT observations of the GC from the Swift publicdata archive. For 2008, the nearly daily coverage resulted in a total of 171 observa-
103
6 A four-year baseline Swift study of enigmatic X-ray transients
tions, amounting to 211 ks of exposure. All data was obtained in the photon counting(PC) mode and covers the epoch 2008 February 19–October 30. In 2009, the cam-paign was carried out in a slightly different setting, with ∼ 1 ks observations per-formed once every ∼ 3 days, instead of the daily repetition between 2006 and 2008.Swift targeted the GC from 2009 June 4 till November 1 during 40 observations fora total exposure time of 45 ks. Most of the 2009 data was obtained in the PC mode,apart from a selection of 3 pointings, during which the XRT was operated in the win-dowed timing (WT) mode. These WT observations were carried out between 2009October 10–13, and aimed specifically for GRS 1741–2853, which was in outburst atthat time and caused significant pile-up in the PC data.
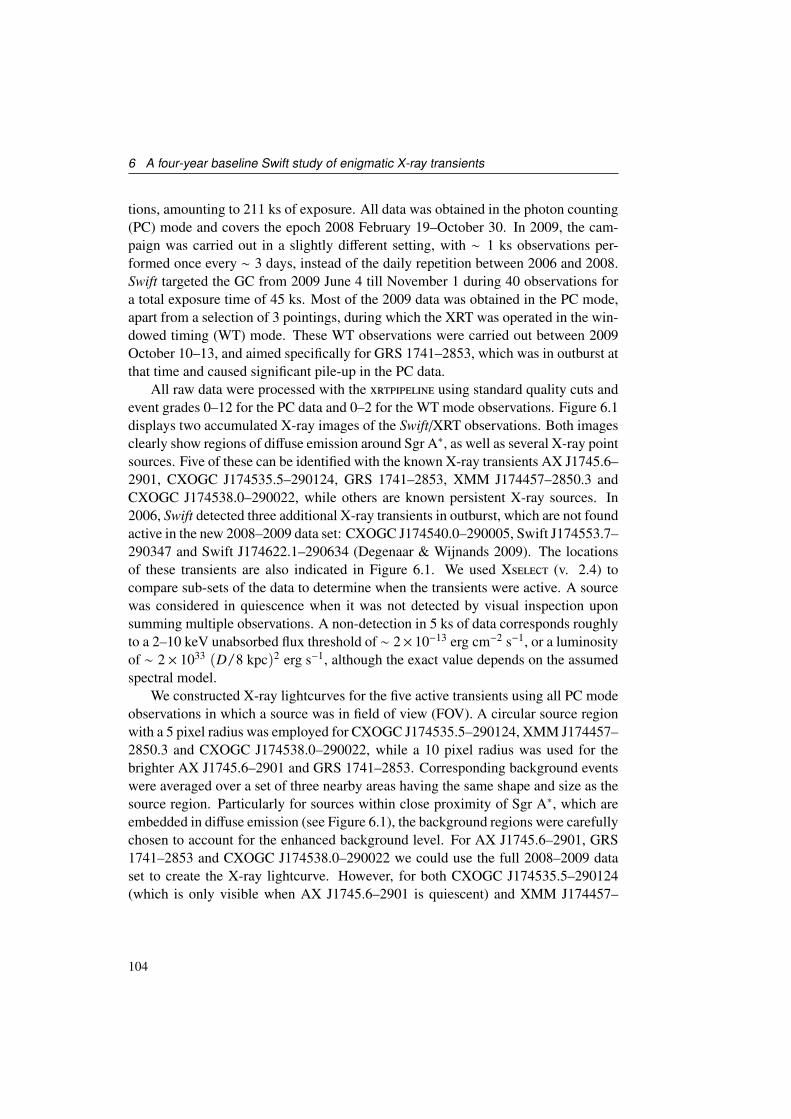
All raw data were processed with the using standard quality cuts andevent grades 0–12 for the PC data and 0–2 for the WT mode observations. Figure 6.1displays two accumulated X-ray images of the Swift/XRT observations. Both imagesclearly show regions of diffuse emission around Sgr A∗, as well as several X-ray pointsources. Five of these can be identified with the known X-ray transients AX J1745.6–2901, CXOGC J174535.5–290124, GRS 1741–2853, XMM J174457–2850.3 andCXOGC J174538.0–290022, while others are known persistent X-ray sources. In2006, Swift detected three additional X-ray transients in outburst, which are not foundactive in the new 2008–2009 data set: CXOGC J174540.0–290005, Swift J174553.7–290347 and Swift J174622.1–290634 (Degenaar & Wijnands 2009). The locationsof these transients are also indicated in Figure 6.1. We used X (v. 2.4) tocompare sub-sets of the data to determine when the transients were active. A sourcewas considered in quiescence when it was not detected by visual inspection uponsumming multiple observations. A non-detection in 5 ks of data corresponds roughlyto a 2–10 keV unabsorbed flux threshold of ∼ 2× 10⁻¹³ erg cm−2 s−1, or a luminosityof ∼ 2 × 1033 (D/8 kpc)2 erg s−1, although the exact value depends on the assumedspectral model.
We constructed X-ray lightcurves for the five active transients using all PC modeobservations in which a source was in field of view (FOV). A circular source regionwith a 5 pixel radius was employed for CXOGC J174535.5–290124, XMM J174457–2850.3 and CXOGC J174538.0–290022, while a 10 pixel radius was used for thebrighter AX J1745.6–2901 and GRS 1741–2853. Corresponding background eventswere averaged over a set of three nearby areas having the same shape and size as thesource region. Particularly for sources within close proximity of Sgr A∗, which areembedded in diffuse emission (see Figure 6.1), the background regions were carefullychosen to account for the enhanced background level. For AX J1745.6–2901, GRS1741–2853 and CXOGC J174538.0–290022 we could use the full 2008–2009 dataset to create the X-ray lightcurve. However, for both CXOGC J174535.5–290124(which is only visible when AX J1745.6–2901 is quiescent) and XMM J174457–
104

6.2 Observations and data analysis
1'
CXOGC J174540.0-290005
Swift J174622.1-290634
Swift J174553.7-290347
CXOGC J174538.0-290022Sgr A*
GRS 1741.9-2853
AX J1745.6-2901
XMMU J174457-2850.3
for AX J1745.6-2901 1'Swift/XRT error circle
CXOGC J174538.0-290022
CXOGC J174553.5-290124
Sgr A*
CXOGC J174540.0-290005
Figure 6.1: Swift/XRT PC mode images (0.3–10 keV) of the region around Sgr A∗. The images indicatethe locations of the five X-ray transients that were in outburst in 2008–2009, as well as three additionaltransients that were detected with Swift in 2006 (CXOGC J174540.0–290005, Swift J174553.7–290347and Swift J174622.1–290634). Left) Merged X-ray image of the data obtained in 2008 and 2009. Right)A magnified image of the inner region around Sgr A∗ from the epoch between 2008 September 2 and2009 November 1, during which AX J1745.6–2901 resided in quiescence and activity from CXOGCJ174535.5–290124 could be detected. CXOGC J174538.0–290022 was also detected in outburst duringthat time.
2850.3 (which has a large offset from Sgr A∗ and was therefore not always in FOV),the lightcurve was constructed from a sub-set of the observations. We combined the2008–2009 data with that of 2006–2007 (discussed in Degenaar & Wijnands 2009), toobtain lightcurves with a four-year long baseline for the five active transients. Theseare displayed in Figure 6.2.
The PC data of AX J1745.6–2901 and GRS 1741–2853 are subject to pile-up.This effect becomes an issue for PC mode count rates above ∼ 0.5 counts s−1 andcauses multiple photons to be registered as single events, thus underestimating thetrue count rate. The lightcurves of AX J1745.6–2901 and GRS 1741–2853 are notcorrected for this. To estimate to which extend the count rates are affected, we sub-tracted source events from both circular and annular regions for the piled-up data ofboth sources. By comparing the fluxes deduced from spectral fitting, we find thatpile-up causes the PC mode count rates to be underestimated by a factor of ∼ 1.2at ∼ 0.7 counts s−1, ∼ 1.5 at ∼ 1.0 counts s−1 (about the peak count rate of AXJ1745.6–2901) and ∼ 3 at ∼ 1.8 counts s−1 (the peak count rate observed for GRS1741–2853).
We combined all the pointings in which a source was active to create a summedoutburst spectrum (displayed in Figure 6.3). For AX J1745.6–2901 and GRS 1741–2853, we attempted to circumvent the effect of pile-up on the spectral shape by using
105

6 A four-year baseline Swift study of enigmatic X-ray transients
an annular extraction region for the PC data, following the Swift pile-up analysisthread.2 As such, we used an annulus with an inner (outer) radius of 6 (15) pixels toextract source events from AX J1745.6–2901, and an inner (outer) radius of 7 (30)pixels for GRS 1741–2853. We compared the pile-up corrected PC spectra of GRS1741–2853 with spectra obtained from quasi-simultaneous WT mode data, whichare not subject to pile-up. For the WT data, we used a 40 × 40 pixels rectangularextraction region for source events, and a box of similar dimensions as a backgroundreference. From spectral fitting, we obtained fluxes for the different modes that differby ∼ 10%, and spectral parameters that are consistent with one another within theerrors. This suggests that the above described pile-up correction for the PC modeworks satisfactory.
Using the software tool , we generated exposure maps for each obser-vation, which carry information about the bad columns and hence the effective areaof the CCD. These were subsequently used to create ancillary response files (arf) forall spectra with the task . These account for different extraction regions,vignetting and corrections for the point spread function. The latest response matrixfiles (rmf, v. 11) were taken from the CALDB database. Using , the spectrawere grouped to contain at least 20 photons per bin. However, for XMM J174457–2850.3 and CXOGC J174535.5–290124 we use bins with a minimum of 10 photons,because of the low number of counts collected for these two sources.
We fitted the average outburst spectra using X (v. 12.5; Arnaud 1996) to anabsorbed powerlaw model and deduce the absorbed and unabsorbed fluxes in the 2–10 keV energy range. For the neutral hydrogen absorption, we use the modelusing the default X abundances and cross-sections. When a source displayedmultiple outbursts, we fitted these simultaneously with the hydrogen column densitytied. We include the 2006 and 2007 data (discussed in Degenaar & Wijnands 2009)in these fits. To calculate the unabsorbed peak flux of the outbursts of AX J1745.6–2901, XMM J174457–2850.3 and GRS 1741–2853, we extracted a single spectrumfrom the observation with the highest count rate. For the former two we use PCobservations, applying pile-up corrections as described above when necessary, whilefor the latter source WT data was available. In case of CXOGC J174535.5–290124and CXOGC J174538.0–290022, the source count rates were too low to extract aspectrum from a single observation. Therefore, we determined a count rate to fluxconversion factor for these two sources by comparing the average outburst flux withthe average net count rate. We then used this to estimate the unabsorbed peak fluxfrom the observed peak count rate.
All five active X-ray transients are heavily absorbed (NH & 7 × 1022 cm−2; seeTable 6.1), consistent with values obtained for sources that lie close to Sgr A∗. We
2http://www.swift.ac.uk/pileup.shtml.
106

6.3 X-ray lightcurves and spectra
therefore assumed source distances of 8 kpc when calculating 2–10 keV luminositiesfrom the unabsorbed fluxes. However, for GRS 1741–2853 we use a distance of7.2 kpc, since this is the upper limit that has recently been inferred from the analysisof thermonuclear X-ray bursts (Trap et al. 2009). The X-ray spectra are displayedin Figure 6.3 and the results of our spectral analysis are presented in Table 6.1. The2006 and 2007 data (reported by Degenaar & Wijnands 2009), are refitted here.
For each observed outburst we calculate the fluence by multiplying the averageunabsorbed 2–10 keV outburst flux with the duration of the outburst. These resultsare presented in Table 6.2. Assuming that the transients are accreting systems, weadditionally calculate the mass-accretion rates during outburst. Furthermore, we usethe estimated duty cycles to obtain an order of magnitude approximation for theirlong-term mass-accretion rates (see Section 6.4.2 for further details). These resultsare also included in Table 6.2.
6.3 X-ray lightcurves and spectra
6.3.1 AX J1745.6–2901
The X-ray transient AX J1745.6–2901 was detected with the ASCA satellite in 1993October and in 1994 October, displaying 3–10 keV luminosities of ∼ 2 × 1035 and∼ 9 × 1035 erg s−1, respectively (Maeda et al. 1996). The detection of thermonuclearX-ray bursts identified the source as a neutron star LMXB and the system displayseclipses with a period of 8.4 h, which represents the binary orbital period (Maedaet al. 1996). The likely quiescent counterpart, CXOGC J174535.6–290133, has a2–10 keV luminosity of several times 1032 erg s−1 (Degenaar & Wijnands 2009).
Since 1994, AX J1745.6–2901 was never reported in outburst again, despite reg-ular monitoring of the GC, e.g., with the Chandra satellite between 1999 and 2004(Muno et al. 2003b, 2004, 2005b). However, the source was found active in 2006February, when the Swift/XRT monitoring observations of the GC kicked off (Ken-nea et al. 2006a).3 AX J1745.6–2901 remained active for 16 weeks at an average2–10 keV luminosity of ∼ 4 × 1035 erg s−1 (Degenaar & Wijnands 2009, see alsoTable 6.1). Subsequently, the source resided in quiescence for at least four months(2006 July–October), but was again detected in outburst by Integral and Swift on2007 February 15–17 (Kuulkers et al. 2007a; Wijnands et al. 2007). The activitycontinued throughout the 2007 monitoring campaign, which ended on 2007 Novem-ber 2. The average outburst luminosity was ∼ 1.5 × 1036 erg s−1 (2–10 keV), i.e.,
3The transient was first denoted as Swift J174535.5–290135, but the detection of 8.4 hr eclipses inXMM-Newton observations definitely linked Swift J174535.5–290135 to AX J1745.6–2901 (Porquetet al. 2007).
107

6 A four-year baseline Swift study of enigmatic X-ray transients
AX J1745.6-2901 CXOGC J174535.5-290124
GRS 1741.9-2853
0.01
0.02
200 220 240180
XMM J174457-2850.3
Figure 6.2: Background corrected 0.3–10 keV Swift/XRT lightcurves of the five transients that wereactive in 2008–2009 (PC mode data only). Displayed is their long-term behaviour from the start ofthe monitoring campaign of the GC on 2006 February 24. Days 0–616 cover the years 2006 and 2007(discussed in Degenaar & Wijnands 2009), whereas days 725–1346 represent the new data assembledin 2008–2009. The lightcurve of GRS 1741–2853 shows a magnified image of the short and weakoutburst that occurred in 2006.
108

6.3 X-ray lightcurves and spectra
CXOGC J174538.0-290022
Figure 6.2: Continued.
approximately 4 times higher than the level observed in 2006 (Porquet et al. 2007;Degenaar & Wijnands 2009).
When the Swift/GC monitoring observations resumed on 2008 February 19, AXJ1745.6–2901 was detected at a similar intensity as measured in 2007 November (seeFigure 6.2). This makes it likely that the outburst continued during the time that Swiftcould not observe the GC due to Sun-angle constraints. In 2008, the source flux wasobserved to decrease gradually (see Figure 6.2). In late-August, the decay acceleratedand within two weeks the source luminosity dropped from ∼ 1036 erg s−1 (2–10 keV),down to the background level on 2008 September 2. AX J1745.6–2901 was notdetected for the remainder of the Swift/XRT observations in 2008 and the system hadthus returned to quiescence following an accretion outburst that lasted > 1.5 years(> 80 weeks). In 2009, no activity was detected, indicating that the source remainedin quiescence. However, in 2010 June the source is again detected in outburst bySwift/XRT at a 2–10 keV luminosity of a few times 1035 erg s−1 (Degenaar et al.2010c).
The different outburst spectra of AX J1745.6–2901 are displayed in Figure 6.3.Both the 2006 and 2007–2008 outburst have a soft X-ray spectrum with powerlawindices of Γ = 2.4± 0.1 and 2.7± 0.1, respectively (see Table 6.1). The 2006 outburstappears to have a harder X-ray spectrum than the brighter 2007–2008 outburst (weobtain similar results when NH is left as a free parameter and not fixed between theoutbursts). The spectra indicate that the system is heavily absorbed with a best fithydrogen column density of NH = (23.8 ± 0.5) × 1022 cm−2. The average 2–10 keV
109

6 A four-year baseline Swift study of enigmatic X-ray transients
unabsorbed flux during the 2007–2008 outburst was ∼ 1 × 10⁻¹⁰ erg cm−2 s−1. Foran outburst duration of > 80 weeks, this implies a fluence of & 7 × 10⁻³ erg cm−2,which is a factor of ∼ 10 higher than that of the 2006 outburst (see Table 6.2).
6.3.2 CXOGC J174535.5–290124
The X-ray source CXOGC J174535.5–290124 is located only ∼ 14′′ away from AXJ1745.6–2901 (see Figure 6.1). This transient was discovered in 2001 during a mon-itoring campaign of the GC with Chandra (Muno et al. 2004). Since then, the sourcehas been detected in outburst multiple times with Chandra, XMM-Newton and Swift,displaying typical luminosities of ∼ 1033−34 erg s−1 (Muno et al. 2005b; Wijnandset al. 2005c, 2006b; Degenaar et al. 2008a; Degenaar & Wijnands 2009). In qui-escence, the source has not been detected, yielding an upper limit on luminosity of< 9 × 1030 erg s−1 (2–8 keV; Muno et al. 2005b).
Swift/XRT cannot spatially resolve CXOGC J174535.5–290124 and AX J1745.6–2901 when the latter, which is the brightest of the two, is active. We can thereforeonly deduce information on the activity of CXOGC J174535.5–290124 from Swiftdata obtained in epochs that AX J1745.6–2901 is quiescent, which is 2006 July–November and 2008 September onwards (see Section 6.3.1). In 2006, the Swift/XRTobservations captured an outburst from CXOGC J174535.5–290124 that had a dura-tion of > 12 weeks (Degenaar & Wijnands 2009).
Renewed activity of CXOGC J174535.5–290124 was revealed by Chandra ob-servations obtained on 2008 May 10–11, when the source displayed a 2–10 keVluminosity of a few times 1033 erg s−1 (Degenaar et al. 2008b). After AX J1745.6–2901 had returned to quiescence in 2008 September, CXOGC J174535.5–290124was continuously detected until the monitoring observations ended on 2008 October30. This outburst thus lasted for > 8 weeks. If the activity observed by Swift/XRTwas part of the same outburst that was detected by Chandra in 2008 May, the outburstduration increases to > 24 weeks. Alternatively, if the source returned to quiescencein between, the dormant phase must have lasted < 18 weeks. The source was notfound active during the 2009 observations (see Figure 6.2).
The average 2–10 keV unabsorbed flux observed with Swift/XRT in 2008 was∼ 1× 10⁻¹² erg cm−2 s−1, a factor ∼ 1.5 lower than observed in 2006 (see Table 6.1).For an outburst duration of > 8 weeks, we can constrain the fluence of the 2008outburst to be > 7× 10⁻⁶ erg cm−2 (2–10 keV). This increases to > 2× 10⁻⁵ erg cm−2
if the outburst endured for more than 24 weeks. The spectrum of CXOGC J174535.5–290124 is heavily absorbed (NH = (12.0 ± 6.9) × 1022 cm−2) and for both outburstswe obtain a rather hard spectral index of Γ ∼ 1, although the uncertainties on thisparameter are very large (see Table 6.1). The X-ray spectra of the 2006 and 2008outbursts are shown in Figure 6.3.
110

6.3 X-ray lightcurves and spectra
AX J1745.6-29012007
2008
2006
5
10
−3
0.0
10.1
Norm
alized c
ounts
s−
1 k
eV
−1
Energy (keV)
3
2006
2008
510−5
10−4
10−3
Normalized counts s
−1 keV
−1
Energy (keV)
CXOGC J174535.5−290124
3
GRS 1741.9-2853
2006
2009
2007
5
10
−3
0.0
10.1
Norm
alized c
ounts
s−
1 k
eV
−1
Energy (keV)
3
2008 outburst
2008 low level activity
5
10
−3
0.0
1
Norm
alized c
ounts
s−
1 k
eV
−1
Energy (keV)
XMM J174457−2850.3
3
5
10−3
5×10⁻⁴
2×10⁻³
Normalized counts s
−1 keV
−1
Energy (keV)
CXOGC J174538.0−290022
3
Figure 6.3: Background corrected Swift/XRT average outburst spectra. For AX J1745.6–2901, CX-OGC J174535.5–290124 and GRS 1741–2853, spectra of the different outbursts captured during the2006–2009 Swift/XRT monitoring are plotted together. The plot of XMM J174457–2850.3 shows theaverage outburst spectrum of the source in 2008, as well as the spectrum of the low-level activity ob-served in the months following this outburst.
111

6 A four-year baseline Swift study of enigmatic X-ray transients
6.3.3 GRS 1741–2853
GRS 1741–2853 was discovered in 1990 March–April by the Granat satellite (Sun-yaev 1990). Since then, the system has been detected in outburst on multiple occa-sions with 2–10 keV luminosities of ∼ 1036 erg s−1 (e.g., Sakano et al. 2002; Munoet al. 2003a; Wijnands et al. 2006a; Trap et al. 2009). In quiescence the source dis-plays a luminosity of ∼ 1032 erg s−1 (Muno et al. 2003a). The detection of thermonu-clear X-ray bursts by BeppoSAX established that this system is an LMXB harbouringa neutron star (Cocchi et al. 1999).
Between 2006 September 14–20, the Swift/XRT monitoring observations de-tected a short (∼1 week) outburst from GRS 1741–2853, which reached a 2–10 keVpeak luminosity of only ∼ 9 × 1034 erg s−1. This is markedly lower than otheroutbursts observed from this source (LX ∼ 1036−37 erg s−1). In 2007 February–April, the source experienced a longer (>13 weeks) and brighter (2–10 keV peakLX ∼ 2 × 1036 erg s−1) outburst, which was captured by several satellites (Kuulkerset al. 2007b; Porquet et al. 2007; Muno et al. 2007b; Degenaar & Wijnands 2009).
GRS 1741–2853 remained dormant throughout the 2008 Swift monitoring cam-paign (see Figure 6.2), but experienced another accretion outburst in 2009 October,which was registered by Integral and Swift (Chenevez et al. 2009b; Kennea 2009).While GRS 1741–2853 was not detected during Swift/XRT observations performedon 2009 September 23, it was found active on 2009 September 29 and the flux startedto rise in the following days (Kennea 2009, see also Figure 6.2). The source inten-sity had decayed to the background level during the last observation of the campaign,performed on 2009 November 1. This suggests that the 2009 outburst had a durationof 4–5 weeks. The outburst reached a peak luminosity of ∼ 1 × 1037 erg s−1, whilethe average outburst value was ∼ 2 × 1036 erg s−1 (2–10 keV; see Table 6.1). To ourknowledge, this is the highest peak luminosity ever reported for GRS 1741–2853.
By fitting the data of the three outbursts simultaneously, we obtain a hydrogencolumn density of NH = (14.0 ± 0.7) × 1022 cm−2. The X-ray spectra, displayed inFigure 6.3, are soft with powerlaw indices of Γ = 5.0 ± 2.5, 2.6 ± 0.1 and 3.0 ± 0.2for the 2006, 2007 and 2009 activity, respectively. The uncertainty on the spectralindex of the short and weak 2006 outburst is very large, but comparing the 2007 and2009 outburst data suggests that the X-ray spectrum is softer for the brightest of thetwo outbursts. Using a duration of 4–5 weeks and an average unabsorbed flux of∼ 2.8 × 10⁻¹⁰ erg cm−2 s−1 (see Table 6.1), we can estimate that the 2009 outburstof GRS 1741–2853 had a 2–10 keV fluence of ∼ 8 × 10⁻⁴ erg cm−2. Despite the dif-ferent outburst duration and peak luminosity, this is comparable to the 2007 outburstobserved by Swift/XRT (see Table 6.2).
112

6.3 X-ray lightcurves and spectra
Table 6.1: Results from fitting the X-ray spectral data.
Source nameYear NH Γ χ2
ν (d.o.f.) FabsX Funabs
X FpeakX LX Lpeak
X
AX J1745.6–29012008 23.8 ± 0.5 2.7 ± 0.1 1.10 (1427) 22.5 ± 0.2 93.2 ± 5.5 710 71 5502007 23.8 ± 0.5 2.7 ± 0.1 1.10 (1427) 45.2 ± 0.3 187.7 ± 7.5 800 145 6102006 23.8 ± 0.5 2.4 ± 0.1 1.10 (1427) 14.8 ± 0.2 53.3 ± 2.2 120 41 92
CXOGC J174535.5–2901242008 12.0 ± 6.9 1.0 ± 1.6 1.23 (25) 0.9 ± 0.3 1.4 ± 0.6 2.6 1.1 2.02006 12.0 ± 6.9 0.8 ± 1.0 1.23 (25) 1.3 ± 0.2 2.1 ± 0.6 4.0 1.6 3.0
GRS 1741–28532009 14.0 ± 0.7 3.0 ± 0.2 0.99 (416) 87.2 ± 1.5 283.6 ± 2.2 2200 176 13002007 14.0 ± 0.7 2.6 ± 0.1 0.99 (416) 61.7 ± 1.0 174.9 ± 1.2 260 109 1502006 14.0 ± 0.7 5.0 ± 2.5 0.99 (416) 0.6 ± 0.3 5.0 ± 3.7 12 3.1 7.0
XMM J174457–2850.32009 7.5 ± 2.9 2.3 ± 1.1 0.83 (29) 11.5 ± 1.8 21.3 ± 6.4 21.8 16 172008 7.5 ± 2.9 1.6 ± 0.6 0.83 (29) 20.7 ± 2.0 32.4 ± 5.4 250 25 190–low 7.5 ± 2.9 1.8 ± 1.4 0.83 (29) 0.5 ± 0.2 0.8 ± 0.2 3.6 0.6 2.82007 7.5 fix 1.8 fix 0.4 0.6 1.5 0.4 1.1
CXOGC J174538.0–2900222009 12.8 ± 5.9 1.4 ± 0.9 1.14 (21) 2.7 ± 0.5 5.0 ± 1.4 21.8 3.8 17
Note.– For sources that displayed multiple outbursts, we fitted the different outburst spectra simul-taneously with the hydrogen column density (given in units of 1022 cm−2) tied. The 2006 and 2007data (discussed by Degenaar & Wijnands 2009) are re-fitted in this work. Fluxes and luminosi-ties are for the 2–10 keV energy band and given in units of 10−12 erg cm−2 s−1 and 1034 erg s−1,respectively. FX,abs and FX,unabs represent the mean absorbed and unabsorbed outburst fluxes,while Fpeak
X is the unabsorbed peak flux. LX and LpeakX are the average and peak outburst lumi-
nosity, respectively. These are calculated from the unabsorbed fluxes by adopting a distance of7.2 kpc for GRS 1741–2853 and 8 kpc for all other sources. Fluxes for the 2007 activity of XMMJ174457–2850.3 were deduced using , for fixed values of NH and Γ.
6.3.4 XMM J174457–2850.3
XMM J174457–2850.3 is a transient X-ray source that was first detected in outburstwith XMM-Newton in 2001 September, when it displayed a 2–10 keV luminosity of∼ 5 × 1034 erg s−1 (Sakano et al. 2005). Since its initial discovery, XMM J174457–2850.3 has been active repeatedly, displaying 2–10 keV X-ray luminosities in a broadrange of a few times ∼ 1033 erg s−1, up to ∼ 1036 erg s−1 (Wijnands et al. 2006a;Muno et al. 2007b).
As mentioned earlier, XMM J174457–2850.3 is only in FOV in a sub-set of theSwift/XRT monitoring data, due to its relatively large offset from Sgr A∗ (∼ 13.7′).
113

6 A four-year baseline Swift study of enigmatic X-ray transients
The source was never in FOV during the 2006 observations. In 2007, the source fieldwas covered a few times between July and November, and XMM J174457–2850.3was detected at 2–10 keV luminosities of ∼ 1033−34 erg s−1 (Degenaar & Wijnands2009). When the source first came into view in 2008, on June 28, it displayed a 2–10keV X-ray luminosity of ∼ 1 × 1036 erg s−1. The source intensity decreased over thecourse of a few days, down to a level of a few times 1033 erg s−1 around 2008 July 7(see Figure 6.2).
Following this decay, the source remained to be detected by Swift/XRT all throughthe end of the monitoring observations on 2008 October 30. During this episode,XMM J174457–2850.3 displayed a 2–10 keV luminosity of a few times 1033 erg s−1,which is a factor > 10 above its quiescent level of ∼ 1032 erg s−1 (Sakano et al. 2005).We extracted separate spectra of the bright outburst (2008 June 28–July 7), as well asthe low-level activity that followed (2008 July 8–October 30). Both spectra are shownin Figure 6.3 and the spectral parameters and fluxes are listed in Table 6.1. We notethat the source is not detected in our Chandra monitoring observations of the GC per-formed on 2008 May 10 (Degenaar et al. in preparation), which implies that the 2–10keV luminosity of XMM J174457–2850.3 was lower than a few times 1033 erg s−1 atthat time. The bright active state (2–10 keV luminosity of ∼ 1035−36 erg s−1) detectedin 2008 late-June thus lasted < 49 days (< 7 weeks).
In 2009, the source was detected during a single Swift pointing performed onSeptember 29, at a luminosity of ∼ 2 × 1035 erg s−1 (2–10 keV). The spectrum ofthis observation largely overlays the average spectrum of the 2008 outburst and istherefore not plotted in Figure 6.3. XMM J174457–2850.3 is not active in the pre-ceding, nor in the subsequent observation, carried out on September 23 and October2, respectively. This implies that the activity lasted less than 9 days.
For the different outbursts captured by Swift between 2006–2009, we obtainspectral parameters that are comparable to the outburst values reported by Sakanoet al. (2005) using XMM-Newton and Chandra data obtained in 2001. The sourceis heavily absorbed (NH = (7.5 ± 2.9) × 1022 cm−2) and the powerlaw index adaptsvalues of Γ ∼ 1.5 − 2.5, with large uncertainties due to the low statistics (see Ta-ble 6.1). There is no obvious correlation between the spectral index and the sourceflux. The 2–10 keV fluence of the different outbursts of XMM J174457–2850.3 variesbetween ∼ (0.4 − 10) × 10−5 erg cm−2 (see Table 6.2), with an average value of∼ 2.5 × 10⁻⁵ erg cm−2.
6.3.5 CXOGC J174538.0–290022
The X-ray source CXOGC J174538.0–290022 was discovered during Chandra mon-itoring observations of the GC (Muno et al. 2003b). Between 1999 and 2004, Chan-dra detected the source at a minimum and maximum luminosity of ∼ 1 × 1033 and
114

6.4 Discussion
∼ 3 × 1034 erg s−1, respectively (2–8 keV; Muno et al. 2005b). The source was notdetected during the Swift/XRT monitoring observations carried out in 2006, 2007 and2008 (see Figure 6.2).
CXOGC J174538.0–290022 was reported active as seen during XMM-Newtonobservations obtained between 2009 April 1–5, displaying a 2–10 keV luminosity of∼ 2× 1034 erg s−1 (Ponti et al. 2009). A ∼ 4.6 ks Swift/XRT ToO pointing performedon 2009 May 17, about 6 weeks after the XMM-Newton detection, found the sourcestill in outburst. The Swift monitoring observations of the GC resumed on 2009June 4, and the source is clearly detected by visual inspection until 2009 mid-July.The average luminosity during this episode is ∼ 9 × 1034 erg s−1, peaking at ∼ 2 ×1035 erg s−1 (2–10 keV).
Although no clear source activity is apparent in individual exposures obtainedafter 2009 mid-July, summing the data from this period till the end of the monitoringobservations (2009 November 1), does result in a weak detection of the source. Theaverage luminosity during this episode is ∼ 1 × 1034 erg s−1. Figure 6.3 displaysthe average Swift/XRT spectrum of the entire active period, i.e., from 2009 May–November. The spectral parameters and fluxes are listed in Table 6.1.
The outburst captured by Swift had a duration of > 9 weeks. It is likely thatthe source was continuously active between the XMM-Newton detection and theSwift/XRT observations, which would imply that the outburst had a duration of morethan 30 weeks. We note that the source is not detected during the 2010 monitoringobservations, which commenced on 2010 April 4. This implies that the outburst ofCXOGC J174538.0–290022 was shorter than 52 weeks. The spectral parameters de-duced from fitting the XRT data (NH = (12.8 ± 5.9) × 1022 cm−2 and Γ = 1.4 ± 0.9;see Table 6.1) are similar to the values inferred from XMM-Newton observations ob-tained in 2008 early-April (Ponti et al. 2009). If we assume an outburst duration of30–52 weeks, the average unabsorbed flux of ∼ 5 × 10⁻¹² erg cm−2 s−1 implies a2–10 keV outburst fluence of ∼ (9 − 20) × 10−5 erg cm−2 (see Table 6.2).
6.4 Discussion
In this work, we analysed the lightcurves and spectra of five different X-ray transientsthat were found active during Swift/XRT monitoring observations of the GC carriedout in 2008 and 2009. The four sources AX J1745.6–2901, CXOGC J174535.5–290124, GRS 1741–2853 and XMM J174457–2850.3 were also active between 2006and 2007, while CXOGC J174538.0–290022 was detected for the first time with Swiftin 2009. The two brightest transients, AX J1745.6–2901 and GRS 1741–2853, areboth confirmed neutron star LMXBs (based on the detection of thermonuclear X-raybursts), while the other three are unclassified X-ray sources.
115

6 A four-year baseline Swift study of enigmatic X-ray transients
AX J1745.6–2901 was observed to return to quiescence in 2008 September, fol-lowing an unusually long accretion episode that started before 2007 February andendured for & 1.5 years. In 2009, the Swift/XRT observations captured the brightestoutburst ever reported for GRS 1741–2853, which reached up to a 2–10 keV peak lu-minosity of 1.3 × 1037 erg s−1. Both sources appear to have rather soft X-ray spectrawith powerlaw indices that are higher (Γ ∼ 2.5 − 3.0; see Table 6.1) than typicallyfound for brighter neutron star LMXBs (Γ ∼ 2). Furthermore, the 2008–2009 dataset reveals that although XMM J174457–2850.3 exhibits outbursts with peak lumi-nosities around ∼ 1 × 1036 erg s−1, it can also spend long episodes at a much loweractive level of ∼ 1033−34 erg s−1 (2–10 keV).
CXOGC J174535.5–290124 and CXOGC J174538.0–290022 both display verylow 2–10 keV peak luminosities of ∼ 1034−35 erg s−1 and have never been detected athigher levels. CXOGC J174535.5–290124 was active in 2008, while a previous out-burst was detected with Swift/XRT in 2006 (Degenaar & Wijnands 2009). This con-firms that this system has a relatively high duty cycle. CXOGC J174538.0–290022displayed an outburst peak luminosity of ∼ 2 × 1035 erg s−1 (2–10 keV), which is∼ 2 orders of magnitude higher than the lowest luminosity detected during Chandraobservations of the GC carried out between 1999 and 2004 (∼ 1 × 1033 erg s−1 inthe 2–8 keV band; Muno et al. 2005b). This unambiguously demonstrates the tran-sient nature of this source. If CXOGC J174538.0–290022 is an X-ray binary and itsquiescent luminosity is ∼ 1 × 1033 erg s−1 (Muno et al. 2005b), this would favour aneutron star as the compact primary, since black hole systems are typically fainterin their quiescent states unless the orbital period is several days (e.g., Narayan et al.1997; Menou et al. 1999; Lasota 2007).
In 2006, the Swift/XRT monitoring campaign of the GC detected activity of threeother transients, CXOGC J174540.0–290005, Swift J174553.7–290347 (likely asso-ciated to CXOGC J174553.8–290346) and Swift J174622.1–290634 (Degenaar &Wijnands 2009). The former two both experienced short outbursts (∼ 2 weeks) with2–10 keV peak luminosities of ∼ 2× 1035 erg s−1. These two sources are not detectedduring the 2008–2009 observations, which confirms that these systems have low dutycycles (Degenaar & Wijnands 2009, see also Table 6.2). The newly discovered tran-sient Swift J174622.1–290634 was active for ∼ 5 weeks in 2006 and reached a peakluminosity of ∼ 7 × 1034 erg s−1 (2–10 keV). This source has a relatively large offsetfrom Sgr A∗ (∼ 11′) and was only in FOV during 39 and 4 pointings in 2008 and2009, respectively. No activity is detected from the source during these observations.
116

6.4 Discussion
6.4.1 Peculiar source properties
Lightcurve morphology of AX J1745.6–2901
As discussed in Section 6.3.1, the Swift/XRT observations of the GC exposed two dis-tinct outbursts from AX J1745.6–2901 between 2006 and 2009, which are very differ-ent in terms of duration and luminosity (see Tables 6.1 and 6.2). Since AX J1745.6–2901 is a confirmed neutron star LMXB, the disc instability model is thought toprovide the framework to explain the outburst behaviour of this source.
The average 2–10 keV luminosity during the 2007–2008 outburst was ∼ 1 ×1036 erg s−1 (see Table 6.1). Assuming that the bolometric luminosity is a factor of∼ 3 higher (e.g., in’t Zand et al. 2007), this implies a mass-accretion rate of 〈M〉ob ∼
3 × 10⁻¹⁰ M� yr−1 for a canonical neutron star with M = 1.4 M� and R = 10 km.For an outburst duration of 1.5 years, this corresponds to a total accreted disc mass of∼ 5×10⁻¹⁰ M�. In 2006, the outburst had an average luminosity of ∼ 4×1035 erg s−1
and a duration of > 16 weeks, which would translate into a mean mass-accretion rateof 〈M〉ob ∼ 1 × 10⁻¹⁰ M� yr−1 and a total accreted mass of & 3 × 10⁻¹¹ M�.
Given the fact that AX J1745.6–2901 is transient, the mass-transfer rate from thecompanion star must be lower than the accretion rate onto the compact object duringoutburst (e.g., King & Ritter 1998), i.e., 〈M〉tr . 1×10⁻¹⁰ M� yr−1 (as estimated fromthe 2006 outburst; see Table 6.2). If the mass-transfer rate from the companion stardoes not change considerably over time, it would thus take the system at least 5 yearsto build up the accretion disc that powered the 2007–2008 outburst from scratch.This is consistent with the fact that no similarly long outbursts from this source havebeen observed between 1994 and 2006 (see Section 6.3.1). The duty cycle of similar1.5-year long outbursts from this system would thus be . 23%. This is in agreementwith observational constraints, which result in an estimated duty cycle of 10 − 30%(Degenaar & Wijnands 2009). Given the time required to build up an accretion discthat can account for the 2007–2008 activity, and the observed quiescence intervalbetween the 2006 and 2007–2008 outbursts of only ∼ 4 − 7 months (Degenaar &Wijnands 2009, see also Figure 6.2), it seems that a significant residual accretiondisc must have remained after the 2006 outburst ended. Shorter outbursts like the oneobserved in 2006 consume much less disc mass and could recur on a time scale ofa only a few months. As mentioned in Section 6.3.1, AX J1745.6–2901 was againreported in outburst in 2010 June, displaying a similar intensity level as in 2006(Degenaar et al. 2010c).
Within the disc instability model, we can understand the observed behaviour ifin 2006 only part of the accretion disc became ionized, while the 2007–2008 out-burst drained a larger part of (or maybe the full) accretion disc (see, e.g., King &Ritter 1998; Lasota 2001). This picture might also provide an explanation for the
117

6 A four-year baseline Swift study of enigmatic X-ray transients
fact that the 2006 outburst was fainter than the one observed in 2007–2008, sincethe mass-accretion rate (and thus the accretion luminosity) is expected to scale withthe size of the hot ionized zone of the accretion disc (see King & Ritter 1998). Wenote that the disc instability model for accreting white dwarfs predicts alternatingsequences of outbursts with different duration and brightness, consistent with obser-vations of dwarf novae eruptions (e.g., Cannizzo 1993; Lasota 2001). While drivenby the same underlying mechanism, it is thought that in LMXBs the stability proper-ties are strongly influenced by irradiation of the accretion disc (King & Ritter 1998;Lasota 2001). As a consequence, LMXBs are expected to consume a larger part ofthe accretion disc during outbursts, which are therefore longer and less frequent thanobserved for dwarf novae (King & Ritter 1998; Lasota 2001).
Recurrence time of GRS 1741–2853
Despite the different duration and average flux, the fluence of the 2009 outburst ofGRS 1741–2853 is comparable to the 2007 outburst fluence of ∼ 1 × 10⁻³ erg cm−2
(see Table 6.2). The two outbursts are separated by an epoch of ∼ 2.5 year. Thetotal mass accreted during the 2007 outburst can be estimated as & 7 × 10⁻¹¹ M�(for tob > 13 weeks and 〈M〉ob ∼ 3 × 10⁻¹⁰ M� yr−1). For the 2009 outburst weobtain a comparable value of ∼ 4 × 10⁻¹¹ M� (tob ∼ 4 − 5 weeks and 〈M〉ob ∼
5 × 10⁻¹⁰ M� yr−1).In 2005, GRS 1741–2853 also underwent an accretion outburst that endured for
several weeks. The rise of this outburst was captured by Integral in 2005 early-April(Kuulkers et al. 2007c), while Chandra observations indicated that the source wasfading in 2005 early-July (Wijnands et al. 2006a). This suggests an outburst durationof ∼ 13 weeks. Assuming an average 2–10 keV flux of ∼ 1 × 10⁻¹⁰ erg cm−2 s−1
(as inferred from Chandra observations performed in 2005 June; Wijnands et al.2006a), we can asses that the 2005 outburst had a 2–10 keV fluence of approximately∼ 8 × 10⁻⁴ erg cm−2. This is comparable to the two large outbursts occurring in2007 and 2009 (see Table 6.2). The time between the 2005 and the 2007 outburst isnearly 2 years. The total mass accreted during the 2005 outburst can be estimated as∼ 5 × 10⁻¹¹ M� (assuming tob ∼ 13 weeks and 〈M〉ob ∼ 2 × 10⁻¹⁰ M� yr−1). This isvery similar to the values estimated above for the 2007 and 2009 outbursts.
Based on the three outbursts observed for GRS 1741–2853 in the past 5 years(2005, 2007 and 2009, neglecting the weak and short outburst captured by Swiftin 2006) we can infer that the system has typical outburst duration on the order of∼ 10 weeks. The detection history in the past decade (see Trap et al. 2009, for anoverview), suggests a recurrence time of roughly ∼ 2 years. This implies a duty cycleof ∼ 10% and the average accretion rate during outburst appears to be typically a fewtimes 10−10 M� yr−1.
118

6.4 Discussion
XMM J174457–2850.3: a wind-fed system?
As discussed in Section 6.3.4, the unclassified transient X-ray source XMM J174457–2850.3 has a quiescent level of LX ∼ 1032 erg s−1, while the observed maximumluminosity is ∼ 1036 erg s−1 (2–10 keV). The 2008 Swift/XRT observations of theGC show that the bright stages of this source might only last for a few days, whileXMM J174457–2850.3 is often found at levels intermediate between quiescence andfull outburst, at a 2–10 keV luminosity of ∼ 1033−34 erg s−1. Such behaviour is dif-ficult to understand within the framework of accretion disc instabilities in LMXBs.Instead, wind accretion might provide a more natural explanation.
The activity displayed by XMM J174457–2850.3 is in some ways reminiscentof the behaviour observed from SFXTs, which harbour neutron stars accreting fromthe stellar wind of a supergiant O/B companion (e.g., Negueruela et al. 2006). Thesesystems undergo sporadic X-ray flares lasting only a few hours to days and reachingup to 2–10 keV luminosities of ∼ 1036−37 (e.g., Sidoli 2009). They seem to residein their quiescent states (LX ∼ 1032 erg s−1) only occasionally, and instead lingerthe majority of their time at levels of ∼ 1033−34 erg s−1 displaying X-ray spectra thatare well fit by a powerlaw model with a photon index in the range 1–2 (2–10 keV,e.g., Sidoli et al. 2008). Slow (i.e., a few seconds to minutes) pulsations have beendetected from a few of these systems (e.g., Sidoli 2009). An HMXB configurationwould be consistent with the possible detection of 5.25 s (0.19 Hz) pulsations fromXMM J174457–2850.3 in XMM-Newton observations (Sakano et al. 2005). However,since the data analysis was limited by both statistics and exposure, the reliability ofthe coherent signal was considered highly uncertain by these authors and this resulttherefore needs to be verified.
Laycock et al. (2005) report on I-band images of the field around XMM J174457–2850.3, obtained during an X-ray outburst in 2005 early-June. Using the IMACSimaging spectrograph mounted at the Magellan-Baade telescope, these authors detectan optical source with I = 22.04 ± 0.1 mag and R − I = 1.95 ± 0.2, a low extinction(AV ∼ 7 mag) and no variability. However, this object is located ∼ 3′′ NE fromthe Chandra coordinates of XMM J174457–2850.3, lying outside the 1.5′′ positionaluncertainty (Wijnands et al. 2006a), and is therefore likely not related. This impliesthat the optical counterpart of XMM J174457–2850.3 has a magnitude I > 25.6 mag(3σ upper limit; Laycock et al. 2005). Finding an optical counterpart is hamperedby the large extinction in the direction of the source. Using the relation of Predehl& Schmitt (1995), a hydrogen column of NH ∼ 7.5 × 1022 cm−2 (as inferred fromfitting X-ray spectral data; see Section 6.3.4) would translate into a visual extinctionof AV ∼ 42 mag. Since the extinction is much lower at longer wavelengths, it mightbe more fruitful to search for a counterpart in the infrared.
A recent study by Mauerhan et al. (2009) did not reveal any infrared objects as-
119

6 A four-year baseline Swift study of enigmatic X-ray transients
sociated with XMM J174457–2850.3, up to a limiting magnitude of Ks . 15.6 mag.The extinction in the Ks band can be estimated as AKs = 0.062 × AV ∼ 2.6 mag(Nishiyama et al. 2008). Using the tables of Drilling & Landolt (2000) and Toku-naga (2000) suggests that the survey of Mauerhan et al. (2009) should have enabledthe detection of an O/B supergiant (Ks ∼ 11 mag), as well as a main sequence starwith spectral type earlier than B3V. Since most known HMXBs have donor starswith spectral types from O9V–B2V (Negueruela 1998), XMM J174457–2850.3 isnot likely to be an HMXB unless the source is more distant than 8 kpc. Its behaviourtherefore remains puzzling.
Another possibility to explore is whether this source could be an LMXB in whicha neutron star is accreting from the wind of an M-gaint companion. Currently,only 8 of such symbiotic X-ray binaries have been identified (e.g., Masetti et al.2007; Nespoli et al. 2010). All of these systems show both long- and short-termX-ray variability and are characterised by 2–10 keV luminosities ranging between∼ 1032−35 erg s−1, although one object shows more intense X-ray emission of LX ∼
1036−37 erg s−1 (e.g., Masetti et al. 2007). However, for the extinction towards XMMJ174457–2850.3 and a distance of 8 kpc, an M-type giant would have a magnitude ofKs ∼ 11 − 13 mag (Drilling & Landolt 2000; Tokunaga 2000). The lack of a coun-terpart with Ks . 15.6 mag (Mauerhan et al. 2009) therefore renders this scenariounlikely as well unless the source is located at a larger distance than 8 kpc.
6.4.2 Mass-accretion rates
Amongst the different transients that are detected during the Swift/XRT monitoringobservations of the GC there are two LMXBs (AX J1745.6–2901 and GRS 1741–2853), whereas the others remain unclassified. However, the energies involved intheir outburst phenomena make it likely that these harbour accreting neutron stars orblack holes. Recently, Mauerhan et al. (2009) searched for near-infrared counterpartsto X-ray sources located towards the GC. Their catalogue reveals no counterparts forany of the unclassified transients detected during the Swift campaign, with a limit-ing magnitude of Ks . 15.6 mag. This suggests that these systems are likely tran-sient LMXBs rather than HMXBs (Muno et al. 2005b; Mauerhan et al. 2009). It istherefore interesting to estimate the mean accretion rate during the outbursts of thesesystems, 〈M〉ob, from which we can obtain an order of magnitude approximation forthe long-term averaged mass-accretion rates, when combined with estimates of theirduty cycles.
The time-averaged mass-accretion rate, 〈M〉long, is an important parameter forbinary evolution models that attempt to explain the nature of low-luminosity LMXBs(e.g., King & Wijnands 2006). We refer to Degenaar & Wijnands (2009) for thedetails of such calculations and the associated caveats. Here, we only calculate the
120

6.4 Discussion
Table 6.2: Overview of the outburst properties and estimated (time-averaged) mass-accretion rates.
Source nameYear tob F Duty cycle 〈M〉ob 〈M〉long
AX J1745.6–29012007–2008 > 80 > 7 × 10⁻³ 10 − 30% ∼ 3 × 10⁻¹⁰ ∼ (3 − 8) × 10−11
2006 > 16 & 5 × 10⁻⁴ 10 − 30% ∼ 1 × 10⁻¹⁰ ∼ (3 − 8) × 10−11
CXOGC J174535.5–2901242008 > 8 & 7 × 10⁻⁶ 20 − 50% ∼ 3 × 10⁻¹² ∼ (7 − 14) × 10−13
2006 > 12 & 2 × 10⁻⁵ 20 − 50% ∼ 4 × 10⁻¹² ∼ (7 − 14) × 10−13
GRS 1741–28532009 4 − 5 ∼ 8 × 10⁻⁴ 5 − 15% ∼ 5 × 10⁻¹⁰ ∼ (2 − 6) × 10−11
2007 > 13 & 1 × 10⁻³ 5 − 15% ∼ 3 × 10⁻¹⁰ ∼ (2 − 6) × 10−11
2006 < 1 . 3 × 10⁻⁶ 5 − 15% ∼ 8 × 10⁻¹² ∼ (2 − 6) × 10−11
XMM J174457–2850.32009 < 2 . 3 × 10⁻⁵ 5 − 50% ∼ 4 × 10⁻¹¹ ∼ (1 − 10) × 10−12
2008 1 − 7 ∼ (2 − 10) × 10−5 5 − 50% ∼ 6 × 10⁻¹¹ ∼ (1 − 10) × 10−12
2008-low > 16 & 3 × 10⁻⁵ 5 − 50% ∼ 2 × 10⁻¹² ∼ (1 − 10) × 10−12
2007 < 12 . 4 × 10⁻⁶ 5 − 50% ∼ 1 × 10⁻¹² ∼ (1 − 10) × 10−12
CXOGC J174538.0–2900222009 30 − 52 ∼ (9 − 20) × 10−5 5 − 20% ∼ 1 × 10⁻¹¹ ∼ (5 − 20) × 10−13
CXOGC J174540.0–2900052006 2 ∼ 1 × 10⁻⁵ 1 − 5% ∼ 2 × 10⁻¹¹ ∼ (3 − 13) × 10−13
Swift J174553.7–2903472006 2 ∼ 8 × 10⁻⁶ . 5% ∼ 2 × 10⁻¹¹ . 6 × 10⁻¹³
Swift J174622.1–2906342006 5 ∼ 5 × 10⁻⁶ . 14% ∼ 3 × 10⁻¹² . 4 × 10⁻¹³
Note. – The outburst duration, tob, is expressed in weeks. F represents the fluence of the outburstin units of erg cm−2 in the 2–10 keV energy band. 〈M〉ob is the estimated average accretionrate during outburst (M� yr−1) assuming a neutron star primary with M = 1.4 M� and R =10 km. The estimated time-averaged mass-accretion rate is given by 〈M〉long. Note that onlyAX J1745.6–2901 and GRS 1741–2853 are confirmed neutron star X-ray binaries, the other sixsources have an unknown nature.
(time-averaged) mass-accretion rates assuming a neutron star primary with MNS =1.4 M� and RNS = 10 km. These results are listed in Table 6.2. In case of a blackhole accretor with MBH = 10 M� and RBH = 30 km, the values given in this tablecan be multiplied with a factor ∼ 0.4, although one should bear in mind the caveatsdiscussed in Degenaar & Wijnands (2009).
The duty cycles of AX J1745.6–2901 and GRS 1741–2853 have been estimatedin Sections 6.4.1 and 6.4.1, respectively. For a discussion on the outburst and qui-
121

6 A four-year baseline Swift study of enigmatic X-ray transients
escent time scales of CXOGC J174535.5–290124 and XMM J174457–2850.3 werefer to Degenaar & Wijnands (2009), since the new 2008–2009 data leaves thoseestimates unaltered. As mentioned in Section 6.4, the Swift monitoring observationsdetected activity of three transients in 2006 (Degenaar & Wijnands 2009), that did notrecur in 2008–2009. Since Swift J174622.1–290634 was in FOV only during a smallnumber of pointings, we cannot refine the time-averaged mass-accretion rate for thissource. However, for CXOGC J174540.0–290005 and Swift J174553.7–290347, wecan put further constraints on the time that these systems spend in quiescence. In2008, daily observations were carried out for 36 consecutive weeks, which can thusbe used as a lower limit on the quiescent time scale of the two transients. Both CX-OGC J174540.0–290005 and Swift J174553.7–290347 exhibited an outburst with aduration of two weeks in 2006. This new constraint then puts their duty cycles at. 5%. Based on the 2006–2007 data set, duty cycles of . 6% and . 8% were es-timated for CXOGC J174540.0–290005 and Swift J174553.7–290347, respectively(Degenaar & Wijnands 2009). Since the former was also active in 2003 (Muno et al.2005b), the lower limit on its duty cycle is & 1% (Degenaar & Wijnands 2009).
CXOGC J174538.0–290022 was detected for the first time during the Swift/XRTobservations performed in 2009. The source was observed with a peak outburst lu-minosity of ∼ 2 × 1035 erg s−1. Apart from the 2009 activity, CXOGC J174538.0–290022 has been detected with a luminosity exceeding 1 × 1034 erg s−1 only oncebefore, in 1999 September with Chandra (Muno et al. 2005b). This implies thatthe quiescent time scale of this source is less than 10 years. On the other hand,the source was not found active throughout the 2006–2008 Swift/XRT monitoringcampaign. During those years, nearly daily observations were carried out, only inter-rupted for 17 weeks between 2006 November and 2007 March, for 15 weeks in theepoch 2007 November–2008 February (both due to Sun-angle constraints), and for6 weeks between 2007 August 11–September 26 (due to a safe-hold event; Gehrels2007). If an outburst duration of 30–52 weeks is typical for this source, we canthus put a lower limit on the quiescent time scale of ∼ 2.7 years (139 weeks), al-though shorter outbursts might have been missed. The duty cycle of this source isthen roughly between ∼ 5 − 20%, which results in a time-averaged mass-accretionrate of 〈M〉long ∼ (5− 20)× 10−13 M� yr−1 (see Table 6.2). Despite the apparent longoutburst duration, the estimated time-averaged accretion rate is amongst the lowestof the transients detected in the Swift/XRT monitoring campaign of the GC.
It can be seen from Table 6.2 that the two confirmed neutron star LMXBs AXJ1745.6–2901 and GRS 1741–2853 have estimated time-averaged mass-accretionrates of a few times 10−11 M� yr−1, which is not extraordinary low compared toother LMXBs. XMM J174457–2850.3 is also amongst the brightest transients de-tected during the Swift monitoring observations (Lpeak
X ∼ 1036 erg s−1) and this sys-
122

6.4 Discussion
tem appears to recur quite often. This results in a relatively high time-averaged mass-accretion rate (10−12 − 10−11 M� yr−1) compared to the other five transients listedin Table 6.2, which have lower outburst luminosities and lower estimated rates of〈M〉long . 2 × 10⁻¹² M� yr−1.
As mentioned above, the time-averaged mass-accretion rate is an important pa-rameter for binary evolution models. King & Wijnands (2006) construct a theo-retical toy model exploring the evolution of LMXBs at low accretion luminosities.The estimates of these authors show that if objects like CXOGC J174535.5–290124,CXOGC J174538.0–290022, CXOGC J174540.0–290005, Swift J174553.7–290347and Swift J174622.1–290634 are indeed X-ray binaries, their time-averaged mass-accretion rates suggests that the mass-donors are likely very low-mass or hydrogen-depleted stars. However, further refinement of their duty cycles and outburst energet-ics, as well as detailed evolutionary calculations, are required to grasp the nature ofthese peculiar objects.
6.4.3 Summary of the campaign 2006–2009
Starting in 2006 February and extending into 2009, the Swift/XRT monitoring cam-paign of the GC detected activity of 8 different transients in total, from which 14distinct outbursts were observed. All sources have experienced outbursts with peak2–10 keV luminosities Lpeak
X . 1036 erg s−1, although the two neutron star LMXBsAX J1745.6–2901 and GRS 1741–2853 both displayed brighter outbursts as well(Lpeak
X ∼ 1036−37 erg s−1). Two of the eight transients are newly discovered sources,which were both active in 2006 (Swift J174553.7–290347 and Swift J174622.1–290634; Degenaar & Wijnands 2009). Four of the eight transients were observedto recur over the 4-year time span of this campaign (see Table 6.2) and have rela-tively short recurrence times. These transients show a different peak flux, durationand lightcurve morphology from outburst to outburst, which is also seen in brighterX-ray transients (Chen et al. 1997).
Currently, there are 13 X-ray transients exhibiting 2–10 keV peak luminosities& 1034 erg s−1 known in the region covered by the Swift/XRT monitoring observa-tions.4 Out of these 13 transients, only 1A 1742–289 becomes brighter than LX >
1037 erg s−1 (2–10 keV; see Wijnands et al. 2006a, and references therein), whilethe remaining 12 undergo low-luminosity outbursts. The three sources AX J1745.6–2901, GRS 1741–2853 and XMM J174457–2850.3 are the brightest amongst theseand have 2–10 keV peak luminosities of 1036−37 erg s−1, but the other 9 transients
4The Swift monitoring observations cover all sources listed in table A.1 of Wijnands et al. (2006a)that are located within ∼ 14′ distance from Sgr A∗. In addition to the 11 objects from their list, two newtransients were discovered by Swift in 2006 (Swift J174553.7–290347 and Swift J174622.1–290634;Degenaar & Wijnands 2009).
123

6 A four-year baseline Swift study of enigmatic X-ray transients
have never been observed with luminosities exceeding 1036 erg s−1. From the 12 low-luminosity transients, 7 were observed to recur in the past decade and thus have rela-tively short recurrence times. The remaining 5 objects (CXOGC J174540.0–290031,CXOGC J174554.3–285454, XMM J174544–2913.0, Swift J174553.7–290347 andSwift J174622.1–290634) were seen active only once and thus seem to recur lessoften.
Despite the fact that > 250 ks of new Swift data was obtained, spread over almostdaily observations in 2008 and 2009, no new transients were found. Muno et al.(2009) suggested that given the extensive monitoring of the GC in the past years, allX-ray binaries that are located in that region and recur on a time scale of a decadehave been identified by now. The galactic population of X-ray binaries (both LMXBsand HMXBs) is expected to encompass ∼ 2000 objects (e.g., Verbunt & van denHeuvel 1995). The region around Sgr A∗ that has been monitored by Chandra, XMM-Newton and Swift in the past decade covers ∼ 1% of the stellar mass in the galacticdisc (Pfahl et al. 2002). In this region, ∼ 20 likely X-ray binaries have been identified(Muno et al. 2009). Most of these are transient sources and strikingly, the majorityhave very low 2–10 keV peak luminosities of . 1036 erg s−1 (Muno et al. 2005b;Wijnands et al. 2006a; Degenaar & Wijnands 2009).
The number of likely X-ray binaries that have been identified in the vicinity ofSgr A∗ is thus consistent with that expected from population synthesis models. How-ever, the GC has been monitored with instruments sensitive enough to detect low-luminosity transients only in the past decade and several of the currently knownsystems appear to have relatively short recurrence times compared to brighter X-ray transients (e.g., Chen et al. 1997). Continued monitoring of the GC is thereforeimportant to search for transient outbursts from new systems to better constrain thenumber of X-ray binaries located near Sgr A∗, and to gain more insight into the dutycycles of known systems.
AcknowledgmentsWe acknowledge the use of public data from the Swift data archive. This work wassupported by the Netherlands Organization for Scientific Research (NWO).
124