uva-dare (digital academic repository) detecting dopamine ... filedaergic function. we subsequently...
TRANSCRIPT

UvA-DARE is a service provided by the library of the University of Amsterdam (http://dare.uva.nl)
UvA-DARE (Digital Academic Repository)
Detecting dopamine dysfunction with pharmacological MRI
Schrantee, A.G.M.
Link to publication
Citation for published version (APA):Schrantee, A. G. M. (2016). Detecting dopamine dysfunction with pharmacological MRI. Vianen: UitgeverijBOXPress.
General rightsIt is not permitted to download or to forward/distribute the text or part of it without the consent of the author(s) and/or copyright holder(s),other than for strictly personal, individual use, unless the work is under an open content license (like Creative Commons).
Disclaimer/Complaints regulationsIf you believe that digital publication of certain material infringes any of your rights or (privacy) interests, please let the Library know, statingyour reasons. In case of a legitimate complaint, the Library will make the material inaccessible and/or remove it from the website. Please Askthe Library: https://uba.uva.nl/en/contact, or a letter to: Library of the University of Amsterdam, Secretariat, Singel 425, 1012 WP Amsterdam,The Netherlands. You will be contacted as soon as possible.
Download date: 12 Oct 2019
ChapterRepeated dexamphetamine treatment
alters the dopaminergic system and increases the phMRI response to
methylphenidate
Anouk Schrantee, Jordi L Tremoleda, Marzena Wylezinska-Arridge, Valentine Bouet, Peter Hesseling, Gideon F Meerhoff, Cora M de
Bruin, Jan Koeleman, Thomas Freret, Michel Boulouard, Emilie Desfosses, Laurent Galineau, Alessandro Gozzi, François Dauphin,
Willy Gsell, Jan Booij, Paul J Lucassen, Liesbeth Reneman
Plos One (under review)
3

Chapter 3
38
ABSTRACT
Background: Dexamphetamine (dAMPH) is a psychostimulant drug that is used both recreationally and as medication for attention deficit hyperactivity disorder. Preclinical studies have demonstrated that repeated exposure to AMPH can induce damage to nerve terminals of dopamine (DA) neurons. Methods: We here assessed the underlying neurobiological changes in the DA system following repeated dAMPH exposure and pre-treated rats with dAMPH or saline (4 times 5 mg/kg s.c., 2 hours apart), followed by a 1-week washout period. We then used pharmacological MRI (phMRI) with a methylphenidate (MPH) challenge, as a sensitive and non-invasive in-vivo measure of DAergic function. We subsequently validated the DA-ergic changes post-mortem, using a.o. high-performance liquid chromatography (HPLC) and autoradiography. Results: In the AMPH pre-treated group, we observed a significantly larger BOLD response to the MPH challenge, particularly in DA-ergic brain areas and their downstream projections. Subsequent autoradiography studies showed that AMPH pre-treatment significantly reduced DA transporter (DAT) density in the caudate-putamen (CPu) and nucleus accumbens, whereas HPLC analysis revealed increases in the DA metabolite homovanillic acid in the CPu. Conclusion: Our results suggest that AMPH pre-treatment alters DAergic responsivity, a change that can be detected with phMRI in rats. These phMRI changes likely reflect increased DA release together with reduced DAT binding. The ability to assess subtle synaptic changes using phMRI is promising for both preclinical studies of drug discovery, and for clinical studies where phMRI can be a useful tool to non-invasively investigate DA abnormalities, e.g. in neuropsychiatric disorders.

Increased dopamine phMRI response after dexamphetamine pre-treatment in rats
39
INTRODUCTION
Dexamphetamine (dAMPH) is a psychostimulant that is often used, both recreationally and for the treatment of attention-deficit/hyperactivity disorder (ADHD). Shortly after acute administration, dAMPH induces large increases in dopamine (DA) concentrations. However, repeated dAMPH treatment may cause lasting reductions in striatal DA, in its major metabolite dihydroxyphenylacetic acid (DOPAC), its rate-limiting enzyme tyrosine hydroxylase, its membrane transporter (DAT) and in the vesicular monoamine transporter (VMAT2) (Advokat, 2007; Berman et al, 2009; Gibb et al, 1994; McCann and Ricaurte, 2004), not only at high (toxic) doses, but likely also at already much lower doses such as those used to treat ADHD patients (Ricaurte et al, 2005). In addition to the reduction in DA-ergic presynaptic markers, repeated intermittent exposure to dAMPH can result in an exaggerated DA response (Boileau et al, 2006; Pierce and Kalivas, 1997), that is thought to be mediated by increased DA release and/or reductions in DA re-uptake and metabolism (Pierce and Kalivas, 1997). Recent studies have demonstrated the potential of pharmacological MRI (phMRI) as a meaningful tool to visualize DAergic dysfunction (Chen et al, 1997; Choi et al, 2006). PhMRI can measure evoked changes in brain hemodynamics as a result of neurotransmitter-specific drug challenges. Previous studies have demonstrated that phMRI can visualize the effects of DA neurotoxicity, which strongly correlated with measures of the DAT, DA concentrations and behavior (Chen et al, 1997; Jenkins et al, 2004). For example, DA neuron loss induced by strong and well-documented DAergic neurotoxins, such as 6-hydroxydopamine (6-OHDA) and 1-methyl-4-fenyl-1,2,3,6-tetrahydropyridine (MPTP) resulted in a blunted phMRI response in animals. More recent preclinical studies have demonstrated that phMRI can also visualize more complex alterations in DA-ergic nerve terminals in animal models of addiction (Gozzi et al, 2011) and autism (Squillace et al, 2014). As phMRI is non-invasive, it could potentially be a powerful tool to investigate effects of dAMPH treatment on the DA system of children and adolescents with ADHD. Here, we used phMRI to assess remodeling of the DA synapse in a rodent model of repeated dAMPH administration (Belcher et al, 2005), known to induce neurotoxic changes to the DA system, using phMRI. In order to further validate the neurobiological substrates underlying changes in phMRI signal, we assessed DAT as well as DA receptor alterations, DA levels and its metabolites using immunocytochemistry, autoradiography, ex vivo storage phosphor imaging and high-performance liquid chromatography (HPLC) analysis.
METHODS
PhMRI was used to assess DA functionality following a DA-ergic challenge with dAMPH. In the same rats, immunocytochemistry (ICC) was used afterwards to measure overall DAT and DA receptor levels. In different groups of rats with the same treatment protocol, in vitro autoradiography was used to assess DAT and DA D1 availability, ex vivo storage phosphor imaging to measure striatal DA D2/D3 receptor availability and high-performance liquid chromatography (HLPC) to assess in vivo levels of DA and its metabolites.
Chapter 3
40
Animal procedures and treatment All experiments were approved by the local animal ethical committee and carried out in strict accordance with European guidelines (EU Directive 2010/63/EU) to minimize animal suffering. The studies were conducted in adult male Sprague Dawley rats (Charles River, UK, Janvier Labs, France and Harlan, the Netherlands), weighing between 200-300 g. In all experiments, the rats were divided in two groups that received either treatment with dAMPH (5 mg/kg s.c. four times 2 hours apart) or with saline (also four times 2 hours apart s.c.), as this dose has been shown to induce damage in the DA synapse (Belcher et al, 2005). dAMPH (Sigma Aldrich) was dissolved in 0.9% saline and injected s.c. in a final volume of 1 ml/kg body weight. The phMRI experiments were carried out following a washout period of 7 days to ensure total dAMPH clearance. In addition, during the MRI experiment, half of the rats in each experimental group received 4 mg/kg methylphenidate (MPH) i.p. (Sigma Aldrich, UK) dissolved in 0.9% saline in a volume of 0.3 ml to challenge the DA system. The other half of the animals received a saline challenge (same volume). This resulted in 4 experimental groups for the phMRI: pre-treated saline with saline challenge (SAL-SAL, N=11), pre-treated saline with MPH challenge (SAL-MPH, N=10), pre-treated dAMPH with saline challenge (AMPH-SAL, N=10) and pre-treated dAMPH and challenge with MPH (AMPH-MPH, N=11). phMRI for DA functionality MRI experiments were performed using a 4.7 T Direct Drive Agilent (previously Varian, Palo Alto, CA) MRI system. Animals were placed in a linear radiofrequency coil with a volume with 72 mm inner diameter (m2m Imaging Corp., Cleveland OH, USA), which was used as a transmitter. The MR signal was received by four phased array coils (m2m Imaging Corp., Cleveland OH, USA) placed around the head of the animal. During the MRI scan, anesthesia was maintained with 1.5-2.0% isoflurane and animals were ventilated in a 70:30 mixture of medical air and oxygen. Ventilation parameters, body temperature and heart rate were monitored throughout the scan. For each animal, a T2 weighted anatomical image volume was acquired using a fast spin echo multi-slice sequence (fsems) with an echo train length of 8, matrix size= 256x256, FOV=35x35 mm, 24 contiguous interleaved 1 mm coronal slices, 4 averages, 2 dummy scans, effective repetition time (TReff)= 5112 ms, and effective echo time (TEeff)=60 ms. The time series were acquired using a gradient echo multi-slice (gems) sequence with 16 contiguous interleaved 1 mm slices centered to the same position as the anatomical image with TR=260 ms, TE=14 ms, flip angle 40 deg, 2 averages, 2 dummy scans, FOV=35x35 mm and matrix size of 128x96 (zero-fill to 128x128), covering the regions of interest. Fifty time points (acquisition time per time series volume was 50 s; total scan time of approximately 41 minutes) were acquired with an injection of the pharmacological challenge after acquisition of volume 12. MRI data analysis As a first step, the anatomical and time series data were converted to 4D Analyze format using ImageJ (Abramoff et al, 2004). For image processing, the pixel dimensions were scaled by a factor of 10 to ensure compatibility with analysis algorithms designed for human data. This resulted in a voxel size of 2.73 × 2.73 × 10 mm3 for the time series data. Pre-processing included motion correction, which was applied by re-aligning the functional data to the first dynamic volume. In addition, anatomical and time series data were manually re-aligned to a stereotactic

Increased dopamine phMRI response after dexamphetamine pre-treatment in rats
41
rat brain template (Schwarz et al, 2006) using Statistical Parametric Mapping (SPM) software. Then, we co-registered the structural data to the rat template with 3, 6 and 12 degrees of freedom, respectively. Subsequently the data were normalized using a non-linear frequency cut-off of 15Hz. Next, all transformations were applied to the functional data (Ashburner, 2007). Thereafter, the functional data were smoothed with a 3 x 3 x 7 mm Gaussian kernel. Finally, brain extraction was obtained by multiplying a binary mask from the rat template with the functional data. ROI-based analysis We hypothesized the BOLD signal in certain DA-rich areas to be different between groups and therefore carried out ROI analyses in the CPu and NAcc. Mean time series per group per ROI were extracted from unsmoothed BOLD time series using a 3D digital reconstruction of a rat brain atlas (Paxinos and Watson, 2005) co-registered with the anatomical MRI template (Schwarz et al, 2006), using IDL-based software (Research Systems Inc., Boulder, Colorado). The anatomical definitions of the ROIs can be found in Gozzi et al. (2008). Statistical significance was assessed using a repeated-measures analysis. Voxel-based analysis In addition to ROI-based analysis, whole brain analyses were conducted to explore the effects in regions downstream from DA projections. Image-based time series analysis was performed using FEAT v. 5.98, part of FSL (Jenkinson et al, 2012). First level analysis was conducted using a model based on exploratory data analysis to obtain the shape of the hemodynamic response. The design matrix was composed of this model and its temporal derivative. Higher-level mixed effect analysis was carried out using ordinary least squares simple mixed effects as implemented in FSL FEAT to determine group differences. Z (Gaussianised T/F) statistic images were thresholded using clusters determined by Z>1.6 and a (corrected) cluster significance threshold of p=0.05 (Worsley, 2001). The Paxinos and Watson rat brain atlas (2005) was used to identify location of significantly activated brain regions. Immunocytochemistry for GFAP, DAT, D1 and D2 assessments Following MRI, a subset of animals (N=15 dAMPH pre-treated, N=14 saline pre-treated) was perfused intracardially with saline followed by 4% paraformaldehyde in 0.1 M phosphate buffer (PB). To prevent pressure artefacts, brains were additionally post-fixed overnight in the skull at 4 °C. The fixed brains were then saturated in a solution of 15% sucrose in PB (PB, 0.1M, pH 7.4) followed by 30% sucrose in PB for cryoprotection after which they were frozen and coronally sectioned in a one-in-ten series at 30 μm on a sledge microtome (Jung AG, Heidelberg, Germany). Immunocytochemistry was performed in the CPu and NAcc for: DAT (polyclonal rabbit anti DAT 1:2000, Novus Biologicals NBP1-19013), D1 (monoclonal mouse anti-DA receptor D1a 1:2000, Millipore MAB5290), D2 (polyclonal rabbit anti DA receptor D2a 1:400, Millipore AB5084P), and glial fibrillary acidic protein (GFAP, polyclonal rabbit anti-GFAP 1:2000, Dako Z0334) as described in detail in the Supplementary Methods. Optical density was measured with the intensity function in ImageJ (Fiji, Image J) in one or multiple fixed-size regions. All sections were stained simultaneously and digitized with fixed settings. Light and
Chapter 3
42
background corrections were performed for all stainings except GFAP, due to the widespread distribution of GFAP. In vitro autoradiography for DAT and D1 assessments Animals (N=12 dAMPH pre-treated, N=12 saline pre-treated) were sedated with isoflurane and euthanized by cervical dislocation and the brains were rapidly removed, snap frozen and stored at -80°C. Frontal brain sections (14 µm) were cut and DAT and D1 autoradiography was performed on the CPu and NAcc. [3H]WIN35428 (Perkin-Elmer®, France; specific radioactivity = 3.034 MBq/nmol; 5 concentrations from 0.55 to 15.0 nM) was used for the DAT binding experiments according to protocols described before by Hebert (1999). Non-specific binding was determined by incubation of adjacent brain slices in the presence of 10 µM nomifensine. For the D1 binding experiments, [3H]SCH-23,390 (Perkin-Elmer®, France; specific radioactivity = 3.119 MBq/nmol; 5 concentrations from 0.10 to 8.1 nM) was used and performed according to the Savasta protocol (Savasta et al, 1986). Non-specific binding was determined by incubation of adjacent brain slices in the same conditions and in the presence of 10 µM SKF38393. Brain sections were exposed to tritium-sensitive phosphor imaging plates (Perkin-Elmer®) before acquisition of images (Cyclone®, Perkin-Elmer®). Specific binding was calculated as the difference between total and non-specific binding and Kd and Bmax values were derived from raw data using nonlinear fitting procedures (Prism®). Ex vivo storage phosphor imaging for D2/D3 assessments Seven days following treatment, rats (N=10 dAMPH pre-treated, N=10 saline pre-treated) were anesthetized with ketamine/xylazine mix followed by intravenous administration of approximately 50 MBq of the selective D2/D3 tracer [123I]IBZM (GE Healthcare, Eindhoven, the Netherlands) into the tail vein. Ninety minutes later, rats were sacrificed using cardiac puncture under anaesthesia, and the brain was removed and frozen in nitrogen, sliced into horizontal slices of 50 μm using a microtome cryostat at -21°C. Storage phosphor imaging was performed as described previously (Crunelle et al, 2009). In brief, every fifth slice was mounted on a glass plate and exposed to phosphor plates (Fuji BAS-MS IP) for the duration of 12 hours, allowing the phosphor plates to absorb energy emitted by radioactive decay from [123I]IBZM. The resulting luminescence emitted by the phosphor plates was scanned using a storage phosphor imager (GE Healthcare Typhoon FLA 7000) at a resolution of 25 μm using a 16-bit pixel depth, and analysed using ImageQuant TL Toolbox version 8.1. Regions of interest (ROIs) were the left and right CPu and the left and right NAcc, both DA-rich brain structures. The cerebellum was used to assess non-specific binding, as the cerebellum contains a negligible D2/D3 density (Knol et al, 2008). Specific dorsal CPu-to-cerebellum and NAcc-to-cerebellum ratios were obtained by dividing the average uptake per pixel of combined left and right CPu/NAcc parts by the average uptake per pixel of the cerebellum. Ex vivo HPLC for monoamine levels and metabolites Brains (N=11 dAMPH pre-treated, N=12 saline pre-treated) were rapidly dissected on cold plates; CPu and frontal cortex (FC) were dissected, weighed and stored at -80°C for further analysis. The tissue samples were homogenized for 30 min in 100 µl of an extraction solution (pH=3) constituted of the mobile phase supplemented with perchloric acid 0.1 M. The mobile

Increased dopamine phMRI response after dexamphetamine pre-treatment in rats
43
phase (MD-3MA, Thermo Scientific, France) was pumped at 0.4 mL/min with an isocratic high-performance liquid chromatography (UltiMate 3000 system, Thermo Scientific Dionex, France). Electrochemical detection (Coulochem III, Thermo Scientific Dionex, France) enabled the detection of monoamines and their metabolites. Peak quantification was determined using the Chromeleon 7.2 software (Thermo Scientific Dionex, France) and their concentrations derived from external standard curves. Concentrations of each compound were computed as the average of the two extracted values per sample. Statistics Sample sizes were based on a previous study (Belcher et al, 2005) with the same dosing regimen, taking into account possible drop-out due to complications of the treatment and/or MRI data quality. Power calculations showed that at least 10 rats per group were needed to detect an effect size of 1.8 (Cohen’s d). Rats were randomly assigned to either saline or dAMPH treatment per cage and blinding was used for final statistical analyses. Data were analyzed using two-sided independent t-tests or ANOVA to test for the effects of (i) repeated dAMPH administration (ii) acute effect of MPH challenge. Data were assessed for normality using the Shapiro-Wilk test and equality of variance using Levene’s test. In case assumptions were violated, non-parametric tests were used. Statistical analyses were performed using SPSS version 20.0 (IBM, Chicago) unless otherwise stated.
RESULTS
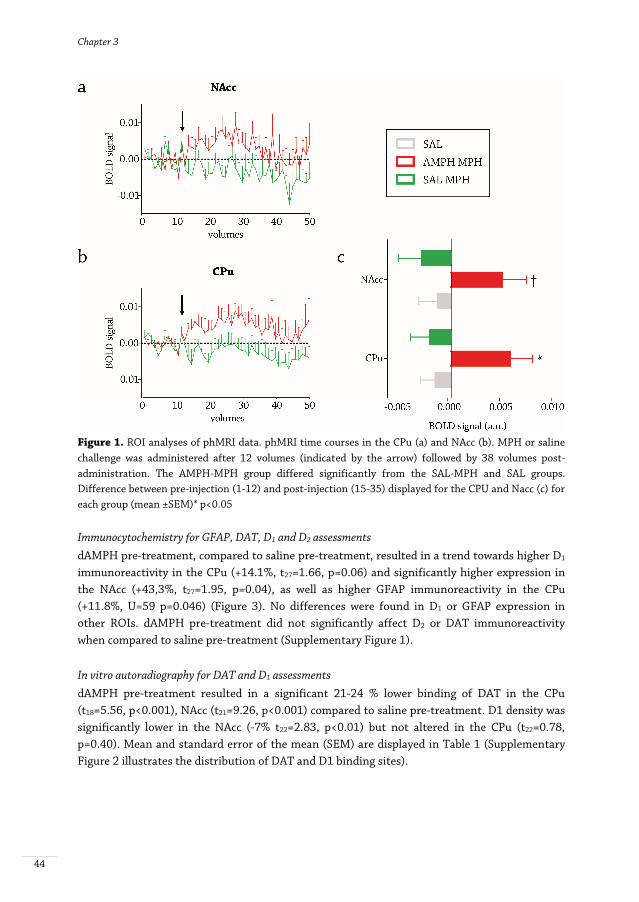
phMRI for DA-ergic functionality The acute MPH challenge induced a significant BOLD response in the AMPH-MPH group, but not in the SAL-MPH group relative to the SAL-SAL and AMPH-SAL groups combined (SAL), either in the CPu (AMPH-MPH: F=1.56 p<0.01; SAL-MPH: F=0.47 p=0.99) or the NAcc (AMPH-MPH: F=1.67 p<0.01; SAL-MPH: F=0.826 p=0.80) (Figure 1). The whole brain analyses were in agreement with the ROI analysis, demonstrating that an acute MPH challenge significantly activated a number of clusters of voxels in the thalamus, hippocampus (HC), CPu and cortically in fronto-temporal areas in the AMPH-MPH group (Figure 2) when compared to the vehicle groups together. In addition, the SAL-MPH group also showed small increases in BOLD signal compared to baseline in thalamus and temporal cortex. The acute MPH challenge only induced positive BOLD responses, but the extent of activation was much larger in the AMPH-MPH group than in the SAL-MPH group. In the SAL-MPH group, we observed small bilateral increases in activation in the thalamus and temporal cortex. In contrast, in the dAMPH pre-treated group, a large number of regions showed a bilateral increase in BOLD signal intensity, including the thalamus, HC, CPu and cortically in fronto-temporal areas. When the SAL-MPH and AMPH-MPH groups were compared directly, we found the strongest group differences in subcortical DA-rich structures, such as the striatum, thalamus and substantia nigra.
Chapter 3
44
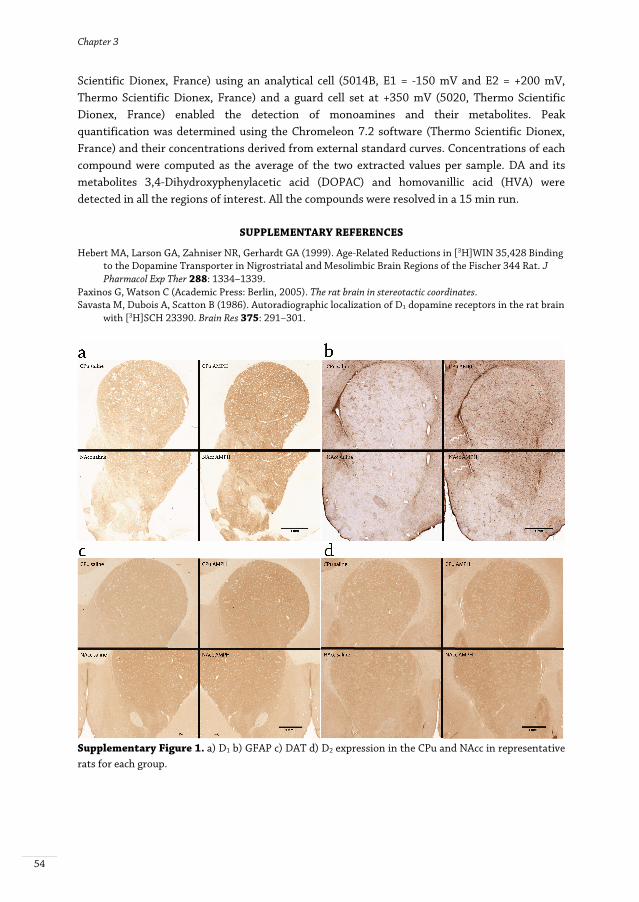
Figure 1. ROI analyses of phMRI data. phMRI time courses in the CPu (a) and NAcc (b). MPH or saline challenge was administered after 12 volumes (indicated by the arrow) followed by 38 volumes post-administration. The AMPH-MPH group differed significantly from the SAL-MPH and SAL groups. Difference between pre-injection (1-12) and post-injection (15-35) displayed for the CPU and Nacc (c) for each group (mean ±SEM)* p<0.05 Immunocytochemistry for GFAP, DAT, D1 and D2 assessments dAMPH pre-treatment, compared to saline pre-treatment, resulted in a trend towards higher D1 immunoreactivity in the CPu (+14.1%, t27=1.66, p=0.06) and significantly higher expression in the NAcc (+43,3%, t27=1.95, p=0.04), as well as higher GFAP immunoreactivity in the CPu (+11.8%, U=59 p=0.046) (Figure 3). No differences were found in D1 or GFAP expression in other ROIs. dAMPH pre-treatment did not significantly affect D2 or DAT immunoreactivity when compared to saline pre-treatment (Supplementary Figure 1). In vitro autoradiography for DAT and D1 assessments dAMPH pre-treatment resulted in a significant 21-24 % lower binding of DAT in the CPu (t18=5.56, p<0.001), NAcc (t21=9.26, p<0.001) compared to saline pre-treatment. D1 density was significantly lower in the NAcc (-7% t22=2.83, p<0.01) but not altered in the CPu (t22=0.78, p=0.40). Mean and standard error of the mean (SEM) are displayed in Table 1 (Supplementary Figure 2 illustrates the distribution of DAT and D1 binding sites).

Increased dopamine phMRI response after dexamphetamine pre-treatment in rats
45
Figure 2. Whole brain analyses of phMRI data. The three rows show 1 mm-thick coronal slices for different group comparisons: a) MPH challenge in saline-treated rats increased BOLD response compared to groups that received a saline challenge b) MPH challenge in dAMPH-pre-treated rats increased the BOLD response extensively c) dAMPH-pre-treated rats show increased BOLD response compared to the SALMPH group. Images are thresholded at Z=1.6
Figure 3. Immunocytochemistry. a) GFAP b) D1 c) DAT and d) D2 expression following dAMPH or saline pre-treatment in the NAcc and CPu (mean ±SEM) * p<0.05
Chapter 3
46
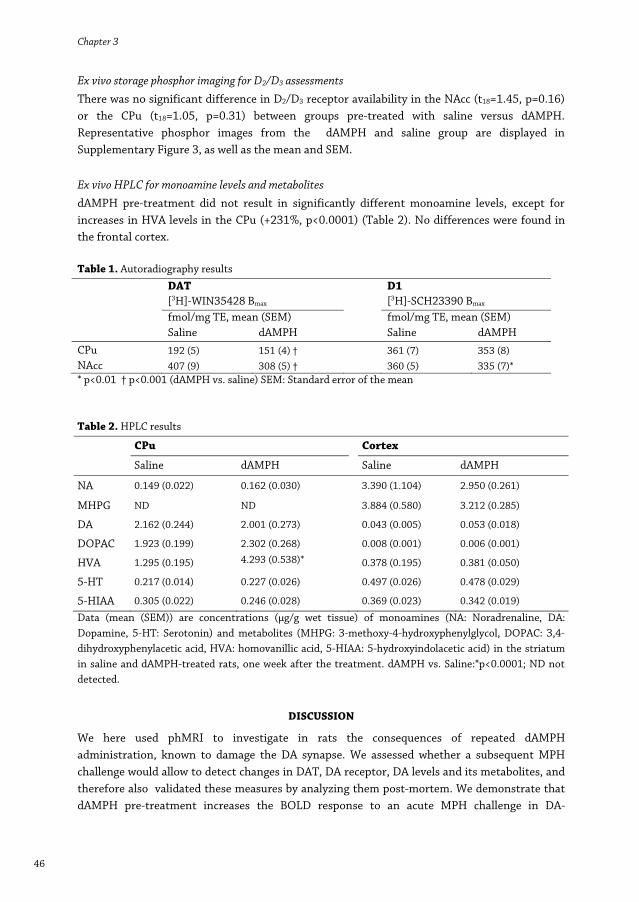
Ex vivo storage phosphor imaging for D2/D3 assessments There was no significant difference in D2/D3 receptor availability in the NAcc (t18=1.45, p=0.16) or the CPu (t18=1.05, p=0.31) between groups pre-treated with saline versus dAMPH. Representative phosphor images from the dAMPH and saline group are displayed in Supplementary Figure 3, as well as the mean and SEM. Ex vivo HPLC for monoamine levels and metabolites dAMPH pre-treatment did not result in significantly different monoamine levels, except for increases in HVA levels in the CPu (+231%, p<0.0001) (Table 2). No differences were found in the frontal cortex. Table 1. Autoradiography results DAT D1 [3H]-WIN35428 Bmax [3H]-SCH23390 Bmax fmol/mg TE, mean (SEM) fmol/mg TE, mean (SEM) Saline dAMPH Saline dAMPH CPu 192 (5) 151 (4) † 361 (7) 353 (8) NAcc 407 (9) 308 (5) † 360 (5) 335 (7)* * p<0.01 † p<0.001 (dAMPH vs. saline) SEM: Standard error of the mean Table 2. HPLC results
CPu Cortex
Saline dAMPH Saline dAMPH
NA 0.149 (0.022) 0.162 (0.030) 3.390 (1.104) 2.950 (0.261)
MHPG ND ND 3.884 (0.580) 3.212 (0.285)
DA 2.162 (0.244) 2.001 (0.273) 0.043 (0.005) 0.053 (0.018)
DOPAC 1.923 (0.199) 2.302 (0.268) 0.008 (0.001) 0.006 (0.001)
HVA 1.295 (0.195) 4.293 (0.538)* 0.378 (0.195) 0.381 (0.050)
5-HT 0.217 (0.014) 0.227 (0.026) 0.497 (0.026) 0.478 (0.029)
5-HIAA 0.305 (0.022) 0.246 (0.028) 0.369 (0.023) 0.342 (0.019)
Data (mean (SEM)) are concentrations (µg/g wet tissue) of monoamines (NA: Noradrenaline, DA: Dopamine, 5-HT: Serotonin) and metabolites (MHPG: 3-methoxy-4-hydroxyphenylglycol, DOPAC: 3,4-dihydroxyphenylacetic acid, HVA: homovanillic acid, 5-HIAA: 5-hydroxyindolacetic acid) in the striatum in saline and dAMPH-treated rats, one week after the treatment. dAMPH vs. Saline:*p<0.0001; ND not detected.
DISCUSSION
We here used phMRI to investigate in rats the consequences of repeated dAMPH administration, known to damage the DA synapse. We assessed whether a subsequent MPH challenge would allow to detect changes in DAT, DA receptor, DA levels and its metabolites, and therefore also validated these measures by analyzing them post-mortem. We demonstrate that dAMPH pre-treatment increases the BOLD response to an acute MPH challenge in DA-
Increased dopamine phMRI response after dexamphetamine pre-treatment in rats
47
innervated brain regions. The changes in BOLD response possibly reflect increased DA-ergic post-synaptic stimulation as supported by the higher HVA and reduced striatal DAT binding we found. However, based on autoradiography and ICC, contrasting results were found for D1 expression following dAMPH treatment. Repeated dAMPH treatment induced exacerbated BOLD response In accordance with Belcher et al. (2005), our dAMPH pre-treatment model induced reduction in DAT binding. In addition, the dAMPH pre-treatment induced a higher BOLD response to an acute MPH challenge in subcortical DA areas. This exacerbated DA-ergic response to MPH may either be due to an increase in DA release and/or a reduction in its re-uptake or metabolism. This would result in the presence of more DA in the synaptic cleft and hence an increase in post-synaptic neurotransmission in dAMPH pre-treated rats. Enhanced striatal DA release has been shown to induce both cortical and subcortical hemodynamic responses, reflecting its arousing and rewarding properties (Schwarz et al, 2007). When animals are repeatedly exposed to psychostimulant drugs, the re-administration of the drug after a period of withdrawal results in an exaggerated DA release, which is consistent with the exacerbated BOLD response we observed following the MPH challenge. Additionally, the presently observed reduction in DAT binding could result in a decreased re-uptake and therefore elevated DA levels, possibly further augmenting DA neurotransmission (Pierce and Kalivas, 1997). Interestingly, these findings differ from clinical studies from our group, in which we found a blunted phMRI response and striatal DA release in regular dAMPH users (Schouw et al, 2013; Schrantee et al, 2015). Yet, Boileau et al. (2006) found sensitization in humans who repeatedly received dAMPH under similar conditions. This discrepancy between rodent and human studies is also observed for the effects of cocaine (Narendran and Martinez, 2008) and may be due to differences in timing and duration of administration (i.e. at an early stage of drug abuse vs. dependence, or after a wash-out period) as well as to effects of the environmental context, i.e. in relation to reward anticipation. PhMRI studies reported in the literature have demonstrated that DA-ergic stimulants (including dAMPH and MPH) elicit significant changes in the hemodynamic response of DA-innervated brain regions of healthy animals (Chen et al, 1997; Jenkins et al, 2004). Yet in the saline pre-treated rats, we observed a small BOLD response as compared to dAMPH-pretreated rats. It has been demonstrated previously that low doses of dAMPH can induce a small hemodynamic responses, probably due to a higher affinity for D2 (auto)receptors. These autoreceptors are expressed on the pre-synaptic terminal and their stimulation results in a lower DA release. Alternatively, higher doses of dAMPH increase the phMRI signal more as a result of an increased binding of DA to D1 (Ren et al, 2009). The current literature is somewhat equivocal, with both increases and decreases of the phMRI signal being reported (Canese et al, 2009; Chen et al, 2010; Easton et al, 2009; Hewitt et al, 2005), which may relate to methodological differences, such as the route and dose of MPH administration as well as the ventilation protocol used. What neurobiological changes drive the phMRI response? We here observed that dAMPH treatment reduced DAT binding significantly in the CPu (-21 %) and NAcc (-24 %) as measured with [3H]WIN-35428 autoradiography. At first glance, this does
Chapter 3
48
not appear in concordance with our ICC findings where an no change in DAT was apparent. However, this can be explained by the fact that ICC measures the entire pool of DAT (i.e. intra- and extracellular, functional and not functional), whereas autoradiography assesses only the functional membrane DAT that can bind ligand. Hence, the autoradiography data suggest that the active pool of DAT, and/or their activity, is reduced in dAMPH-treated rats, corroborating our hypothesis of DAT-dependent changes in phMRI signal, whereas the entire pool (as measured with ICC) may have been increased as a compensatory response. Similarly, our results in D1 expression differ when measured with autoradiography and ICC. This suggests that although there might be an increase in the overall pool of D1 receptors, fewer receptors are functionally available (as supported by the autoradiography data), possibly due to an exaggerated DA neurotransmission. However, the reason for the increase in overall D1 levels remains elusive and requires further research. The concept of an dAMPH-induced disruption of normal DA-ergic functioning is further supported by the increases in GFAP, a classical marker of astrogliosis, as has been reported before under similar, as well as degenerative conditions (Fumagalli et al, 1998). Furthermore, levels of the DA metabolite HVA were elevated in dAMPH-pretreated rats while no differences were present in basal DA levels. Both DA and HVA were found to be increased following acute dAMPH (Bredeloux et al, 2007), likely as a result of reversed DA transport (Fumagalli et al, 1998) or internalization of DAT (Saunders et al, 2000), that would lead to an increase in the amount of DA in the synaptic cleft that can be metabolized. Moreover, the decreased DAT binding can result in less reuptake and more available DA to be metabolized (Gulley and Zahniser, 2003). In addition, acute (d)AMPH has been shown to inhibit the activity of the enzyme monoamine oxidase (MAO) (Fumagalli et al, 1998; Huotari et al, 2004), initially resulting in reduced DA metabolism. One explanation could therefore be that, following one-week of washout and disinhibition of MAO, DA metabolism is still increased, resulting in higher HVA levels. Alternatively, our phMRI data suggest a slower breakdown of the released DA due to deficient DAT reuptake, which might again increase DA metabolism and thus result in higher HVA levels. Interestingly, no changes in HVA were found in the frontal cortex, a region with lower DAT expression than the CPu, where catechol-O-methyltransferase (COMT) and MAO are thought to play a larger role in the modulation of DA neurotransmission (Huotari et al, 2004). This suggests that dAMPH-induced DAT deficiency has a larger impact on changes in DA metabolism in the CPu than in the frontal cortex. Methodological considerations This experiment used BOLD contrast to visualize hemodynamic changes, instead of contrast-enhanced cerebral blood volume (CBV) phMRI studies. Although CBV-weighted imaging might provide a higher sensitivity, BOLD contrast is more often used in the clinical research setting and our findings can therefore be more easily translated to the human situation. Nevertheless, human studies are typically performed without the use of anesthesia, which hampers a direct comparison between our animal work and such clinical studies. Although we cannot rule out the possibility that isoflurane has influenced our results, all groups received the same level of anesthesia, so this is unlikely this explains the large difference between our dAMPH and saline groups. Previous studies had further suggested, that similar levels of anesthesia, as in the present study, do not affect the sign and distribution of phMRI responses (Gozzi et al, 2008b).
Increased dopamine phMRI response after dexamphetamine pre-treatment in rats
49
Future experiments in awake rats could advance the comparability between animal and human studies. Systemically administered challenges can induce systemic changes to various physiological parameters that can hamper interpretation of the BOLD response. For these reasons, blood pressure and pCO2 levels were carefully monitored in our study while previous studies have shown that systemic changes as a result of i.v. administration with dAMPH did not affect phMRI results (Chen et al, 1997). We used i.p. administration of MPH, which will induce less systemic changes and these are therefore considered negligible for the interpretation of our results. Finally, it is important to note that psychostimulants such as dAMPH and MPH not only affect the DA system, but also act on the noradrenergic (NA) system and can have downstream effects on other neurotransmitter systems. Especially in cortical areas, where NA-ergic neurons are involved in regulating DA (Stahl, 2003), MPH-induced changes may, at least in theory, involve mixed DA-ergic and NA-ergic activation. Although we did not find any changes in NA (metabolites) in our dAMPH treated rats, we cannot completely exclude this further research into this will be of interest.
CONCLUSIONS
We report that dAMPH pre-treatment, which is known to induce neurotoxic changes in the DA synapse, induced an exaggerated phMRI response to a subsequent DA-ergic challenge in rats. Our validation data indicate that the phMRI signal changes are likely explained by increases in DA neurotransmission. Consistent with literature, we demonstrate that repeated dAMPH reduced striatal DAT and increased HVA levels . This supports that phMRI is sensitive enough to measure complex alterations in the DA system. This ability to assess subtle synaptic changes is promising for both preclinical studies of DA-ergic drug discovery and monitoring as well as for future clinical studies where phMRI can be used to investigate DA abnormalities, e.g. in various neuropsychiatric disorders, in a non-invasive way.
Chapter 3
50
REFERENCES
Abramoff MD, Magalhães PJ, Ram SJ (2004). Image processing with ImageJ. Biophotonics Int 11: 36–42. Advokat C (2007). Update on amphetamine neurotoxicity and its relevance to the treatment of ADHD. J Atten
Disord 11: 8–16. Ashburner J (2007). A fast diffeomorphic image registration algorithm. Neuroimage 38: 95–113. Belcher AM, O’Dell SJ, Marshall JF (2005). Impaired object recognition memory following methamphetamine,
but not p-chloroamphetamine-or d-amphetamine-induced neurotoxicity. Neuropsychopharmacology 30: 2026–2034.
Berman SM, Kuczenski R, McCracken JT, London ED (2009). Potential adverse effects of amphetamine treatment on brain and behavior: a review. Mol Psychiatry 14: 123–42.
Boileau I, Dagher A, Leyton M, Gunn RN, Baker GB, Diksic M, et al (2006). Modeling Sensitization to Stimulants in Humans. Arch Gen Psychiatry 63: 1386–1395.
Bredeloux P, Dubuc I, Costentin J (2007). Comparisons between bupropion and dexamphetamine in a range of in vivo tests exploring dopaminergic transmission. Br J Pharmacol 150: 711–719.
Canese R, Adriani W, Marco EM, Pasquale F De, Lorenzini P, Luca N De, et al (2009). Peculiar response to methylphenidate in adolescent compared to adult rats: A phMRI study. Psychopharmacology (Berl) 203: 143–153.
Chen Y, Choi J-K, Xu H, Ren J, Andersen SL, Jenkins BG (2010). Pharmacologic neuroimaging of the ontogeny of dopamine receptor function. Dev Neurosci 32: 125–38.
Chen Y, Galpern WR, Brownell AL, Matthews RT, Bogdanov M, Isacson O, et al (1997). Detection of dopaminergic neurotransmitter activity using pharmacologic MRI: correlation with PET, microdialysis, and behavioral data. Magn Reson Imaging 38: 389–398.
Choi JK, Chen Y, Hamel E, Jenkins BG (2006). Brain hemodynamic changes mediated by dopamine receptors: role of the cerebral microvasculature in dopamine-mediated neurovascular coupling. Neuroimage 30: 700–712.
Crunelle CL, Miller ML, Bruin K de, Brink W van den, Booij J (2009). Varenicline increases striatal dopamine D2/3 receptor binding in rats. Addict Biol 14: 500–2.
Easton N, Marshall FH, Marsden CA, Fone KCF (2009). Mapping the central effects of methylphenidate in the rat using pharmacological MRI BOLD contrast. Neuropharmacology 57: 653–64.
Fumagalli F, Gainetdinov RR, Valenzano KJ, Caron MG (1998). Role of dopamine transporter in methamphetamine-induced neurotoxicity: evidence from mice lacking the transporter. J Neurosci 18: 4861–4869.
Gibb J, Hanson G, Johnson M (1994). Neurochemical mechanisms of toxicity. Amphetamine its Analog 269–295.
Gozzi A, Large CH, Schwarz A, Bertani S, Crestan V, Bifone A (2008a). Differential effects of antipsychotic and glutamatergic agents on the phMRI response to phencyclidine. Neuropsychopharmacology 33: 1690–703.
Gozzi A, Schwarz A, Crestan V, Bifone A (2008b). Drug-anaesthetic interaction in phMRI: the case of the psychotomimetic agent phencyclidine. Magn Reson Imaging 26: 999–1006.
Gozzi A, Tessari M, Dacome L, Agosta F, Lepore S, Lanzoni A, et al (2011). Neuroimaging evidence of altered fronto-cortical and striatal function after prolonged cocaine self-administration in the rat. Neuropsychopharmacology 36: 2431–2440.
Gulley JM, Zahniser NR (2003). Rapid regulation of dopamine transporter function by substrates, blockers and presynaptic receptor ligands. Eur J Pharmacol 479: 139–52.
Hebert MA, Larson GA, Zahniser NR, Gerhardt GA (1999). Age-Related Reductions in [3H]WIN 35,428 Binding to the Dopamine Transporter in Nigrostriatal and Mesolimbic Brain Regions of the Fischer 344 Rat. J Pharmacol Exp Ther 288: 1334–1339.
Hewitt KN, Shah YB, Prior MJW, Morris PG, Hollis CP, Fone KCF, et al (2005). Behavioural and pharmacological magnetic resonance imaging assessment of the effects of methylphenidate in a potential new rat model of attention deficit hyperactivity disorder. Psychopharmacology (Berl) 180: 716–723.
Huotari M, García-Horsman JA, Karayiorgou M, Gogos J a., Männistö PT (2004). d-Amphetamine responses in catechol-O-methyltransferase (COMT) disrupted mice. Psychopharmacology (Berl) 172: 1–10.
Jenkins BG, Sanchez-Pernaute R, Brownell AL, Chen YCI, Isacson O (2004). Mapping dopamine function in primates using pharmacologic magnetic resonance imaging. J Neurosci 24: 9553–9560.
Jenkinson M, Beckmann CF, Behrens TEJ, Woolrich MW, Smith SM (2012). Fsl. Neuroimage 62: 782–90. Knol RJJ, Bruin K de, Jong J de, Eck-Smit BLF van, Booij J (2008). In vitro and ex vivo storage phosphor
imaging of short-living radioisotopes. J Neurosci Methods 168: 341–57.
Increased dopamine phMRI response after dexamphetamine pre-treatment in rats
51
McCann UD, Ricaurte GA (2004). Amphetamine neurotoxicity: accomplishments and remaining challenges. Neurosci Biobehav Rev 27: 821–826.
Narendran R, Martinez D (2008). Cocaine abuse and sensitization of striatal dopamine transmission: A critical review of the preclinical and clinical imaging literature. Synapse 62: 851–869.
Paxinos G, Watson C (Academic Press: Berlin, 2005). The rat brain in stereotactic coordinates. . Pierce RC, Kalivas PW (1997). A circuitry model of the expression of behavioral sensitization to amphetamine-
like stimulants. Brain Res Rev 25: 192–216. Ren J, Xu H, Choi J-K, Jenkins BG, Chen YI (2009). Dopaminergic response to graded dopamine concentration
elicited by four amphetamine doses. Synapse 63: 764–72. Ricaurte GA, Mechan AO, Yuan J, Hatzidimitriou G, Xie T, Mayne AH, et al (2005). Amphetamine treatment
similar to that used in the treatment of adult attention-deficit/hyperactivity disorder damages dopaminergic nerve endings in the striatum of adult nonhuman primates. J Pharmacol Exp Ther 315: 91–98.
Saunders C, Ferrer J V, Shi L, Chen J, Merrill G, Lamb ME, et al (2000). Amphetamine-induced loss of human dopamine transporter activity: an internalization-dependent and cocaine-sensitive mechanism. Proc Natl Acad Sci U S A 97: 6850–6855.
Savasta M, Dubois A, Scatton B (1986). Autoradiographic localization of D1 dopamine receptors in the rat brain with [3H]SCH 23390. Brain Res 375: 291–301.
Schouw MLJ, Caan MWA, Geurts HM, Schmand B, Booij J, Nederveen AJ, et al (2013). Monoaminergic dysfunction in recreational users of dexamphetamine. Eur Neuropsychopharmacol 23: 1491–1502.
Schrantee A, Václavů L, Heijtel DFR, Caan MWA, Gsell W, Lucassen PJ, et al (2015). Dopaminergic system dysfunction in recreational dexamphetamine users. Neuropsychopharmacology 40: 1172–1180.
Schwarz AJ, Danckaert A, Reese T, Gozzi A, Paxinos G, Watson C, et al (2006). A stereotaxic MRI template set for the rat brain with tissue class distribution maps and co-registered anatomical atlas: application to pharmacological MRI. Neuroimage 32: 538–50.
Schwarz AJ, Gozzi A, Reese T, Heidbreder CA, Bifone A (2007). Pharmacological modulation of functional connectivity: the correlation structure underlying the phMRI response to d-amphetamine modified by selective dopamine D3 receptor antagonist SB277011A. Magn Reson Imaging 25: 811–820.
Squillace M, Dodero L, Federici M, Migliarini S, Errico F, Napolitano F, et al (2014). Dysfunctional dopaminergic neurotransmission in asocial BTBR mice. Transl Psychiatry 4: e427.
Stahl SM (2003). Dopamine Is a Hitchhiker in Frontal Cortex: Norepinephrine Transporters Regulate Dopamine. J Clin Psychiatry 64: 4–5.
Worsley KJ (2001). Statistical analysis of activation images. Funct MRI An Introd to methods 251–270.
Chapter 3
52
SUPPLEMENTARY METHODS
phMRI Following pre-treatment and a washout period of 5 to 7 days to ensure total drug clearance, rats were anaesthetised with isoflurane (5% induction and then reduced to 1.5-2% for maintenance of anaesthesia) during animal preparation and scanning given in a 70:30 mixture of medical air and oxygen. The right femoral artery was cannulated for blood gas measurements (RapidLab 348, Siemens Healthcare Diagnostics, Newbury, UK) and blood pressure (Biopac Systems Corp., Goweta, USA) monitoring. Subsequently, the animal was tracheotomised and artificially ventilated with a mechanical respirator (Inspira ventilator, Harvard Apparatus). To assess whether artificial ventilation was successful, respiration was monitored using a respiratory cuff coupled to a pressure sensor (SA Instruments, New York, USA). Ventilation parameters were adjusted for each animal before the scan such that its blood gas values remain within the physiological range (else subjects were excluded from the analyses). No statistically significant difference in the pre- and post-administration pCO2 values between groups was found (ANOVA F3,36=1.8; p=0.17). Mean arterial blood pressure (MAP) was also closely monitored during the MRI experiment. Body temperature was monitored with a rectal probe and maintained at 37.5 ± 1 ºC by a warm air heating system (SA Instruments, New York, USA). Finally, an i.p. cannula was placed for delivery of the pharmacological challenge during the functional scan. During the MRI experiment, in each experimental group half of the rats received 4 mg/kg MPH i.p. (Sigma Aldrich, UK) dissolved in 0.9% saline in a volume of 0.3 ml to challenge the DA system. The other half received a saline challenge. Immunocytochemistry After sectioning, the sections were washed twice in phosphate buffer (PB) to get rid of remaining sucrose and were subsequently stored in PB-azide (0.1M phosphate buffer, pH7.4 + 0.01% sodium-azide) and stored at 4ºC until further use. To remove sodium azide, sections were washed three times with buffer (for staining-specific reagent details, see Supplementary Table 1). Endogenous peroxidase activity was blocked with 0.5% H2O2 in buffer solution, followed by four washes. Next, non-specific binding was prevented by incubation in protein blocking solution. The sections were then incubated with the primary antibody in primary incubation solution for 1 h at room temperature (RT) and overnight (ON) at 4°C. The following day, the sections were allowed to acclimatize to RT and were subsequently washed for five times. The sections were incubated for 2 h at RT with a biotinylated secondary antibody in the secondary incubation solution. Next, the sections were washed four times before the sections were incubated in Vectastain Elite ABC (PK-4000, Vector Labs) at 1:800 dilution for 2 h the sections were then washed once followed by three washes with Tris-HCl buffer (TB, 0.05M, pH7.6) The staining was visualized with 0.05% 3,3-“-Diaminobenzidine tetra-hydrochloride (DAB, Sigma, no D-5637) with 0.01% H2O2 in TB, whereas the staining reaction was stopped by several washes in TB. Finally, the sections were mounted with 0.2% gelatin in TB and air dried ON. A gentle haematoxylin counterstaining according to Ehrlich was performed on GFAP sections only. After dehydration with alcohol and clearing in xylene the sections were covered with Entallan. The following brain structures were located (caudate putamen, CPu, bregma 2.28; Nucleus Accumbens Core, NAcc, bregma 2.28) according to the rat brain atlas (Paxinos and Watson, 2005). The brain areas were digitized with a Zeiss Axiophot microscope (Carl Zeiss

Increased dopamine phMRI response after dexamphetamine pre-treatment in rats
53
Microscopy GmbH, Jena, Germany) equipped with a Optronics Microfire camera and StereoInvestigator software (MBF bioscience) at 2.5x magnification with optimal and fixed settings for each staining within a brain structure. Autoradiography Animals were euthanized by vertebral dislocation and the brains were rapidly removed, frozen in isopentane at 40°C and stored at -80°C. Coronal brain sections (14µm) were obtained with a cryomicrotome (Leica® CM3050) and mounted onto gelatin-coated slides. DAT binding experiments were performed according to Hebert et al. (1999). In brief, brain slices were pre-incubated for 20 min in 30 mM sodium phosphate buffer (pH 7.4, +4°C), and then incubated for 90 min in the presence of [3H]WIN35428 (Perkin-Elmer®, France; specific radioactivity = 3.034 MBq; 5 concentrations from 0.55 to 15.0 nM) in the same buffer supplemented by 0.32 mM sucrose. Non-specific binding was determined by incubation of adjacent brain slices in the presence of 10µM nomifensine. Brain slices were rinsed (3 x 1 min) in ice-cold sodium phosphate buffer (pH 7.4 at + 4°C), rapidly dipped in ice-cold distilled water and dried under a stream of cooled air. D1R binding experiments were performed according to Savasta et al. (1986). In brief, brain slices were pre-incubated for 15 min in 50 mM Tris-HCl buffer supplemented with 120 mM NaCl, 5 mM KCl, and 1 mM MgCl2 (pH 7.4, +25°C), and then incubated for 60 min in the presence of [3H]SCH-23,390 (Perkin-Elmer®, France; specific radioactivity = 3.119 MBq; 5 concentrations from 0.10 to 8.1 nM) in the same buffer in the presence of 30 nM ketanserin. Non-specific binding was determined by incubation of adjacent brain slices in the same conditions and in the presence of 10µM SKF38393. Brain slices were rinsed (2 x 1 min) in ice-cold 50 m MTris-HCl, 120 mM NaCl, 5 mM KCl, 1 mM MgCl2 buffer (pH 7.4 at + 4°C), rapidly dipped in ice-cold distilled water and dried under a stream of cooled air. Brain sections were co-exposed with standards ([3H] microscales, Amersham®) on tritium-sensitive phosphor imaging plates (Perkin-Elmer®) for ten days at room temperature before acquisition of images (Cyclone®, Perkin-Elmer®). Binding density of receptors (fmol/mg of tissue equivalent) was quantified with a computer-assisted image analyzer (OptiQuant®, Perkin-Elmer) using a three-order polynomial relation between optical densities and radioactivity. Specific binding was calculated as the difference between total and non-specific binding and Kd and Bmax values were derived from raw data using nonlinear fitting procedures (Prism®). The same brain regions and bregmas were used as for the immunocytochemistry. HPLC Brains were rapidly dissected on a cold plate; CPu and frontal cortex were dissected, weighed and stored at -80°C for further analysis. The tissue samples were homogenized 30 min in 100 µl of an extraction solution (pH=3) constituted of the mobile phase supplemented with perchloric acid 0.1M. The samples were then centrifuged (10 000 rpm, 10 min), the supernatant were isolated and centrifuged again (10 000 rpm, 5 min). Each sample was injected two-times using a Rheodyne 7725i injector valve with a 20-µL injection loop. The mobile phase (MD-3MA, Thermo Scientific, France) was pumped at 0.4 mL/min with an isocratic high-performance liquid chromatography (UltiMate 3000 system, Thermo Scientific Dionex, France). Separation was performed with a 3-µm C18, 3.2 x 100 mm reversed phase column (MD-150, Thermo Scientific Dionex, France) maintained at 26°C. Electrochemical detection (Coulochem III, Thermo
Chapter 3
54
Scientific Dionex, France) using an analytical cell (5014B, E1 = -150 mV and E2 = +200 mV, Thermo Scientific Dionex, France) and a guard cell set at +350 mV (5020, Thermo Scientific Dionex, France) enabled the detection of monoamines and their metabolites. Peak quantification was determined using the Chromeleon 7.2 software (Thermo Scientific Dionex, France) and their concentrations derived from external standard curves. Concentrations of each compound were computed as the average of the two extracted values per sample. DA and its metabolites 3,4-Dihydroxyphenylacetic acid (DOPAC) and homovanillic acid (HVA) were detected in all the regions of interest. All the compounds were resolved in a 15 min run.
SUPPLEMENTARY REFERENCES
Hebert MA, Larson GA, Zahniser NR, Gerhardt GA (1999). Age-Related Reductions in [3H]WIN 35,428 Binding to the Dopamine Transporter in Nigrostriatal and Mesolimbic Brain Regions of the Fischer 344 Rat. J Pharmacol Exp Ther 288: 1334–1339.
Paxinos G, Watson C (Academic Press: Berlin, 2005). The rat brain in stereotactic coordinates. Savasta M, Dubois A, Scatton B (1986). Autoradiographic localization of D1 dopamine receptors in the rat brain
with [3H]SCH 23390. Brain Res 375: 291–301.
Supplementary Figure 1. a) D1 b) GFAP c) DAT d) D2 expression in the CPu and NAcc in representative rats for each group.

Increased dopamine phMRI response after dexamphetamine pre-treatment in rats
55
Supplementary Figure 2. Representative illustration of the cerebral distribution of b) DAT and c) D1 binding sites at the level of the CPu and NAcc (a; Bregma + 1.60 mm) in a control rat
Supplementary Figure 3. Storage phosphor imaging for D2/D3 assessments. a) Examples of regions of interest for CPu (A), NAcc (B) and cerebellum (C). b) D2/D3 binding potential in the CPu and NAcc in dAMPH and saline pre-treated rats (mean+SEM)
Chapter 3
56
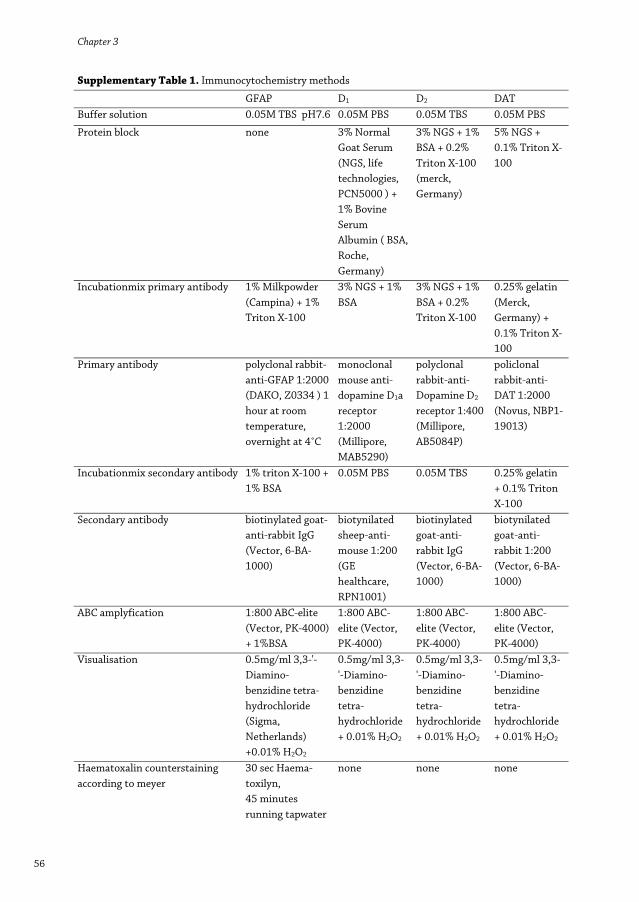
Supplementary Table 1. Immunocytochemistry methods
GFAP D1 D2 DAT Buffer solution 0.05M TBS pH7.6 0.05M PBS 0.05M TBS 0.05M PBS
Protein block none 3% Normal Goat Serum (NGS, life technologies, PCN5000 ) + 1% Bovine Serum Albumin ( BSA, Roche, Germany)
3% NGS + 1% BSA + 0.2% Triton X-100 (merck, Germany)
5% NGS + 0.1% Triton X-100
Incubationmix primary antibody 1% Milkpowder (Campina) + 1% Triton X-100
3% NGS + 1% BSA
3% NGS + 1% BSA + 0.2% Triton X-100
0.25% gelatin (Merck, Germany) + 0.1% Triton X-100
Primary antibody polyclonal rabbit-anti-GFAP 1:2000 (DAKO, Z0334 ) 1 hour at room temperature, overnight at 4˚C
monoclonal mouse anti-dopamine D1a receptor 1:2000 (Millipore, MAB5290)
polyclonal rabbit-anti-Dopamine D2 receptor 1:400 (Millipore, AB5084P)
policlonal rabbit-anti-DAT 1:2000 (Novus, NBP1-19013)
Incubationmix secondary antibody 1% triton X-100 + 1% BSA
0.05M PBS 0.05M TBS 0.25% gelatin + 0.1% Triton X-100
Secondary antibody biotinylated goat-anti-rabbit IgG (Vector, 6-BA-1000)
biotynilatedsheep-anti-mouse 1:200 (GE healthcare, RPN1001)
biotinylated goat-anti-rabbit IgG (Vector, 6-BA-1000)
biotynilated goat-anti-rabbit 1:200 (Vector, 6-BA-1000)
ABC amplyfication 1:800 ABC-elite (Vector, PK-4000) + 1%BSA
1:800 ABC-elite (Vector, PK-4000)
1:800 ABC-elite (Vector, PK-4000)
1:800 ABC-elite (Vector, PK-4000)
Visualisation 0.5mg/ml 3,3-'-Diamino-benzidine tetra-hydrochloride (Sigma, Netherlands) +0.01% H2O2
0.5mg/ml 3,3-'-Diamino-benzidine tetra-hydrochloride + 0.01% H2O2
0.5mg/ml 3,3-'-Diamino-benzidine tetra-hydrochloride + 0.01% H2O2
0.5mg/ml 3,3-'-Diamino-benzidine tetra-hydrochloride + 0.01% H2O2
Haematoxalin counterstaining according to meyer
30 sec Haema-toxilyn, 45 minutes running tapwater
none none none