uv visible spectra analysis of high temperature water gas
TRANSCRIPT

Brigham Young University Brigham Young University
BYU ScholarsArchive BYU ScholarsArchive
Theses and Dissertations
2012-05-23
UV Visible Spectra Analysis of High Temperature Water Gas Shift UV Visible Spectra Analysis of High Temperature Water Gas Shift
Catalysts Made from Iron, Lanthanum, Copper, and Chromium Catalysts Made from Iron, Lanthanum, Copper, and Chromium
Oxides Oxides
Jared C. Brown Brigham Young University - Provo
Follow this and additional works at: https://scholarsarchive.byu.edu/etd
Part of the Chemical Engineering Commons
BYU ScholarsArchive Citation BYU ScholarsArchive Citation Brown, Jared C., "UV Visible Spectra Analysis of High Temperature Water Gas Shift Catalysts Made from Iron, Lanthanum, Copper, and Chromium Oxides" (2012). Theses and Dissertations. 3222. https://scholarsarchive.byu.edu/etd/3222
This Thesis is brought to you for free and open access by BYU ScholarsArchive. It has been accepted for inclusion in Theses and Dissertations by an authorized administrator of BYU ScholarsArchive. For more information, please contact [email protected], [email protected].

i
UV Visible Spectra Analysis of High Temperature Water Gas Shift
Catalysts Made from Iron, Lanthanum,
Copper, and Chromium Oxides
Jared Brown
A thesis submitted to the faculty of Brigham Young University
in partial fulfillment of the requirements for the degree of
Master of Science
Morris D. Argyle, Chair W. Vincent Wilding Bradley C. Bundy
Department of Chemical Engineering
Brigham Young University
June 2012
Copyright © 2012 Jared Brown
All Rights Reserved

i
ABSTRACT
UV Visible Spectra Analysis of High Temperature Water Gas Shift Catalysts Made from Iron, Lanthanum,
Copper, and Chromium Oxides
Jared Brown Department of Chemical Engineering, BYU
Master of Science
Hydrogen is a vital component in several different chemical reactions as well as a potential fuel source for the future. The water gas shift (WGS) reaction converts CO and water to hydrogen and CO2. The objective of this work is to first, characterize the potential benefits of the addition of lanthanum oxide (lanthana) to the iron-chromium-copper (Fe-Cr-Cu) oxide catalysts industrially used in high temperature water gas shift processes, and second, analyze these catalysts using in-situ UV-Visible spectroscopy. The benefits of each component in the catalyst are discussed as well as potential benefits from the addition of lanthana. Lanthana is a rare earth oxide that dramatically increases the surface area of the iron based WGS catalysts, and small concentrations of other rare earth oxides (i.e. cerium) have been shown to increase the rate of desorption of CO2 from iron surfaces (Hu Yanping 2002). Lanthana has similar chemical properties to other rare earth oxides tested and has not been previously tested as an additive to the WGS catalyst. Therefore catalysts with 0, 1, 2, 5, 10, and 20 wt% lanthana were made via a co-precipitation method in order to measure changes in activity, physical stability, and thermal stability. Catalyst characterization techniques utilized include electron dispersive X-ray spectroscopy (EDX), temperature programmed reduction (TPR) with hydrogen, and nitrogen physisorption (BET). The kinetic analysis was performed utilizing both mass spectroscopy (MS) and gas chromatography (GC).
The addition of 1 wt% lanthana to the Fe-Cr-Cu catalysts increases WGS reaction rates of the catalyst at 425°C and 350°C, however the 0% La catalyst has the highest rates at 375°C and 400°C. The 0% La catalyst shows significant drop off in rate at 425°C, suggesting that the lanthana provides a small thermal stabilizing, i.e. the addition of lanthana prevents catalyst sintering at higher temperatures. Traditionally, chromia acts as the sole thermal stabilizer in these catalysts. The addition of large amounts of lanthana inhibits the chromia stabilizing effect, however small additions of lanthana appear to have an additional catalyst promotional effect without interfering with the chromia thermal stabilization. The increased WGS reaction rates at higher temperatures could allow for greater throughput of reactants in industrial settings. Higher concentrations of lanthana decrease the activity due to what is believed to be disruption of the chromia stabilizing effect as well as reduced amount of the active phase of catalyst.
In-situ UV-Visible analysis shows that the oxidation state of the iron in the catalyst has a direct correlation to the UV-Visible light absorbance of the surface of the iron catalyst. Extent of reduction is traditionally measured with a synchrotron which is significantly more expensive than UV-Vis spectroscopy. This study uses the more economical UV-Vis spectrometer to determine similar information. The lanthana doped catalysts show an over-reduction of iron during WGS conditions (i.e. rapid reduction of Fe2O3 to Fe3O4 and FeO).
Keywords: extent of reduction, water gas shift, lanthana, UV-visible spectroscopy

i
Table of Contents
Table of Contents ............................................................................................................................. i
List of Figures ................................................................................................................................. v
List of Tables ............................................................................................................................... viii
Chapter 1 Introduction .................................................................................................................... 1
1.1 Background ........................................................................................................................... 1
1.2 Iron Catalyst Properties ......................................................................................................... 3
1.3 Water Gas Shift Reaction over Iron ...................................................................................... 4
1.4 Ceria and Lanthana ................................................................................................................ 6
1.5 Copper in Water Gas Shift Catalysts ..................................................................................... 7
1.6 Structural Stability of Iron Catalysts in WGS Conditions .................................................... 9
1.7 Effects of Chromia in WGS Catalysts ................................................................................. 10
Chapter 2 Characterization and Kinetic Results ........................................................................... 13
2.1 Introduction ......................................................................................................................... 13
2.1.1 Laboratory Set-Up ........................................................................................................ 13
2.1.2 Experimental Assumptions ........................................................................................... 14
2.1.3 Catalyst Characterization .............................................................................................. 14
2.1.4 BET Surface Area Analysis .......................................................................................... 14
2.2 Experimental Methods ........................................................................................................ 15
ii
2.2.1 Gas Chromatograph ...................................................................................................... 15
2.2.2 Mass Spectrometer ....................................................................................................... 17
2.2.3 Temperature Programmed Surface Reactor ................................................................. 18
2.2.4 Catalyst Preparation ...................................................................................................... 19
2.2.5 Experimental Procedure ............................................................................................... 20
2.3 Results and Discussion ........................................................................................................ 22
2.3.1 Catalyst Surface Area and Structural Stability ............................................................. 22
2.3.2 Energy Dispersion X-Ray Spectroscopy (EDX) .......................................................... 24
2.3.3 Rate Analysis ................................................................................................................ 25
2.3.4 Rate Analysis Based on Lanthanum Percentage .......................................................... 26
2.3.5 Rate Analysis Based on Changes in Temperature ........................................................ 28
2.3.6 Rate Analysis Based on Rate per Surface Area ............................................................ 30
2.4 Conclusions ......................................................................................................................... 31
Chapter 3 UV-Visible Assessment ............................................................................................... 33
3.1 Introduction ......................................................................................................................... 33
3.1.1 UV-Visible Spectrometer (In-situ) ............................................................................... 33
3.1.2 UV Visible Spectroscopy ............................................................................................. 34
3.1.3 Extent of Reduction ...................................................................................................... 34
3.1.4 X-Ray Adsorption Near Edge Spectrocopy (XANES) ................................................. 34
3.1.5 Edge and Pre-Edge Energies ........................................................................................ 36
iii
3.1.6 Kubelka-Munk Function............................................................................................... 37
3.1.7 Extent of Reduction via UV-Visible Analysis ............................................................. 39
3.1.8 Structural Stability in the UV-Visible In-situ Reactor ................................................. 40
3.1.9 Reversibility of the Absorbance Spectra of the Catalysts ............................................ 42
3.2 Experimental Methods ........................................................................................................ 43
3.2.1 UV-Visible Diffuse Reflectance Apparatus ................................................................. 43
3.2.2 Diffuse Reflectance Spectroscopy Using a Harrick Praying Mantis Cell .................... 44
3.2.3 Challenges and Previous Measurements ...................................................................... 45
3.2.4 Data Gathering Procedure for the UV-Visible In-situ Reactor .................................... 47
3.2.5 Methodology of UV-Visible Software ......................................................................... 50
3.3 Results and Discussion ........................................................................................................ 50
3.3.1 TPR and TPO Results and Discussion ......................................................................... 50
3.3.2 TPR and TPO Analysis via Mass Spectrometer ........................................................... 51
3.3.3 TPR and TPO Analysis via UV-Visible Kinetics® Program ........................................ 54
3.3.4 TPR and TPO Analysis via UV-Visible Scan® Program ............................................. 59
3.3.5 Extent of Reduction of 1 wt% Lanthana Catalyst Using UV-Visible Spectra ............. 63
3.4 Conclusions ......................................................................................................................... 65
Chapter 4 Future Work ................................................................................................................. 67
References ..................................................................................................................................... 71

iv

v
List of Figures
Figure 1 Conversion of CO over two iron based WGS catalysts at different feed conditions (Hla 2009). ...................................................................................................................................... 5
Figure 2 Temperature programmed reduction of catalyst precursors using 5% H2 in Ar showing H2 consumption with increasing temperature: (a) Fe3O4/Cr2O3; (b) CuO/Fe3O4/Cr2O3. . 8
Figure 3 Temperature programmed reduction of catalyst precursors using 5% CO in He showing CO consumption with increasing temperature: (a) Fe3O4/Cr2O3; (b) CuO/Fe3O4/Cr2O3. 8
Figure 4 Transmission electron micrographs of Fe3O4 particles on cleaved single crystal graphite. (a) same sample as (b) treated an additional 24 h in CO/CO2 (15/85) at 660 K (b) same field of view after an additional 24 h in CO/CO2/H2O (32/4/64) at 660K (Rethwisch 1985). ........................................................................................................................... 9
Figure 5 TPR data of multiple compositions of iron chromia catalysts performed by (Gunugunuri 2011)........................................................................................................................ 11
Figure 6 Spinel structure adopted by XY2O4 oxides. In the normal spinel structure (FeCr2O4), tetrahedral sites are occupied by divalent cations such as Fe2+ and octahedral sites are occupied by trivalent cations such as Cr3+ (Sherman 2008). .......................................... 12
Figure 7 Lab experimental apparatus ............................................................................................ 13
Figure 8 Traditional BET isotherm of nitrogen adsorption near 77 K (Sinfelt 2002). ................. 15
Figure 9 1 wt% lanthana catalyst GC reading after 5 days WGS conditions. .............................. 16
Figure 10 Hydrogen calibration for the mass spectrometer. ......................................................... 18
Figure 11 Surface area of catalysts before and after reaction. ...................................................... 24
Figure 12 Inverse flow rate versus reaction rate of 1 wt% lanthana catalyst at 4 different temperatures. ................................................................................................................................. 26
Figure 13 Description of rates as a function of wt% lanthana at various temperatures. ............... 27
Figure 14 Rates as a function of temperature for all 6 catalysts tested. ........................................ 29
Figure 15 Rate as a function of surface area for the lanthanum catalysts. Per surface area of the catalyst after the reaction on the left and per surface area of the catalyst before reaction shown on the right. .......................................................................................................... 30
Figure 16 Varian Cary 4000 UV-vis spectrometer provided by Varian Corporation (Varian Corp 2010). ...................................................................................................................... 33

vi
Figure 17 Normalized Fe K-edge XANES spectra of (a) mantle garnet (Fe3+/ΣFe = 0.090, Mon F), (b) alm0.93ski0.07 (Fe3+/ΣFe = 0.045), (c) alm0.79ski0.21 (Fe3+/ΣFe = 0.123), (d) alm0.51ski0.49 (Fe3+/ΣFe = 0.246), (e) alm0.12ski0.88 (Fe3+/ΣFe = 0.370), (f) and0.21 ski0.79 (Fe3+/ΣFe = 0.458), (g) and0.45ski0.55 (Fe3+/ΣFe = 0.548), (h) and0.72ski0.28 (Fe3+/ΣFe = 0.704), (i) and0.93ski0.07 (Fe3+/ΣFe = 0.905), and (j) and1.0 (Fe3+/ΣFe = 1.000). The spectra have been offset for clarity (Berry 2010). ..................................................... 36
Figure 18 The extended x-ray absorption fine structure (EXAFS) and XANES absorption spectrum of iron. This shows the edge, the XANES region, and the EXAFS region. This spectrum has not been corrected for background, nor divided by current (Gunter 2002). ........... 37
Figure 19 (A) In situ UV–Vis diffuse reflectance spectra of 0.5 wt.% CrOx/SiO2 catalyst treated at 350°C in 2% isobutane in N2 as a function of time. (B) In situ UV–vis diffuse reflectance spectra of 0.5 wt.% CrOx/Al2O3 catalyst treated at 350°C in 2% isobutane in N2 as a function of time (Weckhuysen 2000). .............................................................................. 40
Figure 20 Pellet catalyst under WGS conditions. ......................................................................... 41
Figure 21 Schematic overview of a diffuse reflectance spectrophotometer with integration sphere (Weckhuysen 1999). .......................................................................................................... 44
Figure 22 Harrick Praying Mantis Cell (Harrick Scientific 2012). .............................................. 45
Figure 23. UV vis spectra for different iron based catalysts. The light gray lines represent calculated deconvolutions of the apparent constituent peaks that make up the actual spectra, which is the black, bold line (Herranz 2006). ............................................................................... 46
Figure 24 TPR 1 of 1wt% lanthana catalyst data from mass spectrometer. ................................. 51
Figure 25 TPR/TPO consumption per gram catalyst. ................................................................... 53
Figure 26 Change in peak temperature for TPR1 and TPR2. ....................................................... 54
Figure 27 Varian Kinetics program at 800 nm TPR and TPO for 1 wt% lanthana catalyst. ........ 55
Figure 28 Rates of consumption for TPRs and TPO. ................................................................... 56
Figure 29 TPR TPO for 5 wt% lanthana catalyst via kinetics program. ....................................... 57
Figure 30 TPR/TPO kinetics program of 10 wt% lanthana catalyst. ............................................ 58
Figure 31 TPR/TPO Scans for 1wt% lanthana catalyst. Scans were taken after each of the steps............................................................................................................................................... 60
Figure 32 Scan results for 1wt% lanthana catalyst under WGS conditions. ................................ 62
Figure 33 Side by side view of Figure 19 and Figure 32 for comparison. ................................... 63

vii
Figure 34 Overall extent of teduction for 1 wt% lanthana catalyst a) post WGS pretreatment conditions. b) post TPR2 c) post TPR1 d) 18 hours WGS conditions e) 20 hours WGS conditions f) 22 hours WGS conditions. ....................................................................................... 64

viii
List of Tables
Table 1 Kinetic results of power law fit 95% confidence interval (Hla 2009) .......................... 6
Table 2 Side reactions at stoichiometric conditions of WGS (Xue 1996) ................................. 21
Table 3 BET analysis of catalysts before and after reaction ........................................................ 23
Table 4 EDX concentrations of catalysts at a point and across a surface ..................................... 25
Table 5 Summary of hydrogen and oxygen consumption via mass spectrometry ....................... 52

ix

1
Chapter 1 Introduction
1.1 Background
Hydrogen is a vital reactant in hundreds of applications in the chemical process
industries, such as reducing oxidized metals, increasing the degree of saturation in fats and oils,
reacting with nitrogen to form ammonia, producing nickel by the Sherritt Gordon Processes, and
removing sulfur and nitrogen from petroleum (Ramachandran 1998). Also, as production
technologies for hydrogen improve, the potential to convert to a hydrogen-based economy
becomes more feasible. While the “hydrogen economy” is not expected to increase the demand
for pure hydrogen for quite some time, if ever, the demand for chemical intermediate purity
hydrogen continues to increase.
Production of chemical grade hydrogen presents several challenges. There is no hydrogen
well or mine like there is for natural gas or coal. The hydrogen atoms need to be stripped off of
hydrocarbons or water to produce the gas. Methane is the preferred source of hydrogen because
it has the highest hydrogen to carbon ratio of any hydrocarbon. Two reversible reactions produce
hydrogen from methane. First, steam methane reforming:
CH4 + H2O ↔ 3H2 + CO (1)
is followed by the water gas shift to further oxidize the CO to form an additional hydrogen
molecule:
CO + H2O ↔ H2 + CO2 (2)

2
(Twigg 1989). Steam methane reforming, is highly endothermic (∆H° = 206 kJ mol-1) and
therefore equilibrium shifts towards hydrogen production if the temperatures are high and the
pressures are low. Conversely, the water gas shift reaction is slightly exothermic (∆H° = -41 kJ
mol-1), meaning that hydrogen production is favored at lower temperatures. However, at these
lower temperatures, the homogeneous water gas shift reaction proceeds too slowly for practical
industrial production.
Methane is a valuable gas used in industrial and commercial heating applications.
Methane steam reforming requires the use of this widely used fuel and steam, but produces a
toxic gas, CO, with the desired H2. The water gas shift reaction utilizes the poisonous CO and
water to create a less harmful gas, CO2, and more of the desired H2. A significant challenge then
to the mass production of H2 is the tradeoff of kinetic rate versus low conversion of H2 in the
water gas shift reaction. To produce significant quantities of H2, a catalyst is required to increase
the rate of the forward water gas shift reaction.
The objective of this work is to characterize the potential benefits of the addition of
lanthanum oxide (lanthana) to the iron-chromium-copper (Fe-Cr-Cu) oxide catalysts industrially
used in high temperature water gas shift processes. Lanthana is a rare earth oxide that
dramatically increases the surface area of the iron based WGS catalysts and small concentrations
of other rare earth oxides (i.e. cerium) have been shown to increase the rate of desorption of CO2
from iron surfaces (Hu 2002). Lanthana has similar chemical properties to other rare earth oxides
tested and has not been previously tested as an additive to the WGS catalyst.
Exposure to WGS conditions reduces the active iron phase, Fe3O4, to FeO and eventually
metallic iron. The longevity of the WGS catalyst is directly tied to the rate and the extent to

3
which this reduction occurs. Analyzing these catalysts using in-situ UV-Visible spectroscopy
will provide insights into the extent of reduction of the catalyst during water gas shift conditions.
The improved understanding of the catalytic mechanisms provided by the UV-Visible detection
and the kinetic analysis that will also be performed will guide improvements to the activity and
longevity of the catalyst(s).
Due to the low conversions at high temperatures, a staged process is used industrially to
optimize H2 output versus residence time. A high temperature water gas shift process utilizing
iron oxides with chromium and copper promoters and a low temperature catalyst utilizing
copper, zinc, and alumina oxides, and occasionally a series of precious metals (gold, platinum,
etc.) are arranged in series. This study will focus on analyzing the high temperature shift (HTS)
catalysts.
1.2 Iron Catalyst Properties
The iron oxide, specifically magnetite (Fe3O4) contains the active sites that facilitate the
forward water gas shift reaction (Sato 2004). A study by Sato et al. showed that non-catalytic
water gas shift done under supercritical conditions has a reaction rate roughly 107 times smaller
than with catalytic iron at non-supercritical temperatures (Sato, Takafumi 2004). This suggests
that the use of a catalyst is of the utmost importance in improving H2 production.
While the water gas shift reaction (WGS) on iron oxide is significantly better than non-
catalytic WGS, there are some challenges to using this catalyst. Iron oxides are somewhat
resistant to both sintering and various potential poisons; however, there is still a decline in
catalytic activity with time (Chinchen 1984). The activity of a catalyst is strongly dependent on
surface area of the catalyst. Chinchen et al. explain that there are two stages to activity reduction

4
in iron oxide catalysts. First, there is an initial fast decay of activity that resolves to a pseudo
steady state activity. Secondly, a slow decline of steady state activity is due to sintering, the loss
in surface area accompanying a growth in mean pore size due to mobility of the catalytic surface
structures at high temperatures (Chinchen 1984).
Both the rapid and slow decays of activity have been attributed to a form of sintering
(Chinchen 1984). Therefore, one way to improve the water gas shift reaction rate is to decrease
both the amount and rate of sintering, thus increasing the effective activity of the catalyst over an
extended period of time. The other method for improving water gas shift catalyst performance
involves increasing the intrinsic activity of the catalyst being used.
1.3 Water Gas Shift Reaction over Iron
The WGS reaction can be modeled fairly accurately using a power law equation
developed by Podolski and Kim of the form
R = k PCOa PH2O
b PCO2c PH2
d (1-β) (3)
where, R = reaction rate (mol gcat −1 s−1); Pi = partial pressure of reactant, i; a, b, c, d = reaction
order of CO, H2O, CO2, and H2, respectively; k = rate constant = A exp(−E/R′T); R′ = universal
gas constant (kJ mol−1 K−1); A = pre-exponential factor (mol gcat−1 s−1atm-a-b-c-d); E = activation
energy (kJ mol−1); T = reaction temperature (K); and β is defined as
β = K-1 PCO-1 PH2O
-1 PCO2 PH2 (4)
where K is the equilibrium constant (Hla 2009). Two standard industrial iron chromia copper
oxide catalysts, HTC1 and HTC2 were used by San Shwe Hla in order to determine rate law data
for the WGS reaction over Fe-Cr-Cu oxide catalysts. HTC1 has more chromia and less copper

5
than HTC2. (The importance of copper and chromia in the catalysts will be discussed in sections
1.5 and 1.7 respectively).
These catalysts were then analyzed for their kinetic production of H2 under a variety of
conditions to determine the power-law coefficients. Various compositions of feed gas were
tested to produce the following results, which show the CO conversions for a series of reactor
and catalysts (Figure 1).
Figure 1 Conversion of CO over two iron based WGS catalysts at different feed conditions (Hla 2009).
The inlet CO concentration decreases from left to right for the four conditions listed in
Figure 1, from 65% to 44%, 7%, and 4%, respectively. As shown, feed conditions as well as
compositions of the iron based catalysts determine conversion of CO in the WGS reaction. These
data were then used to calculate the desired power-law coefficients shown in Table 2.

6
Table 1 Kinetic results of power law fit 95% confidence interval (Hla 2009)
a [CO] b [H2O] c [CO2] d [H2] A E(kJ mol-1) HTC 1 1.0 0.031 0 -0.36 0.043 -0.09 0.007 700 50 111 2.63 HTC 2 0.9 0.041 0.31 0.056 -0.156 0.078 -0.05 0.006 4.557 0.133 88 2.18
These data suggest that the equilibrium conversion of CO increases as the concentration
of CO increases. However, at the same space velocity in each case, the efficiency of the process
decreases with increasing concentration. For example, the highest CO conversion was shown in
Figure 1 to be roughly 8% of the 65 mol% CO composition feed gas. The amount of excess un-
reacted CO remaining is still nearly 60 mol% of the exit stream.
The following sections will discuss the non-iron components of the catalyst. Each
component’s known benefits, as well as the potential benefits of the new additive lanthana, will
be explained.
1.4 Ceria and Lanthana
In addition to previously discussed shortcomings, two other problems with using iron-
chromium oxides are chromium (VI) can be toxic and under certain conditions these catalysts
can enhance methanation or Fischer-Tropsch reactions and thus catalyze the formation of
hydrocarbons, reducing the amount of H2 produced from the system (Hu 2000). An alternative to
using solely chromia is to use a combination of less chromia with some ceria (cerium oxide); a
relatively more expensive lanthanide that has been shown to store and release H2 and O2 from
catalyst surfaces (Hu 2000). Ceria is currently being used in ammonia synthesis processes that
use catalysts similar to those used in WGS. One catalyst under investigation is Fe-Ce-Cr-O; this
catalyst provides the stability of the chromia, but uses less chromia than the industrial standard,
while the ceria enhances the ability for adsorbed oxygen species, like H2O and CO, to desorb

7
from the catalyst surface. Pure ceria reacting with CO2 can create undesired products under WGS
conditions. However, in the Fe-Ce-Cr-O catalyst, the ceria forms intermetallic M-Ce compounds
that facilitate CO desorption on the catalyst surface (Hu 2000).
Therefore, ceria addition to the catalyst can improve desorption of adsorbed species,
reduce use of potentially toxic chromium oxide, and reduce the reduction temperature necessary
in catalyst activation. This study used lanthana, a similar lanthanide oxide to ceria, but with
slightly different properties, to determine if the benefits of the ceria additive in the iron-chromia-
ceria catalyst are also present in an iron-chromia-lanthana catalyst; and if these benefits, such as
increased surface area and better oxygen desorption rates, are enhanced with lanthana compared
to ceria. Further, ultraviolet-visible (UV-Vis) spectroscopy was used to probe the oxidation state
of the catalysts to provide mechanistic insight on the catalysis.
1.5 Copper in Water Gas Shift Catalysts
The inclusion of 4 wt% CuO in the Fe3O4/Cr2O3 catalysts has been shown to reduce the
activation energy 25-27% for the WGS reaction (Rhodes 2003). This reduction in activation
energy was originally explained through metal Cu sites increasing the reducibility of the catalyst;
however, XRD shows that the CuO maintains a solid solution, meaning that the Cu is still
bonded in the lattice with the Cr and Fe and not as its own structure of metallic Cu, with the iron-
chromia base. Therefore no Cu metal is present (Rhodes 2003). TPR data from this study is
shown Figure 2.

8
Figure 2 Temperature programmed reduction of catalyst precursors using 5% H2 in Ar showing H2 consumption with increasing temperature: (a) Fe3O4/Cr2O3; (b) CuO/Fe3O4/Cr2O3.
Therefore, the addition of the copper decreases the peak temperature from about 375°C
tot 300°C suggesting, that less energy is required to reduce the catalyst. This is then manifested
in a reduction of activation energy from 110 (kJ mol-1) to 80 (kJ mol-1). The copper also acts as a
stabilizer of the CO reduction process; meaning that the iron-chromia catalyst is more readily
reduced by CO because of the addition of the copper oxide to the system. This is shown in
Figure 3 (Rhodes 2003).
Figure 3 Temperature programmed reduction of catalyst precursors using 5% CO in He showing CO consumption with increasing temperature: (a) Fe3O4/Cr2O3; (b) CuO/Fe3O4/Cr2O3.
9
This suggests that higher concentrations of CO can be added to the system and still
achieve the desired oxidation of the CO, potentially increasing throughput of WGS reactants in
an industrial process.
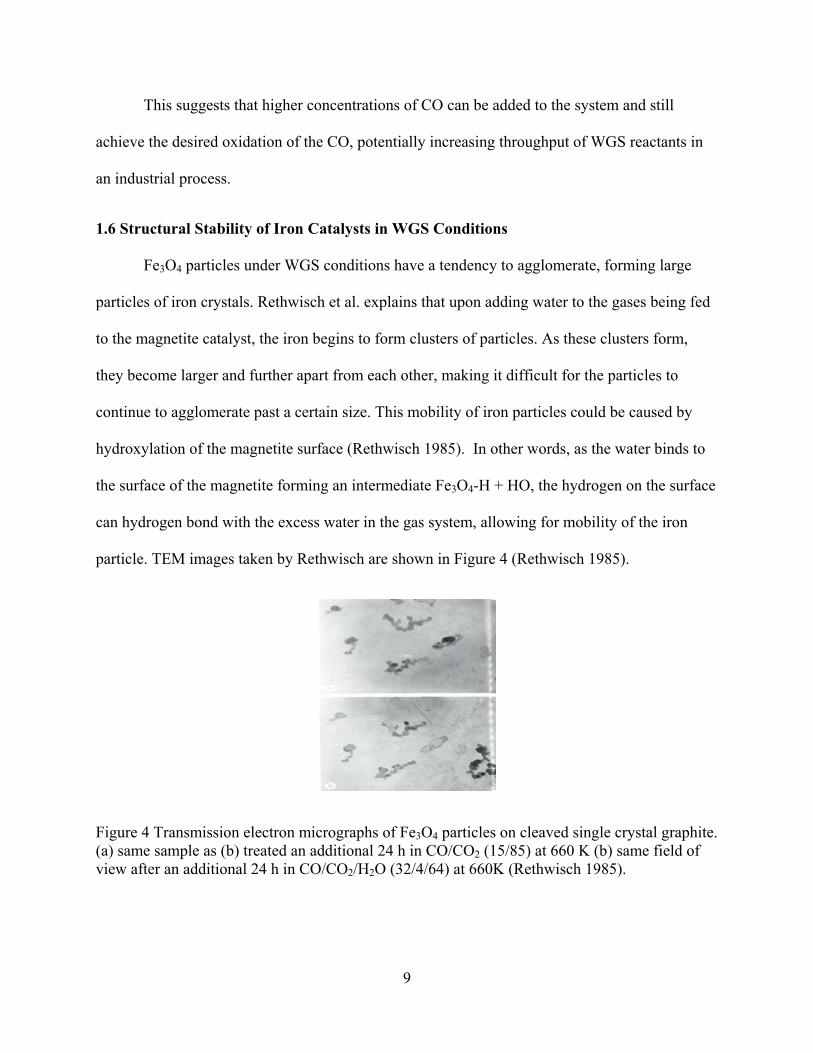
1.6 Structural Stability of Iron Catalysts in WGS Conditions
Fe3O4 particles under WGS conditions have a tendency to agglomerate, forming large
particles of iron crystals. Rethwisch et al. explains that upon adding water to the gases being fed
to the magnetite catalyst, the iron begins to form clusters of particles. As these clusters form,
they become larger and further apart from each other, making it difficult for the particles to
continue to agglomerate past a certain size. This mobility of iron particles could be caused by
hydroxylation of the magnetite surface (Rethwisch 1985). In other words, as the water binds to
the surface of the magnetite forming an intermediate Fe3O4-H + HO, the hydrogen on the surface
can hydrogen bond with the excess water in the gas system, allowing for mobility of the iron
particle. TEM images taken by Rethwisch are shown in Figure 4 (Rethwisch 1985).
Figure 4 Transmission electron micrographs of Fe3O4 particles on cleaved single crystal graphite. (a) same sample as (b) treated an additional 24 h in CO/CO2 (15/85) at 660 K (b) same field of view after an additional 24 h in CO/CO2/H2O (32/4/64) at 660K (Rethwisch 1985).

10
Note how the darker areas, or areas of highest Fe3O4 concentration, in the upper image
have come together to form a large cluster of darker particles in the lower right corner of the
lower image. It is because of this agglomeration of magnetite particles that a stabilizer must be
added to the catalyst to maintain as many active sites as possible during the WGS reaction.
1.7 Effects of Chromia in WGS Catalysts
Traditional WGS catalysts include roughly 8% by weight of Cr2O3. A study by Doppler
et al. suggests that due to the aforementioned agglomeration, “a significant fraction of the surface
area is then contained within the pore structure of the clusters of particles … and that the surface
area within these pores would no longer be accessible, especially in the presence of water.”
(Doppler 1988). Doppler’s study involved taking three catalysts (Fe3O4, Fe2.75Cr0.25O4, and
Fe2.5Cr0.5O4) and measuring the decrease in surface area with time. The decreases were 0.17,
0.15, and 0.05 (m2 gcat-1 h-1), respectively. Traditional WGS catalysts have surface areas around
40 m2/gram, so the catalysts would lose 90% of their original surface area in 9 days, 10 days, and
30 days respectively. Thus, as the Cr concentration increased, the reduction in overall surface
area caused by agglomeration decreased.
Many catalysts have been evaluated using Temperature Programmed Reduction (TPR)
sequences to determine the stabilizing effect of chromia. The data in Figure 5 are from a study by
Gunugunuri et al. (Gunugunuri 2011).

11
Figure 5 TPR data of multiple compositions of iron chromia catalysts performed by (Gunugunuri 2011).
The data in Figure 5 show that as the concentration of Cr is increased the peak
temperature at which the Fe2O3 to Fe3O4 reduction takes place increases. This suggests that
additional energy is required to reduce the catalyst, and therefore there is additional structural
stability of the catalyst. While an increase in activation energy usually denotes a decrease in
activity, this is an activation energy increase in the reduction of the catalyst with hydrogen, not in
the water gas shift reaction. This is additionally beneficial in that the added chromia inhibits the
reverse reaction. There was not, however, a significant change in the activation energy of the
water gas shift reaction with the addition of the chromium oxide.

12
The added stability given by the chromia is largely credited to the spinel structure formed
with iron. Figure 6 shows a crystal structure for an iron chromium spinel, with the iron in the
tetrahedral sites and the chromium in the octahedral sites. This structure provides added stability
by increasing the number of bonds between oxygen atoms and surrounding cations. The picture
on the left represents normal magnetite, while the picture on the right shows the added bonds of
the spinel structure. The iron is able to form octahedral connections to the oxygen atoms, while
the chromium takes the original octahedral positions of the magnetite structure.
Figure 6 Spinel structure adopted by XY2O4 oxides. In the normal spinel structure (FeCr2O4), tetrahedral sites are occupied by divalent cations such as Fe2+ and octahedral sites are occupied by trivalent cations such as Cr3+ (Sherman 2008).
In industry, water gas shift catalysts are traditionally pre-treated in 10% water at 400°C
for several hours to create this spinel structure before being placed into water gas shift
conditions. In this study, the spinel is formed over time as water is introduced during the water
gas shift process. This is done to reduce complexity in the water gas shift experimental design.
13
Chapter 2 Characterization and Kinetic Results
2.1 Introduction
This chapter will explore the kinetic data obtained using various lanthana-containing
catalysts, as well as describe characterization techniques utilized.
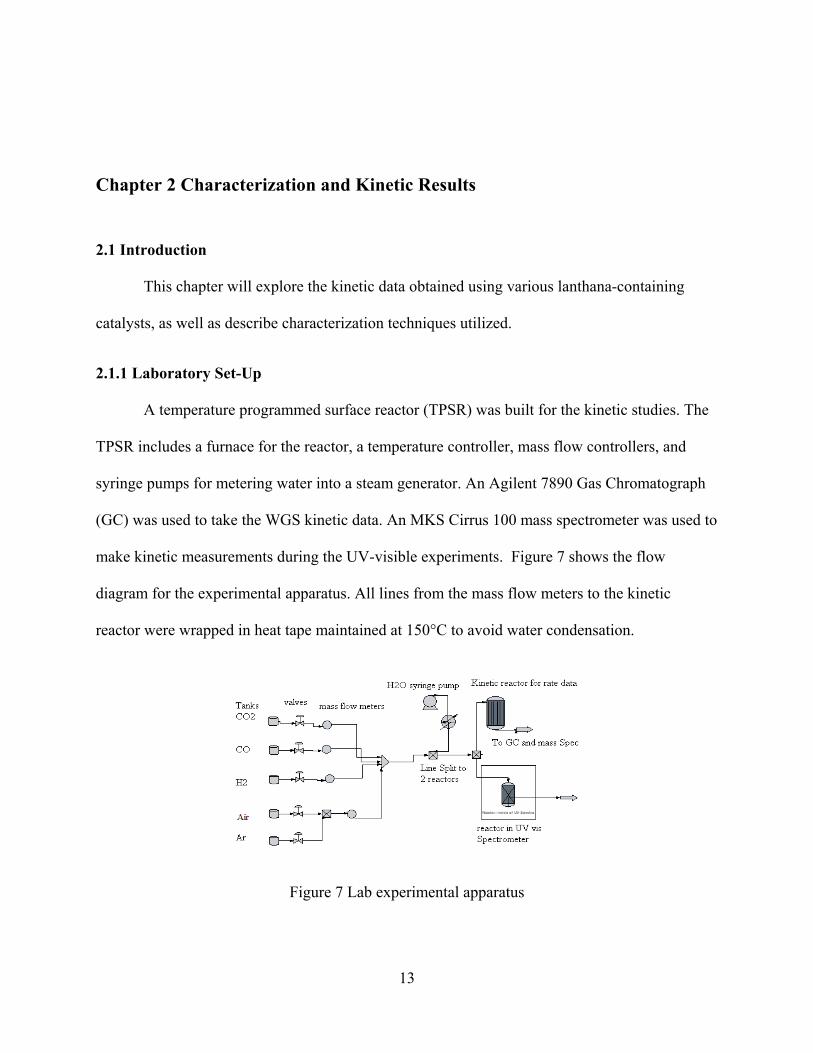
2.1.1 Laboratory Set-Up
A temperature programmed surface reactor (TPSR) was built for the kinetic studies. The
TPSR includes a furnace for the reactor, a temperature controller, mass flow controllers, and
syringe pumps for metering water into a steam generator. An Agilent 7890 Gas Chromatograph
(GC) was used to take the WGS kinetic data. An MKS Cirrus 100 mass spectrometer was used to
make kinetic measurements during the UV-visible experiments. Figure 7 shows the flow
diagram for the experimental apparatus. All lines from the mass flow meters to the kinetic
reactor were wrapped in heat tape maintained at 150°C to avoid water condensation.
Figure 7 Lab experimental apparatus

14
2.1.2 Experimental Assumptions
This system is designed to be a differential reactor to avoid mass and heat transfer limited
regimes, as well as to limit the reverse reaction. The differential reactor assumption can also
reduce the difficulty of reactor modeling to simple algebraic analysis, similar to that used with a
CSTR. However, due to the reverse WGS reaction, the method of initial rates was implemented
to determine the initial forward rate of reaction.
The method of initial rates involves measuring the rate for a given initial concentration of
CO. The reactant flow rate is varied to obtain several (3-4) different CO conversions that ideally
are less than 5%. A plot of CO conversion rate versus inverse flow rate is made and a best fit line
is extrapolated back to infinite flow (zero conversion) conditions. The y-intercept is taken as the
initial rate for that specific initial CO concentration. The process is repeated several times at
various initial CO concentrations until a log-log plot of initial rates versus initial concentrations
can be made, the slope of which is the reaction order for rate law of the catalyst. Repeating this
process at different temperatures permits determination of activation energies (via the Arrhenius
equation), as well as other kinetic data.
2.1.3 Catalyst Characterization
Catalyst characterization techniques employed in this study were surface area analysis,
temperature programmed reduction (TPR), temperature programmed oxidation (TPO), and
Energy Dispersive X-Ray Spectroscopy (EDX).
2.1.4 BET Surface Area Analysis
Nitrogen physisorption, commonly called BET (Brunauer, Emmett, and Teller) analysis
involves physical adsorption to measure total surface area of the catalysts. Nitrogen gas at the
15
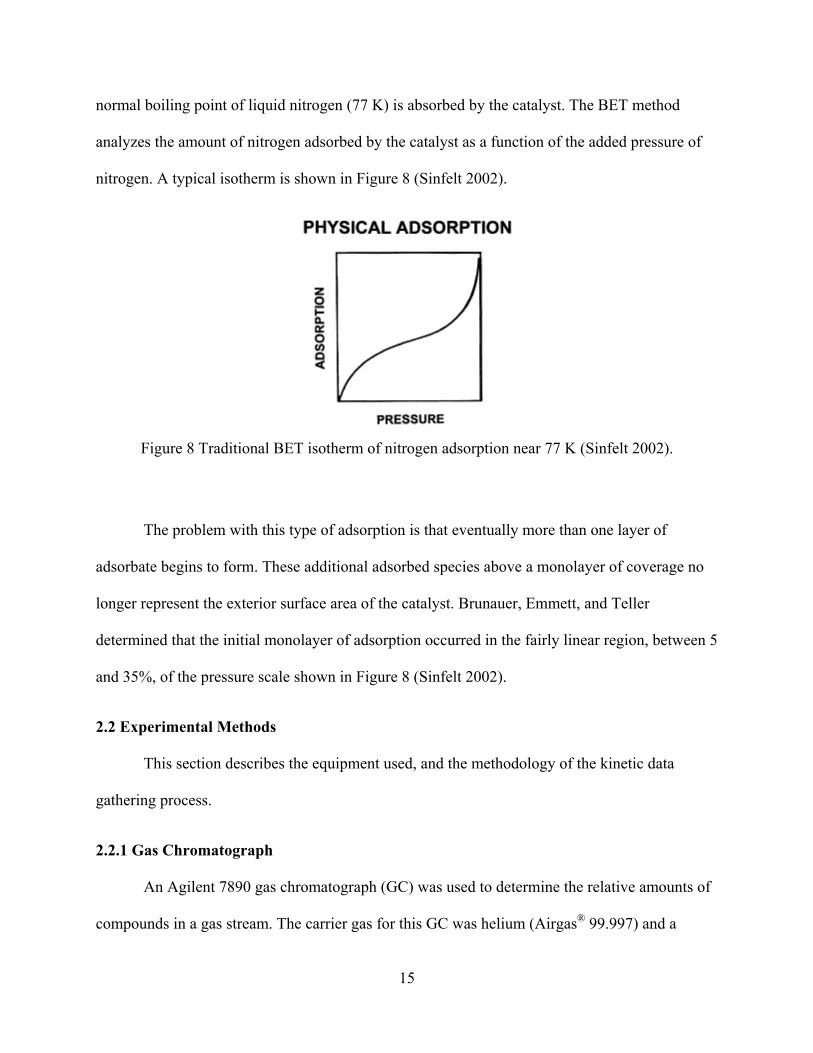
normal boiling point of liquid nitrogen (77 K) is absorbed by the catalyst. The BET method
analyzes the amount of nitrogen adsorbed by the catalyst as a function of the added pressure of
nitrogen. A typical isotherm is shown in Figure 8 (Sinfelt 2002).
Figure 8 Traditional BET isotherm of nitrogen adsorption near 77 K (Sinfelt 2002).
The problem with this type of adsorption is that eventually more than one layer of
adsorbate begins to form. These additional adsorbed species above a monolayer of coverage no
longer represent the exterior surface area of the catalyst. Brunauer, Emmett, and Teller
determined that the initial monolayer of adsorption occurred in the fairly linear region, between 5
and 35%, of the pressure scale shown in Figure 8 (Sinfelt 2002).
2.2 Experimental Methods
This section describes the equipment used, and the methodology of the kinetic data
gathering process.
2.2.1 Gas Chromatograph
An Agilent 7890 gas chromatograph (GC) was used to determine the relative amounts of
compounds in a gas stream. The carrier gas for this GC was helium (Airgas® 99.997) and a

16
thermal conductivity detector (TCD) was used. The column used was a packed column of length
2m outer diameter of 1/16 inches and an 80/100 Carboxen® type packing. The runs were done at
a starting temperature of 24°C and increased to 225°C at a rate of 20°C/min.
Figure 9 shows a GC trace for a 1wt% LaOx catalyst after 5 days of WGS conditions.
Each of the three compounds being measured, H2, CO, and CO2 (water is removed prior to the
GC by a desiccant bed) has a specific time at which it elutes from the column. Hydrogen comes
out first at approximately the 1 minute mark, CO at 3.7 to 4 min. and CO2 at 9 to 9.5 min.
Figure 9 1 wt% lanthana catalyst GC reading after 5 days WGS conditions.
The area under each of these peaks cannot be directly related to a concentration of these
elements without proper calibration. In this case, various known mixtures of CO and CO2 were
sent through the column and their relative peak areas measured. Using these peak areas for
known concentrations, the various compositions of CO and CO2 were obtained for WGS

17
conditions and converted to molar production of CO2. These data can be converted into WGS
rates and conversions for each catalyst, as shown in Section 2.3.3.
2.2.2 Mass Spectrometer
Mass spectroscopy involves ionizing gaseous compounds in a vacuum chamber and then
measuring the mass to charge ratio of the ionized particles. As a sample is taken continuously
over an extended period of time, there is an amount of residual particles that can cause an
increase in effective concentration in the system, which is manifested by a drift in the signal with
time. This “baseline drift” causes the baseline for the peaks to increase or decrease slightly over
time, based on the accumulation or removal a compound from the system.
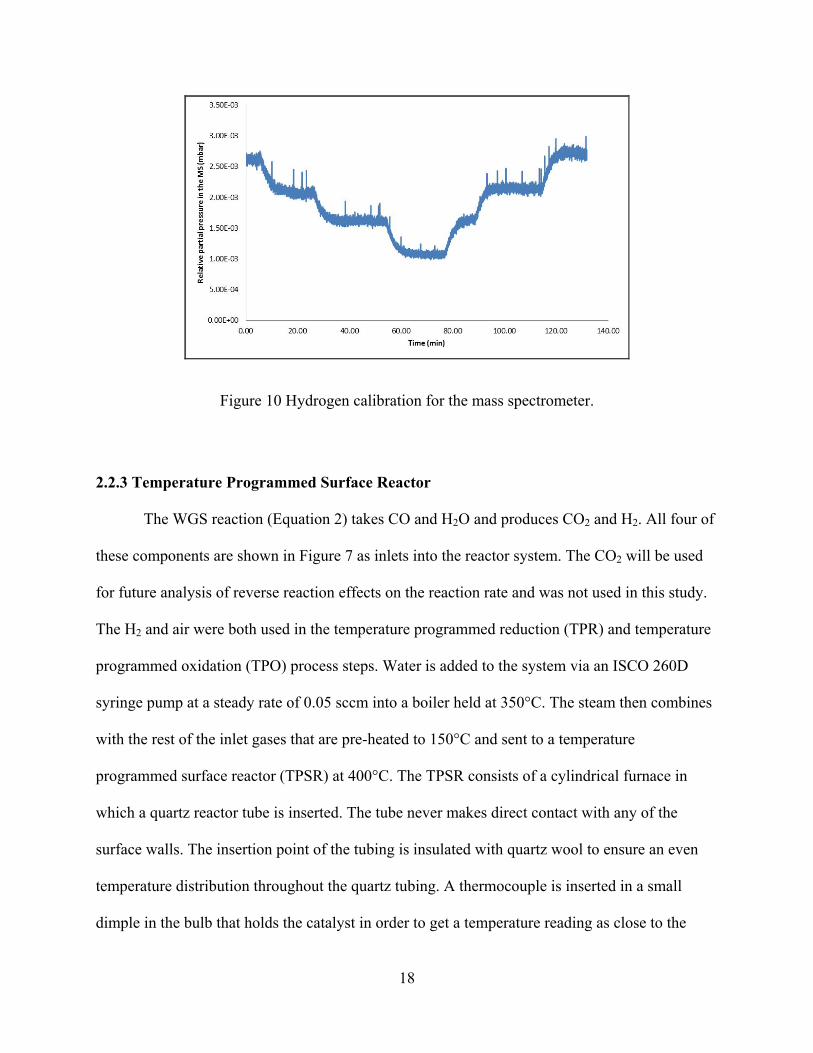
The output of this mass spectrometer is an electronic signal of the mass/charge (m/z) ratio
for each species. This value, translated to a partial pressure in the vacuum chamber, directly
correlates to concentration in the system, but still requires a calibration similar to the GC. An
example of this is shown in Figure 10. The initial hydrogen concentration is 5% H2 and 95% Ar.
The mixture is then stepped down to 4%, 3%, 2%, and then back up to 5% H2. The calibration
graph shows how the change in concentration between these percentages is linear, therefore a
direct correlation between the MS output and the real concentration in the line can be made. In
section 3.3.2 TPR and TPO Analysis via Mass Spectrometer, a baseline of hydrogen is shown
with a positive slope, this entire baseline can be assumed to be equal to the inlet 5% H2
concentration sent into the system, because this calibration graph is linear.
18
Figure 10 Hydrogen calibration for the mass spectrometer.
2.2.3 Temperature Programmed Surface Reactor
The WGS reaction (Equation 2) takes CO and H2O and produces CO2 and H2. All four of
these components are shown in Figure 7 as inlets into the reactor system. The CO2 will be used
for future analysis of reverse reaction effects on the reaction rate and was not used in this study.
The H2 and air were both used in the temperature programmed reduction (TPR) and temperature
programmed oxidation (TPO) process steps. Water is added to the system via an ISCO 260D
syringe pump at a steady rate of 0.05 sccm into a boiler held at 350°C. The steam then combines
with the rest of the inlet gases that are pre-heated to 150°C and sent to a temperature
programmed surface reactor (TPSR) at 400°C. The TPSR consists of a cylindrical furnace in
which a quartz reactor tube is inserted. The tube never makes direct contact with any of the
surface walls. The insertion point of the tubing is insulated with quartz wool to ensure an even
temperature distribution throughout the quartz tubing. A thermocouple is inserted in a small
dimple in the bulb that holds the catalyst in order to get a temperature reading as close to the

19
surface of the catalyst as possible without putting a hole in the quartz. This reactor tube contains
a quartz frit inside of the bulb in the quartz tubing to hold the catalyst in place during the
reaction.
Following the TPSR are two systems designed to remove water from the product gases.
The first is a flash tank roughly 18 in. long and 3 in. in diameter maintained at ambient
conditions. The second is a desiccator column of similar dimensions filled with a calcium sulfate
(Dri-rite®) desiccant. The water is extracted to obtain a clearer signal on the gas chromatograph.
The resulting product gases are then sent to the GC for analysis.
2.2.4 Catalyst Preparation
Appropriate amounts of Fe(NO3)3•9H2O (99.99%, Sigma-Aldrich), Cu(NO3)2•2.5H2O
(98%, Sigma-Aldrich), Cr(NO3)3•9H2O (>99.99%, Fisher Scientific) and La(NO3)3•6H2O
99.999%, Sigma-Aldrich) were dissolved in de-ionized water and stirred for about 30 minutes.
Sodium hydroxide (97.6%, Fisher Scientific) solution was used to increase the pH from acidic
(2-3) to basic (pH 11) to form a precipitate.
A calculated amount of sodium hydroxide was added in one quick step to the solution of
nitrates to reach a pH of approximately 11. This rapid titration facilitates uniform precipitation of
the various metal hydroxide species. Care was taken to avoid pH increases past the desired 11 by
a final dropwise titration to the desired pH. Also, the pH meter used measures a local pH, and if
stirring is not intense, the signal can be sporadic due to large pH gradients in the thick slurry
solution. During and after titration, the solution was stirred by a magnetic stir bar to prevent this
problem.

20
The brown precipitate was vacuum filtered and rinsed at least 3 times with de-ionized
water to remove soluble anions and cations. The catalyst was dried in an oven at 60°C overnight
and calcined in flowing dry air in a different oven at 300°C for several hours to create the initial
oxides.
These catalysts were named as a function of their weight percentage of oxide content
(Fe2O3, Cr2O3, CuO, La2O3) expected after this calcination, based on the amounts of nitrates used
in their preparation. For example, 83Fe-5La-8Cr-4Cu was prepared to contain 83 wt% Fe2O3, 5
wt% La2O3, 8 wt% Cr2O3 and 4 wt% CuO after calcination in air. After calcination, the catalysts
were crushed and sieved to retain particles with sizes between 125-250 μm. Finer particles were
pelletized using a 13 mm pellet die in a press, crushed, and sieved again until all catalysts
particles were in the desired size range.
2.2.5 Experimental Procedure
The catalyst goes through the following stages in the TPSR experimental design in order
to obtain kinetic data from the GC and MS.
1. 0.2 grams of the sieved catalyst particles 150-250 µm are placed into the reactor for 2
hours WGS reduction conditions.
2. WGS conditions continue for 5 days during which GC spectra are taken.
3. Once the reaction has reached equilibrium, a final GC sample is taken and the
temperature is changed between 350, 375, 400, and 425°C. The order of the temperatures
is randomized. Multiple GC spectra are taken after a half hour at each of these
temperatures at varying flowrates. This half hour delay is necessary for the flow rates and
temperatures to equilibrate in the system.

21
A pre-treatment of the catalyst was performed in order to maximize Fe3O4 concentration while
preventing carbon deposition on the surface of the catalyst. The treatment is done with 12.5 sccm
H2 (AirGas 99.95%), 3.0 sccm CO (Airgas 99.995%), 25 sccm Ar (AirGas 99.997%), and 0.011
mL/min distilled liquid water that passes through a boiler at 300°C. The ratio of mol H2O/mol
CO is 1.2 (R = 1.2). This is done to prevent coking or over-reduction of the catalyst. In a study
by Xue et al., a stoichiometric amount of CO and H2O were added to a blank reactor tube at
reaction temperatures, which showed carbon deposition on the quartz tubing (Xue 1996). The
study by Xue et al. shows that an R = 1.2 input prevents this coking effect. Coking or carbon
deposition could pose a serious problem for UV-Vis analysis in that if a carbon layer is deposited
on the catalyst that would significantly change the absorbance of the surface of the catalyst. A
series of potential side reactions that can occur under stoichiometric conditions were then
hypothesized; these are shown in Table 2.
Table 2 Side reactions at stoichiometric conditions of WGS (Xue 1996)
2CO ↔ C + CO2 CO + H2 ↔ C + H2O CO2 + 2H2 ↔ C + H2O 2CO + 2H2 ↔ CO2 + CH4 CO2 + 4H2 ↔ CH4 + 2H2O C + H2 ↔ CH4
Second, WGS conditions were maintained for 5 days while GC samples were taken.
WGS conditions are at 400°C, the inlet flows are 20.8 sccm CO and 0.05 mL/min H2O liquid,
and the system was maintained at atmospheric pressure. During this time, the GC peaks were
analyzed to show that the reaction had reached steady state. During the initial transient reaction
period, the amount of CO2 produced was higher than at the steady state condition.

22
Third, once the catalyst reached steady state reaction conditions, i.e. the production of
CO2 stabilized over an extended period of time; two tests were run to determine the initial WGS
rates and the activation energies of these catalysts. First, the CO flow rates were changed
between 20.8, 41.6, 62.4, and 81.12 sccm at a constant temperature. Secondly the temperatures
are changed between 350, 375, 400, and 425°C, and all four flow rates are tested at each
temperature. Each flow and temperature condition was held for half an hour before a GC sample
was taken to ensure that the reaction reaches steady state conditions at the new flow and
temperature. While the catalyst initially took five days to reach equilibrium, much less time was
required to equilibrate between small changes in temperature and CO flowrate.
2.3 Results and Discussion
This section discusses the results obtained through the TPSR experimental design as well
as the results of the catalyst characterization techniques used.
2.3.1 Catalyst Surface Area and Structural Stability
Structural stability of these catalysts was analyzed through changes in surface area of the
catalysts, before and after five days of use under WGS conditions. This was done using BET
analysis described in Section 2.1.3. The results for this analysis are shown in Table 3.

23
Table 3 BET analysis of catalysts before and after reaction
Before Reaction After Reaction % decrease
La% S.A Pore Vol Pore size
La % S.A
Pore Vol Pore size La % S.A
Pore Vol Pore size
(m2/g) (cm3/g) (Å) m2/g cm3/g (Å) m2/g cm3/g (Å)
0 8.4 0 0
1 101 0.101 40.0 1 88.7 0.291 131 1 11.9 -189 -228
2 196 0.199 40.6 2 157 0.342 87.4 2 20.1 -72.0 -115
5 218 0.224 41.0 5 112 0.269 96.3 5 48.6 -20.4 -134
10 196 0.217 44.2 10 111 0.251 90.9 10 43.5 -16.0 -105
20 206 0.230 44.6 20 57.1 0.128 90.1 20 72.2 43.9 -102
This shows that as lanthana is added, there is a significant increase in surface area of the
catalyst when compared to the base case 0 wt% lanthana catalyst. The graphical representation of
these data is shown in Figure 11. As the percentage of lanthana is increased, the amount of
surface area increases, however at higher concentrations of lanthana, the stability decreases. This
is seen in the significant increase in the percent of surface area loss before and after reaction of
the 20 wt% catalyst compared to the other catalysts. The 1 wt% catalyst decreases 11% in
surface area after reaction conditions, while the 20 wt% catalyst loses 72% of its surface area
after WGS reaction has taken place.
A possible reason for the increase in the loss of surface area with increasing lanthana is
that the increased lanthana is disrupting the previously discussed iron chromium spinel structure.

24
Figure 11 Surface area of catalysts before and after reaction.
There is a significant increase in the amount of surface area measured between the 0 wt%
lanthanum catalyst and the 1 and 2 wt% lanthana catalysts. Even a small amount of lanthanum
increases the surface area 10 to 20 times more than the base catalyst. This radical change seems
to indicate that there is something structurally different with the lanthanum catalyst. XRD
analysis will be conducted in future work to confirm the crystal structure difference between the
lanthana and base catalysts.
2.3.2 Energy Dispersion X-Ray Spectroscopy (EDX)
Energy Dispersion X-ray Spectroscopy (EDX) is a technique that measures the elemental
compositions at points near the catalyst surface to ensure that there is an even distribution of
components in the catalyst. This is important in that if all of the lanthana were concentrated in
one spot, only a small portion of the catalyst would react differently than the base catalyst. The
EDX performed for these catalysts were performed in a line across a surface of catalyst as well

25
as at individual points. Relative concentrations of the elements are shown in Table 4. The exact
weight percentages shown in this table are approximate; however, the EDX does show relatively
similar concentrations at a point and across the surface, suggesting that there is an even
distribution of particles in the system and that catalyst preparation was done correctly.
Table 4 EDX concentrations of catalysts at a point and across a surface
One Point Scan Scan Across Surface
La Cr Fe Cu Total La Cr Fe Cu TotalCatalyst ID (wt%) (wt%) (wt%) (wt%) (wt%) (wt%) (wt%) (wt%)
0 0.00 7.86 87.7 4.47 100 0.00 7.93 87.1 4.98 100 1 2.12 7.76 85.9 4.25 100 2.51 7.87 85.2 4.40 100 2 3.08 8.08 84.3 4.54 100 3.46 8.14 84.3 4.12 100 5 6.83 7.84 80.6 4.72 100 7.08 8.50 80.4 4.07 100 10 12.7 7.98 74.8 4.50 100 13.2 8.40 74.1 4.30 100
2.3.3 Rate Analysis
In Section 2.1.2 Experimental Assumptions, the method of initial rates was discussed. In
this section the analysis of multiple catalysts utilizing that methodology is discussed. Figure 12
shows the results of varying the flow rates of CO at various temperatures for the 1 wt% lanthana
catalyst. Data at multiple flow rates allow for a linear extrapolation back to an infinite flow rate,
which represents the initial reaction rate. For example the initial reaction rate at 400°C of the 1
wt% lanthana catalyst is 0.0177 (mol gcat-1 min-1). These flow rates are all at the same H2O to
CO ratio of 3:1.

26
Figure 12 Inverse flow rate versus reaction rate of 1 wt% lanthana catalyst at 4 different temperatures.
2.3.4 Rate Analysis Based on Lanthanum Percentage
The initial rate data compiled from all six catalysts at the various temperatures are shown
in Figure 13, which shows that the initial rate data for the 1 wt% lanthana catalyst performed
better than any other catalyst at the two extremes of the temperature range, 425°C and 350°C.
The 0 wt% catalyst performed best at 375°C and 400°C. This suggests that the lanthana does
have a small promotional effect on the WGS reaction as well as a thermal stabilization effect.
Also, as the La percentage increases to larger percentages, the activity of the catalyst decreases.
This decrease is believed to happen for two reasons: 1) there is less of the active iron phase of
Inverse Flowrate (min gcat mol‐1) Inverse Flowrate (min gcat mol‐1)
Inverse Flowrate (min gcat mol‐1)
Inverse Flowrate (min gcat mol‐1)
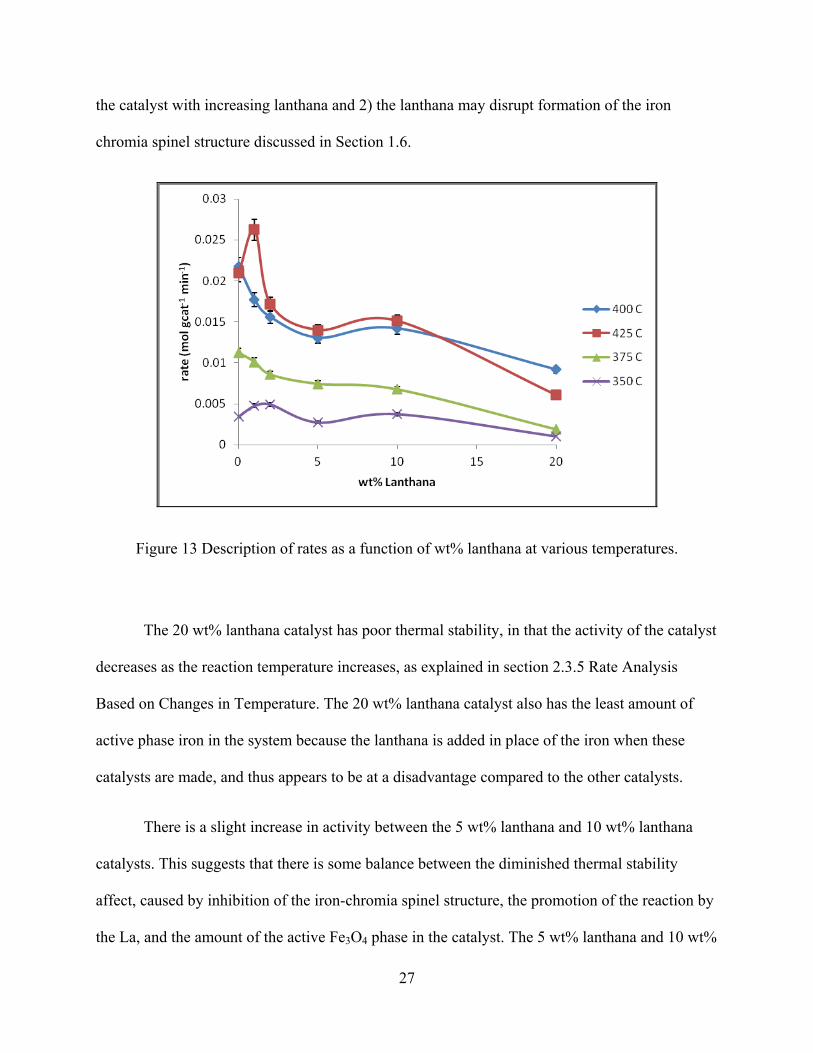
27
the catalyst with increasing lanthana and 2) the lanthana may disrupt formation of the iron
chromia spinel structure discussed in Section 1.6.
Figure 13 Description of rates as a function of wt% lanthana at various temperatures.
The 20 wt% lanthana catalyst has poor thermal stability, in that the activity of the catalyst
decreases as the reaction temperature increases, as explained in section 2.3.5 Rate Analysis
Based on Changes in Temperature. The 20 wt% lanthana catalyst also has the least amount of
active phase iron in the system because the lanthana is added in place of the iron when these
catalysts are made, and thus appears to be at a disadvantage compared to the other catalysts.
There is a slight increase in activity between the 5 wt% lanthana and 10 wt% lanthana
catalysts. This suggests that there is some balance between the diminished thermal stability
affect, caused by inhibition of the iron-chromia spinel structure, the promotion of the reaction by
the La, and the amount of the active Fe3O4 phase in the catalyst. The 5 wt% lanthana and 10 wt%

28
lanthana catalysts have slightly different surface area changes before and after the reaction, with
the 5 wt% lanthana catalyst decreasing 48% in surface area and the 10 wt% lanthana catalyst
decreasing 43% in surface area. Also, the 10 wt% lanthana catalyst starts with 23 (m2 g-1) less
surface area than the 5% but ends with only 2 (m2 g-1) less as shown in Table 3, which indicates
that the lanthana does provide some stabilizing effect to the catalyst. It appears to be significantly
weaker than the iron-chromia spinel structure; however, if the iron-chromia spinel structure is
nearly equally inhibited by the lanthana, then the catalyst with the higher lanthana content should
be slightly more stable providing more active Fe3O4 sites.
2.3.5 Rate Analysis Based on Changes in Temperature
Figure 14 shows how the catalysts performed over a series of temperatures. This figure
was created with the same data as Figure 13; however, it shows more clearly the temperature
effect of the lanthana. At the lowest temperature tested, 350°C, the 2 wt% lanthana catalyst has a
slightly higher initial rate than the 1 wt% lanthana and 0 wt% lanthana catalysts. As temperature
increases to 375°C, the reaction rates begin to increase for all the catalysts. The relative increases
are fairly similarl for all of the catalysts except for the 20 wt% lanthana, which has a much
slower rate increase between 350°C and 375°C, while the 0 wt% lanthana catalyst experiences a
sharp increase in rate. The slower rate of the 20 wt% lanthana catalyst could be due to the lack of
the iron-chromia spinel structure discussed earlier. The iron chromia spinel provides thermal
stability for the catalyst, so a significant decrease in activity with increasing temperature for the
highest lanthanum percentage is consistent with this explanation. This concept is shown again in
the increase from 375°C to 400°C. The sharp increase in activity for the 0 wt% lanthana catalyst
is interesting in that the 1 wt% lanthana catalyst goes through a similar steep ascent between
400°C and 425°C.

29
Between 375°C to 400°C, the 0 wt% lanthana catalyst still shows the highest rate as well
as the highest increase in rate from the previous temperature reading. Finally, the change
between 400°C and 425°C shows the 1 wt% lanthana catalyst continuing to increase in activity at
even higher rates than the change between 375°C and 400°C.
Figure 14 Rates as a function of temperature for all 6 catalysts tested.
This is interesting in that the 0 wt% lanthana catalyst and the 20 wt% lanthana catalyst
begin to level off during this transition. The 1 wt% lanthana catalyst has higher activity than the
0 wt% lanthana catalyst at this temperature. This is evidence that concentrations of lanthana that
are 1% or lower do not inhibit the chromium’s stabilizing effect. Rather, the stabilizing effect of
the lanthanum increases the catalyst activity at higher temperatures. This seems to be a
cumulative effect of thermal stability from both the spinel structure and the lanthana, as well as
the lanthana promotion effect.

30
2.3.6 Rate Analysis Based on Rate per Surface Area
One of the advantages to rare earth metal oxides, such as lanthana, is the high surface
area that it provides to the catalyst, as shown in section 2.3.1 Catalyst Surface Area and
Structural Stability. Figure 15 shows the rate in units of (mol m-2 min-1). The surface areas of the
catalyst change dramatically during reaction so Figure 15 shows the initial rates based on both
the initial surface area and the post-reaction conditions surface area. This form of the rate data
shows the superiority of the 1 wt% lanthana catalyst compared to the other lanthanum catalysts.
Figure 15 Rate as a function of surface area for the lanthanum catalysts. Per surface area of the catalyst after the reaction on the left and per surface area of the catalyst before reaction shown on the right.
The reaction rate using the 1 wt% lanthana is 30-48% higher than the next closest
catalyst. The rate per surface area of the 0 wt% lanthana catalyst is not shown here, due to the
base catalyst having significantly lower starting and ending surface areas than the lanthana
catalysts which significantly skews the data. Similarly the 20 wt% lanthana catalyst has a higher
rate/SA after reaction when compared to before reaction due to the 78% reduction in surface

31
area, which shows that despite the loss of surface area, the remaining area possesses similar
activity compared to the other catalysts with higher lanthana contents.
2.4 Conclusions
The addition of 1 wt% lanthana to the Fe-Cr-Cu catalysts increases reaction rates of the
catalyst at 425°C and 350°C, however the 0 wt% lanthana catalyst has the highest rates at 375°C
and 400°C. The 0 wt% lanthana catalyst shows significant drop off in rate at the 425°C mark,
suggesting that the lanthana provides a thermal stabilizing effect at higher temperatures. This
effect is smaller than the iron-chromia spinel effect; however, small doses of lanthana have a
compound thermal stabilizing effect. The increased reaction rates at higher temperatures could
allow for greater throughput of reactants in industrial settings.
Higher concentrations of lanthana decrease the activity due to what is believed to be
inhibition of the iron-chromia spinel structure as well as reduced amount of the active phase of
catalyst. The lanthana addition to the catalysts greatly increases the surface area of the WGS
catalysts (~40 (m2 g-1) to upwards of 200 (m2 g-1)). This surface area increase however did not
seem to have a great effect on the overall activity of these catalysts. Lanthana also lowers the
activity of the catalysts in higher concentrations.
As discussed in Section 2.3.2, the catalysts were also characterized using EDX and
showed an even distribution of components throughout the system, suggesting that the co-
precipitation method of making these catalysts leads to a solid solution of components.

32

33
Chapter 3 UV-Visible Assessment
3.1 Introduction
This chapter will discuss the UV-Visible spectroscopic methods and results.
3.1.1 UV-Visible Spectrometer (In-situ)
Figure 16 shows the Varian Cary 4000 UV-visible spectrometer used during this study. A
reactor with optically clear quartz windows contains catalyst in the sampling bay where it is
exposed to light. The reflected light is measured to quantify the changes in intensity of only the
diffusely reflected light from the catalyst surface, which is normalized relative to the reference
light intensity via the Kubelka-Munk equation described in Section 3.1.6.
Figure 16 Varian Cary 4000 UV-vis spectrometer provided by Varian Corporation (Varian Corp 2010).

34
3.1.2 UV-Visible Spectroscopy
One method of UV visible spectroscopy involves exposing a catalyst sample to a broad
spectrum of UV and visible wavelengths and detecting the absorbed portions of the diffusely
reflected light as a function of wavelength based on electron states of the samples. Using MoOx
species, Che’s group showed that the number of Mo species in an oxide cluster could be
determined. From that work, Webster determined the edge energy of a cluster and correlated that
to the number of bridging Mo-O-Mo bonds. In addition, UV–vis can also monitor the extent of
reduction of fully oxidized cations due to ligand to metal charge transfer (LMCT) transitions
(Wachs 2005). UV-visible spectra can gather information on the Fermi energy bands of metal
and metal oxide catalysts via the reflection of light from the catalyst surface. This information
can lead to new insights of molecular configurations on the surface as well as oxidation states of
the catalytic material.
3.1.3 Extent of Reduction
Extent of reduction refers to the relative oxidation state of a material compared to a “fully
oxidized” baseline condition. For example, in the WGS reaction, the iron may undergo
transitions from Fe2O3 to Fe3O4 to FeO to Fe metal. The oxidation states of the iron are
respectively 3+, 2.7+, 2+, and 0 in metallic iron. Being able to determine how much of each of
these components is present at any given time is useful in that the Fe3O4 is the active phase in the
WGS reaction. A simple average of the oxidation states is not sufficient because only the Fe3O4
is desired for the forward reaction.
3.1.4 X-Ray Adsorption Near Edge Spectrocopy (XANES)
XANES is a means by which a synchrotron is used to determine extent of reduction of a
catalyst. While a XANES study will not be performed in this work, XANES is a well understood

35
method for obtaining the extent of reduction data that this study is trying to find utilizing UV-
visible spectroscopy. Therefore, a brief introduction to spectroscopic methods of determining
extent of reduction is outlined in the following sections.
The synchrotron radiation required to perform a XANES spectra can provide an intense
source of radiation over a very wide range of energies. The intensity of synchrotron radiation is
thousands to millions of times greater than that of more common laboratory X-ray sources over
this wide energy range, greatly increasing the sensitivity of this type of spectroscopy (Gunter
2002).
Figure 17 depicts various XANES spectra of a mineral, mantle garnet, in which different
extent of reductions are being tested. The difference between the 10 spectra in Figure 17 is the
concentration of the Fe3+ oxidation state, with spectra “j” being pure Fe3+ and spectra “a” being
9% Fe3+. An unknown sample of garnet could now be compared to these normalized scans to
determine the Fe3+ quantity. The “and”, “alm”, and “ski”, in the figure represent three different
types of iron garnet configurations: andradite, almandine, and skiagite. While these iron
compounds are not used in WGS reaction, the concept that various forms of iron can be
distinguished via this spectroscopic technique serves as the basis for the eventual goal of this
project; to use UV-vis spectra to determine the overall extent of reduction of the system under
WGS conditions.

36
Figure 17 Normalized Fe K-edge XANES spectra of (a) mantle garnet (Fe3+/ΣFe = 0.090, Mon F), (b) alm0.93ski0.07 (Fe3+/ΣFe = 0.045), (c) alm0.79ski0.21 (Fe3+/ΣFe = 0.123), (d) alm0.51ski0.49 (Fe3+/ΣFe = 0.246), (e) alm0.12ski0.88 (Fe3+/ΣFe = 0.370), (f) and0.21ski0.79 (Fe3+/ΣFe = 0.458), (g) and0.45ski0.55 (Fe3+/ΣFe = 0.548), (h) and0.72ski0.28 (Fe3+/ΣFe = 0.704), (i) and0.93ski0.07 (Fe3+/ΣFe = 0.905), and (j) and1.0 (Fe3+/ΣFe = 1.000). The spectra have been offset for clarity (Berry 2010).
3.1.5 Edge and Pre-Edge Energies
Figure 18 shows the XANES spectra of iron. While the data in Figure 17 were
normalized for clarity in interpretation, Figure 18 has not been normalized. The two energies that
are important to note are the edge and pre-edge energies. As samples of varying oxidation states
are taken, the pre edge energies will be distinctly different, while the edge energies are nearly
identical for all the iron oxidation states. The X-ray energy absorbed during XANES causes an

37
electron in a lower orbital to move to a higher unoccupied orbital. The effect of decreasing
shielding as the oxidation state increases is to lower the energy of all of the bound orbitals, such
as 1s, and to increase the energy spacing between the 1s and the continuum. This is what causes
the increase in the energy of the absorption edge with increasing oxidation state. Thus, the
absorption edge positions of different complexes of the same oxidation state are similar (Gunter
2002).
Figure 18 The extended x-ray absorption fine structure (EXAFS) and XANES absorption spectrum of iron. This shows the edge, the XANES region, and the EXAFS region. This spectrum has not been corrected for background, nor divided by current (Gunter 2002).
Therefore, as different samples with differing extents of reduction approach the edge
energy, the spectra begin to align on top of each other. Thus the pre-edge energy spectra contain
the most useful information in determining extent of reduction of a given sample.
3.1.6 Kubelka-Munk Function
The XANES system described above creates spectra of relative intensity versus energy,
to determine extent of reduction. To obtain extent of reduction utilizing UV-visible spectroscopy,
similar relative intensity versus energy spectra must be produced.
38
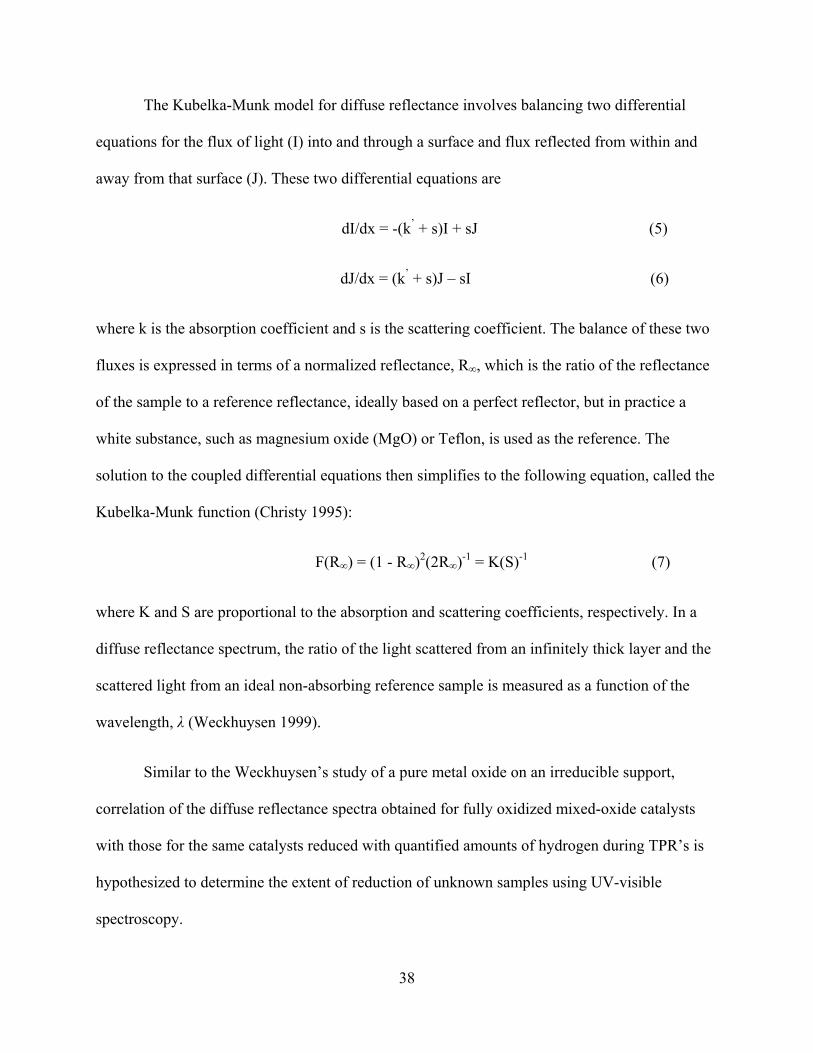
The Kubelka-Munk model for diffuse reflectance involves balancing two differential
equations for the flux of light (I) into and through a surface and flux reflected from within and
away from that surface (J). These two differential equations are
dI/dx = -(k’ + s)I + sJ (5)
dJ/dx = (k’ + s)J – sI (6)
where k is the absorption coefficient and s is the scattering coefficient. The balance of these two
fluxes is expressed in terms of a normalized reflectance, R∞, which is the ratio of the reflectance
of the sample to a reference reflectance, ideally based on a perfect reflector, but in practice a
white substance, such as magnesium oxide (MgO) or Teflon, is used as the reference. The
solution to the coupled differential equations then simplifies to the following equation, called the
Kubelka-Munk function (Christy 1995):
F(R∞) = (1 - R∞)2(2R∞)-1 = K(S)-1 (7)
where K and S are proportional to the absorption and scattering coefficients, respectively. In a
diffuse reflectance spectrum, the ratio of the light scattered from an infinitely thick layer and the
scattered light from an ideal non-absorbing reference sample is measured as a function of the
wavelength, λ (Weckhuysen 1999).
Similar to the Weckhuysen’s study of a pure metal oxide on an irreducible support,
correlation of the diffuse reflectance spectra obtained for fully oxidized mixed-oxide catalysts
with those for the same catalysts reduced with quantified amounts of hydrogen during TPR’s is
hypothesized to determine the extent of reduction of unknown samples using UV-visible
spectroscopy.

39
3.1.7 Extent of Reduction via UV-Visible Analysis
In an extended solid, different oxidation states of an element have different Fermi energy
levels. These differences are detectable by absorption or reflection of different intensities of UV-
visible light. In a study by Weckhuysen, in-situ UV-vis spectra were recorded for Cr+6 and Cr+3
oxidation states. Initially, nearly the entire sample was Cr+6; as time progressed, the energy peak
that corresponds to the pure Cr+6 lowered in intensity as more Cr+3 was produced from the
reduction of Cr+6. Figure 19 contains the results of the in-situ analysis for these catalysts, with
the arrow showing the measurements taken in time from start to finish. As the peak near 400 nm
decreases, the peak near 650 nm increases. This variation from the Cr+6 pure oxidized state
measures the extent of reduction of that catalyst as a function of time (Weckhuysen 2000).
Similarly, this study will use the UV-Visible technique used by Weckhuysen to measure
the changes in the iron oxidation state from the Fe3+ state to various lower oxidation states. As
the iron changes oxidation states the normalized absorbance of the surface, or Kubelka Munk
value, will increase. This leads to a direct correlation between the absorbance of the sample and
extent of reduction of the catalyst.

40
Figure 19 (A) In situ UV–Vis diffuse reflectance spectra of 0.5 wt.% CrOx/SiO2 catalyst treated at 350°C in 2% isobutane in N2 as a function of time. (B) In situ UV–vis diffuse reflectance spectra of 0.5 wt.% CrOx/Al2O3 catalyst treated at 350°C in 2% isobutane in N2 as a function of time (Weckhuysen 2000).
3.1.8 Structural Stability in the UV-Visible In-situ Reactor
During initial experiments, the sample cup was filled with a 1:1 mixture of quartz chips
to catalyst with 180-250 micron particles. A thermocouple installed in the Praying Mantis cell
and inserted into the top of the cup at an angle that does not inhibit the collection of diffuse

41
reflectance spectra from the center of the catalyst sampling surface was used to measure the
catalyst temperature.
Quartz chips were added to the system to prevent agglomeration of catalyst particles
under WGS conditions. In preliminary experiments, the catalyst particles agglomerated when
water was added to the system and then expanded, forming a dome on top of the sample cup.
With the catalyst no longer forming a flat surface to reflect the light, no meaningful UV-Visible
spectra could be obtained. Quartz chip dilution did not help the catalyst agglomeration problem.
To address this agglomeration problem, a catalyst pellet was used. The pellet was made at
5000 psi of compression and placed on top of a quartz particle bed. Figure 20 shows a
photograph of the pelletized catalyst in the Harrick cell. The bottom and sides of the pellet
chipped off into small particles that then agglomerated, and expanded, clogging the flow of the
inlet gases causing the inlet gases to build up pressure. Then, the pressure released, causing the
pellet to flip out of the sample cup.
Figure 20 Pellet catalyst under WGS conditions.

42
With the powdered catalyst, the agglomeration took a few hours. With the pellet, a full 30
hours of usable surface conditions were maintained. The initial surface of the pellet is still
smooth; meaning that had the pressure build up not occurred, data could have been gathered
indefinitely. Neither the TPR nor TPO requires the addition of water. The results of the collected
TPR and TPO data will be discussed in an upcoming section.
Section 1.7 discussed the formation of the iron-chromia spinel structure. The iron-
chromia spinel is supposed to inhibit this type of rapid sintering and agglomeration, providing
stability to the WGS catalyst. This spinel structure is normally formed via pre-treatment;
however, for these catalysts the spinel structure was formed in-situ with the UV-Vis system. The
formation of the spinel structure itself, could cause a small volumetric expansion that could
account for this type of morphological response, however this post WGS conditions structural
study will be performed as future work.
3.1.9 Reversibility of the Absorbance Spectra of the Catalysts
The topic of reversibility of the absorbance spectra of each catalyst being analyzed will
be discussed in upcoming sections. If a catalyst’s absorbance spectrum is fully reversible
between repeated reductions and oxidations, then the absorbance spectra should line up exactly
on top of each other. The data will show that this is not the case, which is not unexpected due to
the morphological changes suggested by the decrease in surface area of the catalysts discussed
previously. Reversibility is not important to the activity of the catalyst in WGS reaction
conditions, however it will facilitate future analysis of the extent of reduction calculation
utilizing UV-visible spectroscopy.

43
3.2 Experimental Methods
This section outlines the equipment and methodology used in order to obtain UV-Visible
spectra of the catalysts.
3.2.1 UV-Visible Diffuse Reflectance Apparatus
As shown above in Figure 7, the experimental apparatus utilizes multiple 3-way valves to
allow all of the aforementioned reactant gases to go to both the TPSR and the UV-Visible
spectrophotometer (UV-Vis). Water is added via a bubbler into the system, instead of the syringe
pump and boiler, like in the TPSR experiment because the UV-Vis (as explained in Section 3.1)
contains a HARRICK Praying Mantis Cell that cannot be heat traced. Therefore, there is a cold
spot in the line that would condense water, which would fog the quartz windows of the cell and
create pressure spikes as the condensed water reaches a heated section of the line and boils in the
system. The partial pressure of water was assumed to be equal to the saturation pressure at
ambient conditions. This assumption is reasonable for the small bubbles formed in the bubbler,
since the flow rates of the inlet gases are low (50 sccm), which allows sufficient time for
saturation. Air is added into the system using an Omega® direct read 100 sccm rotameter
calibrated for airflow.
The combined gases are then sent into the HARRICK Praying Mantis cell from beneath
the sample cup. This allows the gases to preheat before reaching the catalyst surface, as opposed
to being heated at the surface. Coming from underneath however does limit the flow rate of the
inlet gases in that too high of an inlet flow will disrupt the smooth sampling surface of the
catalyst for the UV-visible experiments.

44
Following the UV-Vis reactor, the product gases were routed to an MKS Cirrus 100 mass
spectrometer (MS). As described previously, the MS detects concentration changes of product
gases with time to quantify the temporal evolution of the reactants and products. This acts as a
check of kinetic data with the TPSR design as well as allows for inferences of extent of reduction
of the catalyst.
3.2.2 Diffuse Reflectance Spectroscopy Using a Harrick Praying Mantis Cell
Diffuse reflectance spectroscopy involves the illumination of powdered samples by
incident radiation. The incident light is partially absorbed, partially scattered. The scattered
radiation, emanating from the sample is collected in an integration sphere and detected. The
figure below shows a schematic overview of diffuse reflectance spectroscopy.
Figure 21 Schematic overview of a diffuse reflectance spectrophotometer with integration sphere (Weckhuysen 1999).
The ideal integration sphere, or area in which the differential radiation equation (which
simplifies to the Kubelka-Munk equation) is solved, is approximated by the Harrick Praying
Mantis Cell shown in Figure 22. This cell sits in the sample bay of the Varian Cary 4000 UV-
visble spectrometer shown in Figure 21. The cell focuses the incident light on the catalyst, which

45
sits in a small sample cup inside the mantis cell. The reflected light is captured by a series of
mirrors and routed to the detector.
The purpose of this cell and reaction chamber is to minimize the specular reflection of the
light off of the surface. Specular reflection is the direct reflection of light in a single direction at
the exact angle of incidence, like a mirror. This type of reflectance will create large spikes in
signal that will overshadow the diffuse reflectance data. Figure 22 shows the arrangement of the
mirrors and the light path within the praying mantis cell.
Figure 22 Harrick Praying Mantis Cell (Harrick Scientific 2012).
3.2.3 Challenges and Previous Measurements
UV-visible spectroscopy requires that the light that hits the catalyst surface be reflected
back from the surface to measure a change in intensity. Previous UV-Vis measurements of high
loading iron catalysts, like the WGS catalyst, have not been previously done. However, previous
diffuse reflectance UV-visible spectra of iron samples have been taken with low amounts of iron
(3-5 wt%) (Herranz 2006). The results are shown in Figure 23.

46
These spectra show not only the iron content of the catalyst, but also that variations in
preparation of the catalyst can result in significant differences in the UV-visible spectra.
Therefore, the first major challenge in obtaining reliable results for these spectra analyses are
repeatable catalyst preparation (Herranz 2006).
The second major challenge with using the in-situ UV-vis spectroscopy is that high
temperature WGS reaction iron catalysts are visibly black. Black objects absorb visible light and
if no light is reflected from the surface of the catalyst, then no data can be gathered. Previously,
this problem was solved by using low concentrations of iron, giving the catalyst a rust red color.
Figure 23. UV vis spectra for different iron based catalysts. The light gray lines represent calculated deconvolutions of the apparent constituent peaks that make up the actual spectra, which is the black, bold line (Herranz 2006).
47
This experiment extracted data from the 70-90 wt% FeOx catalyst compositions used in
industry. The hypothesis was that while these catalysts are black in the visible region, they may
provide useful data in the UV region or there may be bands in the visible region that produce a
usable signal. UV-vis spectroscopy has the potential to inexpensively and efficiently measure
the extent of reduction of these catalysts in-situ to provide new insight into the WGS mechanism
that would normally only be available through more complicated experiments, such as X-ray
absorption spectroscopy.
3.2.4 Data Gathering Procedure for the UV-Visible In-situ Reactor
Each catalyst that was examined in the UV-vis spectrometer was subjected to the same
series of seven reaction steps:
1. Initial oxidation and baseline scan
2. Temperature Programmed Reduction 1 (TPR1)
3. Temperature Programmed Oxidation 1 (TPO1)
4. TPR2
5. TPO2
6. Water Gas Shift Pre-Treatment
7. Water Gas Shift Conditions
After the initial catalyst preparation and calcination, the catalyst has potentially a mixture of
Fe3O4 and Fe2O3. The initial oxidation step is a flow of 30 sccm of AirGas® Ultra Zero Air (79%
N2 21% O2) at 400 °C for at least a half hour. A baseline absorbance scan is then taken from
12,500 wavenumbers to 50,000 wavenumbers (or cm-1) via Varian® Scan program. This fully

48
oxidized baseline serves as the comparison sample, instead of MgO, for the Kubelka Munk
function for all future scans.
The catalyst is then cooled at a rate of 10°C/min back to room temperature to avoid
thermal shock, at which point the air flow is shut off and a mixture of 47.5 sccm Ar (AirGas
99.997%) and 2.5 sccm H2 (AirGas 99.95%) is introduced. After a half hour of exposure at room
temperature for the system to equilibrate, the temperature is increased at 10°C/min up to 400°C.
This will also allow inference of initial oxidation states and optimum extents of reduction in the
catalysts. During this time, both the Varian Kinetics software as well as the MKS Cirrus Mass
Spectrometer collect data. The amount of hydrogen that leaves the system was then subtracted
from the amount entering the system, as determined from the mass spectrometer. The
consumption rate of hydrogen is then equal to the rate of reduction of the catalyst.
The Varian Kinetics Program collects absorbance as a function of time at a specific
wavelength. This study utilizes 800 nanometers or 12,500 wavenumbers. The MS measures
concentrations of the various components as a function of time. The programs are run for 3 hours
to assure that an accurate baseline concentration for the MS can be obtained. After 3 h, the
catalyst is then analyzed utilizing the Kubelka Munk function on the Varian Scan program;
which compares the catalysts absorption after the TPR to the initial oxidation baseline across the
12,500-50,000 wavenumber range of frequencies.
The catalyst is then cooled in preparation for step three, TPO1, in which 30 sccm of air
flow into the system with a steady ramp increase of 10°C/min for the same total time and
utilizing the same computer programs discussed in the TPR1 step. Afterwards, a Kubelka Munk
scan is also taken to compare the initial baseline to the re-oxidized catalyst. If the catalyst

49
reaction were reversible, the reduction and re-oxidation of the catalyst would have no effect on
the activity and absorption of the catalyst and the Kubelka Munk scan should read zero across all
frequencies, since it is referenced to the initial fully oxidized catalyst.
The catalyst is then cooled and goes through a similar procedure as TPR1 to measure the
stability and reversibility of the catalyst. Ideally, the scan at the end of TPR2 should line up
directly on top of the scan for TPR1. This would indicate that there is no decrease in the activity
of the catalyst through multiple cycles of oxidation and reduction.
The catalyst is then cooled again and goes through a second TPO similar to the first, with
the exception that the catalyst is not cooled down after this step. The catalyst is then ready to
begin water gas shift reduction conditions.
WGS pre-treatment conditions involve a mixture of 12.5 sccm H2, 3 sccm CO (Airgas
99.995%), 25 sccm Ar, flowing through a distilled water bubbler for 2 hours. This mixture of
inlet gases is used to maximize the amount of Fe3O4, the active iron phase, in the catalyst. During
this process the mass spectrometer gathers concentration data to show production of hydrogen
near the completed stages of the reduction process.
After the WGS reduction, the hydrogen flow is turned off, while the WGS conditions
proceed as long as possible, ideally ~100 h. Challenges in collecting the WGS data were
explained in section 3.1.8 Structural Stability in the UV-Visible In-situ Reactor. UV-visible
scans were taken across the frequency spectrum at regular intervals to show changes in the
oxidation states of the surface.

50
3.2.5 Methodology of UV-Visible Software
The Varian Scan® program scans over a series of frequencies, 12,500 to 50,000 cm-1, and
measures the absorbance at each frequency. Traditionally, the catalysts are measured against a
white catalyst, something that will reflect the vast majority of the light in order to have a
comparison point to absorption spectra from the sample. In this study, the fully oxidized catalyst
was used as a baseline for all Kubelka Munk calculations (the Kubelka Munk equations were
discussed in detail in Section 3.1.6 Kubelka-Munk Function). This is done by placing fresh
catalyst in the system and flowing air (Air Gas Ultra Zero air 20% O2) over the catalyst for 30
minutes at 400°C. This fully oxidized baseline acts as a better comparison for the Kubelka Munk
function for these catalysts because the catalyst is mostly black because it provides greater
sensitivity compared to the conventional white reference sample.
The UV-Visible spectrometer runs simultaneously with the mass spectrometer. The time
axis on the Kinetics® program line up exactly with the time and temperature scales in Figure 24
TPR 1 of 1wt% lanthana catalyst data from mass spectrometer. The Kinetics® program measures
the catalyst absorbance at a set frequency, 12,500 cm-1 or 800 nm for these experiments. This
frequency is used because it shows the greatest change in absorbance during reaction conditions.
3.3 Results and Discussion
This section discusses the results obtained through the UV-Vis experimental design.
3.3.1 TPR and TPO Results and Discussion
As previously described, both the TPR’s and TPO’s require mass spectrometer and UV-
Visible data. This section will discuss both sets of data and how they relate to each other.

51
3.3.2 TPR and TPO Analysis via Mass Spectrometer
Figure 24 TPR 1 of 1wt% lanthana catalyst data from mass spectrometer shows the
output from the initial TPR of the 1 wt% lanthana catalyst. The red line represents hydrogen
consumption, while the green line is water production. The red line dips as the green line
increases. This shows the reduction taking place, i.e.
3Fe2O3 + H2 ↔ 2Fe3O4 + H2O (8)
The two peaks are slightly offset from each other, which is due to differences between the
gas molecules. Water is much more polar than hydrogen and more likely to adsorb to the
surfaces inside in the MS chamber, making them have a longer residence time in the chamber
than the hydrogen. This is also the reason for the water having a much broader peak than the
hydrogen and a seemingly larger area. For these reasons, determinations of reaction rates were
calculated using the hydrogen consumption line.
Figure 24 TPR 1 of 1wt% lanthana catalyst data from mass spectrometer.

52
The best fit line is assumed to be the inlet baseline concentration of hydrogen. The
baseline for the hydrogen can change from run to run as explained in section 2.2.2 Mass
Spectrometer. Therefore the fit line shown above represents the inlet flow rate of 2.5 sccm
hydrogen. Numerically integrating the area below the data line and subtracting it from the area
below the fit line results in the area of consumption of the hydrogen. The percentage of the inlet
hydrogen consumed is then calculated. Using the inlet flow rate, the total number of moles of
hydrogen consumed was calculated. Similar measurements and calculations for the TPO’s were
performed to measure the amount of oxygen consumed. Table 6 shows the moles of hydrogen or
oxygen consumed for each catalyst tested, the amount of time over which consumption took
place and the peak temperature of consumption.
Table 5 Summary of hydrogen and oxygen consumption via mass spectrometry
Catalyst ID Percentage of
inlet consumed Moles
consumed Time of
Consumption (min) R squared of linear fit line
Peak Temp (°C)
TPR1 1La 1.14E-01 2.97E-04 29 9.83E-01 306
TPR2 1La 5.44E-02 1.65E-04 34 9.15E-01 364
TPO1 1La 2.97E-02 2.61E-04 40 9.88E-01 365
TPR1 5La 8.94E-02 1.38E-04 17 9.62E-01 286
TPR2 5La 5.30E-02 2.42E-04 50 9.98E-02 298
TPO1 5La 1.90E-02 1.22E-04 30 9.98E-01 324
TPR1 10La 6.74E-02 2.23E-04 37 9.60E-01 315
TPR2 10La 3.49E-02 9.37E-05 30 9.30E-01 338
TPO1 10La 3.54E-02 2.66E-04 35 9.90E-01 255
From these data, the 1 wt% lanthana catalyst consumed the most hydrogen; 2.97 x 10⁻⁴
mol. Figure 25 shows the graphic comparison of each of the catalysts for their respective runs. In
all cases, TPR2 consumes less than TPR1, which shows that the TPR/TPO process is not fully
reversible because the two lines are not identical. The time of consumption for each of the
catalysts increases from TPR1 to TPR2. Suggesting that there is some added limiting effect

53
caused by the reduction-oxidation-reduction cycle. The number of moles consumed decreases
significantly as shown in Figure 26.
Figure 25 TPR/TPO consumption per gram catalyst.
Also, the temperature of greatest consumption increases from TPR1 to TPR2. The blue
line in Figure 24 shows the hydrogen profile with respect to temperature. The greatest deviation
from the baseline of the hydrogen is considered to be the peak temperature of consumption of
hydrogen. Figure 25 shows that with increasing lanthana, there is a decrease in the moles of H2
consumed. This suggests that the 1 wt% lanthana catalyst is more reducible than the other
catalysts.

54
Figure 26 Change in peak temperature for TPR1 and TPR2.
The moles of oxygen consumed also increases slightly as the lanthana content of the
catalysts increases. This could be due to the lanthana increasing the oxidation activity of the
catalysts by adsorbing more oxygen, but it is more likely that the lanthana is facilitating the
oxygen desorption step like cerium does as explained in Section 1.4. However, as the lanthana
content is increased, the difference between TPR1 and TPR2 decreases for each of the catalysts.
3.3.3 TPR and TPO Analysis via UV-Visible Kinetics® Program
The data are represented first by time and second by temperature. The first graph shows
how the absorbance changes as the redox reaction process (TPR1TPO1TPR2) takes place.
The first TPR is shown in blue and reaches a final steady state value of 2.77 absorbance units
and reaches its maximum 5 minutes before the TPR2 reaction. This is in line with the MS data
showing that the time of consumption of hydrogen increased from TPR1 to TPR2 by 5 minutes.
This suggests that the absolute value of the absorbance can be directly related to the extent of
reduction of the catalyst. As the catalyst becomes more reduced, the absorbance units increase.

55
Also, the maximum value of the absorbance units decreased from 2.77 to 2.63 for TPR2. This
supports the previously discussed results of incomplete reversibility for the reaction. If the
reaction were fully reversible, the hydrogen consumptions during TPR1 and TPR2 would be the
same and the absorbance lines should line up.
Figure 27 Varian Kinetics program at 800 nm TPR and TPO for 1 wt% lanthana catalyst.
The slopes of the lines for the TPR/TPO spectra appear to have a direct correlation to the
rate of reduction or oxidation; with the steeper slopes having higher rates of consumption than
the shallower slopes. The consumption rates in (mol gcat-1 min-1) are shown below in Figure 28.

56
Figure 28 Rates of consumption for TPRs and TPO.
The slope of TPO1 from the Kinetics® program for the 10 wt% lanthana catalyst is
slightly steeper than the 1 wt% lanthana catalyst (-0.025 compared to -0.02). The oxygen
consumption rates in terms of (mol gcat-1 min-1) is slightly higher for the 10 wt% lanthana
catalyst compared to the 1 wt% lanthana catalyst. While the rate of oxygen consumption is not
relevant to WGS activity, the concept that the rates of the reaction can be correlated to the slopes
of the UV-Visible spectra is valuable. This will allow for future studies to correlate the activity
of the catalyst to the UV-Visible spectra obtained from the catalyst surface.
The TPR and TPO graphs for the 5 wt% lanthana catalyst (Figure 29) still show many
similarities to the 1 wt% lanthana catalyst. The TPR’s both increase and the TPO decreases. All
of the TPR and TPO graphs show this correlation. This shows that absorbance is responsive to
the overall extent of reduction in the system. This response in absorptivity is the foundation for
the overall extent of reduction calculation. The amount of change in absorbance can then be
directly related to amount of hydrogen or oxygen (TPR/TPO) consumed by the catalyst during

57
reduction. This then serves as a baseline for calculating the extent of reduction in the system
during WGS conditions.
The TPR1 still goes slightly higher than TPR2; however the steady state absorbance
difference for the 5 wt% lanthana TPRs is significantly smaller than the gap for the 1 wt%
lanthana TPR; 2.75 to 2.7 for TPR1 to TPR2 compared to the 0.14 absorbance units difference in
TPR1.
Figure 29 TPR TPO for 5 wt% lanthana catalyst via kinetics program.
Where these two differ is in the TPO; while the 1 wt% lanthana catalyst has a definite
“S” curve shape to its TPO, the 5 wt% lanthana catalyst has a much more gradual descent before
it reaches steady state absorbance level. This might suggest that the 5 wt% lanthana catalyst is
less active than the 1 wt% lanthana catalyst (as the WGS kinetic data show in Section 5.2.1).
Another reason for this could be the lanthanum’s ability to facilitate oxygen desorption. The

58
TPO is attempting to reincorporate an oxygen molecule into the iron oxide lattice; however, if
that oxygen desorbs before it can be properly bonded into the lattice structure, it would slow the
rate of oxygen consumption by the catalyst.
Section 1.4 explains that a possible effect of lanthanum is the facilitation of desorption of
oxygen species from the iron catalyst. This would also suggest that it is more difficult to adsorb
oxygen species onto the iron surfaces, making the TPO more difficult and therefore a more
gradual process.
Figure 30 shows the 10 wt% lanthana catalyst. These data continue the trend shown
between 1 wt% lanthana and 5 wt% lanthana because the TPO is significantly more gradual in
decline of absorbance units than the 1 wt% lanthana catalyst. The steady state absorbance unit
values are nearly identical after TPR1 and TPR2 (2.35 and 2.34 absorbance units for TPR1 and
TPR2, respectively).
Figure 30 TPR/TPO kinetics program of 10 wt% lanthana catalyst.
59
Another measure of activity in these catalysts is the overall change in absorbance from
start to finish. The 1 wt% lanthana catalyst has a change from 2 to 2.77, the 5 wt% lanthana
catalyst changes from 2.3 to 2.75, while the 10 wt% lanthana catalyst changes from 2 to 2.35
absorbance units. As the lanthana percentage increases, the overall change in the absorbance
units decreases, suggesting that there is less change in the catalyst during the TPR1 as lanthana
increased. In other words, as lanthana is increased, the reduction activity of the catalyst
decreased.
3.3.4 TPR and TPO Analysis via UV-Visible Scan® Program
Following the experimental method outlined in Section 3.2.4 Data Gathering Procedure
for the UV-Visible In-situ Reactor, each of the seven steps outlined has a UV-Vis scan taken
after it. These scans measure absorbance as a function of wavelengths of light from the visible
region (12,500 cm-1 wavenumbers) to the UV region (50,000 cm-1 wavenumbers). For the 1 wt%
lanthana catalyst, the scans following the first five procedure steps are shown in Figure 31. Each
of the procedure steps mentioned, TPR1, TPR2, etc. was performed prior to the scan. These
spectra represent an overall change in the absorbance of the catalyst after the reactions have
taken place.

60
Figure 31 TPR/TPO Scans for 1wt% lanthana catalyst. Scans were taken after each of the steps.
Figure 31 shows the significant change in signal at the 12,500 wavenumber frequency.
This area of the spectra shows the most change in absorbance; because of this, the 12,500
wavenumber frequency was used in the kinetics scans in the previous section. The first step
procedurally is TPR1, which has the highest overall Kubelka Munk value at 0.85. This is
expected because the greatest change in the catalyst should occur when the catalyst is fresh and
has not had a chance to deactivate.
Following TPR1, TPO1 is a relatively flat baseline along the x-axis. This suggests that
the catalyst was successfully re-oxidized to its initial oxidation state. If the Kubelka Munk
Function (F(R)) reference and the data to which this baseline is being compared to are exactly
equal, then the resulting F(R) output should be the x-axis. TPR2 however, only increases to a
maximum value of 0.4. This relates back to the previous discussion on reversibility of the
absorptivity of the catalyst, in that if the catalyst absorbance were fully reversible TPR1 and

61
TPR2 should line up directly on top of each other. Therefore, there is a direct correlation to the
F(R) value of a scan and the extent of the reaction taking place. Likewise, although TPO2 no
longer overlays the x-axis, the difference is considered negligible, with the second reoxidized
scan running virtually parallel to the x-axis at a slightly higher value of 0.06.
The last step before the WGS condition is the water gas shift reduction condition. This
step is unlike a TPR in that it attempts to maximize the magnetite content of the catalyst prior to
WGS conditions. Also, this is the first time water and CO are added to the system. This
combination of oxidizing (H2O) and reducing (CO) agents in the inlet stream during these
conditions help prevent the WGS reduction reaction from moving as high in F(R) units as the
TPR’s. This proves to be the case, as shown above. However, the shape of the WGS reduction is
the same shape as TPR1 and TPR2, suggesting that the majority of the reaction taking place is
the reduction of Fe2O3 to Fe3O4, like in the TPR’s, since multiple peaks are not observed that
would correspond to reduction to FeO or Fe that are expected to take place at higher
temperatures (Gunugunuri 2011).
Following the WGS reduction conditions, WGS conditions are immediately started in the
system. Figure 32 Scan results for 1wt% lanthana catalyst under WGS conditions shows how the
spectra changes during the WGS reaction. As time under WGS conditions increases, the F(R)
values increase, suggesting that the catalyst is undergoing further reduction. These are the data
that permit the extent of reduction calculation.

62
Figure 32 Scan results for 1wt% lanthana catalyst under WGS conditions.
Below is a side by side comparison of Figure 19 and Figure 32. The lower frequency
wavelengths for both are increasing as a function of time in the system. On the left, the
increasing F(R) values at the 625 nm wavelength signified the increase in Cr3+ production.
Likewise the increase at the 12,500 wavenumber or 800 nm wavelength on the right
demonstrates the extent of reduction of the Fe3O4 catalyst during WGS conditions. However, due
to the rapid physical expansion of the catalyst when exposed to water (as discussed in section
3.1.8 Structural Stability in the UV-Visible In-situ Reactor), the catalyst does not maintain its
surface long enough to reach a steady state absorbance value.

63
Figure 33 Side by side view of Figure 19 and Figure 32 for comparison.
Without a steady state absorbance value for the catalyst, a definite edge energy cannot be
accurately determined, and the techniques described in Section 3.1.5 Edge and Pre-Edge
Energies cannot be used. One of the major recommendations for future work is to resolve this
issue.
3.3.5 Extent of Reduction of 1 wt% Lanthana Catalyst Using UV-Visible Spectra
Taking the value of the Figure 32 scans at 12,500 wavenumbers (the frequency that
showed the most signal), and comparing the results with the amount of oxygen removed from the
lattice during the TPRs, gives the data shown in Figure 34. As discussed in Section 3.3.3, the
TPRs show the relative change in absorbance is sensitive to the oxidation state of the catalyst. By
normalizing the absorbance data via the Kubelka Munk function and comparing the different
absorbances at different times during the WGS process, an overall extent of reduction of the iron
Wavenumbers (cm-1)
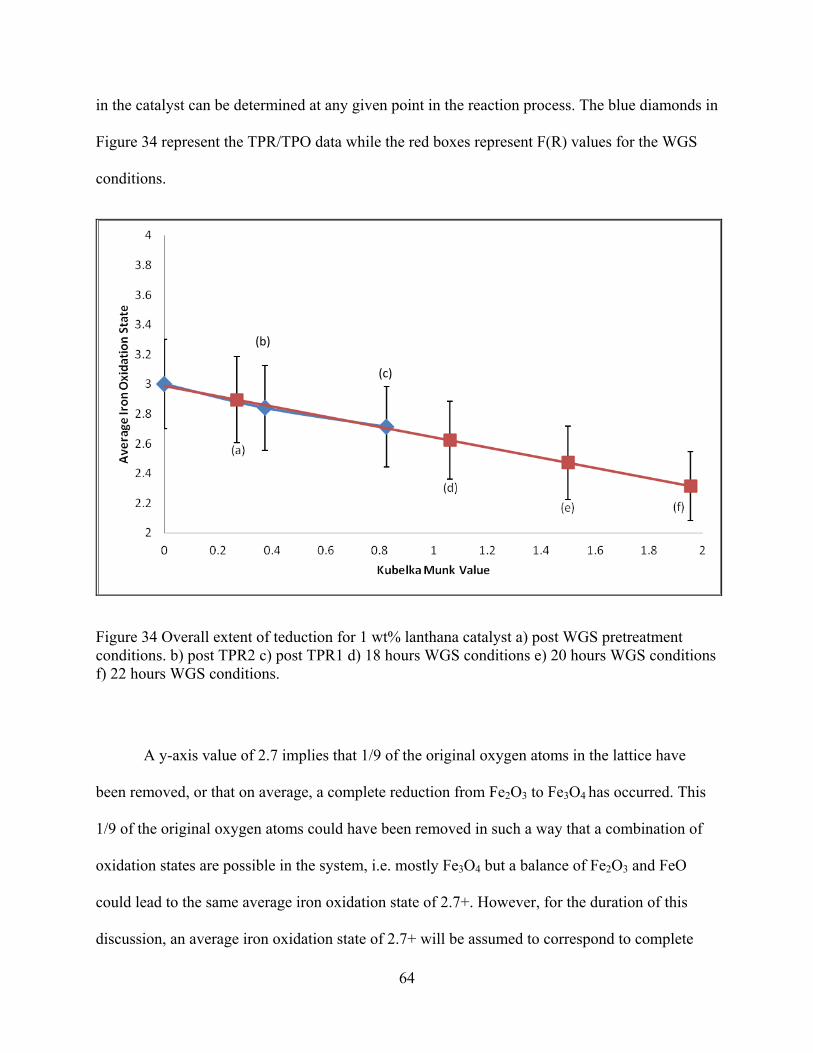
64
in the catalyst can be determined at any given point in the reaction process. The blue diamonds in
Figure 34 represent the TPR/TPO data while the red boxes represent F(R) values for the WGS
conditions.
Figure 34 Overall extent of teduction for 1 wt% lanthana catalyst a) post WGS pretreatment conditions. b) post TPR2 c) post TPR1 d) 18 hours WGS conditions e) 20 hours WGS conditions f) 22 hours WGS conditions.
A y-axis value of 2.7 implies that 1/9 of the original oxygen atoms in the lattice have
been removed, or that on average, a complete reduction from Fe2O3 to Fe3O4 has occurred. This
1/9 of the original oxygen atoms could have been removed in such a way that a combination of
oxidation states are possible in the system, i.e. mostly Fe3O4 but a balance of Fe2O3 and FeO
could lead to the same average iron oxidation state of 2.7+. However, for the duration of this
discussion, an average iron oxidation state of 2.7+ will be assumed to correspond to complete
(b)
(c)

65
conversion to Fe3O4. This assumption is supported by the TPR data, which show only a single
peak over the temperature range described. The red datum point that corresponds to the Fe3+ to
Fe2.7+ reduction is the 18 hours of WGS conditions point. This shows that the catalyst has its
highest concentration of active phase iron at approximately 18 hours of reaction conditions.
Also, as the reaction time increases, the oxidation state of the catalyst continues to decline to
Fe2.4+ in a matter of 4 hours from the Fe2.7+. This is a very rapid consumption of the active phase
in the catalyst. However, this is consistent with the high deactivation percentages (20-40%
deactivation in 5 days of use) shown in Section 2.3. Originally, this deactivation was attributed to
sintering; however, this extent of reduction data seem to suggest that loss in active phase could
be attributed to over-reduction of the catalyst under WGS conditions to FeO. Metallic iron is not
likely to be formed for two reasons. First, a much higher temperature (~590°C) is generally
required to reduce to the metal (Longbottom and Kolbeinsen). Second, metallic iron is an
effective methanation catalyst, but no methane was detected in the reaction products. Although
over-reduction is not expected during normal industrial WGS reaction conditions, the amount of
reactant water added during this optical study was limited to about 2:1 H2O:CO to avoid
condensation in the reactor cell, while a more typical industrial value, and the one used for the
kinetic experiments is 3:1. The smaller than normal quantity of water in the system could lead to
reaction conditions favorable for over-reduction of the catalysts. However, these preliminary
data must be confirmed during future work.
3.4 Conclusions
The objective of this work was to characterize the potential benefits of the addition of
lanthanum oxide (lanthana) to the iron-chromium-copper (Fe-Cr-Cu) oxide catalysts industrially
used in high temperature water gas shift processes via UV-Visible analysis as well as kinetic

66
analysis. Even though these iron oxide catalysts appear black to the eye, they do show a response
in the UV-visible region when referenced to the fully-oxidized catalyst. Thus, this signal is
interpreted as a change in absorbance from the catalysts fully oxidized state. This change in
absorbance due to changes in the oxidation states of the iron on the surface of the catalyst leads
to a direct calculation of overall extent of reduction in the catalyst. The 1 wt% lanthana catalyst
shows that after 18 hours of WGS conditions, the iron has reduced from Fe2O3 to Fe3O4 and
subsequently that the reduction from Fe3O4 to Fe2.4+ takes place in the following 4 hours.
Industrial WGS catalysts without lanthana take significantly longer (scale of days as opposed to
hours) to reduce past the active Fe2.7+ phase (Hla 2009). This suggests that the small lanthana
addition (1 wt%) to the catalyst increases the activity at higher temperatures and also increases
the reducibility of the catalyst. Even with the slight increase in activity, the generally lower
thermal stability indicates that a lanthana addition is likely not suitable for industrial catalysts.
However, this experiment was done with less water than industrial applications, which could
account for the over reduction of the catalyst. While more testing will be required to determine if
the addition of lanthana in WGS catalysts will be beneficial to industrial operations, the
technique of measuring extent of reduction using UV-Vis spectroscopy, with a catalyst that is
mostly black will prove to be useful in future catalytic work. Another possible explanation for
the apparent over-reduction is carbon deposition on the surface of the catalyst. Although this is
not expected, even at the 2:1 H2O:CO feed conditions, a simple TPO must be conducted after the
WGS conditions to verify that no CO2 is formed.

67
Chapter 4 Future Work
Overall extent of reduction was determined via UV-Visible spectrocopic analysis during
WGS conditions. However, the reaction did not reach steady state due to the physical expansion
of the catalyst described in Section 3.1.8. Once this is resolved, and a steady state UV-Vis
spectra can be taken, an edge energy can be determined (steady state absorbance value) and an
analysis based on pre-edge energies (transient region) can be conducted to determine extent of
reduction of the catalyst at any point in the system. Ideally, a catalyst of unknown reduction can
be put analyzed by a simple UV-visible spectrum scan to quantify the oxidation states of its
various components.
The UV-Vis experimental design requires multiple runs to determine if the rate of
reduction of the lanthana doped catalysts is as rapid as determined in this study. Due to the
intricate and delicate procedures involved in UV-Vis data collection, only a single run of the
WGS conditions was successfully taken. That run did not have enough time to equilibrate before
the physical expansion of the catalyst under WGS conditions ruined the surface. Therefore, there
are significant uncertainties in the results of the extent of reduction calculation. Currently,
through propagation of errors analysis, the error is estimated to be no less than 10% for the UV-
Vis data. This will be improved through better control of the variables in the UV-Vis system,
including maintaining a constant catalyst surface, as any small pressure spike in the inlet gas
flow could move the surface of the catalyst enough to skew the results. Also, the thermocouple

68
measuring the temperature on the surface needs to be placed in a more controlled way. Currently,
the thermocouple sits at varying angles and with varying contact with the catalyst, which would
distort the actual temperature readings on the surface, which may be a contributing factor to
over-reduction of the catalyst. Also, a more accurate measure of inlet water needs to be used to
verify the extent of reduction shown in Figure 34. The water inlet ideally should be at a 3:1 ratio
of H2O:CO (the current value is about 2:1). All of these sources of error could significantly
increase the reduction rate of the catalyst during WGS conditions, suggesting that the longevity
of the lanthana catalysts is longer than what was indicated by the UV-visible study. If that proves
to be the case, then the lanthana catalysts could prove to be effective in an industrial setting.
This study has shown that the addition of 1 wt% lanthana increases the WGS activity at
higher temperatures. To verify this, a more complete characterization of the catalyst needs to be
performed. This includes an XRD analysis of the lattice structure. XRD has the ability to
determine lattice structure of the crystal domains of a given catalyst. Unit cell dimensions, lattice
symmetry, crystallinity, and crystallite sizes can all be determined with XRD (Perego 1998).
While XRD does give extensive information regarding the bulk properties of a material, it gives
very little information at the surface of the material. XRD characterization will be performed to
determine if crystallinity and crystallite size of the as-prepared and the used catalysts have an
effect on the kinetics of the system. Also, XRD will verify if the preparation method of the
catalyst results in the solid solution of components that was assumed in this study. Eventually,
XANES spectra should also be taken in order to confirm the extent of reduction results obtained
by UV-visible spectroscopy against the demonstrated XANES method.
Finally, the rate law and mechanism of the reaction on these catalysts should be
determined. First, a simple power law rate analysis of the catalysts should be performed to better

69
model the kinetics of the system. This should be followed by a Langmuir-Hinshelwood
microkinetic model analysis of the rate based on a sequence of elementary steps.

70

71
References
Argyle, M. D., Chen, K., Resini, C., Krebs C., Bell A. T., and Iglesia E. (2004). “Extent of reduction of vanadium oxides during catalytic oxidation of alkanes measured by in-situ UV−Visible spectroscopy.” The Journal of Physical Chemistry B 108, no. 7: 2345.
Bartholomew, C. H. c2006. Fundamentals of industrial catalytic processes. Ed. Robert J. Farrauto 1941. 2nd ed. ed.Hoboken, N.J.: John Wiley.
Berry, A. J., Yaxley, G. M., Woodland, A.B., and Foran, G.J. (2010). “A XANES calibration for determining the oxidation state of iron in mantle garnet.” Chemical Geology 278, no. 1-2: 31-37.
Catalyst handbook 1989. Ed. ltd Imperial Chemical Industries. London: London : Wolfe.
Chinchen, G. C., Logan, R. H. and Spencer, M. S. (1984). “Water-gas shift reaction over an iron oxide/chromium oxide catalyst. II: Stability of activity.” Applied Catalysis 12, no. 1: 89-96.
Christy, A. A., Kvalheim, O. M., and Velapoldi, R. A. (1995). “Quantitative analysis in diffuse reflectance spectrometry: A modified kubelka-munk equation.” Vibrational Spectroscopy 9, no. 1: 19-27.
Doppler, G., Trautwein, A. X., Ziethen, H. M., Akmbach, E., Lehnert, R., Sprague, M. J., and Gonser, U. (1988). “Physical and Catalytic Properties of High-Temperature Water-Gas Shift Caatalysts Based upon Iron-Chromium Oxides.” Applied Catalysis 40, no. 1-2: 119-130.
Edwards, M. A. and W (2002). “Microstructural studies of the copper promoted iron oxidechromia water-gas shift catalyst.” Physical Chemistry Chemical Physics, Vol.4, no. 15: 3902-3908.
Gunter, K. K., Miller, L. M., Aschner, M., Eliseev, R., Depuis, D., Gavin, C. E., and Gunter, T.E. (2002). “XANES spectroscopy: A promising tool for toxicology: A tutorial.” Neurotoxicology 23, no. 2: 127-146.
Gunugunuri K. R., Gunasekara, K., Boolchand, P., and Smirniotis, P. G. (2011). “Cr- and ce-doped ferrite catalysts for the high temperature Water−Gas shift reaction: TPR and mossbauer spectroscopic study.” The journal of physical chemistry C 2011 115 (4), 920-930.

72
Harrick Scientific. Harrick praying mantis cell. Harrick Scientific. http://www.harricksci.com/ftir/accessories/group/Praying-Mantis%E2%84%A2-Diffuse-Reflection-Accessory (accessed Mar 30, 2012).
Herranz, T., Rojas, S., Perez-Alonso, F., Ojeda, M., Terreros, P., and Fierro, J. L. G. (2006). “Carbon oxide hydrogenation over silica-supported iron-based catalysts. influence of the preparation route.” Applied Catalysis A: General 308, : 19-30.
Hla, S. S., Park, D., Duffy, G. J., Edwards, J.H., Roberts, D. G., Ilyushechkin, A., Morpeth, L.D. and Nguyen, T. (2009). “Kinetics of high-temperature water-gas shift reaction over two iron-based commercial catalysts using simulated coal-derived syngases.” Chemical Engineering Journal 146, no. 1: 148-154.
Hla, S. S., Sun, Y., Duffy, G. J., Morpeth, L. D., Ilyushechkin, A., Cousins, A., Roberts, D. G., and Edwards, J. H. (2011). “Kinetics of the water-gas shift reaction over a La0.7Ce0.2FeO3 perovskite-like catalyst using simulated coal-derived syngas at high temperature.” International Journal of Hydrogen Energy 36, no. 1: 518-527.
Hu, Y., Jin, H., Liu, J., and Hao, D (2000). “Reactive behaviors of iron-based shift catalyst promoted by ceria.” Chemical Engineering Journal 78, no. 2-3: 147-152.
Longbottom, R., Kolbeinsen, L. (2008). “Iron ore Reduction with CO and H2 Gas Mixtures –Thermodynamic and Kinetic Modelling.” New Direct Reduction, Proceedings of the 4th Ulcos Seminar, October 2008.
Perego, G. (1998). “Characterization of heterogeneous catalysts by X-ray diffraction techniques.” Catalysis Today 41, no. 1-3: 251-259.
Ramachandran, R. and Menon, R. K. (1998). “An overview of industrial uses of hydrogen.” International Journal of Hydrogen Energy 23, no. 7: 593-598.
Rhodes, C. (2003). “Studies of the role of the copper promoter in the iron oxide/chromia high temperature water gas shift catalyst.” Phys. Chem. Chem. Phys 5, : 2719-2723.
Rhodes, C., Williams, B. P., King F., and Hutchings, G. J. (2002). “Promotion of Fe3O4/Cr2O3 high temperature water gas shift catalyst.” Catalysis Communications 3, no. 8: 381-384.
Sato, T., Kurosawa, S., Smith, R. L., Adschiri, T., and Arai, K. (2004). “Water gas shift reaction kinetics under noncatalytic conditions in supercritical water.” The Journal of Supercritical Fluids 29, no. 1-2: 113-119.
Sherman, D. M. (2008). “Oxide and hydroxide minerals.” In AccessScience, ©McGraw-Hill Companies.
Sinfelt, J. H. (2002). “Role of surface science in catalysis.” Surface Science 500, no. 1-3: 923-946.

73
Sun, Y., Hla, S. S., Duffy, G. J., Cousins, A. J., French, D., Morpeth, L. D., Edwards, J. H., and Roberts, D. G. (2011). “Effect of Ce on the structural features and catalytic properties of la(0.9−x)CexFeO3 perovskite-like catalysts for the high temperature water–gas shift reaction.” International Journal of Hydrogen Energy 36, no. 1: 79-86.
Varian Corp. Varian Cary 4000 UV-visible spectrometer. Varian Corporation. http://www.varianinc.com.cn/products/spectr/uv/brochure/1942.pdf (accessed Sep 25, 2010).
Wachs, I. E. (2005). “Recent conceptual advances in the catalysis science of mixed metal oxide catalytic materials.” Catalysis Today 100, no. 1-2: 79-94.
Weckhuysen, B. M. and Schoonheydt, R. A. (1999). “Recent progress in diffuse reflectance spectroscopy of supported metal oxide catalysts.” Catalysis Today 49, no. 4: 441-451.
Weckhuysen, B. M., Verberckmoes, A. A., Debaere, J., Ooms, K. Langhans, I. and Schoonheydt, R. A. (2000). “In situ UV–Vis diffuse reflectance spectroscopy — on line activity measurements of supported chromium oxide catalysts: Relating isobutane dehydrogenation activity with Cr-speciation via experimental design.” Journal of Molecular Catalysis A: Chemical 151, no. 1-2: 115-131.
Xue, E., O'Keeffe, M., and Ross, J. R. H. (1996). “Water-gas shift conversion using a feed with a low steam to carbon monoxide ratio and containing sulphur.” Catalysis Today 30, no. 1–3: 107-118.
Zhao, H., Hu, Y., and Li, J. (1999). “Reduced rate method for discrimination of the kinetic models for the water–gas shift reaction.” Journal of Molecular Catalysis A: Chemical 149, no. 1–2: 141-146.