uv resonance raman investigation of the conformations and
TRANSCRIPT

UV Resonance Raman Investigation of the Conformations and Lowest Energy AllowedElectronic Excited States of Tri- and Tetraalanine: Charge Transfer Transitions
Bhavya Sharma and Sanford A. Asher*Department of Chemistry, UniVersity of Pittsburgh, 219 Parkman AVenue, Pittsburgh, PennsylVania 15260
ReceiVed: January 15, 2010; ReVised Manuscript ReceiVed: March 16, 2010
UV resonance Raman excitation profiles and Raman depolarization ratios were measured for trialanine andtetraalanine between 198 and 210 nm. Excitation within the π f π* electronic transitions of the peptidebond results in UVRR spectra dominated by amide peptide bond vibrations. In addition to the resonanceenhancement of the normal amide vibrations, we find enhancement of the symmetric terminal COO- vibration.The Ala3 UVRR AmIII3 band frequencies indicate that poly-proline II and 2.51 helix conformations and typeII turns are present in solution. We also find that the conformation of the interior peptide bond of Ala4 ispredominantly poly-proline-II-like. The Raman excitation profiles of both Ala3 and Ala4 reveal a charge transferelectronic transition at 202 nm, where electron transfer occurs from the terminal nonbonding carboxylateorbital to the adjacent peptide bond π* orbital. Raman depolarization ratio measurements support thisassignment. An additional electronic transition is found in Ala4 at 206 nm.
Introduction
UV resonance Raman (UVRR) spectroscopy is recognizedas a powerful technique for probing peptide and proteinsecondary structure.1-14 UVRR spectroscopy also providesinsight into the geometry of the excited states and electronictransitions through Raman excitation profiles and Ramandepolarization ratios.11-13 Excitation between 180 and 215 nmis in resonance with the amide π f π* electronic transition ofthe peptide backbone, results in enhancement of amidevibrations.1-13 In the work here, we use UVRR spectroscopyto examine the secondary structure conformations and underly-ing electronic transitions of both Ala3 and Ala4.
Alanine-based peptides are often used as theoretical andexperimental models to study protein conformation andfolding.1,2,15-25 The folded state of longer alanine peptides ispredominantly R-helix-like,1-3,19,24,25 while the conformation ofthe unfolded state has been established to be a polyproline II(PPII)-helix-like structure9,20-23,26 (although there remains somecontroversy with this assignment27,28). Short alanine peptides,such as trialanine (Ala3) and tetraalanine (Ala4), are often usedas models for the unfolded state of peptides and proteins.Although there have been numerous studies of Ala3 and Ala4
which have identified a number of equilibrium conformations,the conformational distributions are still not clear.15,29-43
Most studies agree that the unfolded state for both peptidesis populated mainly by the poly-proline II helix (PPII)conformation.15,29-36,38,41-43 There is, however, little agreementon the other conformations present in equilibrium. The reportedconformational distributions include only PPII,31,39,41,42 PPII witheither an additional � structure29,30,33 or a right-handed R-helix(RR),43 and a � structure with an RR-helix.15,32,35,36,40 Anotherstudy reported that the conformations in solution include PPII,a �-like structure, an RR-helix, and a γ-turn.38 A few studiesthat found only one conformation present assigned it to eithera left-handed helix34 or an extended �-helix-like structure,37 bothof which are similar to a PPII-like conformation.
In the study here, we measured the UVRR excitation profilesand Raman depolarization ratios of aqueous solutions of Ala3
and Ala4 between 198 and 210 nm at 25 °C to determine thesolution conformation(s) and electronic transitions of Ala3 andAla4. We find that both Ala3 and Ala4 adopt three primaryconformationssPPII-like, 2.51-helix-like, and type II turnssandthat Ala4 may also adopt an additional unknown conformation.We observe the previously described charge transfer transition12
at 202 nm in both peptides. We also observe a transition inAla4 at 206 nm, whose origin remains murky.
Materials and Methods
Sample Preparation. Dialanine (Ala2), trialanine (Ala3), andtetraalanine (Ala4) were purchased from Bachem (Torrance, CA)and used as received. We used 6.6 mM, pH 7 solutions of Ala3
and Ala4 for the UVRRS measurements. Each sample containedsodium perchlorate (0.2 M) as an internal standard. The UVRRspectral measurements were taken at 25 ( 0.5 °C.
Raman Instrumentation. The UVRR instrumentation waspreviously described.44 The laser source used was a PositiveLight Co. Indigo-DUV Ti:sapphire laser system (Coherent, SantaClara, CA). The Indigo-DUV system utilizes an intracavityfrequency doubled, Q-switch pulsed Nd:YLF Evolution 15 laser(527 nm, 30 ns pulse width, 5 kHz repetition rate, 10 W averagepower) to pump a Ti:sapphire oscillator, which generates tunableradiation from 772 to 840 nm. Raman excitation in the deep UVis obtained by mixing the third harmonic with the fundamental,producing tunable radiation between 193 and 210 nm. The averagepowers in the deep UV vary between 2 and 5 mW.
The laser beam was focused into a temperature-controlled,circulating flow stream. The flow stream was purged with N2
to eliminate Raman scattering from the O2 band at 1555 cm-1.Each 20 mL sample was irradiated for a maximum of 15 min.The scattered light was directed into a subtractive doublemonochromator,44 and the Raman scattered light was detectedby a liquid nitrogen cooled CCD (Princeton Instruments, Spec-10:400B). The Raman intensities were normalized to that ofthe 932 cm-1 perchlorate (ClO4
-) symmetric stretch vibration.* To whom correspondence should be addressed. E-mail: [email protected].
J. Phys. Chem. B 2010, 114, 6661–6668 6661
10.1021/jp100428n 2010 American Chemical SocietyPublished on Web 04/26/2010

The spectra were analyzed and deconvoluted using Grams/32AI 8.0 software (Thermo Electron Corporation, Waltham, MA).
UV Raman depolarization ratios (F) were measured using a180° back scattering geometry. The light collected from thesample was directed through a UV linear dichroic polarizer(Oriel Instruments, Stratford, CT) followed by a crystallinequartz polarization scrambler (Spex Industries, Edison, NJ)before the monochromator entrance slit. The depolarization ratioF was calculated as a ratio of the perpendicular polarized light(I⊥) to the parallel polarized light (I|):
The depolarization ratios of ClO4- and cyclohexane were used
as standards14 to verify the accuracy of the measured depolar-ization ratios.
Spectrometer Efficiency. The spectrometer used was amodified Spex 1401 double monochromator that operates overthe 193-270 nm range. We corrected for the wavelengthdependence of throughput efficiency by using previouslydetermined spectrometer efficiencies.44
Absorption Measurements. The UV absorption spectra ofAla2, Ala3, and Ala4 between 190 and 250 nm were measured usinga Cary 5000 Varian UV-vis-NIR spectrophotometer. The absorp-tion measurements were taken with solution concentrations of 0.5mM at pH 7 and pH 2 at room temperature (25 ( 0.5 °C).
Results and Discussion
Absorption Spectra. The absorption spectra of Ala2, Ala3,and Ala4 are shown in Figure 1. The molar absorptivitiesincrease for all three peptides at both pH 7 and pH 2 as thewavelength decreases from 250 to 190 nm.
For Ala2, the broad absorption band centered below ∼190nm derives from the amide π f π* NV1 electronic transitionfor both pH 7 and pH 2 (Figure 1a). The absorption maximumof the pH 2 spectrum, where the carboxylate group is protonated,appears to be blue-shifted compared with the pH 7 spectrum.The pH difference spectrum for Ala2 indicates the presence ofan underlying transition in the pH 7 absorption spectrum at∼202 nm, which disappears at pH 2. The absorption differencespectra for each peptide can be well fit with two Gaussian bands(Figure 2). For Ala2, the Gaussian bands are centered at 180nm (not shown) and 203 nm (Figure 2a). The 180 nm band isassigned to the amide NV1 π f π* electronic transition, andwe assign the ∼203 nm band to a charge transfer transition,similar to those previously found in Gly dipeptides.12 Chen etal.12 previously demonstrated that a charge transfer transitionoccurs at ∼200 nm in short Gly peptides. The transition involvestransfer of charge from the nonbonding carboxylate orbital tothe amide π* orbital (Figure 3). This charge transfer banddisappears in the low pH protonated species.
For Ala3 (Figure 1b) and Ala4 (Figure 1c), the broadabsorption band centered below ∼190 nm derives from theamide π f π* NV1 electronic transition at both pH 7 and pH2. The Ala3 and Ala4 pH 7 spectra are broader and absorb morethan the pH 2 spectra.
UVRR Spectra. The UVRR spectra for Ala3 and Ala4 at 25°C excited between 198 and 210 nm are shown in Figures 4and 5, respectively. All spectra were normalized to the sym-metric perchlorate stretch (932 cm-1).
Vibrations enhanced in both Ala3 and Ala4 include the amideI (AmI) vibration at ∼1655 cm-1, which is primarily a CdO
stretching vibration (st). The enhanced amide II (AmII) vibrationinvolve CsN stretching (st), coupled with NsH bending (b)at ∼1550 cm-1. The symmetric stretching of the carboxylateappears at ∼1400 cm-1 but is overlapped by other bands. Thesymmetric b vibrations of the CH3 and CRsH groups occur at1371 and 1332 cm-1, respectively. There is an additionalvibration present at 1391 cm-1 assigned as CH3 + CRsHbending, which most strongly overlaps the symmetric carboxy-late stretch. The amide III (AmIII) region is broad and spansthe 1200-1300 cm-1 range. The bands in the AmIII regionresult primarily from vibrations composed of CsN st coupledto NsH b but can also include CRsC st, NsC st, CsN st, andsome CRsH b.9 Both peptides show the highest relative bandintensities for 202 nm excitation. The relative band intensitieswithin the spectra are similar across the range of excitationwavelengths, indicating that similar or identical electronictransitions are involved in the enhancement.
Our group has previously shown that, for a 21-residue,primarily Ala peptide in mixtures of H2O/D2O, the spectra ofthe partially deuterated chains can be modeled as a statisticallyweighted linear sum of the deuterated and protonated segmentsof the peptide.10,45 This result indicates that the peptide bond
F )I⊥
I|(1)
Figure 1. UV absorption spectra at pH 7 (black) and pH 2 (red) andthe pH absorption difference spectra (blue) for (a) Ala2, (b) Ala3, and(c) Ala4. All absorption measurements were taken of 0.5 mM peptidesolutions at 25 °C.
6662 J. Phys. Chem. B, Vol. 114, No. 19, 2010 Sharma and Asher

vibrations are localized within the individual peptide bonds.More recently, we also showed that, for short Gly peptides, thereis also a lack of coupling between adjacent peptide bondvibrations.46 These results allow for accurate modeling of theRaman spectra of peptides in solution because the spectra aresimply a linear sum of the terminal and internal peptide bonds.
The spectra for the terminal and internal peptide bondssignificantly differ.46 We showed that the spectrum of a three-residue peptide approximates the spectrum of the two terminalpeptide bonds of an oligopeptide, while the difference spectrumbetween a six-residue peptide and a five-residue peptideaccurately models the spectra of an internal peptide bond. Weuse this methodology to resolve the spectra of the COO-
vibration for both Ala3 and Ala4.To resolve the COO- vibration in Ala3, we assume that the
UVRR spectrum of the Ala3 NH3+ end peptide bond is similar
to that of the interior peptide bond of Ala4, which we model asthat resulting from subtraction of the Ala4 - Ala3 UVRR (Figure12). The underlying reasoning is that this peptide bond has thestandard peptide bond πf π* transition as the internal peptidebonds, without the charge transfer band of the carboxylateterminal peptide bonds.
Figure 2. Deconvolution of absorption spectra. The pH 7 - pH 2difference spectra (black) are fit with two Gaussian bands (blue); theresulting fit curve (red) matches the experimental curve remarkablywell: (a) Ala2, (b) Ala3, (c) Ala4.
Figure 3. Ala3 zwitterion in an extended � conformation. The electrondensity charge transfer from carboxylate to amide is indicated by theblue arrow. (Picture courtesy of Nataliya Myshakina.)
Figure 4. UVRR spectra of Ala3 (6.6 × 10⁻³ M) at 25 °C excitedbetween 198 and 210 nm. Spectra were collected for 15 min each. Thespectral resolution is ∼5 cm-1. Spectra were not corrected for self-absorption or spectrometer throughput efficiency.
Figure 5. UVRR spectra of Ala4 (6.6 × 10⁻³ M) at 25 °C excitedbetween 198 and 210 nm. Spectra were collected for 15 min each. Thespectral resolution is ∼5 cm-1. Spectra were not corrected for self-absorption or spectrometer throughput efficiency.
Electronic Excited States of Tri- and Tetraalanine J. Phys. Chem. B, Vol. 114, No. 19, 2010 6663
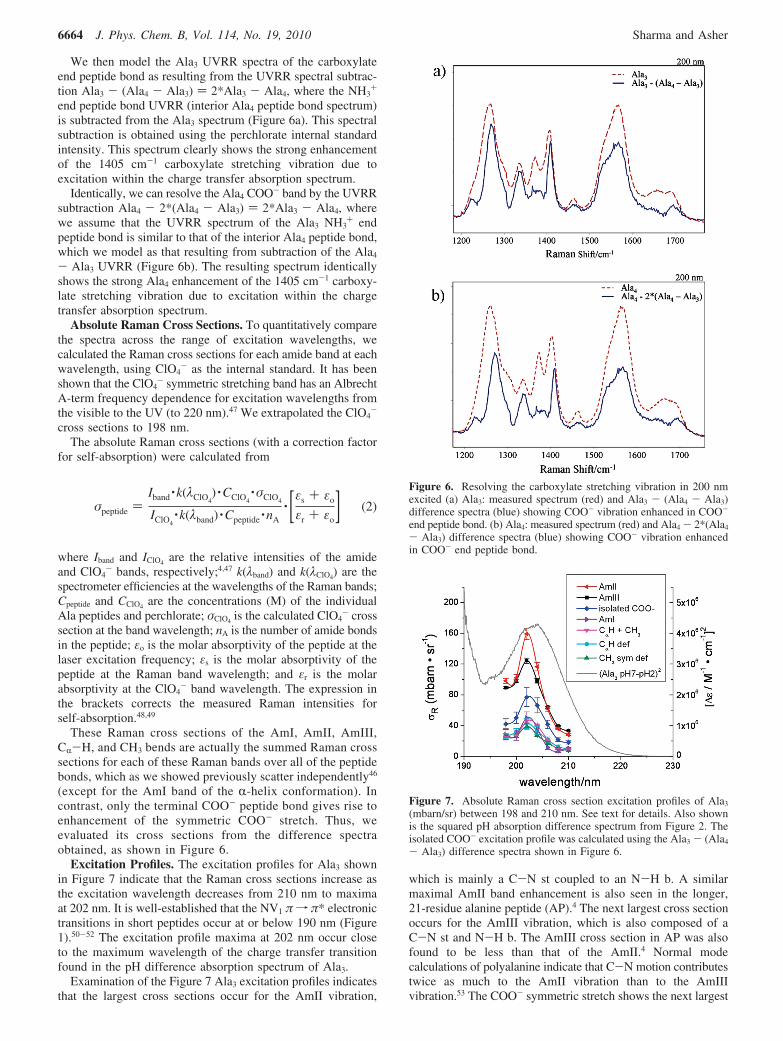
We then model the Ala3 UVRR spectra of the carboxylateend peptide bond as resulting from the UVRR spectral subtrac-tion Ala3 - (Ala4 - Ala3) ) 2*Ala3 - Ala4, where the NH3
+
end peptide bond UVRR (interior Ala4 peptide bond spectrum)is subtracted from the Ala3 spectrum (Figure 6a). This spectralsubtraction is obtained using the perchlorate internal standardintensity. This spectrum clearly shows the strong enhancementof the 1405 cm-1 carboxylate stretching vibration due toexcitation within the charge transfer absorption spectrum.
Identically, we can resolve the Ala4 COO- band by the UVRRsubtraction Ala4 - 2*(Ala4 - Ala3) ) 2*Ala3 - Ala4, wherewe assume that the UVRR spectrum of the Ala3 NH3
+ endpeptide bond is similar to that of the interior Ala4 peptide bond,which we model as that resulting from subtraction of the Ala4
- Ala3 UVRR (Figure 6b). The resulting spectrum identicallyshows the strong Ala4 enhancement of the 1405 cm-1 carboxy-late stretching vibration due to excitation within the chargetransfer absorption spectrum.
Absolute Raman Cross Sections. To quantitatively comparethe spectra across the range of excitation wavelengths, wecalculated the Raman cross sections for each amide band at eachwavelength, using ClO4
- as the internal standard. It has beenshown that the ClO4
- symmetric stretching band has an AlbrechtA-term frequency dependence for excitation wavelengths fromthe visible to the UV (to 220 nm).47 We extrapolated the ClO4
-
cross sections to 198 nm.The absolute Raman cross sections (with a correction factor
for self-absorption) were calculated from
where Iband and IClO4are the relative intensities of the amide
and ClO4- bands, respectively;4,47 k(λband) and k(λClO4
) are thespectrometer efficiencies at the wavelengths of the Raman bands;Cpeptide and CClO4
are the concentrations (M) of the individualAla peptides and perchlorate; σClO4
is the calculated ClO4- cross
section at the band wavelength; nA is the number of amide bondsin the peptide; εo is the molar absorptivity of the peptide at thelaser excitation frequency; εs is the molar absorptivity of thepeptide at the Raman band wavelength; and εr is the molarabsorptivity at the ClO4
- band wavelength. The expression inthe brackets corrects the measured Raman intensities forself-absorption.48,49
These Raman cross sections of the AmI, AmII, AmIII,CR-H, and CH3 bends are actually the summed Raman crosssections for each of these Raman bands over all of the peptidebonds, which as we showed previously scatter independently46
(except for the AmI band of the R-helix conformation). Incontrast, only the terminal COO- peptide bond gives rise toenhancement of the symmetric COO- stretch. Thus, weevaluated its cross sections from the difference spectraobtained, as shown in Figure 6.
Excitation Profiles. The excitation profiles for Ala3 shownin Figure 7 indicate that the Raman cross sections increase asthe excitation wavelength decreases from 210 nm to maximaat 202 nm. It is well-established that the NV1 πf π* electronictransitions in short peptides occur at or below 190 nm (Figure1).50-52 The excitation profile maxima at 202 nm occur closeto the maximum wavelength of the charge transfer transitionfound in the pH difference absorption spectrum of Ala3.
Examination of the Figure 7 Ala3 excitation profiles indicatesthat the largest cross sections occur for the AmII vibration,
which is mainly a C-N st coupled to an N-H b. A similarmaximal AmII band enhancement is also seen in the longer,21-residue alanine peptide (AP).4 The next largest cross sectionoccurs for the AmIII vibration, which is also composed of aC-N st and N-H b. The AmIII cross section in AP was alsofound to be less than that of the AmII.4 Normal modecalculations of polyalanine indicate that C-N motion contributestwice as much to the AmII vibration than to the AmIIIvibration.53 The COO- symmetric stretch shows the next largest
Figure 6. Resolving the carboxylate stretching vibration in 200 nmexcited (a) Ala3: measured spectrum (red) and Ala3 - (Ala4 - Ala3)difference spectra (blue) showing COO- vibration enhanced in COO-
end peptide bond. (b) Ala4: measured spectrum (red) and Ala4 - 2*(Ala4
- Ala3) difference spectra (blue) showing COO- vibration enhancedin COO- end peptide bond.
Figure 7. Absolute Raman cross section excitation profiles of Ala3
(mbarn/sr) between 198 and 210 nm. See text for details. Also shownis the squared pH absorption difference spectrum from Figure 2. Theisolated COO- excitation profile was calculated using the Ala3 - (Ala4
- Ala3) difference spectra shown in Figure 6.
σpeptide )Iband · k(λClO4
) ·CClO4·σClO4
IClO4· k(λband) ·Cpeptide ·nA
· [εs + εo
εr + εo] (2)
6664 J. Phys. Chem. B, Vol. 114, No. 19, 2010 Sharma and Asher

excitation profile cross section.12 The COO- symmetric st isselectively enhanced by the ∼202 nm charge transfer transi-tion.12
All of the excitation profiles are much narrower than thecharge transfer absorption difference spectra. The resonanceRaman cross sections of CH3, CRH, and AmI vibrations aresignificantly smaller with only a modest charge transferenhancement.
The Raman excitation profiles for Ala4 shown in Figure 8differ significantly from those of Ala3 in that they show twodistinct maxima. There are two peptide bonds in Ala3, whereasAla4 contains three. The AmII and AmIII vibrations once againhave the largest cross sections, with the AmIII vibration havinga significantly larger relative cross section than in Ala3. TheAmI band cross section per peptide bond at 202 nm isapproximately twice that in Ala3.
As the excitation wavelength decreases from 210 to 198 nm,a small excitation profile maximum is observed at 206 nm,followed by a larger maximum at 202 nm. The excitation profilemaximum at 202 nm for Ala4 is assumed to be due to the chargetransfer transition in the pH difference absorption spectrum(Figures 1c and 2c), while understanding the origin of the 206nm maximum will require additional information. It is importantto note that the cross sections per peptide bond are roughlysimilar between Ala3 and Ala4 (except for the AmI) but the peakvalues are smaller in Ala4, while the excitation profiles appearbroader than those of Ala3.
The lowest order theory54 indicates that the resonance Ramanexcitation profiles will scale as the square of the absorbanceband molar absorptivity. Figures 7 and 8 also compare theexcitation profiles of Ala3 and Ala4 to the squares of theirabsorption difference spectra. This comparison shows moresimilar bandwidths.
The COO- symmetric st is clearly visible for short peptidessuch as Ala3 and Ala4. However, the COO- symmetric st willbe less evident in longer peptides such as AP, where the peptidebond NV1 π f π* transitions dominate the excitation profile,resulting in a small relative enhancement of the COO- sym-metric st.
Raman Depolarization Ratios, Excitation Profiles, andAbsorption Spectra. In order to gain insight into the origin ofthe excitation profiles, we measured the dispersions of theresonance Raman depolarization ratios. Figure 9 compares the
Ala3 absorption difference spectrum, the Raman excitationprofile averaged over the enhanced vibrations and the Ramandepolarization ratios. The excitation profile is slightly blue-shifted and much narrower than the absorption differencespectrum.
The Ala3 depolarization ratio shows a minimum of F ∼0.33at the excitation profile maximum, indicating that a singlenondegenerate electronic transition, presumably the chargetransfer transition, dominates the resonance Raman enhancementat 202 nm.4,12,13,55 At excitation wavelengths above and belowthe excitation profile maximum, F > 0.33, indicating contribu-tions of additional electronic transitions.4,12,13,55 This excitationprofile behavior, where F > 0.33 for preresonance excitationand also F > 0.33 from 201 to 198 nm, between the chargetransfer transition and the NV1 transition, is not possible if the202 nm transition and the NV1 are the only transitions involvedin enhancement. There is a hint of another transition at 206 nmevidenced by the skewed Raman excitation profile.
Figure 10 shows the Ala4 pH absorption difference spectrum,the average resonance Raman excitation profile, and thedepolarization ratio dispersion measurements. The Ala4 excita-tion profile shows a second maximum at 206 nm, ∼1000 cm-1
lower in frequency than that of the ∼202 nm charge transfertransition. As observed for Ala3, a global depolarizationminimum occurs with F ∼0.33 at the charge transfer excitationprofile maximum at 202 nm. Also, as for Ala3, F > 0.33 from201 to 198 nm, between the charge transfer transition and theNV1 transition at ∼190 nm. In contrast to Ala3, a localdepolarization ratio maximum occurs at the 206 nm secondexcitation profile maximum (F ∼0.5). F > 0.33 in preresonance
Figure 8. Absolute Raman cross section excitation profiles of Ala4
(mbarn/sr) between 198 and 210 nm. See text for details. Also shownis the squared pH absorption difference spectrum from Figure 2. Theisolated COO- profile was calculated using the Ala4 - 2*(Ala4 - Ala3)difference spectra shown in Figure 6.
Figure 9. (a) Average Raman excitation profile for the Ala3 amidebands at 25 °C between 198 and 210 nm and the pH 7 - pH 2absorption difference spectrum of Ala3 at 25 °C between 196 and 212nm. (b) Raman depolarization ratios of Ala3 at 25 °C. The dashed lineindicates the coincidence between the excitation maximum of theexcitation profile, the pH absorption difference spectrum, and thedepolarization ratio minimum with F ≈ 0.33 at 202 nm.
Electronic Excited States of Tri- and Tetraalanine J. Phys. Chem. B, Vol. 114, No. 19, 2010 6665

with all of these transitions for the carboxylate stretch and theAmII and III bands (although less so than for Ala3).
We do not, as yet, have a simple explanation for these results.One possibility would require two charge transfer transitionsclose in energy that give rise to the two excitation profile peaksin Ala4 and the very weak 206 nm shoulder in Ala3. Thesecharge transfer transitions would involve two different sets ofcarboxylate nonbonding electrons undergoing a transition to theadjacent peptide bond π* orbital. The weakness of the 206 nmexcitation profile maximum in Ala3 could result from destructiveinterference between the contributions from these two chargetransfer transitions and the NV1 transition. Although theobserved 206 nm Raman intensities could be dramaticallyattenuated by the destructive interference, the 206 nm transitioncould still significantly increase F in the wings of the excitationprofile maxima.
The dispersion of F can be understood if the contribution tothe polarizability of the NV1 transition and the 202 nm chargetransfer transition were of the same sign and the 206 nmtransition contribution were of opposite sign. This would yieldthe dispersion observed with F > 0.33 between 201 and 198nm, if the NV1 transition and the 202 nm charge transfertransition dominated in this spectral region and the NV1
transition and the 202 nm charge transfer transition contributedsimilarly to that of the 206 nm transition.
The alternative explanation would assign the 206 and 202nm transitions to the 0-0 and 0-1 vibronic components of thecharge transfer transition. The ∼1000 cm-1 difference in thepeak maxima would indicate a decreased excited state carboxy-late frequency. A detailed theoretical calculation would be
required to understand the dispersion of the depolarization ratiosaround the 206 nm transition.56
Another possible origin of the 206 nm band is that the secondconformation of the Ala4 peptide occurs in solution, which hasits charge transfer transition shifted to 206 nm. To search forevidence for this additional conformation, we examined theAmIII region, which is sensitive to the peptide bond conforma-tions.7
Deconvolution of the AmIII Region. We deconvoluted theAmIII3 region in both Ala3 and Ala4 (Figure 11) and found thatthe AmIII3 region could be well fit with three Gaussian bands,at ∼1226, 1249, and 1268 cm-1. We utilized the methodologyof Mikhonin et al.7 which correlates Raman AmIII3 frequencyto Ψ angle, specifically using their eq 6A which is applicableto peptide bonds fully exposed to water, such as in poly-prolineII (PPII) helix, 2.51 helix, extended �-strand conformations, andcertain turn structures. The deconvoluted peak positions correlateto the following Ψ angles: ∼ +120°, ∼ +150°, ∼ +170°, whichmost likely derive from type II turns, PPII-helix-like, and 2.51-helix-like conformations, respectively. The Ψ angle of 120° isalso found for type VIa and type VIII turns; however, these areless likely structures to occur. Also, note that the Ramanfrequencies correspond only to Ψ angle values, with noinformation about the Φ angle. Thus, there are structures withtype II turn Ψ angles, but it is possible that a significant Φangle variation could be present. Comparing Figure 11a and b,assuming identical Raman cross sections for these species, wefind that the relative contribution of the 2.51-helix-like structure
Figure 10. (a) Averaged Raman excitation profile for Ala4 at 25 °Cbetween 198 and 210 nm and the pH 7 - pH 2 absorption differencespectrum of Ala4 at 25 °C from 196 to 212 nm. (b) Ramandepolarization ratios of Ala4 at 25 °C. The dashed line indicates thecoincidence between the maximum of the excitation profile, the pHabsorption difference spectrum, and the depolarization ratio minimumwith F ≈ 0.33 at 202 nm.
Figure 11. (a) Deconvolution of the Ala3 AmIII3 region excited at 204nm with three Gaussian bands. (b) Deconvolution of the Ala4 AmIII3 regionexcited at 204 nm, also with three Gaussian bands. Different conformationaldistributions are present. There is excellent agreement between the modeledpeaks and the observed data (R2 > 99%).
6666 J. Phys. Chem. B, Vol. 114, No. 19, 2010 Sharma and Asher

in Ala4 is less than that in Ala3, and conversely, the PPII-helix-like contribution is larger in Ala4 than in Ala3.
Assuming identical Raman cross sections per peptide bondfor each conformation, we can roughly estimate the populationdistributions from the AmIII3 bands of both peptides. We findthat the relative population distributions of both peptides areindependent of wavelength. For Ala3, the type II turn has thelowest relative contribution (∼8%), the PPII-like conformationcontribution is ∼29%, and the 2.51 helix contribution is ∼63%.
Although there have been numerous theoretical and experi-mental studies performed on Ala3 using a variety of techniques,there is no existing consensus on the conformational distributionfor Ala3 in solution. Most studies agree that Ala3 occurs in aPPII-like conformation.15,29-36,38,41-43 Other possible conforma-tions include �-sheet-like,29 �-strand,15,30 � structures,32,33,35,36,38,43
right-handed R-helix,15,33,35,36,38,43 and γ-turn.38 No previous studyidentified the 2.51 helix conformation, although there is asuggestion of an extended �-strand-like conformation with asimilar Ψ angle (∼170°).15,37
For Ala4, the conformations found are similar to those in Ala3,although the distribution is different. There is a larger contribu-tion from the PPII-helix-like structure (39%). The type II turncontribution is similar (8.5%), while the 2.51 helix contributionis less than that in Ala3 (52%). Garcia57 determined that fourconsecutive amino acid residues are required to form a waterstabilized PPII structure, lending support to the result that Ala4
should show a larger contribution from PPII-like structures thanAla3. Again, there is little consensus on the conformationaldistribution in Ala4, although there is agreement that the peptideadopts both PPII-like and �-like structure,39,40 with a smallamount of a right-handed R-helix-like conformation.40 We assignthe 202 nm excitation maximum as the charge transfer transitionfor all three conformations of Ala4. None of these conformationsshould obviously give rise to a shifted 206 nm charge transferband.
Ala4 and Ala3 Difference Spectra. To differentiate theconformational distribution of the internal versus terminalpeptide bonds of Ala4, we examined the Ala4 - Ala3 differencespectrum (Figure 12a), which models the internal Ala4 peptidebond UVRR by removing the contribution of the terminalcarboxylate and amine groups. We note that the COO-
symmetric stretching vibration is absent in the difference spectra.The contributions of the carboxyl end group of both peptideswere removed by this subtraction. The relative intensities andfrequencies of the bands within each spectrum are similar acrossthe range of excitation wavelengths, once again indicatingsimilar enhancement of the bands.
We calculated the Raman cross sections of the AmIII3 bands(Figure 12b). We find that the internal residue of Ala4 ispredominantly PPII-like (∼72%), with smaller contributionsfrom 2.51 helix (19%) and type II turn structures (∼9%). Aprevious MD simulation study on the middle residue of Ala3
found that it was ∼85% PPII-like,31 which closely agrees withour findings here. We can also infer that the 2.51-helix-likeconformation is largely found at the peptide ends, which couldbe representative of a less compact structure at the peptideterminal ends.
An interesting feature in the excitation profiles of Ala4 -Ala3 is that the 202 and 206 nm excitation profile maxima arepresent for both the PPII-like and 2.51 helix conformationprofiles, but less evident in the type II turn profiles. Thus, asexpected, we see less contribution from the charge transferenhancement in the estimated excitation profile of the internalpeptide bond. This residual enhancement may result because
our assumption that the difference spectrum results completelyfrom the Ala4 internal peptide bond is not completely accurate.
Conclusions
We measured the Raman excitation profiles and depolariza-tion ratios for both Ala3 and Ala4. Both peptides show excitationprofile maxima at 202 nm, which we assign to charge transfertransitions of the carboxylate terminated peptide bonds clearlyobserved in the pH absorption difference spectra. Ala4 showsan additional smaller excitation profile maximum at 206 nmwhose origin remains unclear.
We correlated the AmIII3 band Raman frequencies to the Ψangle of both Ala3 and Ala4 to determine the conformationaldistribution of these peptides. We found type II turns, as wellas PPII-like and 2.51 helix-like conformations in solution. TheAla4 - Ala3 Raman difference spectra allowed us to separatelystudy the interior peptide bond of Ala4, which is found to bepredominantly PPII-like.
We assign the charge transfer transition at 202 nm to thethree �-type structures deconvoluted from the Raman spectra.We are also able to resolve the COO- vibration for both Ala3
and Ala4. We find a shoulder in the Ala4 excitation profile at206 nm but are unable at this time to definitively assign itsorigin.
Acknowledgment. We would like to thank Prof. John A.Shelnutt for a very helpful discussion and Dr. Nataliya My-
Figure 12. (a) Ala4 - Ala3 difference spectra, from 198 to 210 nm.(b) The AmIII3 band Raman cross sections of the three conformations(type II turn, PPII-helix-like, 2.51 helix) in the Ala4 - Ala3 differencespectra.
Electronic Excited States of Tri- and Tetraalanine J. Phys. Chem. B, Vol. 114, No. 19, 2010 6667

shakina for providing the image for Figure 3. We thank theNIHfor funding,GrantNos.5R01EB002053and1R01EB009089.
References and Notes
(1) Ianoul, A.; Mikhonin, A.; Lednev, I. K.; Asher, S. A. J. Phys. Chem.A 2002, 106, 3621.
(2) Lednev, I. K.; Karnoup, A. S.; Sparrow, M. C.; Asher, S. A. J. Am.Chem. Soc. 1999, 121, 8074.
(3) Mikhonin, A. V.; Asher, S. A. J. Am. Chem. Soc. 2006, 128, 13789.(4) Sharma, B.; Bykov, S. V.; Asher, S. A. J. Phys. Chem. B 2008,
112, 11762.(5) Myshakina, N. S.; Ahmed, Z.; Asher, S. A. J. Phys. Chem. B 2008,
112, 11873.(6) Efremov, E. V.; Ariese, F.; Gooijer, C. Anal. Chim. Acta 2008,
606, 119.(7) Mikhonin, A. V.; Bykov, S. V.; Myshakina, N. S.; Asher, S. A. J.
Phys. Chem. B 2006, 110, 1928–1943.(8) Mikhonin, A. V.; Myshakina, N. S.; Bykov, S. V.; Asher, S. A.
J. Am. Chem. Soc. 2005, 127, 7712.(9) Mikhonin, A. V.; Ahmed, Z.; Ianoul, A.; Asher, S. A. J. Phys.
Chem. B 2004, 108, 19020.(10) Mix, G.; Schweitzer-Stenner, R.; Asher, S. A. J. Am. Chem. Soc.
2000, 122, 9028.(11) Pajcini, V.; Asher, S. A. J. Am. Chem. Soc. 1999, 121, 10942.(12) Chen, X. G.; Li, P.; Holtz, J. S. W.; Chi, Z.; Pajcini, V.; Asher,
S. A.; Kelly, L. A. J. Am. Chem. Soc. 1996, 118, 9705.(13) Chen, X. G.; Asher, S. A.; Schweitzer-Stenner, R.; Mirkin, N. G.;
Krimm, S. J. Am. Chem. Soc. 1995, 117, 2884.(14) DeVito, V. L.; Cai, M. Z.; Asher, S. A.; Kehres, L. A.; Smith,
K. M. J. Phys. Chem. 1992, 96, 6917.(15) Tsai, M.; Xu, Y.; Dannenberg, J. J. J. Phys. Chem. B 2009, 113,
309–318.(16) Imamura, H.; Kato, M. Proteins: Struct., Funct., Bioinf. 2009, 75,
911.(17) Wang, W.-Z.; Lin, T.; Sun, Y.-C. J. Phys. Chem. B 2007, 111,
3508.(18) Quapp, W J. Comput. Chem. 2007, 28, 1834.(19) Morozov, A. N.; Lin, S. H. J. Phys. Chem. B 2006, 110, 20555.(20) Zagrovic, B.; Lipfert, J.; Sorin, E. J.; Millett, I. S.; van Gunsteren,
W. F.; Doniach, S.; Pande, V. S Proc. Natl. Acad. Sci. U.S.A. 2005, 102,11698.
(21) Chen, K.; Liu, Z.; Zhou, C.; Shi, Z.; Kallenbach, N. R. J. Am. Chem.Soc. 2005, 127, 10146.
(22) Ramakrishnan, V.; Ranbhor, R.; Durani, S. J. Am. Chem. Soc. 2004,126, 16332.
(23) McColl, I. H.; Blanch, E. W.; Hecht, L.; Kallenbach, N. R.; Barron,L. D. J. Am. Chem. Soc. 2004, 126, 5076.
(24) Huang, C.-Y.; Klemke, J. W.; Getahun, Z.; DeGrado, W. F.; Gai,F. J. Am. Chem. Soc. 2001, 123, 9235.
(25) Thompson, P. A.; Eaton, W. A.; Hofrichter, J. Biochemistry 1997,36, 9200.
(26) Gnanakaran, S.; Garcia, A. E. Proteins: Struct., Funct., Bioinf. 2005,59, 773.
(27) Vila, J. A.; Baldoni, H. A.; Ripoll, D. R.; Ghosh, A.; Scheraga,H. A. Biophys. J. 2004, 86, 731.
(28) Makowska, J.; Rodziewicz-Motowidlo, S.; Baginska, K; Makowski,M.; Vila, J. A.; Liwo, A.; Chmurzynski, L.; Scheraga, H. A. Biophys. J.2007, 92, 2904.
(29) Eker, F.; Cao, X.; Nafie, L.; Schweitzer-Stenner, R. J. Am. Chem.Soc. 2002, 124, 14330.
(30) Eker, F.; Griebenow, K.; Schweitzer-Stenner, R. J. Am. Chem. Soc.2003, 125, 8178.
(31) Gnanakaran, S.; Garcia, A. E. J. Phys. Chem. B 2003, 107, 12555.(32) Gorbunov, R. D.; Nguyen, P. H.; Kobus, M.; Stock, G. J. Chem.
Phys. 2007, 126, 054509/1.(33) Graf, J.; Nguyen, P. H.; Stock, G.; Schwalbe, H. J. Am. Chem.
Soc. 2007, 129, 1179.(34) Lee, O.; Roberts, G. M.; Diem, M. Biopolymers 1989, 28, 1759.(35) Mu, Y.; Kosov, D. S.; Stock, G. J. Phys. Chem. B 2003, 107, 5064.(36) Mu, Y.; Stock, G. J. Phys. Chem. B 2002, 106, 5294.(37) Schweitzer-Stenner, R. Biophys. J. 2002, 83, 523.(38) Schweitzer-Stenner, R. J. Phys. Chem. B 2009, 113, 2922.(39) Schweitzer-Stenner, R.; Eker, F.; Griebenow, K.; Cao, X.; Nafie,
L. A. J. Am. Chem. Soc. 2004, 126, 2768.(40) Torii, H. J. Phys. Chem. B 2007, 111, 5434.(41) Woutersen, S.; Hamm, P. J. Phys. Chem. B 2000, 104, 11316.(42) Woutersen, S.; Hamm, P. J. Chem. Phys. 2001, 114, 2727.(43) Woutersen, S.; Pfister, R.; Hamm, P.; Mu, Y.; Kosov, D. S.; Stock,
G. J. Chem. Phys. 2002, 117, 6833.(44) Bykov, S.; Lednev, I.; Ianoul, A.; Mikhonin, A.; Munro, C.; Asher,
S. A. Appl. Spectrosc. 2005, 59, 1541.(45) Mikhonin, A. V.; Asher, S. A. J. Phys. Chem. B 2005, 109, 3047.(46) Dudik, J. M.; Johnson, C. R.; Asher, S. A. J. Chem. Phys. 1985,
82, 1732.(47) Ludwig, M.; Asher, S. A. Appl. Spectrosc. 1988, 42, 1458.(48) Shriver, D. F.; Dunn, J. B. R. Appl. Spectrosc. 1974, 28, 319.(49) Bykov, S. V.; Asher, S. A. J. Phys. Chem. Lett. 2010, 1, 269.(50) Basch, H.; Robin, M. B.; Kuebler, N. A. J. Chem. Phys. 1967, 47,
1201.(51) Peterson, D. L.; Simpson, W. T. J. Am. Chem. Soc. 1957, 79, 2375.(52) Schellman, J. A.; Nielsen, E. B. J. Phys. Chem. 1967, 71, 3914.(53) Lee, S.-H.; Krimm, S. Biopolymers 1998, 46, 283.(54) Myers, A. B.; Mathies, R. A. In Resonance Raman Spectra of
Polyenes and Aromatics; Spiro, T. G., Ed.; Biological Applications ofRaman Spectroscopy, Vol. 2; John Wiley & Sons: New York, 1987; pp1-58.
(55) Long, D. A. The Raman Effect: A Unified Treatment of the Theoryof Raman Scattering by Molecules; John Wiley & Sons: New York, 2001.
(56) Shelnutt, J. A.; O’Shea, D. C. J. Chem. Phys. 1978, 69, 5361.(57) Garcia, A. E. Polymer 2004, 45, 669.
JP100428N
6668 J. Phys. Chem. B, Vol. 114, No. 19, 2010 Sharma and Asher