uttar pradesh aser
TRANSCRIPT

8/13/2019 Uttar Pradesh ASER
http://slidepdf.com/reader/full/uttar-pradesh-aser 1/5
Uttar Pradesh RURAL
25 ASER 2013
ANALYSIS BASED ON DATA FROM HOUSEHOLDS. 69 OUT OF 69 DISTRICTS
Data has not been presented where sample size was insufficient.
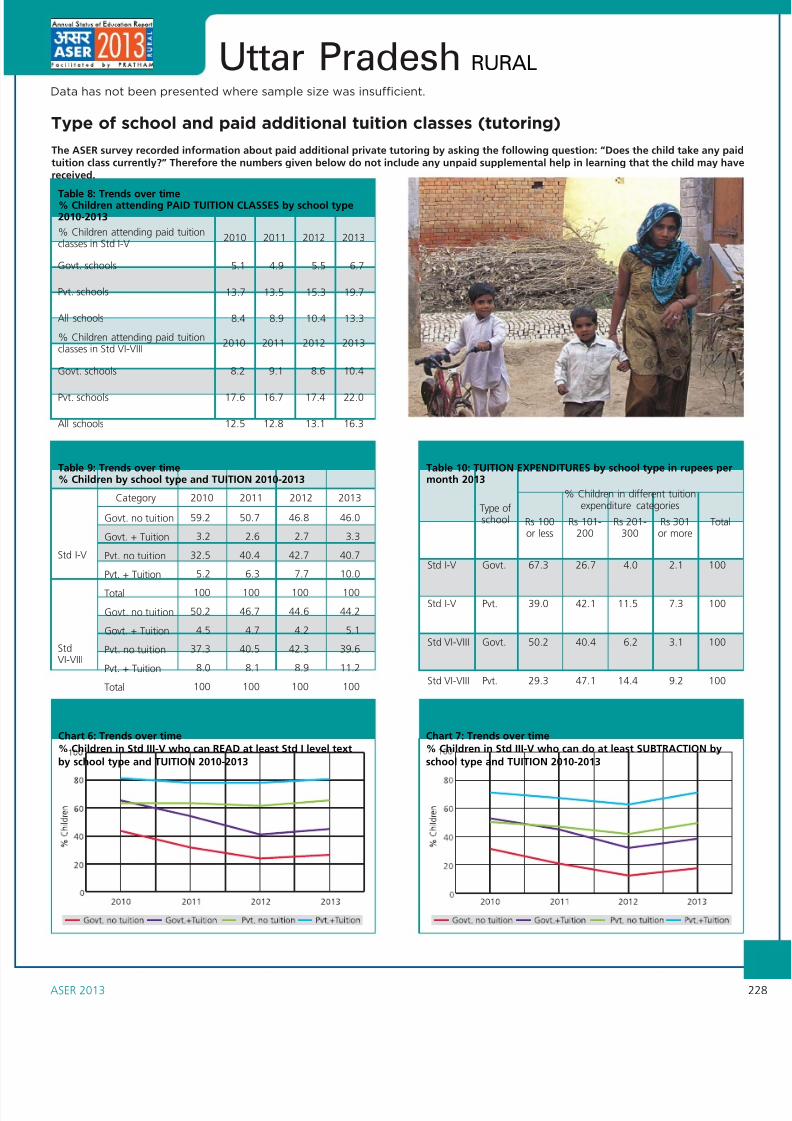
School enrollment and out of school children
Note: 'Other' includes children going to madarsa and EGS.‘Not in school’ = dropped out + never enrolled.
TotalAge group Govt. Pvt. Other Not inschool
43.6 49.0 2.3 5.1 100
40.3 49.5 2.0 8.2 100
45.7 48.7 2.7 3.0 100
41.2 53.4 2.4 3.1 100
50.8 43.3 3.1 2.8 100
38.9 51.3 1.7 8.2 100
35.8 55.6 1.5 7.1 100
42.4 46.4 1.8 9.4 100
29.9 47.8 0.9 21.4 100
30.1 49.3 0.6 20.1 10029.6 46.4 1.2 22.8 100
Age: 6-14 ALL
Age: 7-16 ALL
Age: 7-10 ALL
Age: 7-10 BOYS
Age: 7-10 GIRLS
Age: 11-14 ALL
Age: 11-14 BOYS
Age: 11-14 GIRLS
Age: 15-16 ALL
Age: 15-16 BOYSAge: 15-16 GIRLS
Table 1: % Children in different types of schools 2013
How to read this chart: Each line shows trends in the proportion of children out of school foa particular subset of children. For example, the proportion of girls (age 11-14) not in schoowas 11.1% in 2006, 9.7% in 2010, 11.5% in 2012 and is 9.4% in 2013.
Chart 1: Trends over time% Children out of school by age group and gender 2006-2013
Chart 2: Trends over time% Children enrolled in private schools in Std I-V and Std VI-VIII2009, 2011 and 2013
Young children in pre-school and school
Not inschoolor pre-school
Total
In schoolIn balwadi
oranganwadi
In LKG/ UKG
Age 3
Age 4
Age 5
Age 6
Govt. Pvt. Other
22.8 9.6 67.6 100
24.8 24.5 50.7 100
10.0 23.4 27.1 18.9 2.2 18.5 100
3.1 14.8 41.3 29.8 2.6 8.5 100
* Data for 2011 is not comparable to other years and therefore not included here.
Chart 3: Trends over time
% Children age 3, 4 and 5 not enrolled in school orpre-school 2006-2013*
Table 3: % Children age 3-6 who are enrolled in different typesof pre-school and school 2013
Note: For 3 and 4 year old children, only pre-school status is recorded.
I
II
III
IV
V
VI
VII
VIII
5 6 7 8 9 10 11 12 13 14 15 16 Total
23.2 32.2 21.9 12.9 9.8
4.7 15.3 28.2 27.1 9.6 9.4 5.8
4.9 13.3 32.3 18.3 18.3 5.0 5.1 2.7
5.9 16.1 22.6 31.2 9.4 9.8 4.9
1.7 6.2 10.3 32.8 19.1 17.2 6.4 6.3
6.3 16.2 24.7 30.4 12.4 6.2 3.9
2.1 7.1 10.7 37.0 24.9 11.6 6.6
7.6 18.9 32.0 24.9 12.2 4.4
100
100
100
100
100
100
100
100
Std
Table 2: Sample description% Children in each class by age 2013
How to read this table: If a child started school in Std I at age 6, she should be of age 8 in StdIII. This table shows the age distribution for each class. For example, in Std III, 32.3% childrenare 8 years old but there are also 13.3% who are 7, 18.3% who are 9, 18.3% who are 10and 12.8% who are older.

8/13/2019 Uttar Pradesh ASER
http://slidepdf.com/reader/full/uttar-pradesh-aser 2/5
Uttar Pradesh RURAL
ASER 2013
Reading
How to read this table: Each cell shows the highest level in reading achieved by a child. Forexample, in Std III, 17.2% children cannot even read letters, 30.5% can read letters but notmore, 16.8% can read words but not Std I level text or higher, 14.1% can read Std I level textbut not Std II level text, and 21.4% can read Std II level text. For each class, the total of allthese exclusive categories is 100%.
StdNot even
letterLevel 1
(Std I Text)Level 2
(Std II Text) Total
I
II
III
IV
V
VI
VII
VIII
Total
52.4 31.1 8.6 4.0 3.9 100
30.1 35.8 14.0 9.0 11.1 100
17.2 30.5 16.8 14.1 21.4 100
11.6 23.3 15.3 16.3 33.5 100
8.0 18.9 12.6 16.7 43.8 100
4.7 13.3 9.7 16.2 56.1 100
3.1 10.1 8.1 14.6 64.1 100
2.4 8.1 6.4 13.9 69.2 100
19.5 23.2 11.7 12.4 33.2 100
Letter Word
Table 4: % Children by class and READING levelAll schools 2013
Chart 4: Trends over time% Children who can READ Std II level text by class
All schools 2009, 2011 and 2013
Reading Tool
To interpret the chart alongside (Chart 4), several things need to be keptin mind:
The highest level in the ASER reading tool is the ability to read a Std II level
text. ASER is a “floor” level test. All children (age 5 to 16) are assessedusing the same tool; grade-level tools are not used in ASER.
We can see that the proportion of children who can read at least Std IIlevel text increases in successive standards. This is true for every year forwhich data is shown.
By Std VIII, when children have completed eight years of schooling, a highproportion of children are able to read the Std II level text. It is possiblethat many children in Std VIII are reading at higher levels, but ASER readingtests do not assess higher than Std II level.
This chart allows us to compare proportions of children reading at leastStd II level texts in different standards across years. For example, see Std Vin 2009, 2011 and 2013.
Table 5: Trends over time% Children in Std III and V at different READING levels byschool type 2009-2013
Year
% Children in Std V who canread Std II level text
2009
2010
2011
2012
2013
23.3 48.7 31.4 30.3 53.0 37.6
26.5 51.3 35.7 36.0 58.4 44.1
18.3 51.5 33.4 29.9 60.3 43.3
13.6 50.8 31.9 25.6 59.6 42.7
15.9 56.3 35.6 24.5 63.8 43.6
Govt. Pvt.Govt. &
Pvt.*Pvt.
Govt. &Pvt.*
% Children in Std III who canread at least Std I level text
Govt.
* This is the weighted average of govt. and pvt. schools only.
Data has not been presented where sample size was insufficient.

8/13/2019 Uttar Pradesh ASER
http://slidepdf.com/reader/full/uttar-pradesh-aser 3/5
Uttar Pradesh RURAL
27 ASER 2013
How to read this table: Each cell shows the highest level in arithmetic achieved by a child. Forexample, in Std III, 11.4% children cannot even recognize numbers 1-9, 37.4% can recognize
numbers up to 9 but not more, 25.8% can recognize numbers up to 99 but cannot dosubtraction, 15.9% can do subtraction but cannot do division, and 9.5% can do division. Foreach class, the total of all these exclusive categories is 100%.
StdNot even
1-9Can
subtractCan
divideTotal
I
II
III
IV
V
VI
VII
VIII
Total
46.8 34.9 14.1 3.2 1.0 100
23.2 41.3 22.7 9.5 3.3 100
11.4 37.4 25.8 15.9 9.5 100
7.4 27.5 27.4 20.2 17.5 100
4.5 23.0 25.8 20.6 26.2 100
2.9 15.9 25.6 22.8 33.0 100
1.9 12.1 26.0 22.8 37.2 100
1.6 10.0 22.7 22.4 43.3 100
15.4 27.4 23.2 15.8 18.3 100
Recognize numbers
10-991-9
Arithmetic
Math ToolTable 6: % Children by class and ARITHMETIC levelAll schools 2013
Chart 5: Trends over time% Children who can do DIVISION by class
All schools 2009, 2011 and 2013
To interpret the chart alongside (Chart 5), several things need to be keptin mind:
The highest level in the ASER arithmetic tool is the ability to do a numerical
division problem (dividing a three digit number by a one digit number). Inmost states in India, children are expected to do such computations byStd III or Std IV. ASER does not assess children using grade-level tools.
We can see that the proportion of children who can do this level of divisionincreases in successive standards. This is true for every year for which datais shown.
By Std VIII, when children have completed eight years of schooling, asubstantial proportion of children are able to do division problems at thislevel. It is possible that some children are able to do operations at higherlevels too, but ASER arithmetic tests do not assess higher than this level.
This chart allows us to compare proportions of children who can do divisionin different standards across years. For example, see Std V in 2009, 2011and 2013.
Table 7: Trends over time% Children in Std III and V who can do at least SUBTRACTIONand DIVISION respectively by school type 2009-2013
Year
% Children in Std Vwho can do division
2009
2010
2011
2012
2013
13.7 35.3 20.5 16.0 32.3 21.2
16.5 37.7 24.4 18.7 36.3 25.0
10.5 35.9 22.0 12.1 33.4 21.5
6.7 32.0 19.1 9.1 33.3 21.3
10.1 41.8 25.5 11.2 42.3 26.3
Govt. Pvt.Govt. &
Pvt.*Pvt.
Govt. &Pvt.*
% Children in Std III who cando at least subtraction
Govt.
* This is the weighted average of govt. and pvt. schools only.
Data has not been presented where sample size was insufficient.
8/13/2019 Uttar Pradesh ASER
http://slidepdf.com/reader/full/uttar-pradesh-aser 4/5
8/13/2019 Uttar Pradesh ASER
http://slidepdf.com/reader/full/uttar-pradesh-aser 5/5
RTE indicatorsThe Right of Children to Free and Compulsory Education (RTE) Act, 2009 specifies a series of normsand standards for a school. Data on selected measurable indicators of RTE are collected in ASER.
2010 2011 2012 2013 2010 2011 2012 2013School characteristics
% Schools with total enrollment of 60 or less
% Schools where Std II children observedsitting with one or more other classes
Std I-IV/V Std I-VII/VIII
% Schools where Std IV children observedsitting with one or more other classes
Building
Girls’toilet
Library
Mid-daymeal
PTR &CTR
5.3 6.3 7.6 7.4 0.4 2.3 2.0 2.0
51.4 53.8 64.0 65.6 48.4 55.9 60.3 60.5
46.5 51.8 62.2 62.7 42.0 49.7 54.0 54.2
16.1 16.5 15.6 21.3
81.6 80.3 78.4 75.1
88.6 88.1 88.4 87.4
60.8 71.1 66.9 71.2
44.4 57.9 58.5 62.9
6.9 5.4 3.9 4.1
10.9 10.2 14.8 15.1
82.2 84.4 81.3 80.9
100 100 100 100
6.7 7.4 5.5 5.3
45.9 38.8 42.0 45.6
47.4 53.9 52.5 49.1
100 100 100 100
24.9 16.6 16.7 11.9
25.3 19.1 20.2 20.1
15.9 16.9 19.4 23.7
33.9 47.4 43.7 44.3
100 100 100 100
51.4 22.9 17.8 23.5
25.8 39.9 41.3 43.8
22.9 37.2 41.0 32.7
100 100 100 100
89.3 94.7 94.2 95.6
71.3 95.0 85.6 92.1
Table 13: Small schools and multigrade classes 2010-2013
Table 14: Schools meeting selected RTE norms 2010-2013
20132010 2011 2012
Total schools visited
Type of school
Std I-IV/V: Primary
Std I-VII/VIII: Primary +Upper primary
2010 2011 2012 2013 2010 2011 2012 2013Type of school
% Enrolled childrenpresent (Average)
% Teachers present(Average)
Std I-IV/V Std I-VII/VIII
1633 1601 1583 1534
263 299 304 411
1896 1900 1887 1945
57.6 57.3 54.9 54.7 57.6 57.2 56.7 55.1
81.0 82.1 80.0 81.1 79.8 83.8 83.0 82.0
Table 11: Number of schools visited 2010-2013 Table 12: Student and teacher attendance on the day of visit 2010-2013
In each sampled village, the largest government school with primary sections is visited on the day of the survey. Information about schools in thisreport is based on these visits.
Pupil-teacher ratio (PTR)
Classroom-teacher ratio (CTR)
Office/store/office cum store
Playground
Boundary wall/fencing
No facility for drinking water
Facility but no drinking water available
Drinking water available
Total
No toilet facility
Facility but toilet not useable
Toilet useable
Total
No separate provision for girls’ toilet
Separate provision but locked
Separate provision, unlocked but not useable
Separate provision, unlocked and useable
Total
No library
Library but no books being used by children on day of visit
Library books being used by children on day of visit
Total
Kitchen shed for cooking mid-day meal
Mid-day meal served in school on day of visit
2010% Schools meeting the following RTE norms:
Uttar Pradesh RURAL
2011 2012 2013
29 ASER 2013
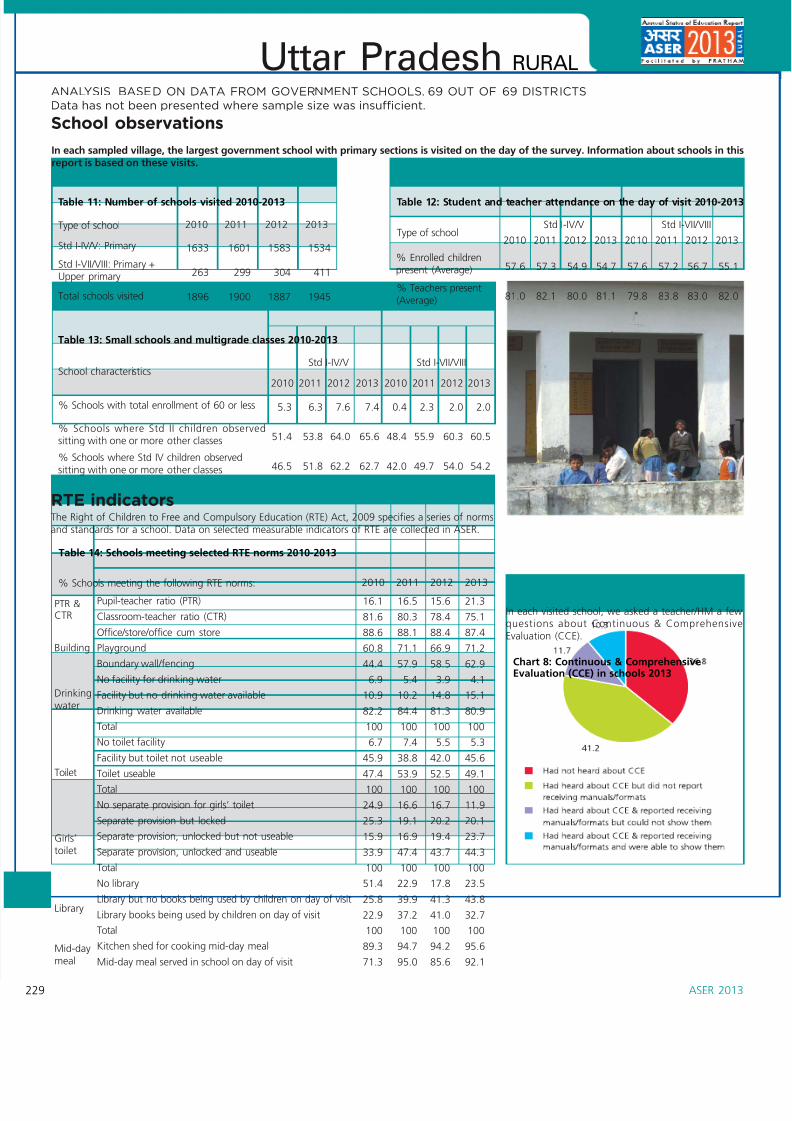
Chart 8: Continuous & ComprehensiveEvaluation (CCE) in schools 2013
Toilet
School observations
In each visited school, we asked a teacher/HM a fewquestions about Continuous & ComprehensiveEvaluation (CCE).
Drinkingwater
ANALYSIS BASED ON DATA FROM GOVERNMENT SCHOOLS. 69 OUT OF 69 DISTRICTS
Data has not been presented where sample size was insufficient.