utilizing pattern recognition methods for detecting the
TRANSCRIPT

www.journals.rifst.ac.ir Journal of Research and Innovation
in Food Science and Technology 7 (2019) 4, 419-430
Doi: 10.22101/JRIFST.2019.02.23.746
Original Paper
Utilizing Pattern Recognition Methods for Detecting the Adulteration of Glucose and Fructose in Honey
Saeed Faal1, Mohammad Loghavi2, Saadat Kamgar3*, Mohammad Hoseyn Raoufat4, Mohammad Taghi Golmakani5
1,3- Assistant professor, Biosystems Engineering Department, Shiraz University, Shiraz, Iran * Corresponding author ([email protected]) 2,4- Professor, Biosystems Engineering Department, Shiraz University, Shiraz, Iran 5- Associate Professor, Food Science Engineering Department, Shiraz University, Shiraz, Iran
Abstract The aroma of honey is one of the important parameters in honey grading and that is depended on several factors, such as geographical origin, climate, botanical and environmental conditions. The aim of this study was the development and evaluation of an electronic nose as a new, fast and nondestructive method for detecting adulteration in honey. In this research, the ability of electronic nose as a non-destructive system for detecting honey adulteration with different percentages (pure, 20% syrup, 40% syrup, 60% syrup and 80% syrup) was investigated. The developed electronic nose consists of 8 metal oxide semiconductor sensors (MOS) to detect adultery in honey. After preprocessing the data obtained from the electronic nose the chemometric methods were utilized to classify different type of honey. Principle component analysis (PCA), hierarchical cluster analysis (HCA), linear discriminate analysis (LDA), were used to analyze the data obtained from electronic nose. Based on the results, the detection of adulteration was 98.4% of variance for PCA method, 99% accuracy for HCA method and 100% classification power by LDA method.
Received: 04.05.2018 Accepted: 16.10.2018 Keywords Adulteration Electronic Nose Honey Pattern Recognition Sensor
1Introduction Food quality is a complex concept referring to multiple characteristics that make a food product acceptable or more desirable to eat. Important food quality aspects are safety, nutritional value, functionality, and aesthetics (color, texture, aroma, appearance). While the first three are subjectively quantifiable, the last has an even more important subjective component, which makes it more difficult to describe and/or quantify. Aroma, is a very important component of this subjective quality (Lammertyn et al., 2004).
Traditional analytical and quantitative techniques for aroma analysis include HPLC, GC with headspace sampling and GC-MS analysis with solid phase microextraction. Numerous reports exist on the aroma analysis of a wide range of food products with these techniques and they have proven to give very precise and reliable results. It has been proven that they give these techniques, however, involve a lot of sample preparation, are time consuming and can only be carried out in a specially equipped laboratory environment by well-trained operators. Next to a

Research and Innovation in Food Science and Technology, 7 (2019) 4 420
chemical characterization, aroma analysis often also includes a sensory evaluation by both trained taste panels and consumer panels. This type of evaluation is important in classifying aroma characteristics according to human perception and consumer behavior. Evidently, this is a very subjective and variable evaluation, which involves a very costly and time consuming procedure (Lammertyn et al., 2004).
Honey contains a viscous solution, as well as supersaturated sugar from flower nectars, which is collected and produced by the honeybee. According to the Iranian National Standard Rules, honey is defined as a pure substance, additives cannot be added to it. Due to the high demand of Iranian honey in the country as well as neighboring countries, this has led to an increase in the sale of honey from pure honey to adulterated honey. Adulteration with sweeteners is the most important issue to assess the authenticity of honey. Sweeteners that have been detected in honey are sugar syrup, corn molasses, sugar cane and sugar beet which is affected by the acid or enzyme. Various analytical techniques, including: isotopic (Padovan et al., 2003, Cabanero et al., 2006), chromatographic (Cordella et al., 2003; Morales et al., 2008) and thermal analysis (Cordella et al., 2005) have been implemented for the detection of honey adulteration. The strength of these methods in honey adulteration detection has been proven by numerous researches, however, they are time-consuming, destructive, and some of them expensive. Therefore, fast, non-destructive, and precise analytical methods are welcome to complement the existing techniques (Shafiee et al., 2016). One of the new technics for food quality control is the e-nose technic, e-nose is an instrument designed to emulate the sense of smell and
discriminate among complex odors by means of an array of gas sensors (which respond to gases and vapors generated by the sample) and multivariate data analysis methods (Kiani et al., 2016). There are several studies reporting the use of e-nose for quality and adulteration assessment of foods, aromatic plants and fruits such as olive oil (Oliveros et al., 2002; Melucci et al., 2016), milk (Yu et al., 2007), soy sauces (Gao et al., 2017), pumpkin (Zhou et al., 2017), honey (Lammertyn et al., 2004; Zakaria et al., 2011), saffron (Heidarbeigi et al., 2015; Kiani et al., 2017), tomato (Wang & Zhou, 2007), tea (Roy et al., 2012; Huo et al., 2014), apple (Ezhilan et al., 2018), coffee (Freitas et al., 2001), sesame oil (Hai & Wang, 2006) and tomato juice (Man et al., 2005). Therefore, the objective of this study was to assess the potential application of e-nose system for detection of honey adulterated by addition of sugar syrup. Material and methods All honey samples were collected from beekeepers of different provinces of southern region of Iran (Bushehr, Hormozgan, Khuzestan, Sistan and Baluchestan, Fars and Kerman), which are the main producers of Ziziphus honey. Adulterant solutions were produced by blending of the fructose-glucose mixtures 1:1 (w/w) were prepared by mixing fructose (HFCS 55, High fructose corn syrup) and glucose (DE 42, Dextrose equivalent) (Zar Fructose Company, Iran) completely. A set of honeys were subsampled and then adulterated with fructose-glucose adulterant solutions at four levels i.e. 20, 40, 60 and 80%. Finally, each group of samples was tested 20 times by the electronic nose.
The developed e-nose system consisted of a sample and sensor chamber, air circulation system, a set of

Faal et al. Utilizing Pattern Recognition Methods for Detecting the … 421
gas sensors a data collection system and suitable data preprocessing programs written in LabVIEW software (Figure 1).
Figure 1. The developed e-nose
The basis of e-nose systems is based
on gas sensors. Semiconductor sensors metal oxide semiconductor (MOS) due to its high chemical stability, high sensitivity and suitable for a wide range of food and agricultural products were
used in the e-nose system. For designing the sensor array, about
20 different MOS gas sensors were purchased and each of them was evaluated using different honey samples, and 8 sensors that showed a large difference among different honey samples were selected and placed inside the sensor chamber.
The sensor array consists of 8 different MOS gas sensors that consists of 6 MQ sensors fabricated in (HANWEI Electronics Co., Ltd., Henan, China) and 2 TGS sensors supplied by (Figaro Engineering, Inc., Osaka, Japan) (Table 1). The circuit of both type of sensors are presented in Figure (2). According to the manufacturer's recommendations In order to ensure the correct functioning of the sensors, an hour before the experiments the sensors were turned on to achieve a steady state.
Table 1. Specifications of the sensors utilized in the sensor chamber
Sensor Detect Detection range (PPM)
MQ-2 Methane, Butane, LPG, Smoke 200-5000 MQ-3 Alcohol, Ethanol, Smoke 0.05-10 MQ-4 Methane, CNG Gas 200-10000 MQ-5 Natural gas, LPG 200-10000 MQ-6 LPG, Butane gas 200-10000
MQ-136 Hydrogen Sulfide gas 1-200 TGS-2610 High sensitivity to LP and its component gases 500-10000 TGS-2620 For alcohol, toluene, xylene, other volatile organic vapors 500-5000
(b) (a)
Figure 2. The data sheet of gas sensor (a) MQ type (b) TGS type
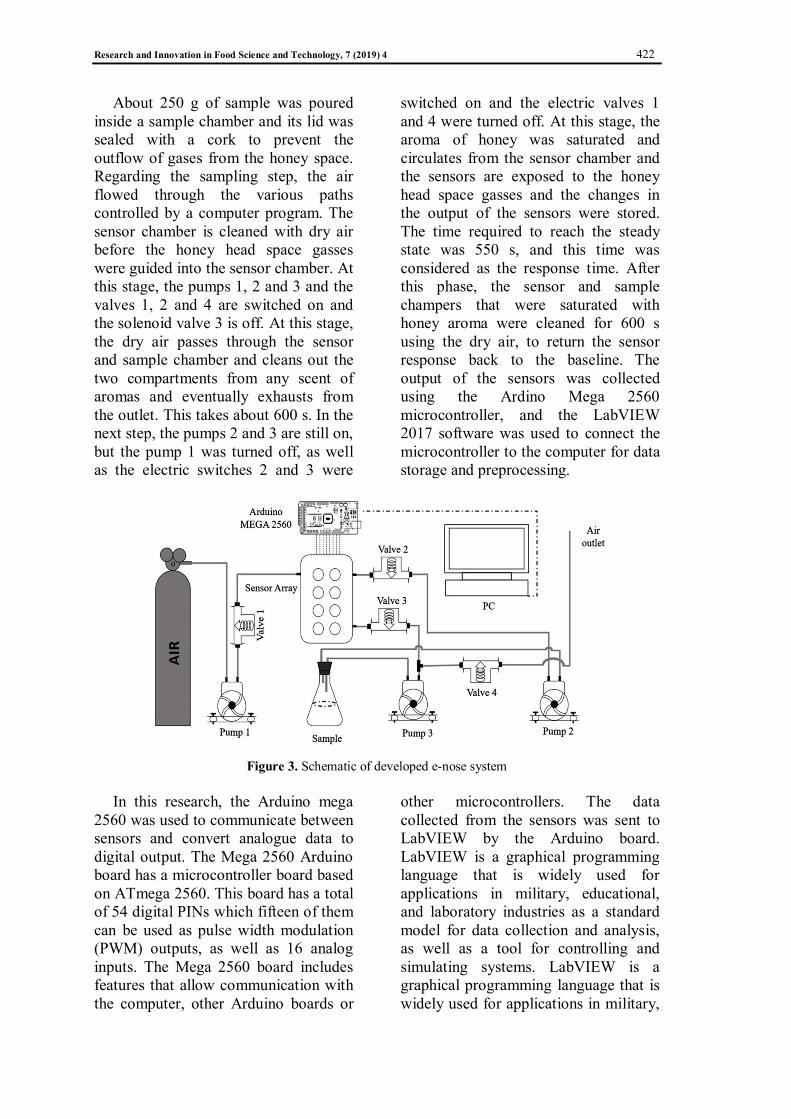
The schematic drawing of the olfactory machine system is shown in Figure (3), which shows how the system works. The measurement process in the
experiments is divided into two phases: 1) saturation and measurement; and 2) purification.
Research and Innovation in Food Science and Technology, 7 (2019) 4 422
About 250 g of sample was poured inside a sample chamber and its lid was sealed with a cork to prevent the outflow of gases from the honey space. Regarding the sampling step, the air flowed through the various paths controlled by a computer program. The sensor chamber is cleaned with dry air before the honey head space gasses were guided into the sensor chamber. At this stage, the pumps 1, 2 and 3 and the valves 1, 2 and 4 are switched on and the solenoid valve 3 is off. At this stage, the dry air passes through the sensor and sample chamber and cleans out the two compartments from any scent of aromas and eventually exhausts from the outlet. This takes about 600 s. In the next step, the pumps 2 and 3 are still on, but the pump 1 was turned off, as well as the electric switches 2 and 3 were
switched on and the electric valves 1 and 4 were turned off. At this stage, the aroma of honey was saturated and circulates from the sensor chamber and the sensors are exposed to the honey head space gasses and the changes in the output of the sensors were stored. The time required to reach the steady state was 550 s, and this time was considered as the response time. After this phase, the sensor and sample champers that were saturated with honey aroma were cleaned for 600 s using the dry air, to return the sensor response back to the baseline. The output of the sensors was collected using the Ardino Mega 2560 microcontroller, and the LabVIEW 2017 software was used to connect the microcontroller to the computer for data storage and preprocessing.
Figure 3. Schematic of developed e-nose system
In this research, the Arduino mega
2560 was used to communicate between sensors and convert analogue data to digital output. The Mega 2560 Arduino board has a microcontroller board based on ATmega 2560. This board has a total of 54 digital PINs which fifteen of them can be used as pulse width modulation (PWM) outputs, as well as 16 analog inputs. The Mega 2560 board includes features that allow communication with the computer, other Arduino boards or
other microcontrollers. The data collected from the sensors was sent to LabVIEW by the Arduino board. LabVIEW is a graphical programming language that is widely used for applications in military, educational, and laboratory industries as a standard model for data collection and analysis, as well as a tool for controlling and simulating systems. LabVIEW is a graphical programming language that is widely used for applications in military,

Faal et al. Utilizing Pattern Recognition Methods for Detecting the … 423
educational, and laboratory industries as a standard model for data collection and analysis, as well as a tool for controlling and simulating systems. This program has two basic parts, first part is the software interface and operator, and the other part is the block diagram, which is
the location of the codes and symbols that is the environment of programming. Figure (4) shows the codes written in the LabVIEW software for communicating the information between the e-nose and computer for analysis.
Figure 4. Codes writhen in the LabVIEW software
Signal preprocessing is used for
extraction of relevant data from the obtained responses and also for preparation of the data for multivariate pattern analysis. The major aspects of this preprocessing are: (a) baseline identification and manipulation /determination, (b) compression, (c) normalization (Pearce et al., 2006).
푦 (푡) = ( ) ( )
( ) (1)
Differential, relative and fractional
techniques are 3 different techniques for baseline manipulation. Fractional method is also widely used for MOS chemo-resistors. In this method, the baseline xs(0) is first subtracted from the sensor response xs(t) and then divided into the baseline. Fractional measurements are not only dimensionless but also normalized since the resulting response ys(t) is a per-unit change with respect to
the baseline, which compensates for sensors that have intrinsically large (or small) response levels. Fractional method was used in the current study (Sanaeifar et al., 2016).
Compression is a preprocessing stage in which the response of each sensor array is utilized as a feature vector or a fingerprint by decreasing the number of descriptors. In this study, the maximum response value for each sensor was individually extracted and analyzed. Normalization is the final stage of preprocessing which is applied to operate on the sensors signals to compensate for sample-to-sample variations due to the change in analytic concentration and drift in the sensors. On the other hand, normalization operates across the entire database for a single sensor (e.g., the complete history of each sensor), and is generally employed to compensate for differences in sensor scaling. In what follows, we
Research and Innovation in Food Science and Technology, 7 (2019) 4 424
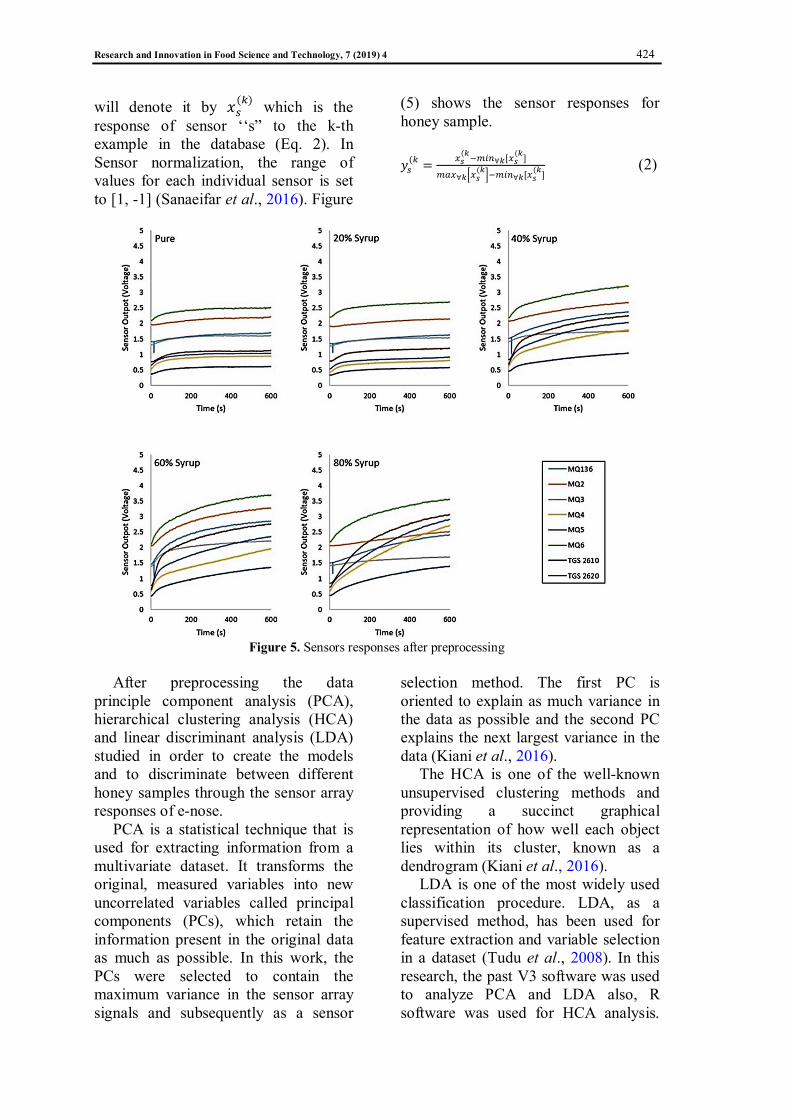
will denote it by 푥( ) which is the response of sensor ‘‘s” to the k-th example in the database (Eq. 2). In Sensor normalization, the range of values for each individual sensor is set to [1, -1] (Sanaeifar et al., 2016). Figure
(5) shows the sensor responses for honey sample.
푦( =
(∀ [ ( ]
∀(
∀ [ ( ] (2)
Figure 5. Sensors responses after preprocessing
After preprocessing the data
principle component analysis (PCA), hierarchical clustering analysis (HCA) and linear discriminant analysis (LDA) studied in order to create the models and to discriminate between different honey samples through the sensor array responses of e-nose.
PCA is a statistical technique that is used for extracting information from a multivariate dataset. It transforms the original, measured variables into new uncorrelated variables called principal components (PCs), which retain the information present in the original data as much as possible. In this work, the PCs were selected to contain the maximum variance in the sensor array signals and subsequently as a sensor
selection method. The first PC is oriented to explain as much variance in the data as possible and the second PC explains the next largest variance in the data (Kiani et al., 2016).
The HCA is one of the well-known unsupervised clustering methods and providing a succinct graphical representation of how well each object lies within its cluster, known as a dendrogram (Kiani et al., 2016).
LDA is one of the most widely used classification procedure. LDA, as a supervised method, has been used for feature extraction and variable selection in a dataset (Tudu et al., 2008). In this research, the past V3 software was used to analyze PCA and LDA also, R software was used for HCA analysis.
Faal et al. Utilizing Pattern Recognition Methods for Detecting the … 425
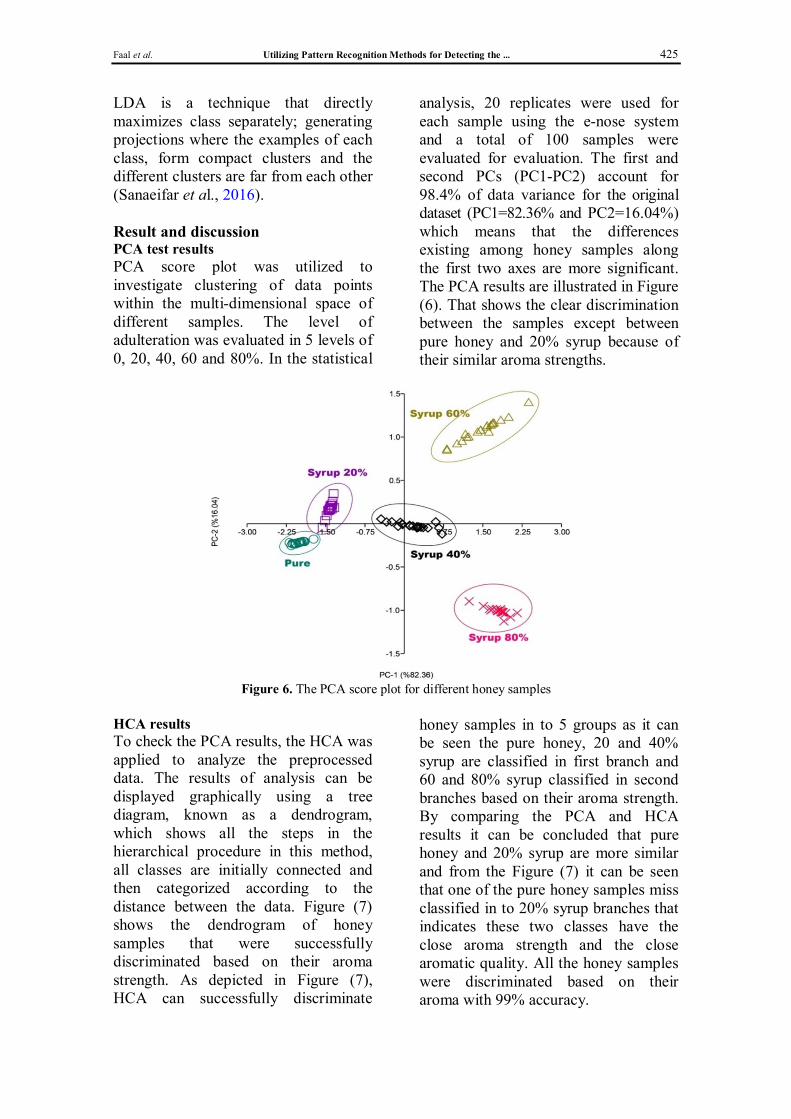
LDA is a technique that directly maximizes class separately; generating projections where the examples of each class, form compact clusters and the different clusters are far from each other (Sanaeifar et al., 2016). Result and discussion PCA test results PCA score plot was utilized to investigate clustering of data points within the multi-dimensional space of different samples. The level of adulteration was evaluated in 5 levels of 0, 20, 40, 60 and 80%. In the statistical
analysis, 20 replicates were used for each sample using the e-nose system and a total of 100 samples were evaluated for evaluation. The first and second PCs (PC1-PC2) account for 98.4% of data variance for the original dataset (PC1=82.36% and PC2=16.04%) which means that the differences existing among honey samples along the first two axes are more significant. The PCA results are illustrated in Figure (6). That shows the clear discrimination between the samples except between pure honey and 20% syrup because of their similar aroma strengths.
Figure 6. The PCA score plot for different honey samples
HCA results To check the PCA results, the HCA was applied to analyze the preprocessed data. The results of analysis can be displayed graphically using a tree diagram, known as a dendrogram, which shows all the steps in the hierarchical procedure in this method, all classes are initially connected and then categorized according to the distance between the data. Figure (7) shows the dendrogram of honey samples that were successfully discriminated based on their aroma strength. As depicted in Figure (7), HCA can successfully discriminate
honey samples in to 5 groups as it can be seen the pure honey, 20 and 40% syrup are classified in first branch and 60 and 80% syrup classified in second branches based on their aroma strength. By comparing the PCA and HCA results it can be concluded that pure honey and 20% syrup are more similar and from the Figure (7) it can be seen that one of the pure honey samples miss classified in to 20% syrup branches that indicates these two classes have the close aroma strength and the close aromatic quality. All the honey samples were discriminated based on their aroma with 99% accuracy.

Research and Innovation in Food Science and Technology, 7 (2019) 4 426
Figure 7. The dendrogram of HCA for different honeys Original and counterfeit
LDA analysis results The response of the sensors after applying the fractional preprocessing method was considered as input in the linear discrimination analysis method. LDA analysis results are shown in Figure (8). This Figure (8) represents analysis results on a two-dimensional plane, linear discriminant 1 (LD1) and linear discriminant 2 (LD2). The results obtained by LDA plot, provided a perfect classification. The first two LDs (LD1–LD2) account for 95.75% of data variance for the original dataset (LD1=74.54% and LD2=21.21%) which means that the differences existing among honey samples along
the first two axes are more significant. As the Figure (8) shows, all the honey samples are completely separated and as expected from the PCA and HCA results the pure honey and 20% syrup groups are very close to each other. The confusion matrix of LDA is given in Table (2). As shown in Table (2), in the LDA method, the 100% discrimination between pure honey and adulterated honey is evident. Yu et al. (2007) examined the ability of the e-nose to detect milk adulteration. They found that milk adulteration using linear discriminant analysis (LDA) were better than principle component analysis (PCA).
Figure 8. The LDA score plot for different honeys original and counterfeit
LD-1 (74.54%)
LD-2
(21.
21%
)

Faal et al. Utilizing Pattern Recognition Methods for Detecting the … 427
Table 2. Confusion matrix of LDA analysis Samples Pure honey 20% syrup 40% syrup 60% syrup 80% syrup
Pure honey 20 0 0 0 0 20% syrup 0 20 0 0 0 40% syrup 0 0 20 0 0 60% syrup 0 0 0 20 0 80% syrup 0 0 0 0 20
Discrimination accuracy % 100 100 100 100 100 Conclusion In this research, the portable e-nose system was built on the basis of metal oxide semiconductor (MOS) sensors. The e-nose, in contrast to conventional technologies, such as high-performance liquid chromatography (HPLC) gas chromatography (GC), which determines the aroma characteristics and components of each substance, do not have the problem of high cost, the need for an expert operator for running the systems and the laborious preparation of samples. Based on the results, the presented e-nose is a reliable tool for recording changes between different levels of adulterated honey and it’s easy to use. PCA, HCA and LDA methods
were evaluated to evaluate the ability of the e-nose to detect levels of adulteration in honey. The results included 98.4% of the variance for the PCA method and 99% accuracy classification for the HCA method and 100% classification accuracy for LDA analysis. Also, from all the analytical methods employed in this study, it can be concluded that by increasing the amount of adulteration, the similarity of the pure honey with the adulterated honeys is reduced that is evidence of the ability of the e-nose to distinguish between different honey and the ability to detect adulteration in honey with high precision.
References Cabanero, A.I., Recio, J.L., & Ruperez, M. (2006). Liquid chromatography coupled to isotope ratio mass spectrometry: a new perspective on honey adulteration detection. Journal of Agricultural and Food Chemistry, 54(26), 9719-9727 . doi: https://doi.org/10.1021/jf062067x
Cordella, C., Militao, J.S.L.T., Clement, M .- C., Drajnudel, P., & Cabrol-Bass, D. (2005). Detection and quantification of honey adulteration via direct incorporation of sugar syrups or bee-feeding: preliminary study using high-performance anion exchange chromatography with pulsed amperometric detection (HPAEC-PAD) and chemometrics. Analytica Chimica Acta, 531(2), 239-248. doi: https://doi.org/10.1016/j.aca.2004.10.018
Cordella, C., Faucon, J.-P., Cabrol-Bass, D., & Sbirrazzuoli, N. (2003). Application of DSC as a tool for honey floral species characterization and adulteration detection. Journal of Thermal Analysis and Calorimetry, 71(1), 279-290. doi: https://doi.org/10.1023/A:1022251208688
Ezhilan, M., Nesakumar, N., Babu, K.J., Srinandan, C.S., & Rayappan, B.B. (2018). An electronic nose for royal delicious apple quality assessment-a tri-layer approach. Food Research International, 109, 44-51. doi: https://doi.org/10.1016/j.foodres.2018.04.009
Freitas, A.M.C., Parreira, C., & Vilas-Boas, L. (2001). The use of an electronic aroma-sensing device to assess coffee differentiation-comparison with SPME gas chromatography-mass spectrometry aroma patterns. Journal of Food Composition and Analysis, 14(5), 513-522. doi: https://doi.org/10.1006/jfca.2001.0987
Gao, L., Liu, T., An, X., Zhang, J., Ma, X., & Cui, J. (2017). Analysis of volatile flavor compounds influencing Chinese-type soy sauces using GC–MS combined with HS-SPME and discrimination with
Research and Innovation in Food Science and Technology, 7 (2019) 4 428
electronic nose. Journal of Food Science and Technology, 54(1), 130-143. doi: https://doi.org/10.1007/s13197-016-2444-0
Hai, Z., & Wang, J. (2006). Detection of adulteration in camellia seed oil and sesame oil using an electronic nose. European Journal of Lipid Science and Technology, 108(2), 116-124. doi: https://doi.org/10.1002/ejlt.200501224
Heidarbeigi, K., Mohtasebi, S.S., Foroughirad, A., Ghasemi-Varnamkhasti, M., Rafiee, S., & Rezaei, K. (2015). Detection of adulteration in saffron samples using electronic nose. International Journal of Food Properties, 18(7), 1391-1401. doi: https://doi.org/10.1080/10942912.2014.915850
Huo, D., Wu, Y., Yang, M., Fa, H., Luo, X., & Hou, C. (2014). Discrimination of chinese green tea according to varieties and grade levels using artificial nose and tongue based on colorimetric sensor arrays. Food Chemistry, 145, 639-645. doi: https://doi.org/10.1016/j.foodchem.2013.07.142
Kiani, S., Minaei, S., & Ghasemi-Varnamkhasti, M. (2017). Integration of computer vision and electronic nose as non-destructive systems for saffron adulteration detection. Computers and Electronics in Agriculture, 141, 46-53. doi: https://doi.org/10.1016/j.compag.2017.06.018
Kiani, S., Minaei, S., & Ghasemi-Varnamkhasti, M. (2016). A portable electronic nose as an expert system for aroma-based classification of saffron. Chemometrics and Intelligent Laboratory Systems, 156, 148-156. doi: https://doi.org/10.1016/j.chemolab.2016.05.013
Lammertyn, J., Veraverbeke, E.A., & Irudayaraj, J. (2004). zNose™ technology for the classification of honey based on rapid aroma profiling. Sensors and Actuators B: Chemical, 98(1), 54-62. doi: https://doi.org/10.1016/j.snb.2003.09.012
Man, Y.B.C., Gan, H.L., NorAini, I., Nazimah, S.A.H., & Tan, C.P. (2005). Detection of lard adulteration in RBD palm olein using an electronic nose. Food Chemistry, 90(4), 829-835. doi: https://doi.org/10.1016/j.foodchem.2004.05.062
Melucci, D., Bendini, A., Tesini, F., Barbieri, S., Zappi, A., Vichi, S., Conte, L., & Toschi, T.G. (2016). Rapid direct analysis to discriminate geographic origin of extra virgin olive oils by flash gas chromatography electronic nose and chemometrics. Food Chemistry, 204, 263-273. doi: https://doi.org/10.1016/j.foodchem.2016.02.131
Morales, V., Corzo, N., & Sanz, M.L. (2008). HPAEC-PAD oligosaccharide analysis to detect adulterations of honey with sugar syrups. Food Chemistry, 107(2), 922-928. doi: https://doi.org/10.1016/j.foodchem.2007.08.050
Oliveros, M.C.C., Pavon, J.L.P., Pinto, C.G., Laespada, M.E.F., Cordero, B.M., & Forina, M. (2002). Electronic nose based on metal oxide semiconductor sensors as a fast alternative for the detection of adulteration of virgin olive oils. Analytica Chimica Acta, 459(2), 219-228. doi: https://doi.org/10.1016/S0003-2670(02)00119-8
Padovan, G.J, De Jong, D., Rodrigues, L.P., & Marchini, J. (2003). Detection of adulteration of commercial honey samples by the 13C/12C isotopic ratio. Food Chemistry, 82(4), 633-636. doi: https://doi.org/10.1016/S0308-8146(02)00504-6
Pearce, T. C., Schiffman, S. S., Nagle, H. T., & Gardner, J. W. (2006). Handbook of machine olfaction: electronic nose technology. John Wiley & Sons.
Roy, R.B., Tudu, B., Shaw, L., Jana, A., Bhattacharyya, N., & Bandyopadhyay, R. (2012). Instrumental testing of tea by combining the responses of electronic nose and tongue. Journal of Food Engineering, 110(3), 356-363. doi: https://doi.org/10.1016/j.jfoodeng.2011.12.037
Sanaeifar, A., Mohtasebi, S.S., Ghasemi-Varnamkhasti, M., & Ahmadi, H. (2016). Application of MOS based electronic nose for the prediction of banana quality properties. Measurement, 82, 105-114. doi: https://doi.org/10.1016/j.measurement.2015.12.041

Faal et al. Utilizing Pattern Recognition Methods for Detecting the … 429
Shafiee, S., Polder, G., Minaei, S., Moghaddam-Charkari, N., Van Ruth, S., & Kus, P.M. (2016). Detection of honey adulteration using hyperspectral imaging. IFAC-PapersOnLine, 49(16), 311-314. doi: https://doi.org/10.1016/j.ifacol.2016.10.057
Tudu, B., Kow, B., Bhattacharyya, N., & Bandyopadhyay, R. (2008, December). Comparison of multivariate normalization techniques as applied to electronic nose based pattern classification for black tea. In 2008 3rd International Conference on Sensing Technology (pp. 254-258). IEEE. doi: https://doi.org/10.1109/ICSENST.2008.4757108.
Wang, J., & Zhou, Y. (2007). Electronic‐nose technique: potential for monitoring maturity and shelf life of tomatoes. New Zealand Journal of Agricultural Research, 50(5), 1219-1228. doi: https://doi.org/10.1080/00288230709510405
Yu, H., Wang, J., & Xu, Y. (2007). Identification of adulterated milk using electronic nose. Sensors and Materials, 19(5), 275-285.
Zakaria, A., Shakaff, A.Y.M., Masnan, M.J., Ahmad, M.N., Adom, A.H., Jaafar, M.N., Ghani, S.A., Abdullah, A.H., Aziz, A.H.A., Kamarudin, L.M., Subari, N., & Fikri, N. (2011). A biomimetic sensor for the classification of honeys of different floral origin and the detection of adulteration. Sensors, 11(8), 7799-7822. doi: https://doi.org/10.3390/s110807799
Zhou, C.-L., Mi, L., Hu, X-Y, & Zhu, B-H. (2017). Evaluation of three pumpkin species: correlation with physicochemical, antioxidant properties and classification using SPME-GC-MS and e-nose methods. Journal of Food Science and Technology, 54(10), 3118-3131. doi: https://doi.org/10.1007/s13197-017-2748-8
Research and Innovation in Food Science and Technology, 7 (2019) 4 430
جهت ییایحسگر بو يها داده زیالگو در آنال صیتشخ يها استفاده از روش تقلبات گلوکز و فروکتوز در عسل ییشناسا
5محمدتقی گلمکانی، 4محمدحسین رئوفت، *3، سعادت کامگار2محمد لغوي ،1سعید فعال
، ایرانشیرازدانشگاه شیراز، ، بخش مهندسی بیوسیستم، دانشکده کشاورزي، استادیار -3و1 )[email protected](مسئول ةنویسند * ، ایرانشیرازدانشگاه شیراز، استاد، بخش مهندسی بیوسیستم، دانشکده کشاورزي، -4و2 ، ایرانشیرازدانشگاه شیراز، دانشیار، بخش مهندسی علوم و صنایع غذایی، دانشکده کشاورزي، - 5
چکیده ي مختلف، موقعیت جغرافیایی و ها گلو بوي آن بسته به دیآ یمحساب بندي عسل به ي مهم در طبقهپارامترهاعسل یکی از ۀرایح
عنوان روشی ماشین بویایی به ۀمتفاوت باشد. هدف از این تحقیق توسعه و ارزیابی یک سامان تواند یمعسل ةدهند ترکیبات تشکیلصرفه، سریع و غیرمخرب جهت شناسایی تقلب در عسل بود. براي این منظور ارتباط بین گازهاي سر فضاي به نوین، مقرون
شربت) مورد درصد 80شربت و درصد 60شربت، درصد 40شربت، درصد 20ي با درصدهاي مختلف تقلب (خالص، ها عسلآوري اطلاعات موجود در هادي اکسید فلزي براي جمع نیمه حسگرعدد 8شده شامل ارزیابی قرار گرفت. ماشین بویایی ساخته
هاي تشخیص الگو جهت آمده از ماشین بویایی مدل دست هاي به پردازش داده گازهاي فضاي فوقانی عسل بود. بعد از پیشالگو و صیتشخ يها تمیداده، الگور لیتحص ۀسامان شامل شده طراحی ۀسامان اصلی شناسایی تقلب مورداستفاده قرار گرفتند. اجزاي
) LDAخطی ( ةکنند تفکیک و تحلیل (آنالیز) ،)HCAي (ا خوشه ۀ)، تجزیPCAي اصلی (ها مؤلفهتحلیل .باشد یداده م لیتحلآمده دست به نتایج به بویایی، مورداستفاده قرار گرفتند. باتوجه نیماشآمده از دست ي بهها دادهیی بودند که براي تحلیل ها روش
قدرت درصد 100و HCAبندي به روش دقت طبقه درصد PCA ،99واریانس به روش درصد 4/98دقت تشخیص تقلب شامل اطمینان در تشخیص تقلب مد و قابلآکار ۀشده یک وسیل بود. نتایج نشان داد ماشین بویایی ساخته LDAوش بندي به ر طبقه
.عسل است
بویایی ماشین، عسل، حسگر، تقلب ،تشخیص الگو: ي کلیدي ها واژه