utilization of fermentation and purification...
TRANSCRIPT

UTILIZATION OF FERMENTATION AND PURIFICATION
STRA. TEGIES TO ENHANCE THE YIELD OF
BmR1 ANTIGEN
by
NORSYAHIDA ARIFIN
Thesis submitted in fulfillment of the
requirements for the degree of
Master of Science
March 2010

ACKNO\VLEDGEMENTS
All praises and gratitude is due to Allah, the Most Merciful and Compassionate.
First of all, I am heartily thankful to my supervisor, Profesor Rahmah Noordin
for her encouragement, guidance and support in all the time of research and
writing of the thesis. Her wide knowledge, constructive criticism and excellent
advice have been of great value for me. I warmly thank my co-supervisor, Dr
Ahmad Ramli Mohd Y ahya, for his guidance and advice on the fermentation
aspects of this thesis.
I wish to express my sincere thanks to the laboratory and administration staff,
especially Azizi, Jannah, and Nyambar for their helping hands in all the time of
research. My warm thanks are due to INFORMM for providing well-equipped
facilities and Dr Amutha for her assistance in writing this thesis.
I owe my deepest gratitude to Madihah, Y ee Siew, Suet Ling and Jimmy for their
contributions to this project. And also, I wish to express my appreciation to my
dear colleagues, Kak Emi, Kak Suharni, Kak Rohana, Kak Ude, Kak Nurul, Kak
Anisah and Zul for all their help, support and sharing the laughter together.
I would also like to acknowledge the cooperation that I received from members
of Laboratory 318, School of Biological Sciences and the Chromatography Unit,
School of Chemical Sciences, USM for use of the HPLC system.
11

I owe my loving thanks to my husband, Mohd Anas Ahmad for his love, care,
patience and inspiration, to my parents for their unconditional love and support,
and to my parents in-laws and my family. This thesis is dedicated to my dear son,
Zaim Hakimi who'll tum to one as I finished completing this thesis. Lastly, I
offer my regards and blessings to all of thdse who supported me in any aspect
during the completion of the project.
The financial support of the Ministry of Science and Technology (MOSTI) and
ASTS fellowship ofUniversiti Sains Malaysia are greatfully acknowledged.
iii

TABLE OF CONTENTS
Acknowledgements
Table of Contents
List of Tables
List of Figures
List of Abbreviations
Abstrak
Abstract
CHAPTER ONE
INTRODUCTION I
1.1 . Introduction to lymphatic filariasis
1.1.1 Lymphatic filariasis
1.1.2 Transmission and life cycle
1.1.3 Brugia malayi
1.1.4 Clinical manifestation
1.1.5 Diagnosis of lymphatic filariasis
1.1.6 Elimination of lymphatic filariasis
1.1.7 Brugia RapidTM
1.2 E. coli fermentation
1.2.1
1.2.2
1.2.3
History
Characteristics of E. coli
Permenter
1.2.4 Mode of fermentation
1.2.4.1
1.2.4.2
1.2.4.3
Batch fermentation
Continuous fermentation
Fed-batch fermentation
1.2.5 Cultivation in fed-batch fermentation
1.2.5.1
1.2.5.2
Growth medium
Feeding strategies
1.2.5.2.1 Pre-induction feeding strategy
lV
Page
ii
iv
viii
ix
xii
xiv
xvii
Page
3
6
9
10
11
13
14
16
18
22
22
23
24
26
29

1.3
1.4
1.2.5.2.2 Post-induction feeding strategy
1.2.6 Induction with IPTG
1.2.7 Challenges in fermentation of recombinant E. coli
1.2.7.1 Secretion of acetic acid
1.2.8 Recombinant protein purification
1.2.8.1
1.2.8.2
Cell disruption
Affinity chromatography
Rationale of the study
Objectives of the study
CHAPTER TWO
MATERIALS AND METHODS
2.0 Bacterial 1strain
2.1 Growth and maintenance of bacterial strain
2.2 Experimental plan
2.3 Medium formulation in shake flask
2.4 Medium composition in fermenter
2.5 Analytical procedures
2.5.1 Measurement of dry cell weight
2.5.2 Determination of residual glucose concentration
2.5.3 Determination of acetic acid concentration
2.6 Protein purification protocol
2.6.1 Protein expression
2.6.2 Sample preparation for protein purification
2.6.3 Fast Performance of Liquid Chromatography
(FPLC) protein purification
2.6.4 Preparation of AKTA ™prime machine and
HisTrap column
2.6.5 Binding, washing and elution of histidine-tagged protein
2.6.6 Washing the resin and AKTA ™ prime
after protein purification process
2.7 Protein analysis
2.7.1 Bradford assay
2.7.2 SDS-PAGE
v
30
31
32
36
38
41
41
44
44
44
47
47
49
49
49
52
52
52
53
53
54
54
55
55

2.7.3 Western blot 58
CHAPTER THREE
IMPROVEMENT OF FERMENTATION CONDITIONS AND INDUCTION
STRATEGIES
3.1 Introduction 60
3.2 Materials and Methods
3.2.1 Small scale studies in shake flask 63
3.2.1.1 Media trials 63
3.2.1.2 Initial glucose concentration 64
3.2.2 Preparation of inoculum for shake flask studies 65
3.2.3 Preparation of inoculum for fermenter 65 I
3.2.4 Fermentation process set-up 65
3.2.5 Fe~entation parameter 66
3.2.6 Batch fermentation 66
3.2.7 Fed-batch fermentation
3.2.7.1 Varying the mode of feeding method 67
3.2.7.2 Improvement ofthe exponential
feeding strategy 68
3.2.7.3 Varying the induction parameter 70
3.3 Results and Discussion
3.3.1 Small scale studies in shake flask
3.3.1.1 Media trials 70
3.3.1.2 Initial glucose concentration 76
3.3.2 Batch fermentation 82
3.3.3 Improvement of feeding strategy 82
3.3.4 Monitoring of acetic acid accumulation 93
3.3.5 Varying the induction parameter 97
3.3.5.1 Induction of the target protein with
different concentration of IPTG and
frequency if induction 98
3.3.5.2 Induction of the target protein at
different growth phase 103
Vl

CHAPTER FOUR
IMPROVEMENT OF PROTEIN PURIFICATION METHOD
4.1 Introduction 108
4.2 Materials and Methods
4.2.1 Varying the volume of washing buffer 115
4.2.2 Varying the imidazole concentration in lysis buffer 116
4.2.3 Varying the salt concentration in buffers solution 116
4.3 Results and Discussion
4.3.1 Volume of washing buffer 116
4.3.2 Imidazole concentration 122
4.3.3 Salt concentration 129
CHAPTER FIVE
EVALUATION OF THE PURIFIED BmR1 RECOMBINANT PROTEIN
5.1 Introduction
5.2 Materials and Methods
5.2.1 ELISA
5.2.2 Immunochromatography test (Rapid Test)
5.3 Results and Discussion
5.3.1 ELISA
5.3.2 Immunochromatography test (Rapid Test)
CHAPTER SIX
GENERAL DISCUSSION AND SUMMARY
REFERENCES
LIST OF PUBLICATIONS
APPENDICES
1- MEDIA AND SOLUTIONS RECIPES
2- FPLC PROTOCOL
VII
133
137
138
140
144
148
155
. 169
175
181

Table 2.1
2.2
2.3
3.1
3.2
3.3
3.4
3.5
3.6
3.7
5.1
5.2
5.3
LIST OF TABLES
Medium composition for batch studies in shake flask.
Medium composition for fed-batch fermentation
Recipe for polyacrilamide separating and stacking for 2 small gels.
Kinetic parameter values applied during the fed-batch fermentation.
Effect of different medium on growth characteristics of E. coli.
Effect of different initial glucose concentration on growth characteristics of E. coli.
Growth performance of recombinant E. coli m exponential fed-batch operated at different specific growth rate and post-induction feeding rate.
Comparison of culture performance at different concentration and frequency of IPTG induction.
Comparison of culture performance with different frequency of induction at mid-log phase.
Comparison of growth profile at different phase of induction.
Optical density (OD) values of positive serum samples employed for evaluation of sensitivity of ELISA using sera of individuals infected with filarial infection.
Optical density (OD) values of negative serum samples employed for evaluation of specificity of ELISA using sera of individuals infected with other parasitic helminthes and protozoa, and healthy individuals.
Result for the t-test analysis of positive and negative serum
Vlll
Page 48
48
57
69
71
76
88
100
104
106
141
142
143

LIST OF FIGURES
Figures Page 1.1 World endemic countries of lymphatic filariasis, 2006 2
1.2 The life cycle of B. malayi 4
1.3 Microfilaria of Brugia malayi 8
1.4 Schematic diagram of a stirred tank fermenter 19
1.5 Instrument set-up for fed-batch fermentation 21
1.6 Biochemical pathways of glycolysis and tricarboxylic 34 acid (TCA) cycle in E. coli.
2.1 Flow chart of the experimental design. 46
2.2 Calibration graph between optical density at 600 nm and 51 cell dry weight (CDW).
2.3 Calibration graph between concentration of standard 51 acetic acid and area.
3.1 The growth profile of Bml7DllllpPROEX™HT during 74 cultivation in modified TB medium.
3.2 The growth profile of Bml7DJJUpPROEX™HT during 74 cultivation in LB medium.
3.3 The growth profile of Bml7DJJUpPROEX™HT during 75 cultivation in defmed medium.
3.4
3.5
3.6
3.7
The growth ~rofile during Bm17DIJUpROEX MHT/TOPlO in medium with 2 g/1 glucose.
The growth ~rofile during Bml7DIJUpROEX MHT/TOPlO in medium with 5.42 g/1 glucose.
The growth ~rofile during Bm17Dlll/pROEX MHT/TOPlO in medium with 10 g/1 glucose.
cultivation modified
cultivation modified
cultivation modified
of TB
of TB
of TB
Comparison of cell mass obtained in three different initial glucose concentrations in modified TB medium with the original TB medium.
ix
78
78
79
81

3.8
3.9
3.10
3.11
3.12
3.13
. 3.14
3.15
3.16
3.17
4.1
4.2
4.3
4.4
4.5
Growth profiles of the recombinant bacteria during batch cultivation in fermenter.
Comparison of cell mass on three.different mode of fedbatch fermentation.
Comparison of the bacterial growth profile at three different specific growth rates namely 0.075, 0.10, 0.15 h-1 with 1.97 ml/min of constant feed rate during postinduction phase.
Comparison of the bacterial growth profile at three different specific growth rates namely 0.075, 0.10, 0.15 h-1 with 3.97 ml/min of constant feed rate during postinduction phase.
Typical fermentation conditions of cultivation during fed-batch fermentation.
Profile of acetic acid production during low feeding rate (f.l=0.075 h-1 and constant feeding rate at 1.97 mllmin)
Profile of acetic acid production during high feeding rate (f.l=0.15 h-1 and constant feeding rate at 3.97 ml/min)
Profile of acetic acid production during low feeding rate (f.l=O.lO h-1 and constant feeding rate at 3.97 ml/min)
Comparison of bacterial growth profile induced at different concentration and frequency of IPTG induction.
Comparison of growth profile between single and twice IPTG induction at mid-log phase.
Map of BmRI recombinant plasmid.
Map of gene sequence of pBmR1.
Structure of histidine (a) and imidazole (b).
Comparison concentrations
of at
BmR1 three
recombinant different
antigen imidazole
concentrations and two different volumes of wash buffer.
Chromatogram output of the purification at 20 mM imidazole and 5 CV.
X
83
83
85
85
91
94
94
96
102
106
110
112
114
119
120
4.6
4.7
4.8
4.9
4.10
4.11
4.12
4.13
5.1
5.2
5.3
Chromatogram output of the elution step.
SDS-PAGE analysis of the fractions (F9-F26) collected by performing laboratory scale protein purification with 20 mM imidazole in lysis buffer and 5 column volume of wash buffer.
SDS-PAGE analysis of the fractions collected by performing laboratory scale proteitl purification with 20 mM imidazole in lysis buffer and (a) 5 column volume, (b) 1 0 column volume of wash buffers.
SDS-PAGE analysis of the fractions collected by performing laboratory scale protein purification with 40 mM imidazole in lysis buffer and (a) 5 column volume, (b) 10 column volume of wash buffers.
SDS-P AGE analysis of the fractions collected by performing laboratory scale protein purification with 50 mM imidazole in lysis buffer and (a) 5 column volume, (b) 10 column volume of wash buffers.
Western blot analysis of the recombinant protein using patients' serum.
SDS-PAGE profiles of the fractions (F9-F17) collected by performing protein purification with 300 mM of NaCl in all buffers.
SDS-PAGE profiles of the fractions (F10-F18) collected by performing protein purification with 500 mM of NaCl in all buffers.
Procedure ofBrugia Rapid™ dipstick test.
Brugia Rapid tested with positive sera showing two clear lines of purple-reddish color on the dipstick.
Brugia Rapid tested with negative sera showing only one clear line of purple-reddish color on the dipstick.
Xl
120
121
123
124
125
128
131
131
139
145
146

LIST OF ABBREVIATIONS
Description Abbreviations 1 Ampicillin resistance (~-lactamase) gene Ampr 2 Base pair( s) bp 3 Bovine serum albumin BSA 4 Cell concentration X 5 Celsius c 6 Centimetre( s) em 7 Dalton Da 8 Deoxyribonuclease DNase 9 Deoxyribonucleic acid DNA 10 E.coli TOPlO host (Invitrogen, USA) TOPIO 11 Ethylenediaminetetraacetic acid EDTA 12 Fermentation time t
13 Global Programme for the Elimination of Lymphatic GPELF Filariasis
14 Growth rate llm 15 Horseradish peroxidase HRP 16 Hour(s) hr 17 Initial cell concentration X 18 Initial substrate concentration si 19 Isopropyl-~-D-thiogalactoside IPTG 20 Kilobase(s) kb 21 Kilodalton( s) kDa 22 Kilogram(s) kg 23 Luria Bertani LB 24 Maximum concentration of cell Xm 25 Molar M 26 Molecular weight MW 27 Microgram(s) llg 28 Micro litre( s) Jlm 29 Micromeue( s) Jlm 30 Milliampere( s) rnA 31 Milligram( s) mg 32 Milliliter( s) ml 33 Millimetre( s) mm 34 Millimolar( s) mM 35 Minute(s) mm. 36 Nanogram(s) ng 37 Nanomolar(s) nM 38 Nickel-nitrilotriacetic acid Ni-NTA 39 Phosphate-buffered saline PBS 40 Revolutions per minute rpm 41 Ribonuclease RNase 42 Ribonucleic acid RNA 43 Second(s) sec. 44 Subsirate concentration at Xm Sm 45 Ultra violet uv
Xll

46 47 48 49
Volume Volt(s) Watt(s) World Health Organization
Xlll
vol. v w WHO

PENGGUNAANSTRATEGIFERMENTASIDAN
PENULENAN BAGI PENINGKATAN HASIL ANTIGEN BmRl
ABSTRAK
Brugia Rapid merupakan UJian diagnostik komersial yang digunakan untuk
mengesan jangkitan terhadap Brugia malayi dan Brugia timori (filariasis brugia).
Ujian ini merupakan format ujian batang pencelup aliran sehala yang menggunakan
antigen rekombinan BmR1 yang diekspreskan daripada klon
Bm17DIII/pPROEX™HTITOP 10. Oleh kerana penggunaan ujian 1ini mendapat
permintaan yang tinggi di pasaran, maka peningkatan penghasilan ke skala besar dan
peningkatan efisiensi penulenan adalah perlu untuk mengurangkan kos penghasilan
ujian tersebut.
Pengkulturan ke atas bakteria rekombinan ini dijalankan melalui kaedah fermentasi
kultur sekelompok, di mana sel ditumbuhkan di dalam media kaldu "Terrific"
terubahsuai dan glukosa disuapkan secara eksponen pada kadar yang terkawal
menggunakan "Multifermenter Control Software" (MFCS) untuk suapan secara
automatik semasa sebelum dan selepas aruhan. Kepelbagaian ke atas kadar
pertumbuhan spesifik menunjukkan kepekatan akhir sel sebanyak 24.3 g/1 diperolehi
pada kadar pertumbuhan spefisik ditetapkan pada 0.15 h-I, diikuti dengan sua pan
pada kadar yang tinggi selepas aruhan. Walau bagaimanapun, didapati peningkatan
yang lebih tinggi ke atas kadar pertumbuhan spesitik tidak meningkatkan hasil sel,
sebaliknya mengurangkan penghasilan protein rekombinan BmRl. Didapati
xiv

penghasilan tertinggi protein rekombinan BmR1 sebanyak 9.82 g/1 diperolehi apabila
suapan dilakukan pada kadar tetap yang rendah (1.9 ml/min), digabungkan dengan
kadar pertumbuhan spesifik yang dikawal pada 0.075 h-1. Selain itu juga, dapat
diperhatikan bahawa pada kadar ini, produktiviti spesifik keseluruhan, hasil koefisien
fermentasi [hasil biomas (Yx/s) dan hasil produk (Yp/s)] adalah yang tertinggi
dibandingkan dengan proses lain. Strategi ini telah berjaya mengawal pengumpulan
bahan-rencatan asid asetik di bawah tahap rencatan iaitu 1.26 g/1.
Ekspresi terhadap antigen rekombinan BmRl adalah optimum dengan dua kali
aruhan IPTG berkepekatan 1 mM. Aruhan yang dilakukan pada fasa log pertengahan I
telah menghasilkan protein terlarut dalam jumlah yang signifikan. Oleh itu,
penulenan antigen rekombinan BmR1 dilakukan melalui penulenan tidak temyahasli
(non-denaturing) kromatografi afiniti logam tidak bergerak ("immobilized metal
affinity chromatography").
Kajian mempelbagaikan isipadu penimbal pembasuh, kepekatan imidazol dan garam
telah dijalankan untuk meningkatkan efisiensi proses penulenan protein. Kepekatan
imidazol pada 20 mM adalah yang terbaik di mana ia memberikan kepekatan antigen
rekombinan BmR1 yang tertinggi dengan ketulenan yang baik. Apabila penimbal
basuhan sebanyak lima isipadu kolum digunakan semasa proses penulenan, hasil
kepekatan antigen rekombinan yang diperolehi adalah sebanyak 5.14 mg/1,
dibandingkan dengan hasil yang diperolehi iaitu sebanyak 2.84 g/1 apabila 10 isipadu
kolum penimbal basuhan digtmakan. Hasil keseluruhan protein sasaran meningkat
sebanyak tujuh kali ganda dibandingkan dengan hasil protein yang diperolehi melalui
kaedah konvensiorial pengkulturan di dalam kelalang.
XV

Tahap sensitiviti dan spesifisiti antigen rekombinan BmR1 yang dihasilkan dalam
kajian ini ditentukan melalui ujian Pemblotan Western dan dua lagi ujikaji imunoasai
iaitu ELISA dan ujian pantas imunokromatografi. Melalui kaedah ELISA, didapati
antigen rekombinan BmR1 yang dihasilkan dalam kajian ini mengekalkan sifat
antigenik apabila dikesan oleh serum pesakit .filariasis (1 00% sensitif) dan tidak
bertindakbalas apabila diuji menggunakan serum dari jangkitan lain dan individu
yang sihat (1 00% spesifik). Apabila ia diaplikasikan pada ujian pantas, antigen
rekombinan BmR1 bertindakbalas terhadap antibodi anti-filaria di dalam serum
pesakit yang dijangkiti dengan Brugia malayi dan menunjukkan tahap sensitiviti
100%. Oleh itu, antigen rekombinan BmR1 yang dihasilkan ini adalah sesuai untuk I
digunakan dalam penghasilan kit Brugia Rapid™.
Secara keseluruhannya, kajian ini mencadangkan penambahbaikan, kaedah yang
lebih efisien, dan lebih jimat ke atas proses penghasilan berskala besar dan proses
hiliran antigen BmRl, seterusnya sesuai untuk aplikasi industri.
xvi

UTILIZATION OF FERMENTATION AND PURIFICATION
STRATEGIES TO ENHANCE THE YIELD OF
BmRl ANTIGEN
ABSI'RACT
Brugia Rapid TM is an established diagnostic test that is commercially available. to
detect infection to both B. malayi and B. timori infections (brugian filariasis). The test
is a dipstick lateral flow test format that utilizes BmRl recombinant antigen
expressed by the clone Bml7DJII/pPROEX™HTITOP 10. Due to a significant
demand for the test in the market; there is a need to scale up the production of the
recombinant antigen and increase the purification efficiency to reduce the production
cost of the test.
The cultivation of the recombinant bacteria was performed usmg fed-batch
fermentation where cells were grown in a modified Terrific broth medium and
glucose was fed exponentially at a controlled rate using Multifermenter Control
Software (MFCS) for automated feeding during pre-induction and post-induction
feeding. Varying the specific growth rate (!l) prior to induction showed that a final
cell concentration of 24.3 g/L was obtained at specific growth rate of 0.15 h-1 with
feeding at high rate during post-induction. However, further increase of the specific
growth rate during pre-induction feeding does not produce a higher cell mass, in fact
it decreased the BmRl recombinant protein production. It was found that the highest
BmRl production of 9.82 g/L was obtained when the feeding was carried out at low
constant rate (1.9 ml/min), combined with the specific growth rate controlled at
xvii

0.075 h-1• It was also observed that at this feeding rate, the overall specific
productivity, the fermentation yield coefficients [biomass yield (Y xis) and product
yield (Ypts)] was the highest amongst all the runs tested. This strategy has
successfully controlled the accumulation of acetic acid by-inhibitory product below
the reported growth inhibitory level of 1.26 giL .•
The expression of BmRl recombinant antigen was found to be optimal with twice
induction of 1 mM of IPTG concentration. Initiation of expression at mid log had
generated significant amounts of the soluble protein. Therefore, the BmR1
recombinant antigen was then purified under non-denaturing conditions using
immobilized metal affinity chromatography.
In order to increase the efficiency of purification process, various volumes of wash
buffer, imidazole and salt concentration were performed. Imidazole at 20 mM was
fcund to be the best concentration that gave the best yield of BmRl recombinant
antigen while achieving sufficient purity. When 5 column volumes (CV) of washing
buffer was used in the purification step, the production of BmRl recombinant antigen
was 5.14 mg/1; as compared to 2.84 mg/1 when 10 CV of washing buffer was
employed. The overall production of the target protein was improved seven-fold
compared to the conventional flask cultivation method.
The sensitivity and specificity of the purified BmRl recombinant antigen produced in
this study was confirmed by Western blot and two other immunoassays techniques
namely ELISA and immunochromatographic rapid test. By the ELISA technique, it
was found that the BmRl recombinant antigen produced in this study retained its
xviii
CHAPTER ONE
INTRODUCTION
1.1 Introduction to lymphatic filariasis
1.1.1 Lymphatic filariasis
Lymphatic filariasis (LF), or more commonly known as elephantiasis, is a parasitic
disease caused by thread-like worms that live in the human lymphatic system. This
disease is widespread and occurs throughout the tropical and sub-tropical regions of
the world, such as Asia, Africa, Central and South America (Figure 1.1). The World
Health Organization (WHO) has identified lymphatic filariasis to be one of the six
infectious diseases that has the potential to be eliminated as a public health problem
(WHO, 1998). Consequently a global programme for elimination of the disease
known as the 'Global Programme to Eliminate Lymphatic Filariasis' (GPELF) was
initiated in year 2000. In 2006, WHO has reported that more than 20% of the world's
populations are at risk of acquiring LF. Meanwhile, it is estimated that over 120
million of people in at least 83 countries in the world have already been infected and
more than 40 million people are incapacitated by the disease (The Global Alliance to
Eliminate Lymphatic Filariasis (GAELF), http://www.tilariasis.org). Statistics have
shown that over 25 million men suffered from the genital form of the disease, while
more than 15 million of people suffered from lymphoedema or elephantiasis of the
leg. Out of this, 90% of the cases are caused by Wuchereria bancrofti whereas
Brugia malayi accounts for about 10% (or 13 million) of the infected people
especially in South and Southeast Asia, South Korea, and parts of China. However,
Brugia timori is only restricted to Timor Leste and a few islands in Indonesia
(Michael,2000)

Figure 1.1
-
Wlllld 11e11111 The bomdories and mmes "-llldtlle desillllllions used on ltis mop do not inply the expression of lll1'f opilial-8
WHO 2006
AI....._ eNed lllltlan ontlleportoltlleW<IIfd-Or~...,.....,thelegll-.solllll'f<O\Ny,hrrlo!y.cityor•eaorofb-.s. · .,.~res
Clrglnl or <""'erring tile-<I b torliers or b<itnfllias. Dolled fines on mops represent -oxinl!te border lines ror ..tich flere may not jOt be ful-ment.
World endemic countries oflymphatic filariasis in 2006
DIR Source: L)mpholic Filllriasis Elinilrllion Programme M11p Productiort Nlltc He .... ~~ llldGIS C~~~trntllicable Diseases (COS) World- Org111ization
Source: http:/ /gamapserver. who. intlmapLibrary/ app/searchResults. aspx
2

Lymphatic filariasis is a major cause of permanent disability and disfigurement in the
endemic areas. The areas endemic for this disease are underdeveloped and poor,
hence it is known as the disease of poverty. Most often, young children get infected
before the age five and it takes years before the infection can be clinically detected.
Besides, the infection also has serious clinical eonsequences for pregnant women and
infants. Once infected, the disease will slowly develop and the patient may suffer
from disfiguration with swelling of the limbs and breasts (lymphoedema) and
genitals (hydrocele), or swollen limbs with dramatically thickened, hard, rough and
fissured skin (elephantiasis) This scenario will prevent the patients from
experiencing normal working and social life because of physiological consequences
and obvious physical handicap. As a result, this will lead to economic instability due
to loss of manpower and decreased productivity which will aggravate the cycle of
poverty (http://www.{ilariasis.org).
1.1.2 Transmission and life cycle
There are three lymphatic filaria that infect human namely Wuchereria bancrofti,
Brugia malayi and Brugia timori. The disease is being transmitted to human by the
bite of more than 70 species and subspecies of mosquitoes mainly Anopheles, Aedes,
Culex and Mansonia; hence it is referred to as a vector-borne disease (Stone et al.,
1959; Nanduri and Kazura, 1989). The three lymphatic filariae have similar biphasic
life cycle where larval development takes place in mosquito (intermediate host) and
adult development takes place in the human (definitive host). Basically, there are
four different stages of the life cycle of lymphatic filaria as depicted in Figure 1.2.
3

Moequlto Stages
. ... t1buvae
\ •
M~rile SMd shMChs, ~,.. .. n'IO$QUito .. midgut, afld m9,.... eo tl1oraQc niU!8dM ....,
A." lnfee!We ~ A= Olagn<J$tie &age
Brvgla malay/
O Mosquito 1<Ns abbxlmeal
tl.31a11We- slun)
Figure 1.2 The life cycle of B. malayi
4
Human Stages
8 Adulla produce aheeChed tniir:rolllarlae the! read! tile blood~ c!J •
Source: www.dpd.cdc.gov/dpdx

Mosquito ingests microfilariae as part of its blood meal. Within a few hours, the
microfilaria penetrates the mosquito gut wall, migrates to the flight muscles and
molts to the second larval stage (L2). The L1 and L2 molt takes place between days 6
to 10 depending on the environmental conditions. After several days, the parasite
undergoes an additional molt to the L3 parasite. The L3 then migrates from the flight
muscles to the mouth parts of the vector, where they are positioned to be passed on to
the vertebrate host during a subsequent blood meal (Scott, 2000).
Infection is initiated by the deposition of the third stage larvae (L3) on the skin of
human host following a bite by an infective mosquito. In the definitive host, the
larval undergo an additional molt to the fourth larval stage (L4) between days 9 and
14 post-infection as they mature into the lymphatic-dwelling adult male and female
worms to complete the life cycle. Adult female parasites can remain reproductively
active for more than 5 years. The lymphatic-dwelling filariae are diecious and
undergo ovoviviparous reproduction resulting in the release of fully formed, sheathed
first stage larvae (L1 of micro filariae) from the female. Then, the micro filariae enter
the peripheral circulation of the human host where they are available to be ingested
by the vector during a blood meal (Scott, 2000).
The unique characteristic of the microfilaria (mf) stage of the parasites is that they
have "periodicity" that restricts their appearance in the blood to only certain periods
of the day. In general, the micro filariae can be classified into two main groups based
on their circadian rhyihms; i) the noctural periodic strain, ii) the nocturnaly
subperiodic strain. In the nocturnally periodic strain, they virtually disappear from
the peripheral circulation and are found predominantly in the blood vessels of lungs
5
and deep tissues during the daytime. Conversely, during the night time (especially
between 10 pm until 2 am), the micro filariae can be found in the peripheral blood.
Meanwhile, for the nocturnally subperiodic strain, the mf is present in the blood both
day and night but the density is much more higher during the night and tend lose
their sheath in the process of dying on microscope slides (Bowman et a/., 2002). In
addition to this basic strain, there is also nonperiodic or diurnally subperiodic strain
of mf found in the South Pacific where it is transmitted mainly by day-biting
mosquitoes of genus Aedes (Nanduri and Kazura, 1989).
In Malaysia, the predominant strain is the nocturnal subperiodic B. ma/ayi. Due to its
predominant appearance in blood at night, conventional diagnostic method is by
microscopic examination of night bl~od. Studies of Wuchereria and Brugia species
suggested that their periodicity is due to the difference in the oxygen tension between
the arterial and venous blood in the lungs (Hawking and Gammage, 1968; Burren,
1972; Nanduri and Kazura, 1989). However, Wang and Saz (1974) suggested that
these parasites have adapted their periodicity to the vector feeding behavior, possibly
to facilitate their transmission (Nanduri and Kazura, 1989).
1.1.3 Brugia malayi
Brugian filariasis is caused by Brugia malayi infection and it is endemic in parts of
India, China, Indonesia, Philippines, Thailand, Vietnam and Malaysia (WHO, 1998).
This species was first identified by Lichtenstein and named by Brug in 1927. The B.
malayi species is classified under the family of Filariidae and the genus of Brugia.
The distribution of B. malayi is very similar to that of W bancrofti. However, the
6

differences between W bancrofti, B. malayi and B. timori reside in their
epidemiology, vectors, reservoirs, symptoms, but mainly the species morphology.
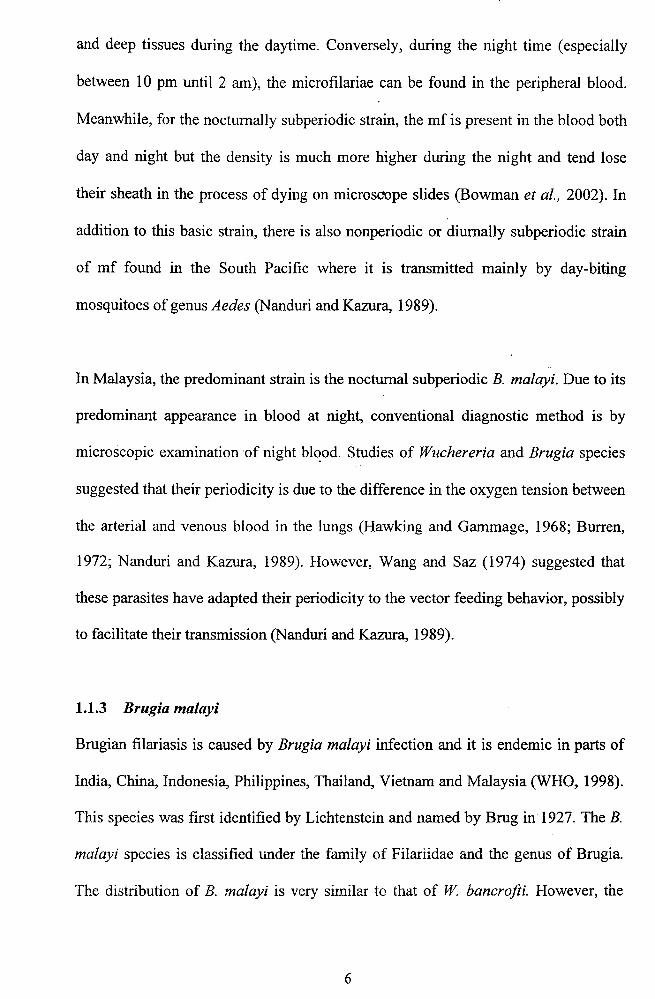
The brugia female worm measures 43 to 55 mm in length by 130 to 170 !J.m in width,
and male worm measures 13 to 23 mm in length by 70 to 80 /lffi in width. Adult
worms produce microfilariae, measuring 177 to 230 !J.m in length and 5 to 7 !J.m in
width (Figure 1.3), which are sheathed and have nocturnal periodicity
(http://www.dpdcdc.gov). The adult male and female worms of B. malayi inhabit
primarily the lumen of lymphatics whereby the microfilariae usually migrate from
the lymphatics into the blood stream (Nanduri and Kazura, 1989).
In Malaysia, the mam species of parasite causmg lymphatic filariasis are the
subperiodic strains of B.malayi. This parasite is principally transmitted by
mosquitoes belonging to the species Mansonia bonneae, M dives, M uniforms and
M Indiana (Chang et al., 1991; Kwa, 2008). Generally, brugian filariasis leads to
symptoms and manifestations that may include recurrent fever, lymphatic damage,
renal damage, adenolymphangitis, lymphoedema, elephantiasis and pulmonary
disease. However, the infection is usually limited to legs below the knee and upper
limbs distal to elbow.
7
¥'
• • . ... ;,-.q -...-..-
,; ' ' ~ j ""
Figure 1.3 Microfilaria of Brugia malayi
Source: http://www.dpd.cdc.gov/dpdx!HTML!ImageLibrary/Filariasis il.htm
8

1.1.4 Clinical manifestation
In areas where LF is endemic, majority of the infected individuals fall into the
following categories: asymptomatic amicrofilaraemia, symptomatic microfilaraemia,
asymptomatic microfilaraemia, acute infection with filarial fever and
adenolymphangitis (inflammation of the lymphatics and lymph nodes), chronic
elephantiasis and occult filariasis. Asymptomatic amicrofilaraemia individuals are
the infected persons who do not exhibit any physicals symptom and has no
circulating microfilaria. Microfilaraemic individuals are those with microfilaria
circulating in their blood, and they may have symptoms (symptomatic) or have no
physical symptom (asymptomatic). Individual with acute symptoms may experience
fever, chill, malaise, headache and vomiting. However, lymphoedema is the worst
clinical manifestation of lymphatic filariasis and the chronic stage of lymphoedema
is elephantiasis.
The clinical manifestations of LF vary from one endemic area to another and also
differ to some extent on the species of the parasite. For example, in parts of Africa
where bancroftian filariasis is prevalent, the most common clinical form of the
disease is hydrocoele while tropical pulmonary eosinophilia has been reported most
commonly from the India subcontinent and Brazil. Meanwhile, it is recognized that
inguinal lymphadenitis and lymphangitis are more common in brugian filariasis with
the exceptions of genital disease (hydrocoele and filarial scrotum) (Kumaraswami,
2000).
9

1.1.5 Diagnosis of lymphatic filariasis
The diagnosis of brugian LF caused by B. malayi and B. timori can be performed
using conventional laboratory methods such as thick blood smear technique, DNA-
based laboratory assay using the PCR technique, ultrasonography and
immunoassays. For thick blood smear technique, a drop of blood is spread onto the
slide, dried, stained and examined under the microscope for the presence of
microfilariae. This method is insensitive for active infections; it misses people ·with
low mf counts and those with amicrofilaremic infections; these individuals have the
potential to contribute to future transmission. In addition, night blood collection is
troublesome to both the staff and villagers and impractical in some endemic areas I
(Weil and Ramzy, 2006). The sensitivity of this technique can be improved by
membrane filtration of 1-5 ml of blood prior to microscopy.
Molecular diagnostics by PCR is available for LF diagnosis. The main obstacle with
the PCR method is that it requires sophisticated laboratory equipment and trained
personnel to perform the analysis; and requires several hours to obtain the results.
Thus, it is not practical to be used with large number of samples and for field
screening. In addition, PCR generally do not detect people with amicrofilaraemic
infection and still requires night blood smear for maximum sensitivity.
Ultrasonography, the detection is based on 'filarial dance sign' which refers to live
adult worm inside the lymphatic vessels. Other than not suitable for large scale
studies, it is not very useful for brugian filariasis in which the adult worms are not
found in the peripheral lymphatics.
10

Immunoassays detect the presence of specific antigens or antibodies in the blood of
individuals. Antigen detection assay is not available for brugian filariasis. With
regard to detection of specific antibodies, it was recognized that the elevated levels
of IgG4 is a marker of active infection rather than past exposure and it does not
cross-react with antigens from non-filarial helminthes (Lal and Ottesen, 1988; Kwan-
Lim eta/., 1990; Turner et al., 1993; Haarbrink eta/., 1995; Chanteau et al., 1995;
Terhell et al., 1996; Rahmah et al., 1998). To date, there are two commercialized
rapid tests for diagnosis of brugian lymphatic filariasis which is based on detection of
anti-filarial IgG4 antibody test namely Brugia Rapid™ and PanLF Rapid™. The
latter is for detection of both brugian and bancroftian filariasis and also employs the I
BmR1 recombinant antigen.
1.1.6 Elimination of lymphatic filariasis
In 1997, the WHO advocated the global elimination ofLF as a public health problem
and targeted to eliminate the disease by the year 2020. In conjunction with this, three
years later (year 2000), the Global Alliance to Eliminate Lymphatic Filariasis
(GAELF) was formed with the sole purpose of supporting the Global Programme to
Eliminate Lymphatic Filariasis (GPELF). This programme aims to eliminate LF by
interrupting the transmission of infection and to alleviate and prevent both suffering
as well as disability caused by the disease.
(flttp:l/www. filariasis. orglresources/ globalalliancehistory. htm).
In order to interrupt the transmission of the infection, the entire 'at risk' population
must be treated for a period long enough to make sure that level of microfilariae in
the blood remain below that necessary to sustain transmission. In this case, a single
11

dose of two drugs regimens has being advocated ( albendazole 400 mg plus
diethylcarbamazine (DEC) 6 mg/kg, or albendazole 400 mg plus ivermectin 200
11g/kg) for a period of 4-6 years corresponding to the reproductive life span of the
parasite (Ottesen, 2000).
In addition to alleviate suffering and decrease the disability caused by LF disease, a
principal strategy focuses on decreasing the secondary bacterial and fungal infection
of limbs and genitals whose lymphatic function has already been compromised by
filarial infection, since secondary infection is the primary pathogenetic determinant
of worsening lymphoedema and elephantiasis (Ottesen, 2000). I
The importance of mapping and surveillance studies is to identify endemic areas so . . that repeated cycles of mass drug administration (MDA) can be performed in order to
reduce both infection prevalence and transmission rates to levels below those
required for sustained transmission (Ottesen et a/., 1997; Molyneux, 2001; Ottesen,
2006; Weil and Ramzy, 2006). To this end, sensitive and specific field-applicable
diagnostic tools are required for mapping the distribution of the disease and
monitoring various phases of the program. Many endemic areas for LF are remote
and have poor access to well-equipped laboratories, thus a rapid and field-applicable
diagnostic test is important to ensure that it can be performed easily by field workers
while at the same time gives reliable and reproducible results. Furthermore, an
important technical consideration to ascertain the success of this programme is the
need for sensitive tests which obviates night blood sampling for proper mapping and
surveillance exercises after the cessation of the mass-treatment (Ottesen eta/., 1997).
12

1.1.7 Brugia Rapid™
Brugia Rapid™ is a dipstick test format that utilized BmRl recombinant antigen for
the detection of brugian filariasis. This rapid test is based on the significantly
elevated level oflgG4 antibody in active infection (Rahmah et al., 2001b, 2003b). In
this test, the anti-filarial antibodies in patient sera will react with this antigen,
followed by binding of this complex with monoclonal anti-human IgG4 conjugated
to colloidal gold. Thus, samples containing anti-filarial IgG4 antibodies that re~ct
specifically to the antigen will result in the appearance of a purple-reddish colour at
the test line (Rahmah eta/., 2003b).
Previously, this test was performed in an ELISA format known as Brugia-ELISA.
Evaluation studies on this test demonstrated the specificity rates of 95.6-100%, the
sensitivity rates of 96-100%, the positive predictive values of 75-100%, and the
negative predictive values of 98.9-100% (Rahmah eta/., 200la). However, since this
test is more suitable for laboratory rather than field usc, therefore the format of the
test has been further developed into a rapid immunochromatographic dipstick test
and cassette format, which later was named as Brugia Rapid™ test. This new format
is easy to perform, rapid and robust. Most importantly, it does not require any night
blood sampling and does not need any laboratory facilities; make it useful for field
work in remote areas.
Evaluation studies of this test have been performed to validate the sensitivity and
specificity of the rapid test which involved both endemic and non-endemic areas of
filariasis. The results showed 97% sensitivity, 99% specificity, 97% positive
predictive value, and 99% negative predictive value (Rahmah et al., 2001 b; 2003a).
13

In the past, the mapping activities for LF endemicity has been hampered by the lack
of data on the geographical distribution of levels of infectious or disease (Micheal
and Bundy, 1997). With this regard, other than for patient diagnosis, this assay is
very useful for mapping of endemic areas, and surveillance post- mass treatment
towards helping to achieve the goals of the Global Elimination Program for
Lymphatic Filariasis (GPELF).
1.2 E. coli fermentation
1.2.1 History
In the 19th century, interest in microbial fermentations has received great attention I
when people started to realize the potential use of microbes especially in the
production of drinks and dairy products. E.coli has been the most widely used
prokaryotic host because it is well characterized in terms of its molecular genetics,
physiology, and expression system (Makrides, 1996; Choi and Lee, 2004), and thus
was the pioneer organism for large scale fermentation studies. Since early 1970s,
growing E. coli to high densities has been the subject of numerous studies where
initially it was focused on high cell density growth of E. coli to investigate the limits
of bacterial growth in liquid culture and to obtain large quantities of exponentially
grown E.coli needed for biochemical studies (Choi et al., 2006). Besides E.coli, the
use of microorganisms such as Pichia pastoris (Stratton et al., 1998), Saccharomyces
cerevisiae (Lee et al., 1994), Candida brassicae (Yano et al., 1985) and Bacillus
subtilis (Park et al., 1992) are very commonly grown to hi'gh cell density using
fem1entation methods. However, growing E. coli to a high cell density culture has
become the method of choice for the production of recombinant proteins mainly
14

because of the high volumetric productivities associated with this method (Choi et
al., 2006).
Large scale fermentation in the fermenter has the added advantage of increased cost-
effectiveness, enhanced downstream processing, reduced wastewater, lower
production cost and a reduced investment in equipment (Choi et al., 2006). The
development of this technique for E.coli has facilitated the production of
recombinant proteins and non-protein biomolecular products such as amino acids,
primary and secondary metabolites with high productivities (Jeong and Lee, 1999;
Gerigk eta/., 2002; Mijts and Schmidt-Dannert, 2003; Jeong et a/2004; Choi eta/., I
2006). Considering the commercial potential of a synthetic human IL-lra, Zanette
and co-workers (1998) has highlighted the economical process for the production of
this cytokine in a 50L scale fermentation process of E.coli. Such similar study also
has been demonstrated by Yazdani and co-workers (2004) for the production of
recombinant malarial antigen, PvRII in E.coli in lOL culture volume. In addition,
Janardhan and co-workers (2007) has established the production of WbSXP-1
recombinant protein for diagnostic application in lymphatic filariasis.
The increasing industrial demand for robust fermentation control requires improved
strategy to increase the production of the target product. In an effort to further
improve the fermentation technique, the · principal strategy focuses on the
development of growth medium, culture conditions and nutrient feeding strategy.
15

1.2.2 Characteristics of E.coli
E.coli is a Gram negative bacterium which does not produce endospores in response
to starvation conditions (Rinas et a!., 1995). It is generally grown under aerobic
conditions because anaerobic growth provides less energy for metabolic processes
such as protein synthesis (Xu et a!. 1999; Manderson et a!. 2006). There are four
different phases in E. coli's growth namely lag, log, stationary and death phase. At
each phase, E. coli has different morphological state and the medium has different
condition in terms of nutrient availability and levels of inhibitory by-product. When
the bacteria first enter into a new culture medium, the cells will take time to adapt to
the new environment. Consequently, the slow growth is observed during the lag I
phase as there is no or very little cell division. Conversely, in the log phase, there is a
rapid exponential growth of the cells whereby nutrients are metabolized at its
maximum speed until one of the nutrients is depleted and starts limiting the growth.
The rate at which cells grow during this phase is known as the growth rate (k), and
the time it takes for the cells to double is known as the generation time (d). However
the cells start to reduce their metabolic activity as a consequence of depleted
nutrients during the stationary phase, where the rate of cells dividing is equal to the
rate of cell death. When the cells are unable to resume division and cannot survive
the harsh conditions caused by few nutrients availability and too much toxins, the
cells start to die which result in a decrease in the numbers of cells within the system.
Synthesizing recombinant protein at the beginning of the culture may not be
advantageous because many proteins are sensitive to proteases, thus an early protein
production will increase to proteolytic degradation before the final harvest (Aucoin et
a/., 2006) and can unnecessarily slow down the doubling time of the bacterial cells
16

(Manderson et al., 2006). Converse! y, induction at the stationary phase reduces
culture viability and could lead to production of proteases which can breakdown the
desired recombinant protein (Chisti, 1998; Corchero et al., 2001; Manderson et al.,
2006). Therefore, the recombinant protein production is generally induced at late
exponential growth phase, where the induction at this stage will promote
exponentially grown cells to express the target protein.
E. coli cells consist of inner and outer membranes that divide the organism into three
compartments; the cytoplasm, the periplasm and the extracellular space where the
recombinant proteins can be targeted to one of these compartments (Choi et al., I
2006). However, many research group have focused on the secretory production
system to target the recombinant protein productio? into the periplasmic space (Choi
and Lee, 2004; Choi et al., 2006) based on some exclusive characteristics. One of it
is because periplasmic space is known to have less protease activity which in tum
would maintain the stability of the protein by prevention of proteolytic degradation.
In addition, the purification of the target protein could be more simplified as the
periplasmic space contains less native host proteins (Choi et al., 2006).
As a whole, the unique characteristic of recombinant E. coli as an. economical host,
coupled with the advent technology in recombinant DNA and large-scale culture
processes has enabled high production of therapeutic proteins such as insulin,
antibiotics, hormones and specialized proteins such as antibodies at industrial scale.
In this case, Ouelette et al. (2003) reported that 10 mg/1 of human rhiL-7 was
successfully achieved in 1000 L batch culture of E.coli HMS174 (DE3). In the
17

production of TGF-a-PE40 (a candidate anti-tumor agent), Lee and co-workers
(1997) had successfully obtained 950 mg/1 ofTGF-a-PE40 in 800 L fermenters.
1.2.3 Fermenter
The common types of fermenter used for industrial fermentation are the stirred-tank
fermenter (STF) (Knorre et al., 1990), air-lift fermenter (ALF) (Holst et al., 1997)
and dialysis reactor (Nakano et al., 1997) (Riesenberg and Guthke, 1999). However,
the most frequently used for industrial application, especially in the pharmaceutical
industry, is the conventional mixing vessel STF.
Commonly, the STF (Figure 1.4) is fitted with baffles to prevent a large central
vortex being formed and improve mixing by breaking the liquid flow. For an
efficient mixing, high turbulence is required; hence this is created by the vortex field
which forms behind the blades. The sparger located underneath the disk allows all
the gas to flow through into the fermemer. Furthermore, the temperature in a vessel
can be controlled by removing heat by means of water circulating through a jacket
outside the vessel.
18

Figure 1.4
steam inlet
food 1nlet
cold water--··-jacket
i ' -:-motor
steam --:== Ol:tlet
! l r;:::.========t==:!~ exhaust
outlet
har.test !!ne
- ---.:-- - -; cold ·waler outlet
I baffle
Schematic diagram of a stirred tank fermenter (STF)
Source: www. biotopics. co. uk/edexcel/penicl.html
19

In fed-batch fermentation, monitoring and controlling the running process can be
assisted with the presence of software. In this study, a 5 L fermenter (Biostat B5, B.
Braun International, Germany) was used to carry out the whole experiment. This
stirred tank fermenter is equipped with data acquisition and automated feeding
system controlled by the Multifermenter Control System Software (MFCS) supplied
by B. Braun International, Germany, which allows monitoring and control of
substrate feeding into the culture and other fermenter operating variables. The B.
Braun's DCU was used as a front-end controller and a PC was connected to the
MFCS-Win computer via a local network to enable data exchange via a software
interface. The fermenter is also equipped with important control modules such as I
probes for temperature, pH, dissolved oxygen (DO) and pumps for feeding of the
substrate to the culture. The probes provide direct measurements of temperature, pH
and dissolved oxygen concentration during the cultivation process. Figure 1.5 shows
the example of instrument set-up for a typical fermentation process.
20

rr======= ======== === 1 1 peristaltic
microcomputer ·: : pump
1~0RPM ?.roRauE me asunng
&a.a head 00000 00000
D II II II
'--+--=....e,_,_._+-F;-::-o-=- sterile II
I.=. CIID~= = ::::!J
( lb'#R I •/1 '«@%' \
bioreactor peristaltic
pump
Figure 1.5 Instrument set-up for fed-batch fermentation
21
atr
on-line rheometer

1.2.4 Mode offermentation
Protein production in E.coli can be increased significantly through the use of large
scale cell cultivation performed in fermenter. There are four main modes of
fermenter operation namely batch, fed-batch, repeated batch and continuous
fermentation.
1.2.4.1 Batch fermentation
In batch cultures, all substrate components are added initially, except for oxygen and
pH-controlling agents. Typically, cells will grow exponentially until some substrate
is exhausted or the concentration of by-products becomes inhibiting. The major I
disadvantage of batch culture is the exhaustion of nutrients and substrate that may
cause the system to be retarded, thus affected the pattern of cell growth to reach
death phase quickly in an old culture.
1.2.4.2 Continuous fermentation
In contrast to the batch culture, continuous cultures are mostly operated at steady
state with an incoming substrate feed flew in balance with an outgoing flow. The
substrate feed rate is normally growth limiting and this gives a possibility to control
the cell growth at a constant physiological state and growth rate. Continuous cultures
outperform batch culture economically by eliminating the inherent downtime that is
lost for cleaning, sterilization, and the re-establishing of biomass within the
fermenter. However, contaminations represent a major problem in continuous
culture, a reason why this process is much less common than batch process m
industria] microbial fermentation (El-Mansi et al., 2006).
22

1.2.4.3 Fed-batch fermentation
In fed-batch cultures, nutrient feeding substrate is added at certain mode with no
removal of the cultures from the reactor. By adding nutrient this way, cells are
maintained under low substrate or nutrient conditions. Moreover, the production of
by-inhibitory product can be prevented by controlling the nutrient supply
appropriately. Thus, it allows growth to be prolonged where it is possible to
overcome oxygen limitation and consequently, high biomass and product formation
can be achieved (Manderson et al., 2006). For the successful large scale bacterial
cultivation via fed-batch fermentation allowing high target protein production, the
selection of nutrient feeding strategy is critical because it affects the metabolic I
pathway fluxes; therefore it affects the maximum attainable cell concentration, the
specific productivity of recombinant proteins and the formation of by-products (Choi
et al., 2006). In fed-batch operation, the initiation, processing and harvesting modes
are utilized in a single sequence, contrary to cyclic operation (repeated batch) which
involves the repetitive cycle of processing and harvesting modes.
1.2.5 Cultivation in fed-batch fermentation
In an effort to further improve the fermentation strategy, a number of studies on the
effect of growth medium, nutrient feeding strategies and culture conditions on
recombinant protein production have been carried out. Studies also have shown that
the fermentation variables such as temperature, pH, and dissolved oxygen level can
affect the transcription, translation, proteolytic activity, secretion, production levels,
and stability of the protein (Choi et al., 2006).
23

1.2.5.1 Growth medium
The most important factors that need to be considered when developing a medium
are the concentrations and the ratios of the carbon/ energy sources, nitrogen sources,
vitamins and trace elements (Riesenberg et al., 1991; Kleman and Strohl, 1992). The
composition of the cell growth medium may have significant metabolic effects on
both the cells and protein production (Jana and Deb, 2005). In general, the available
media for bacterial cultivation can be grouped into two different categories namely
defined medium and complex medium.
Defined medium is a medium in which the exact chemical composition is known. A I
defined medium that provides only the exact nutrients (including any growth factor)
needed by the organism for growth is known as minimal medium. This chemically-
defined medium is of value in studying the minimal nutritional requirements of
microorganisms, for enrichment of the cultures, and for a wide variety of
physiological studies. Therefore, use of chemically defined medium in producing
recombinant proteins is a common practice because these media attain more
consistent titres, allowing easier process control, monitoring, and simplify the
downstream recovery of the target protein (Lim and Jung, 1998; Zhang and
Greasham, 1999; Cserjan-Puschmann et al., 1999; Kweon et al., 2001). However, it
is noted that this medium is generally known to produce slower growth and lower
protein production titres as compared to complex medium (Zanette et al., 1998;
Manderson et al., 2006).
A complex medium contains some complex ingredients in which the exact
constituent of the medium is not known, such as yeast extract, blood, or casein
24