utilization of consultants by sdhpt report standard title page 1. report no. 2. government accession...
TRANSCRIPT

TECHNICAL REPORT STANDARD TITLE PAGE
1. Report No. 2. Government Accession No. 3. Recipient's Catalog No.
TX-87 /llOO~lF --
4. Title and Subtitle 5. Report Date
UTILIZATION OF CONSULTANTS BY SDHPT May 1987 .
6. Performing Orgon1 ration Code
7. Author's) 8. Performing Organization Report No.
Dock Burke, Roberto Cavazos, Alberto Garcia-Diaz Research Report 1100-lF and Kwaku Tenah 9. Performing Organization Nome and Address 10. Work Unit No. I
Texas Transportation Institute The Texas A&M University System 11. Contract or Grant No.
College Station, Texas 77843 Study no. 2cl-86-1100 13. Type of Report and Period CovfHed
12. Sponsoring Agency Name and Address September 1985 Texas State Department of Highways and Public Final - May 1987
I Transportation; Transportation Planning Division P. o. Box 5051 14. Sponsoring Agency Code
Austin, Texas 78763 15. Supplementary Notes
Research is state-funded.
16. Abstract h • - 1 T is study was undertaken to ana yze costs, quality, and policy of using consulting services by the SDHPT for preliminary or pre-construction engineering. The issue arises out of essentially non-technical grounds rather than any need for a fundamental assessment of SDHPT's performance and policy. Briefly, the amount of preliminary construction engineering work being contracted to consultants rose from $9.2 million in FY 1980 to $36.97 million in FY 1986. This was principally caused by an unprecedented increase in the Department's construction program fueled by both State and Federal user tax increases. To handle this peak load of work, SDHPT se-lected and utilized a number of consulting engineering firms to prepare plans, speci-fications, and estimates that historically have been done by the in-house engineering staff.
As a result of this large increase in the market for their services, consulting engineering firms are now seeking to maintain an amount of highway work that is high-er than historical levels and larger than is currently deemed necessary by the SDHPT. Although the resolution of this issue wi 11 not be accomplished herein, the results of this study will provide some useful information to help understand the implication
The essential results: 1. Cost of engineering services is lower when using State forces instead
of consultants. 2. Quality of work is similar in comparison between State forces and consul-
ting engineering firms. 3. Policy for peak load and specialty work using consultants need not be altere d.
17_ Key Words 18. Distribution Statement
19. Security Classif. (of this report) 20. Security Classif. (of this page) 21. No. of Pages 22. Price
Classified Classified 104 --
Form DOT F 1700.7 <•·••I

UTILIZATION OF CONSULTANTS BY SDHPT
by
Dock Burke Roberto Cavazos
Alberto Garcia-Diaz Kwaku Tenah
Research Report 1100-lF Research Study Number 2-1-86-1100
Sponsored by
Texas State Department of Highways and Public Transportation
Texas Transportation Institute The Texas A&M University System
College Station, Texas
May 1987

TABLE OF CONTENTS
Acknowledgements ••••••••••••••••••••••••••••••••••••••••••••••
S11mmary ••••••••••••••••••••••••••••••• • • • • • • • • • • • • • • • • • • • • • • • •
Introduction ••••••••••••••••••••••••••••••••••••••••••••••••••
Study Development •••••••• ..................................... Cost ••••••••••••••••••••• • •••• • • • • • • • • • • • • • • • • • • • • • • • • • • • • • • • •
Quality Assessment ••••••••••••••••••••••••••••••• ••••••••.• •••
Policy •••••••••••••••••••••••••.••••••••••••••••• ••••• •••• •.•··
References ••••••••••••••••••••••••••••••••••••••••••••••••••••
Appendices
1. comparability •••••••••••••••••••••••••••••••••••••••••••• 2. Quality-I ••••••••••• •••••••••••••••••• •••• •••••••••••···· 3. Quality-2 ••••••••••••••••••••••••••••••••••••••••••••• •.•.
i
ii
1
3
5
12
62
69
77
78 89 97

ACKNOWLEDGEMENT
We acknowledge and thank the following people for providing us information and assistance during this study.
From SDHPT:
Dwight Allen Joe Battle John Blaine Byron Blaschke Leslie A. Clark L. E. Clarke LeRoy Crawford Robert Cuellar Ed Davis Joel Davis Milton Dietert Thomas Doebner Robert Flaherty Phil Fredericks Roland Gamble Secundino Guitierrez Robert Hays Wayne Henneberger (retired) Jim Hodges Frank Holzmann Tommie Howell Jim Johnson
From Consulting Industry
Terry A. Anderson Marcelino z. Arredondo Murray Bass Brian S. Bochner E. D. Brady Frank C. Brogan Jose F. Cardenas Robert F. Chessir David L. Collins Jack C. Cook Terry Dartez Edward J. Davis Wallace E. Dunn Eugene C. Figg R. Craig Finley Louis Fontenot Larry Galfione William D. Gilmore James M. Goldston Charles D. Gooden Wayne Henneberger John E. Hinton John W. Hudson, Jr. William O. Jameson Glenn T. Johnson Henry o. Johnson
ii
Dolly Joseph John Kight Al Leudecke William C. Minor Bobby Myers Chuck Mylius Billy R. Neeley Wesley Pair Cliff Powers Donald Rao Billy Rogers Lyle Scarborough Frank Smith Raymond Stotzer Jon Underwood Leonard Vincek Roger Welsch Owen Whitworth Phillip Wilsdn (retired) Luis Ybanez Franklin Young Larry Zatopek
David C. Johnston Peter R. Jordan Ronald W. Kilpatrick James C. Klein Louis Koehn Bruce F. Leon Robert L. Lewis William B. London H. P. McAlister John F. Nixon J. Frank Polma Michael B. Rasbury John C. Richardson Chan Rogers John N. Spencer Thomas J. Stone John F. Stull Willard C. Teinert Perry Thompson, Jr. Harvey Treybig Robert L. Warters Phillip G. Weston John W. Wight James K. Wilhelm Phillip L. Wilson J. P. Word
SUMMARY
This study was undertaken to analyze costs, quality, and policy of
using consulting services by the SDHPT for preliminary or pre-construction
engineering. The issue arises out of essentially non-technical grounds
rather than any need for a fundamental assessment of SDHPT's performance and
policy. Briefly, the amount of preliminary construction engineering work
being contracted to consultants rose from $9.2 million in FY 1980 to $36.97
million in FY 1986. This was principally caused by an unprecedented
increase in the Department's construction program fueled by both State and
Federal user tax increases. To handle this peak load of work, SDHPT
selected and utilized a number of consulting engineering firms to prepare
plans, specifications, and estimates that historically have been done by the
in-house engineering staff.
As a result of this large increase in the marltet for their services,
consulting engineering firms are now seeking to maintain an amount of
highway work that is higher than historical levels and larger than is
currently deemed necessary by the SDHPT. Although the resolution of this
issue will not be accomplished herein, the results of this study will
provide some useful information to help understand the implications.
In summary, the essential results reported here are:
1) Costs of providing engineering services produced in-house and by consultants - our study found that the cost of doing PS&E is lower using State forces than using consultants.
2) Quality of engineering services produced in-house and by consultants - our study found that the quality of work tended to be similar in comparison.
3) Policy of using consultants for peak load and specialty work -our study found no compelling set of reasons to suggest that this policy should be altered at this time.
1

Of course, there will be differences in opinion, emphasis, and
definitions regarding the data, methods, and analysis used. Similarly each
of the findings summarized above is multi-faceted when examined in detail.
The discussion that follows examines many aspects of the costs and
quality comparisons that were the focus of the study.
2

INTRODUCTION AND STUDY APPROACH
The SDHPT is continuously monitoring and periodically evaluating the
performance of consulting firms hired by the Department to undertake
pre-construction highway engineering tasks. The Department's utilization of
consultants needs to be based on many considerations including costs,
quality of work, effective use of in-house and consultant services, the
ability of SDHPT to supervise consultants, and others. The purpose of this
study is to develop analyses, information, and data that will aid SDHPT
decision-making in deciding the best way to utilize consultants in its
preliminary engineering process.
Objectives
The objectives of this study are:
(1) Compare the cost of using consulting engineers vs. doing the work in-house;
(2) Assess the quality of work being performed by the consulting engineers vs. the work being done in-house;
(3) Assess the policy of SDHPT's usage of consulting engineers for handling peak loads and specialty jobs.
The work being reported here proceeded according to the following task
descriptions.
Task 1. Project Selection. SDHPT will assist in selection of the
projects for use in the comparison of in-house vs. consultant activities.
These projects will contain PS&E-type work that is done in preliminary
engineering.
Task 2. Data Collection. Cost and quality data will be obtained for
projects selected in Task 1. This task includes the collection and
evaluation of data concerning the use of consultants and in-house personnel
to conduct preliminary engineering activities. Data collection will be a
principal effort, since the needed data will have to be obtained from
3

several sources including SDHPT, consultants, and contractors. The overall
effort of this task will include personal interviews, written question
naires, and field visits. Data, information, and opinions from the
consulting engineering industry will be obtained.
Task 3. Data Analysis. Methodologies will be developed-to make the
comparisons of cost and quality aspects of projects done by consultants and
by in-house SDHPT engineers. Costs, direct and indirect, will be
documented, analyzed, and compared. For purposes of this study, indirect
cost will include the cost incurred for those items which have not been
identified as direct labor or direct material utilized in the performance of
preliminary engineering. More specifically, these indirect or overhead
costs relate to costs that cannot be identified in a practical manner with
specific units of production or activity and, therefore, cannot be included
in specific or direct cost as direct material or labor cost.
Where possible, project pairings will be used. Advisory panels of
experts from TTI and SDHPT will determine the most important characteristics
affecting the quality of the pre-construction engineering plans provided by
consultants and SDHPT. The data developed in Task 2 will be analyzed on the
basis of significant factors that will allow an objective analysis of the
quality of the pre-engineering work previously mentioned. Subsequently, the
quality of projects prepared in-house will be compared with the quality of
projects prepared by consultants.
Task 4. Conduct Policy Analysis. This task of the study will result
in an assessment of SDHPT's policy to utilize consulting engineering
services for peak load work and specialty jobs. Information from the
Department and the consulting engineering industry will serve as the
principal data base for this assessment.
4

STUDY DEVELOPMENT
The Chairman of the Texas Highways and Public Transportation Commission
directed that a study be undertaken to compare the costs and quality of
preliminary engineering done both by State forces and consultants. The
overall methodology used was to select projects (initially 60) that were
paired for comparison purposes. The need for comparability of projects led
to the selection of a set of comparable projects by SDHPT personnel at D-8
(Highway Design). To make a fair comparison between consultant and in-house
(State) work, project pairs, having the same or similar characteristics and
belonging to the same general project category, were chosen. The projects
compared were paired according to level of complexity evaluations made by
knowledgeable SDHPT staff.
The selection of the projects, though carried out initially by SDHPT's
highway design division, included input from the three study teams (TTI,
CTR, and E&W), SDHPT's district engineering staffs, and representatives of
the consulting engineering industry. The concept of comparability of
projects was discussed several times in meetings attended by the study team,
SDHPT and the consulting engineers representatives. In the initial selection
of comparable projects, chosen by D-8 staff, thirty project pairs were
identified; however, some exception was taken as to the comparability of a
few of these projects. Subsequent to the first round, other disputed pro
jects were removed from the data base leaving the 24 pairs used in the
study, which are listed on the following page.
The issue of comparability was pursued further by the study staff. In
the survey instrument (interview guide) utilized in the study, SDHPT
district personnel responding to the survey were queried as to how
comparable the given project pairs in their district were. These rating
5

categories were used: very comparable, comparable, similar and dissimilar.
The results of this evaluation by the districts is given below:
District II Project Pair Project Comparability
12 1 lA Similar 2 2A Dissimilar 5 SA Dissimilar
12 12A Similar
14 6 6A Similar 7 7A Similar 8 8A Very Comparable
10 lOA Very Comparable
15 13 13A Dissimilar 14 14A Very Comparable 15 15A Similar
16 16 16A Similar 17 17A Similar
18 18 18A Very Comparable 19 19A No Evaluation 20 20A Similar
20 21 21A Similar 22 22A Similar 23 23A Similar 24 24A Very Comparable
24 25 25A Similar 25 25B Similar 26 26A Similar 27 27A Similar
Although 20 pairs were deemed comparable, TTI's cost analysis has
primarily looked at 18 pairs. The projects in District 15 were all bridge
designs and were subsequently grouped into a single pairing for inclusion
(See "Project Pairings" later this section). The 18 pairs were used
because: (a) they were evaluated as similar or better; and (b) adequate
cost data were available for the in-house projects.
6

Consultant Industry Information
In addition to the above-described on the paired projects, the study
staff sought and acquired additional information from the members of the
consulting industry and the Consulting Engineering Council of Texas.
Approximately 125 consulting firms were contacted by letter and given the
opportunity to meet with the study staff or submit a written statement.
Representatives of twelve firms were interviewed in sessions of 1-3 hours
duration. Another twenty-two responded by letter. While these thirty-four
firms comprise only 27% of the contacted population (125 firms), they have
contracted about 75% of SDHPT's preliminary engineering consulting work
during the period 1980-86.
Throughout the remainder of this report, salient results from this
information will be brought to bear on the issues of costs, quality, and
SDHPT policy of consultant usage.
Studr Time Table
0 February 1986
0 March 1986
0 March 1986
0 April 1986
0 April 28, 1986
- TTI & CTR contract signed
- E&W selected from 7 candidates
- Project Coordinating Committee appointed, including John Richardson from CEC
- E&W contract signed
- Kickoff meeting of study with tri-consultants (TTI, CTR, and E&W) and coordinating committee. Identify projects, flow of study and set up schedule for data collection efforts
o Apr 28/29, 1986 - Tri-consultants met with SDHPT divisions to discuss data collection
o May 5, 1986 - Group meeting of Coordinating Committee, TriConsultants and District contact persons to explain thrust of study, the approach, time table, etc.
7

o May 1 9, 1 986 - Quality Review Committee (from 3 districts, 4 divisions) meeting with tri-consultants and Coordinating Review Committee to review triconsultants draft of quality indicators
0
0
0
0
June 4, 1986
June 30 -July 3, 1986
June 17 -July 24, 1986
July 25, 1986
- Tri-consultant questionnaires sent to applicable districts
- Meet with SDHPT headquarters divisions
- Tri-Consultants interviews with applicable districts
- Project Coordinating Committee meeting with triconsul tants to see if satisfactory data base was collected. (Problem of retrieving data prior to SDHPT use of FIMS & some software)
o July 25 - - Tri-consultants continue to analyze data and SDHPT December 31, 1986 pursues retrieval of project cost data
o Nov 4, 1986 - SDHPT expands scope of project to include Commission policy on utilization of consultants and additional input from the consulting industry
o December 8 - - Meet with representatives of consulting community January 8, 1987
o February 1987 - Submit draft copy of report to SDHPT Highway Design Division D-8
Data and Information Base
The study staff had access to many people and records to obtain
information for subsequent analysis. Principal components of this
information were as follows.
Costs. Accounting records, project ledgers, cost estimates, and other
information provided by SDHPT for the sample projects (in-house).
Consultant contracts and data sheets prepared by the consultants
on the sample projects. Additional information on overhead and
cost estimating was provided by a select few consultants during
the interview process. To be included in the comparison were
SDHPT's direct and indirect (overhead) cost for performing
8

preliminary engineering and consultant costs as well as any costs
SDHPT may have incurred as a consequence of the consultant
project.
Quality. Opinions, comments, data, and information was provided, via
interview guides, by SDHPT personnel. A special TTI panel was
assembled to analyze and critique the questionnaire data and other
information on the quality dimension of the study. Subsequent
information was provided by selected consultants and others during
the interview process. Additional information was provided by
four separate highway contractors.
Policy Issues. The consultants utilized the interview process and
written submissions to provide opinions and information on this
topic. Also, SDHPT personnel contributed similar information via
the written interview guides and subsequent interview discussions.
Comparability. The concept of project comparability has been a prime
focus of the SDHPT, the consulting engineering industry, and the
study team. At the outset, it can be agreed that no two projects
are ever exactly alike in every respect. Were that to occur, then
by definition there would be no difference in any project aspect
be it cost, quality, or whatever. The notion of comparability has
many dimensions, each which has relative merits and faults. Some
of these are:
Type of project being designed: Generally in this study there are
two categories: bridge and roadway. Throughout, we have paired
roadw:ay designs (state forces) with roadway designs (consultants).·
Similarly, bridge designs, especially in District 15, were closely
paired. Within the mix of paired projects, though, some roadway
projects also have some bridge designs, and these are not always
9

perfectly matched in the pair.
Cost/Estimated Cost to Construct: The project pairs were not
created with this dimension uppermost in the criteria. Thus,
there is some disparity in the pairings where construction cost is
concerned. This is important to note, because in the sample
projects, most of the pairs have the following characteristic: the
consultant project design has a larger construction cost than does
its SDHPT paired project.
Complexity: A qualitative indicator - project complexity - was
used to aid in project pairing. In general, complex urban designs
were paired; more simple rural roadways projects were paired;
interchange structures projects were paired; etc.
Opinions of Experts: Finally, SDHPT engineers in the field were
asked to assess the comparability of the projects paired in their
district. In this process, twenty of the original thirty pairs
were evaluated as being similar or very comparable.
Chronological Comparability: Most of the consultant projects in
the pairings have occurred relatively recently (since 1982). In
some cases, recent consultant projects were paired with SDHPT
projects more remote in time--the most extreme example is a SDHPT
project completed in 1970 that is paired with a consultant project
completed in early 1986. In this and similar instances, improved
comparability of projects was attempted by applying cost indices
to reduce the effects inflation/deflation in the project cost
items. This is further discussed in the next section.
10

Statistical Comparability: Though clearly not a perfect set of
matched projects, these pairs that remained in the data base have
been scrutinized using several dimensions, SDHPT opinions,
consulting industry representatives opinions, and study staff
assessments. To further quantify the concept of comparability,
the study staff developed an analytical procedure that establishes
the purely statistical comparability of a project pair. This
procedure determines the statistical comparability of a project
pair based on length, number of non standard plan sheets, number
of bid items and ADT (See results in Appendix 1).
11
COST
Basic Concepts of Cost Measurement
One objective of this study is to determine the cost of performing
preliminary engineering (PS&E) in-house vs. using consultants. The cost to
the SDHPT of consultant preliminary engineering services is simple to
determine. To derive consultant costs: (1) take the contract amount; and
(2) add an estimate of direct and indirect effort SDHPT expends in obtaining
and supporting the consultant's services and monitoring the consultant's
work. To obtain SDHPT's costs of performing preliminary engineering, the
study staff obtained information from many SDHPT personnel, existing
records, and expert opinions, including interpretations of SDHPT's
accounting data and record-keeping system.
Although historical costs are an important factor, they are not the
only factor useful for decision making. In fact, a Transportation Research
Board survey conducted in 1984 found that of 40 state transportation
agencies surveyed more than two thirds do not use cost comparisons to
determine whether work should be performed by in-house personnel or
consultants. Further, changes in prices for labor or raw materials may make
past labor or materials costs irrelevant. Adjustments for price differences
help restore comparability of costs through time. Nevertheless, data on
past cost behavior can be useful to illuminate future cost behavior. This
analysis utilizes recent and present data, but does not attempt to forecast
future costs. FY 1985 is the base year for most of the cost analysis
herein.
12

Assignment of Direct Costs
The direct costs of accomplishing an activity, such as preliminary
engineering, are routinely charged to that activity by the organization's
accounting system. For example, direct labor is normally charged to an
activity, using time sheets or cards. Direct material costs should also be
charged to an activity.
Assignment or Allocation of Overhead Costs
Overhead costs are more difficult to assign because they cannot be
assumed to be directly associated with a department or activity, either
because there is no obvious relationship or because the cost of analysis and
record keeping is too great.
Overhead costs typically include the cost of service, support,
administrative departments, and rental space. Many other items can best
summarized in list form:
o Operating supplies
o Repairs, maintenance and utilities
o Training costs
o Safety and OSHA supplies
o Supervision - salaries of supervisors, managers, etc.
o Technical and clerical employees
o Indirect labor - janitors, security, inventory personnel
o Overtime premiums
o Fringe benefits - FICA taxes, group life, pension, etc.
o The "opportunity cost" of using buildings which have already been paid for
o Outside services - clerical temporary employees
o Travel
13

While not exhaustive, this list contains some of the more generally accepted
components of overhead costs.
In selecting a procedure for the present study,. the two evaluation
methods used to calculate overhead costs were considered: the Effort
Related Transfer Price Method, which assigns support or service costs to a
division or department according to the amount of effort incurred, as it is
incurred. Thus, the cost of a division could be charged to a particular
project according to the number of hours it used. This method is not very
useful for the present study since such detailed data are not consistently
maintained by SDHPT. Another method, Estimated Effort Allocation, assigns
overhead costs to divisions or departments periodically, according to an
estimate of the effort incurred. This procedure requires the manager or
director of each "overhead department" to estimate the percentage of the
department's efforts during the period expended on behalf of other
departments or divisions. It is the estimated effort allocation which is
the basis for this analysis. For those SDHPT divisions where direct esti
mates were not provided, estimates were calculated by the study staff.
At the initial meeting of the study teams with the Project Coordinating
Committee, the representative of the Consulting Engineers Council told the
group that an appropriate overhead charge needed to be assigned to SDHPT
projects to facilitate comparisons with consultants' costs. Much of the
data collection, refinement, and analysis was subsequently focused on that
single issue: what is an appropriate overhead rate for SDHPT preliminary
engineering activities for use in comparing state forces with consultant
costs? In the last stage of data collection, in-depth interviews wit·h
individual engineering consultant firms reconfirmed their genuine concern
that the cost of doing business for SDHPT include the overhead amounts.
We have always known that assessing the overhead rate for SDHPT projects was
14

both crucial and very difficult. In the following section, the discussion
shows how we proceeded. For any who need it, this caveat is in order: we
did not conduct an audit.
Overhead Concept
Overhead is a cost concept that will be used to describe the value of
administrative and indirect activities that help produce the preliminary
engineering products and services by SDHPT's in-house staff. We have
attempted to capture for FY 85 all such costs that could be identified and
should be assigned to SDHPT production of in-house PS&E activities.
The concept of SDHPT overhead that is most applicable for present pur-
poses derives from the activities and expenses that support in-house, and
in-house alone, preliminary engineering. Three things must be done:
(1) identify all SDHPT expenses for all preliminary engineering;
(2) identify those support costs that would be incurred whether preliminary engineering work is done in-house or by consultants. These common costs are not to be included in either SDHPT overhead charges or consultant overhead charges;
(3) allocate the remaining expenses to the in-house preliminary engineering activities.
Systematically, each division/district was asked to provide data for the
overhead cost calculations.
This approach utilizes procedures from the cost comparison handbook
outlined by OMB in its Circular A-76 (Revised)--Performance of Commercial
Activities. There, in Part IV, the following appears:
include only those overhead costs that will not continue in the event of exclusive use of contracted-out services. (p. IV-27).
While the present study does not address the full complexity of issues
subject to the A-76 analysis, the recommended A-76 procedure to estimate
"a voidable and unavoidable costs" is analogous in concept to the task of
15

attempting to identify costs assignable to in-house engineering and plan
preparation.
Essentially, there are several SDHPT activities (e.g., motor vehicle
registration, materials testing, anti-litter efforts) that are not at all
related to preliminary engineering. These activities, obviously, should not
be included (in any amounts) in the overhead pool for preliminary
engineering. More importantly, though, there is a large number of
activities that provide support for preliminary engineering and would be +
necessary whether or not engineering planwork was done in-house.
Conceptually, these activities are similar to those identified in the A-76
analysis that will continue at the same levels in both situations, i.e., all
preliminary engineering done in-house or all preliminary engineering done by
consultants. This type of expenditure should not be included as an overhead
charge for either in-house or consultant preliminary engineering.
According to SDHPT, the following necessary support activities are
needed whether the department is doing the work with State forces or is
using consultants for PS&E:
1. Bridge design -- D-5 activities for preparation of standard design sheets, specifications, review of plan work; preparation of manuals; and processing work with railroads, FHWA, etc.
2. Highway design -- D-8 activities for preparation of standards, manuals, review of plan work and specifications; processing EIS; coordination with other agencies, advertising projects; FHWA liaison. D-18 activities including sign standards, preparation of manuals, pavement management data, plan review.
3. Planning and Research -- D-10 activities of traffic counting, traffic forecasting, map preparation, urban transportation planning and studies, coordination with FHWA, design and management of R&D activities, research implementation.
16
Calculation of SDHPT's Overhead Rate
The best estimate of the direct cost of preliminary engineering begins
with the data produced by the SDHPT which capture all direct cost (Function
Codes) assigned to preliminary engineering. This includes principally all
the project charges at the district level and those similar charges (on
bridge projects) by D-5, D-8, and D-19 (photogrammetry). This amount
represents a minimum amount of direct costs that should be included in the
base -amount.
Total in-house direct expenditures for Preliminary Engineering FY 85
were $43.95 million. Approximately 78% of the total amount expended was for
labor, as reflected in the accounts of the Project Ledgers. This labor
expense includes benefits paid to employees such as pension, insurance
premiums and other items the employees of SDHPT receive. SDHPT's finance
division (D-3) has calculated this benefit as consisting of 42% of an
employees gross salary, e.g. for every dollar paid in salary, the SDHPT pays
an additional 42 cents in benefits.
To undertake this cost comparison study, an "allocative base" must be
derived. This allocative base includes direct charges and direct labor
expenses resulting from a given activity. In this case, the labor additive
portion of the total amount of preliminary engineering expense must be
removed to obtain an allocative base. Such removal will leave direct labor,
photogrammetry, project travel, etc. -- all direct charges for preliminary
engineering.
So, we derive the labor portion (78% of $43.95 million) or $34.28
million--which.is total labor expense. As mentioned earlier this labor
expense includes a 42% labor additive which must be extracted. Using a
multiplier factor equal to:
17

42 142 = 29.57%, which shows that 29.57% of total labor expense
comprises an "additive" or overhead item. This portion needs to be removed
to derive direct labor charges for preliminary engineering, thus:
29.57% of $34.28m = $10.14m additives, which
when subtracted from $43.95m
yields $33.8lm, the allocative base.
This is essential in calculating an overhead rate for in-house preliminary
engineering to determine indirect costs assignable to SDHPT designed
projects. Note that the allocative base contains non-labor items. As noted
earlier, 78% of total direct expense for preliminary engineering is composed
of labor expense. The remaining 22% consists of other direct support.
To capture the indirect costs of preliminary engineering, the study
team sought to determine the extent of SDHPT support activities in
preliminary engineering at the headquarters, division, and district levels.
To accomplish this, the study team visited each division and interviewed the
director or assigned representative to determine the percentage of that
given division's effort/budget was for preliminary engineering or support of
preliminary engineering. The results of this data assessment follow.
D-5 Bridge Design. The amount of indirect expenses incurred by D-5 to
support in-house preliminary engineering was $82,950 for FY 85.
D-8 Highway Design. According to SDHPT's budget monitoring reports (R-
22's), virtually all of D-8's portion of 302 expenditures was expended for
support of all preliminary engineering. This would be spent as such
regardless how the PS&E was done--consultant services or in-house forces.
The amount of D-8 expenses assignable to the overhead pool for in-house
planwork was $90,000--an amount that SDHPT (D-8) expends for in-house, and
in-house alone, engineering support.
18

D-10 Transportation Planning. Initial interviews with D-10 personnel
showed that much of D-lO's expenditures (with the exception of public
transportation planning and intracoastal waterway) are in some way
supportive of preliminary engineering. Subsequent confirmation of data by
current D-10 administration established that 72% of D-lO's research
expenditure and 50% of D-lO's planning expenditure should be captured in the
overhead pool for preliminary engineering. These expenditures are not
assignable to in-house preliminary engineering. These D-10 activities are
considered necessary to support preliminary engineering, whether or not it
is accomplished in-house or through contracted consultants.
D-18 Safety and Maintenance. D-18's principal activities in support of
PS&E are traffic engineering and landscape developments. All of their
activities would remain the same for in-house or consultant preparation of
PS&E. Thus, none of these activities are assigned to the in-house overhead
pool.
D-19 Automation. D-19's estimated FY 85 amount of support for in-house
preliminary engineering was $3.3 million, principally for GADD equipment and
operations.
Additionally, Divisions 3, 4, 6, and 13 were analyzed, These
divisions, with the exception of D-6, were deemed to contribute to
preliminary engineering. D-3, D-4 and D-13 as well as D-1 (Administration)
have supportive expenditures for in-house preliminary engineering. Due to
their nature as "support divisions," their costs can be considered to be
"part of doing business" for the entire department. Thus the selected means
to calculate their support expenditures for in-house preliminary engineering
was on a pro-rata basis. According to personnel assig,nments, SDHPT's
preliminary engineering staff comprise 9.38% of all SDHPT personnel. By
extension, 9.38% of the support divisions expenditure/effort was pro-rated
19

to support in-house preliminary engineering. These amounts are:
D-1 (administrative) support amounts to,
$311,000.00, which is for supporting all preliminary planwork and
is not assignable to either in-house or consultant projects.
D-3 (finance) support of in-house preliminary engineering,
$278,000.
D-13 (human resources) support of in-house preliminary engineering,
$122,000.
The special nature of D-4's operation as a procurement agency precludes
the same pro-rata treatment of its entire operation. However, there are
certain items in D-4's budget subject to a pro-rata estimate of its
contribution to in-house preliminary engineering. These are as follows:
o Executive Administration
o Building Maintenance and Utilities
o Administration and Staff
o Upkeep and protection of building
o Mailroom, Main office
o Duplication Annex
o Duplication Camp Hubbard
The total of these activities for FY 85 was $2.93m. The pro-rata
amount (9.38%) assigned to preliminary engineering overhead is $274,480.
An important factor also to be considered in determining the cost of
in-house preliminary engineering is building use. The indirect cost of
SDHPT preliminary engineering building use is calculated as follows.
The cost of space to house preliminary engineering must be estimated
since there is no data available showing current (1985) values of SDHPT
buildings. It was assumed that state-owned space was at least as valuable
20

as leased space, so that market rates for leased space were used to
calculate an amount of indirect "costs" that should be added to the
overhead pool for preliminary engineering. Input data, acquired from D-18,
were:
1) $.80/sq ft per month is the market value of leased spaced suited
for preliminary engineering, and
2) 225 sq. ft. per person is the amount of space needed by persons
engaged in preliminary engineering in the districts.
Preliminary engineering staff at district level is 1,173 persons.
Average building use cost based on a statewide average of rented space $.80
per sq. ft/per month (includes maintenance and utilities). Thus 1,173 X 225
sq. ft. = 263,925 sq. ft. utilized by districts for preliminary engineering.
Further, 263,925 X $.80 per sq. ft.= $211,140 per month, or $2.534m per
year for space.
Information obtained from seven districts was used to estimate an
amount of support expenses in the dis~rict assignable to the overhead pool
for cost comparison of preliminary engineering activities. From this
information, two conclusions emerged:
(1) most of the districts' support of preliminary engineering would
not be changed even if all PS&E work was done by contract; and
(2) those support items which would change were principally
administrative support of design staff. Combined, these amount to
approximately 3% of the allocative base for in-house preliminary
engineering.
All of the above described data were combined as follows to produce
the overhead rate for in-house SDHPT preliminary engineering activities (FY
85). In summary, total in-house expenditure for preliminary engineering in
FY 85 was $43.95m, which had an allocative base of $33.81 mil lion. The
21

following percentages are proportions of the base which comprise the
overhead pool:
Labor additive 29.99%
D-5 .25
D-8 .27
D-19 9.76
D-3 .82
D-13 .36
D-4 .81
Building Use 7.50
District Admin. 3.21
Total 52.97%
This rate will be used to produce cost data for SDHPT projects that are
conceptually comparable to costs incurred by consultants. But, there are at
least two aspects that should be recognized right away.
First, there is no estimate for 1.egal or "insurance" costs assigned to
the overhead pool for SDHPT preliminary engineering. Lengthy discussion
with personnel in D-8, D-3, the Attorney General's Office (Highway Division)
convinced the study staff that, for at least the past 5 years, no identifia
ble legal costs have arisen due to preliminary engineering activities, e.g.,
faulty design. No dollars have been paid out in settlements or lawsuits
arising from design flaws of in-house preliminary engineering work. Thus, as
an item in overhead, this does not exist in the FY 85 calculations.
Second, although the allocative bases for SDHPT's and each individual
consultant's overhead rates are not precisely the same, existing data in
SDHPT records show that consultant overhead rates are higher than the
overhead rate for SDHPT. How does the 52.97% compare to consultant overhead
22

rates? One comparison is based on an audit done by SDHPT's Internal Review
section on 13 consultant contracts in FY 84, 85, 86. This audit showed an
average overhead rate of 128.63%. Also, another Internal Review listing of
24 consultant proposals from December 1985 through May 1986 yielded an
average overhead rate of 139.75%. Finally, SDHPT's data on the ten firms
currently doing the most business with SDHPT shows that the average overhead
rate of those ten firms is 149%.
Note on Inflation Adjustment
For four projects pairs being compared (10-lOA, 21-21A, 22-22A, and 25-
25A), the study staff concluded that the completed cost items of the earlier
projects should be adjusted to the period of completion of the more recent
project. The index utilized for the construction adjustments was the
construction component of the highway cost index provided by SDHPT. The
index used to adjust the preliminary engineering cost items was the State
government deflator calculated and reported by the U.S. Department of
Commerce.
These data are provided in the Appendix. The reader will note that the
behavior of the Construction Component of HCI went from 34.15 (est.) in 1971
to 122.64 in 1980. After it peaked, it once again fell to 109.23 in 1984.
The deflator for preliminary engineering, however, was monotonically
increasing, throughout the 15 year period under review, from 53.95 in 1971
to 157.64 (est) in 1986.
Notes from Consultant Interview Process
that:
In the interview process, consultants generally expressed the opinions
(1) an overhead rate for in-house projects must be established before cost comparisons can be attempted;
23

(2) cost comparisons of in-house vs. consultant projects would be difficult (if not impossible) to make because of different cost accounting systems;
(3) if "true" costs could be established, consultants would be no more costly and would likely be less costly in performing work similar to in-house forces;
(4) competition serves to keep consultant costs and overhead rates at low levels; and
(5) insurance costs are now one of the most significant contributors to their overhead pools.
Cost Data Used on Pr'oject Pairs
The cost data utilized in the project comparisons were obtained from
SDHPT. The consultant projects include the consultant cost and any costs
incurred by SDHPT on any given consultant project. The estimates of how
much was spent on any consultant project by SDHPT were provided by the
Department. The State costs include the total direct costs plus the direct
costs multiplied by the rate of overhead as determined by the study staff.
24

Project Pair 1 and lA
District 12
#1 CSJ 3256-2-28 - Consultant No. 1
#lA CSJ 3256-2-13 - In-house SDHPT District 3 Wichita Falls
Project lA is unique in the data set in that it was designed for SDHPT
District 12 by SDHPT District 3. Project 1 is also unique in that it
underwent a considerable change in scope from a 16 million dollar
construction job to a 25 million dollar construction job. Both projects
included roadway, structural and bridge design which according to District
12's assessment are of medium to high complexity. Both projects are
designed for existing facilities.
Both District 12 and consultant on Project 1 report having had
excellent support on the project. District 12 reported being satisfied with
the consultant's quality of work and performance. The consultant reported
that particular attention was given to insure the quality of scheduling of
this project.
The comparability of these projects was evaluated as similar by District
12.
1 & lA State Project Consultant
Start Date 6/81 9/28/84
Completion Date 5/82 N/A
#lA
$332,207 Total in-house recorded cost
As established previously approximately 78% preliminary engineering expense is labor expense. Again, the labor additive portion must be removed to obtain the direct cost base. Thus:
$259,121 Labor portion
$76,622 Labor additive
25

So, $332,207 Total recorded cost 76,622 Labor additive
$255,585 Direct cost + 135,383 Ove,rhead 52,97% of direct cost
$390,968 Total Cost
Construction cost $21,665,247 est. %PE 1.8%
Ill
Total cost of consultant project including in-house expense with overhead factor:
Consultant Cost $503,896 $90,527 $47,952
$642,375
In-house direct* In-house Overhead Amount TOTAL
Construction cost $13,703,587 est. %PE 4.7%
Overhead rate on consultant contract: 135%
*Does not include 42% labor additive.
26

Project Pair 6 and 6A
District 14
#6 CSJ 1539-01-003 - Consultant No. 6
#6A CSJ 1378-6-2 - SDHPT District 14
In this pair the state project has been constructed. The consultant
project has not been constructed. As of the date of the survey, PS&E was
underway and 90% complete. Both projects included roadway and bridge design
of medium complexity. The State design project was completed without major
incident; unfortunately, this was not the case with the consultant project.
Indeed the consultant project was subject of some controversy. The county
(Hay's) within which the project was taking place did not have sufficient
funds to purchase ROW. Property owners would not allow access, and a number
of public agencies were not responsive. Both projects involved design for a
new construction at a new location in a rural setting. Both had some bridge
design; however, the consultant project had 2 bridges (one was a special
design), and the state project had only 1 standard design bridge. Other
than the consultant's special bridge design (medium complexity), the two
jobs were considered by District 14 to be low complexity jobs. RDS and
THYSYS were used on both jobs. According to the study teams information
request, the SDHPT design team had experience with this type of design work,
whereas the consultant design team had none.
Plan development on the state job started 9/29/77 and was completed
6/10/80, with no significant delays. The consultant plan development
started 11/1/84 and was not completed as of 6/30/86. It had experienced
significant del_ays. The comparability of the projects was evaluated as
being similar.
27
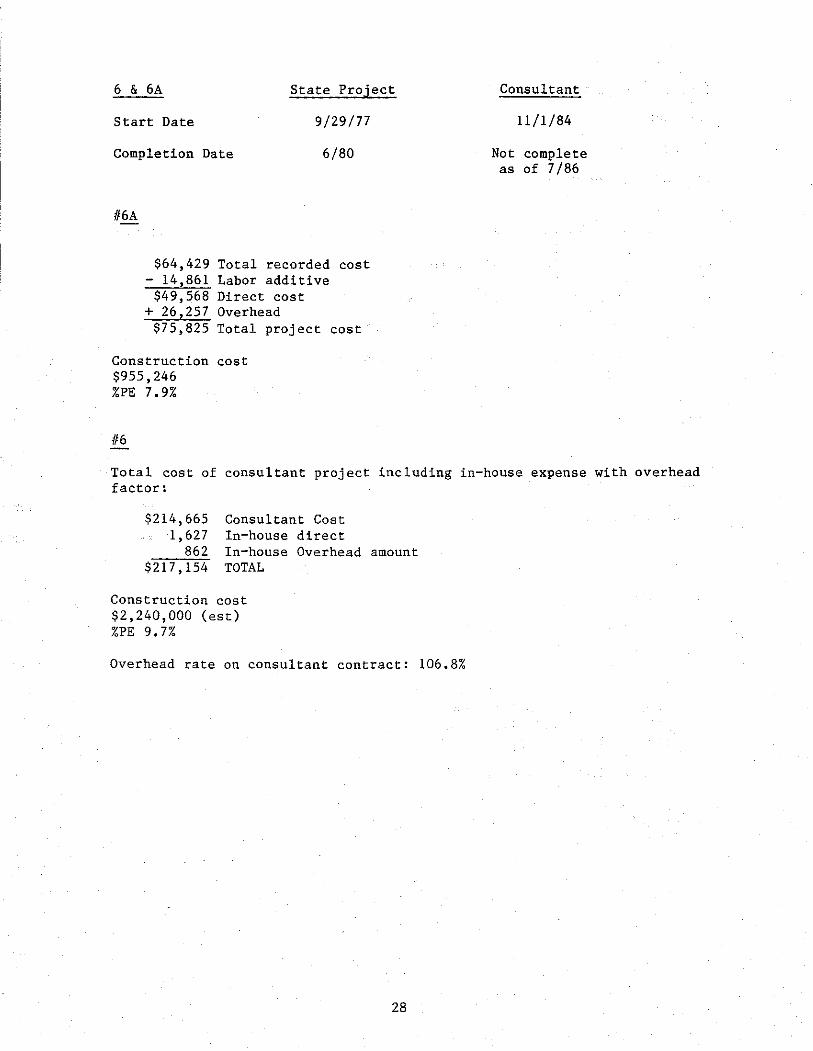
6 & 6A State Project
Start Date 9/29/77
Completion Date 6/80
ll6A
$64,429 Total recorded cost - 14,861 Labor additive
$49,568 Direct cost + 26,257 Overhead
$75,825 Total project cost
Construction cost $955,246 %PE 7.9%
116
Consultant
11/1/84
Not complete as of 7/86
Total cost of consultant project including in-house expense with overhead factor:
Consultant Cost In-house direct
$214,665 1,627
862 $217,154
In-house Overhead amount TOTAL
Construction cost $2,240,000 (est) %PE 9.7%
Overhead rate on consultant contract: 106.8%
28

Project Pair 7 and 7A
District 14
#7 CSJ 19-9-69 - Consultant No.7
#7A SDHPT District 14
The construction on the in-house job has been completed, as of survey
date 6/30/86. The PS&E as the consultant project was underway and 15%
complete. The consultant project consisted only of roadway design as
opposed to the State project, which included two bridges. Both jobs were
for new construction on existing facilities in a rural setting. According
to District 14 staff the state project was of overall low complexity. The
consultant project was, however, of medium complexity overall. The
consultant project was affected by significant delays in putting out the
design work. These delays prevented District 14 from commenting on the
consultant project in any detail.
7 & 7A State Project
Start Date 9/83
Completion Date 11/84
#7A
$72,281 Total recorded cost - 16,671 Labor additive
$55,610 Direct cost + 29,456 Overhead
$85,066 Total project cost
Construction cost $1,302,313 %PE 6.5%
29
Consultant
12/17/84
N/A

117
Total cost of consultant project including in-house expense with overhead factor:
$73,899 $2,250 $1,192
$77, 341
Consultant Cost* In-house direct In-house Overhead amount TOTAL
* This project is not complete, but the contract pro-rated amount of in-house cost would be $2250. cost will be, therefore, $77,341 (est.)
Construction cost $981,000 est.
amount is $73,899. A The expected total
%PE 7.9% assuming full estimated cost is incurred.
Overhead rate on consultant contract is: 125%
30

Project Pair 8 and 8A
District 14
#8 CSJ 265-1-66 - Consultant No. 8
l/l/8A CSJ 151-9-23 IPE 447 SDHPT District 14
Projects #8 and BA both included roadway design, structural design, and
bridge design. This pair was evaluated as being comparable in all design
portions by District 14. The complexity of both projects was medium over
all. Both jobs were designed to be new construction on an existing facility
in an urban setting. There were two standard design bridges included in
each project as well as a need for traffic control plans. Each utilized RDS
and THYSYS. The State's project was completely re-designed after initial
completion of PS&E. The consultant utilized interactive graphics; the State
did not. Both consultant and State staff report having good communication
and a satisfactory working relationship.
There have been some schedule problems with the consultant project;
however, these problems have been du~ to the location of this job and
changes in scope of work. For this project, a main lane was added,
additional retaining walls were included, and more illumination added.
Since this job is local to Bergstrom AFB, coordination was required with the
U.S. Air Force and U.S. Army Corps of Engineers. Also, there was a delay by
SDHPT in final review.
8 & 8A
Start Date
Completion Date
State Project
8/1/75
3/31/81
31
Consultant
12/17/84
7/26/86

l/8A
$259,751 Total recorded cost 59,911 Labor additive
$199,840 Direct cost + 105,856 Overhead
$305,696 Total project cost
Construction cost $3,213,037 %PE 9.5%
118
Total cost of consultant project including in-house expense with overhead factor:
Consultant Cost In-house direct
$308,222 $9,003 $4,768
$321,993 In-house Overhead amount TOTAL
Construction cost $5,121,350 est. %PE 6.3%
Overhead rate on consultant contract: 130.1%
32

Project Pair 10 and lOA
District 14
#10 CSJ 3136-1-39 - Consultant No.10
#lOA SCJ 15-13-149 - SDHPT District 14
Both consultant and State designs include roadway, structural, and
bridge design--all of complex design. The location of these projects is
urban new construction on an existing facility. Both in-house and
consultant staffs are very experienced, and consequently any delays or
problems were non-engineering based.
District 14 expressed satisfaction with both its work and the
consultant's work. Consultant reports that excellent communication and
coordination was established with the District.
Overall, in both projects, all parties feel the end result was of high
quality.
10 & lOA State Project
Start Date 1973
Completion Date 4/26/76
lllOA
$665,722 Total recorded cost - 153,546 Labor additive
$512,176 Direct cost + 271,300 Overhead
$783,476 Total project cost
Construction cost $35,086,368 %PE 2. 2%
Consultant
11/5/84
11/86
Construction cost adjusted for inflation $80,445,194 Preliminary engineering cost adjusted for inflation $1,563,576 Adjusted %PE 1.9
33

lflO
Total cost of consultant project including in-house expense with overhead factor:
Consultant Cost $1,565,975 $248,859 $131,821
$1,946,655
In-house direct cost In-house Overhead amount TOTAL
Construction cost $40,000,000 (est) %PE 4.9%
Overhead rate on consultant contract: 170%
34

Project Pair 14/15 and 13A/15A
District 15
#14 CSJ-2452-2-22 - Consultant No. 14 #15 CSJ-2452-2-28 - Consultant No. 15
#13A CSJ-3508-1-1 - SDHPT District 15 #15A CSJ-3508-1-5 - SDHPT D-5
These jobs were re-combined by SDHPT into the pairing as shown to
improve the comparability of the resulting designs. Both the State and
consultant jobs are PS&E (structures) for pre-stressed I-beam grade
separations. They all were of average complexity.
Consultant Projects #14/15. Bridge structures. Average complexity. New
prestressed concrete spans on existing facility. Rated as a good project
with good communications with consultants through frequent review of
drawings. Good quality of work by consultants and completed within a short
time schedule. Good performance by minority subcontractors as well. Total
sq. footage of designed bridge deck - 223,534.
State Projects #13A/15A. Bridge structures. Average complexity. New
construction on new location. Experienced district design team and D-5
designers. Total sq. footage of bridge deck - 262,437.
Both sets of projects (state and consultants) were solely bridge design
and contained no other design activities. Combined 14/15 rated very
comparable with combined 13A/15A by SDHPT personnel.
14/15 and 13A/15A State Projects Consultant
Start Dates (Proj. 13A) 5/85 (Proj. 14) 7 /84 (Proj. 15A) 4/86 (Proj. 15) 9/84
Completion Dates (Proj. 13A) 2/86 (Proj. 14) 8/84 (Proj. 15A) 7/86 (Proj. 15) 11/84
35

lll3A/15A
$148,999 Total recorded cost 34,366 Labor additive
$114,633 Direct cost 60,721 Overhead
$175,354 Total project cost
Construction Cost $8. 96m (est • ) %PE 2.0%
1114/15
Consultant cost $207,212 20, 773
$11,003 $238,988
In-house direct cost In-house overhead amount Total project cost
Construction cost $5.97m (est.) %PE 3.9%
Overhead rate on consultant contract (Project 14): 175%
Overhead rate on consultant contract (Project 15): 123.3%
36

Project Pair 16 and 16A
District 16
#16 CSJ 255-01-043 - Consultant No. 16
#16A CSJ 86-11-26 - SDHPT District 16
These projects are fairly simple rural highway work with some culvert
structures (25 State, 53 Consultant). There is some bridge work on the
State project but this was performed by SDHPT's bridge division (D-5),
Austin. Neither project experienced major difficulties or controversy.
District 16 was very pleased with consultant work and in fact felt confident
enough to say they would recommend this consultant for future work
16 & 16A State Project
Start Date 9/82
Completion Date 3/83
lfl6A
$198,682 Total recorded cost 45,825 Labor additive
$152,857 Direct cost + 80,968 Overhead
$233,825 Total project cost
Construction cost* $3,955,720 %PE 5.9%
1116
Consultant
11/84
5/85
Total cost of consultant project including in-house expense with overhead factor:
$272,630 90,850 48' 124
411,604
Consultant Cost In-house direct In-house Overhead amount TOTAL
Overhead rate on consultant contract: 130.1%
Construction cost* $10, 714, 997 %PE 3.8%
*Construction cost for consultant project is relatively high as compared to State's project because base design utilized high cost asphalt stabilized base while the state project had flexible base design. Design processes for these alternatives should be approximately the same.
37
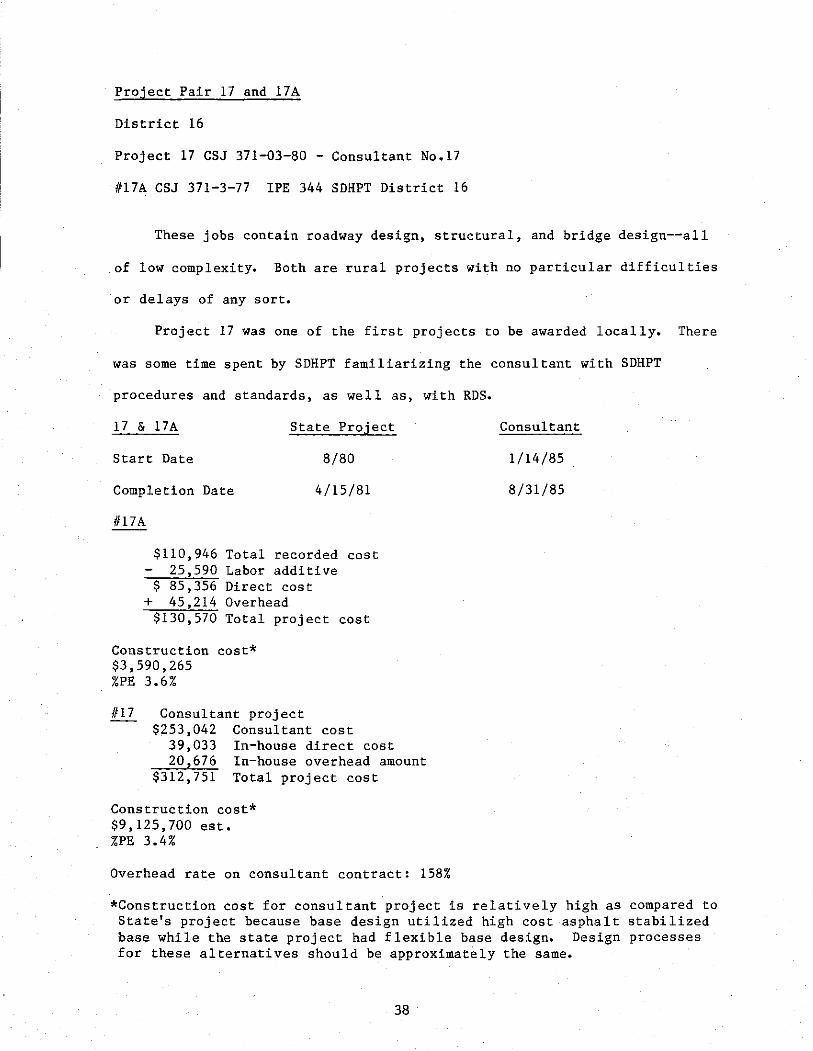
Project Pair 17 and 17A
District 16
Project 17 CSJ 371-03-80 - Consultant No.17
#17A CSJ 371-3-77 !PE 344 SDHPT District 16
These jobs contain roadway design, structural, and bridge design--all
of low complexity. Both are rural projects with no particular difficulties
or delays of any sort.
Project 17 was one of the first projects to be awarded locally. There
was some time spent by SDHPT familiarizing the consultant with SDHPT
procedures and standards, as wel 1 as,
17 & 17A State Project
Start Date 8/80
Completion Date 4/15/81
1117 A
$110,946 Total recorded cost 25,590 Labor additive
$ 85,356 Direct cost + 45,214 Overhead
$130,570 Total project cost
Construction cost* $3,590,265 %PE 3.6%
#17 Consultant project $253,042 Consultant cost
with RDS.
39,033 In-house direct cost 20,676 In-house overhead amount
$312,751 Total project cost
Construction cost* $9,125,700 est. %PE 3.4%
Overhead rate on consultant contract: 158%
Consultant
1/14/85
8/31/85
*Construction cost for consultant project is relatively high as compared to State's project because base design utilized high cost asphalt stabilized base while the state project had flexible base design. Design processes for these alternatives should be approximately the same.
38

Project Pair 18 and 18A
District 18
Project 18 CSJ 47-7-12 - Consultant No. 18
#18A CSJ 94-3-53 SDHPT District 18
This pair included bridge, structural, and roadway design of high
complexity. The complexity of the consultant project necessitated
substantial supervision by SDHPT. Both jobs are in an urban location and
involve design of new construction on an existing facility. There was some
public controversy concerning both jobs, yet only the consultant job
suffered from delays. The complexity of the pair is parallel in that bridge
design was of medium complexity and roadway design of high complexity for
both projects. The ADT in both these jobs is high and required some fancy
traffic control. According to district personnel, despite considerable
efforts, their own and the consultant's traffic management plans could have
been somewhat improved.
18 & 18A State Project
Start Date 1/81
Completion Date 6/6/83
#18A
$422,685 Total recorded cost 97,489 Labor additive
$325,196 Direct cost + 172,256 Overhead
$497,450 Total project cost
Construction cost $16,191,078 %PE 3.1%
Consultant
10/3/83
10/15/85
39

If 18
Total cost of consultant project including in-house expense with overhead factor:
$1,226,049 $74,195 $39,302
$1,339,546
Construction $39,833,648 %PE 3.4%
Consultant Cost In-house direct cost In-house Overhead amount TOTAL
cost est.
Overhead rate on consultant .contract: 134%
40

Project Pair 19 and 19A
District 18
#19 CSJ 8090-18-4 - Consultant No. 19
#19A CSJ 8076-18-2 SDHPT District 18
The in-house project has had construction completed on it; the
consultant project at the time of this inquiry had PS & E 90% complete.
These are both urban jobs of medium complexity. Both included structural,
roadway and bridge design. The design for both was for new construction on
an existing facility. The District was not able to comment on the
consultant's final plans and PS & E because they had not yet been submitted.
The District stated that from the preliminary plans they received, the
consultant's work is above average.
19 & 19A State Project
Start Date 9/78
Completion Date 10/81
lll9A
$125,615 Total recorded cost 28,973 Labor additive
$ 96,642 Direct cost + 51,192 Overhead
$147,834 Total project cost
1119
Consultant
10/28/80
12/86 (est)
Construction cost $3,200,000 %PE 4. 6%
Total cost of consultant project including in-house expense with overhead factor:
$221,689 $16,815 $ 8,907
$247 ,411
Consultant Cost In-house direct cost In-house Overhead amount TOTAL
Overhead rate on consultant contract: 124%
41
Construction cost $2,850,000 est. %PE 8.7%

Project Pair 20 and 20A
District lB
#20 CSJ 4B-l-2B - Consultant No. 20
#20A CSJ 91-5-24 SDHPT D-BG
These projects are urban new construction on existing facility designs.
The consultant job differs in that it has one bridge design and twelve
structures. The consultant project also had retaining work and some
challenging terrain to deal with. The District reports that numerous field
changes had to be made on the consultant project. Also, the consultant
project overran the original schedule by BBS days. It is the District's
assertion that the consultant underestimated the complexity of the job
during negotiations. By the same token, District lB feels that the quality
of the State plans, including traffic control, are of lesser quality than
usual.
20 & 20A State Project Consultant
Start Date l/B3 4/78
Completion Date 7/14/85 4/26/83
l/20A
$158,038 Total recorded cost Construction co·st 36,451 Labor additive $6,838,086
$121,587 Direct cost %PE 2.7% + 64,405 Overhead
$185,992 Total project cost
1120
Total cost of consultant project including in-house expense with overhead factor:
$304,191 $39,350 $20,844
$364,385
Consultant Cost In-house direct In-house Overhead amount TOTAL
Overhead rate for consultant contract: 121%
42
Construction cost $5,675,951 %PE 6.4%

Project Pair 21 and 21A
District 20
#21 CSJ 593-1 - Consultant No. 21
#21A CSJ 307-1-96 SDHPT District 20
District 20 in this case had good comments concerning both projects.
It evaluated its own project as good and the consultant project as
excellent. The delays experienced by the consultant project were caused by
railroad agreements and railroad structural review. The complexity of both
projects is low. Both are in an urban setting and consist of new
construction on an existing facility. The projects consisted of roadway and
bridge design as well as some structural design on the consultant project.
21 & 21A State Project
Start Date 7 /70
Completion Date 11/71
112 lA
$40,186 Total recorded cost 9,268 Labor additive
$30,918 Direct cost + 16,377 Overhead
$47,295 Total project cost
Consultant
11/83
1/86
Construction cost $579,824 %PE 8.2%
Construction cost adjusted for inflation $2,052,890 Project cost adjusted for inflation $134,998 Adjusted %PE 6.6%
1121
Total cost of consultant project including in-house expense with overhead factor:
$268,115 $11,922 $ 6,315
$286,352
Construction $4,042,()00 %PE 7.1%
Consultant Cost In-house direct cost In-house Overhead amount TOTAL
cost
Overhead rate on consultant contract: 170.8%
43

Project Pair 22 and 22A
District 20
#22 CSJ 28-7-43 - Consultant No. 22
#22A CSJ 8025-20-1 SDHPT District 20
These projects consisted of roadway design of average complexity.
Neither has any bridges and the SDHPT project has four structures. Again,
District 20 rated its own project a good project and referred to the
consultant project as excellent. In fact the consultant project was
considered an exceptional consultant project by District 20. Both are in an
urban location and are designs for new construction at an existing facility.
22 & 22A State Project
Start Date 12/76
Completion Date 2/77
ll22A
$136,630 Total recorded 31,513 Labor additive
$105,117 Direct cost + 55,680 Overhead
$160,797 Total project
Construction cost $2,812,000 %PE 5.7%
cost
cost
Consultant
1/85
9/85
Construction cost adjusted for inflation $5,725,720 Project cost adjusted for inflation $298,284 Adjusted %PE 5.2%
44

1122
Total cost of consultant project including in-house expense with overhead factor:
$251,871 $33,479 $17,734
$303,084
Construction $12,215,000 %PE 2.5%
Consultant Cost In-house direct cost In-house Overhead amount TOTAL
cost* est.
Overhead rate on consultant contract: 78.1%
*Project 22 (consultant's) consisted of removing 4 lanes of existing concrete roadway and replacing with 7 lanes. This paving work amounted to over $7,000,000 of the total cost and required little engineering costs since the state did pavement design and furnished standards and specifications for concrete pavement.
45

Project Pair 23 and 23A
District 20
#23 CSJ 667-2-45 - Consultant No. 23
#23A CSJ 710-2-39 SDHPT District 20
The type of design work on both these projects consisted of roadway
design work of average complexity. There were a few structures (11 State,
15 Consultant) and one bridge design (State). Both projects were evaluated
as being "good" projects by District 20 and of average overall complexity.
The design was for new construction on an existing facility in an urban
setting. Neither project was very controversial, and the delays on the
consultant project were due to utility adjustments.
23 & 23A State Project
Start Date N/A
Completion Date 5/83
ll23A
$97,451 Total recorded - 22 ,477 Labor additive
$74,974 Direct cost + 39,714 Overhead $114,688 Total project
Construction cost $2,847,463 %PE 4.0%
1123
cost
cost
Consultant
3/85
7/86
Total cost of consultant project including in-house expense with overhead factor:
$327,313 $7,204 $3,816
$338,333
Consultant Cost In-house direct cost In-house Overhead amount TOTAL
Overhead rate on consultant contract: 126%
46
Construction cost $4,500,000 est. %PE 7.5%

Project Pair 24 and 24A
District 20
#24 CSJ 389-2-36 - Consultant No. 24
#24A CSJ 932-1-58 SDHPT District 20
The two jobs were evaluated as "good" by District 20. The District
staff reported that the consultant project, the first ever in District 20,
was delayed due to their inexperience in working with consultants. The
consultant work on drainage and safety treatment could stand improvement.
The construction on the in-house project is complete. The consultant
project had PS & E 90% complete as of 1/7/86. Both included bridgework (2
State, 4 Consultant) and culvert structures (6 State, 4 Consultant) as well
as roadway design. The complexity of
24 & 24A State Project
Start Date 4/81
Completion Date 4/83
1124A
$74,023 Total recorded cost - 17,073 Labor additive
$56,950 Direct cost + 30,166 Overhead $ 87,116 Total project cost
Construction cost $1,568,764 %PE 5.6%
1124
all facets of these jobs was average.
Consultant
4/85
12/85
Total cost of consultant project including in-house expense with overhead factor:
$307,781 $9,735 $5,156
$322,672
Consultant Cost In-house direct cost In-house Overhead amount TOTAL
Overhead rate on consultant contract: 152%
47
Construction cost $8,474,586 (est.) %PE 3.8%

Project Pair 25 and 25A
District 24
#25 CSJ 2552-4-12 - Consultant No. 25
#25A CSJ 3552-4-8 SDHPT District 24
The District 24 assessed the quality of the in-house project as good;
the consultant's plans were considered to be satisfactory. According to
District staff, a great deal of guidance by State personnel was needed to
produce the consultant plans. The roadway and bridge design of both
projects is of medium complexity, whereas the structural of both is of low
complexity. The location of both these projects is an urban/rural
combination design for new construction on an existing facility.
25 & 25A State Project
Start Date 3/9/77
Completion Date 10/27 /77
ll25A
$35,959 Total recorded cost 8,293 Labor additive
$27,666 Direct cost + 14,655 Overhead
$42,321 Total project cost
Construction cost $1, 153,677 %PE 3. 7%
Consultant
3/1/84
2/25/85
Construction cost adjusted for inflation $2,156,300 Preliminary engineering cost adjusted for $72,764 Adjusted %PE 3.4%
1125
Total cost of consultant project including in-house expense with overhead factor:
$101,739 $28,332 $15,008
$145,079
Consultant Cost In-house direct cost In-house Overhead Factor TOTAL
48
Construction cost $2,803,000 est. %PE 5.2%

Project Pair 25 and 25B
District 24
#25 CSJ 2552-4-12 - Consultant No. 25
#25B CSJ SDHPT District 24
The consultant project of this pair has been paired with two separate
in-house projects. The projects are similar in every respect to the
previous pair. The State project is not particularly unique; it is a
"typical project."
25 & 25B State Project
Start Date 7 /26/79
Completion Date 2/12/81
ll25B
$41,089 Total recorded cost 9,477 Labor additive
$31,612 Direct cost + 16,745 Overhead
$48,357 Total project cost
Construction cost $1,495,183 %PE 3.2%
1125
Consultant
3/1/84
2/25/85
Total cost of consultant project including in-house expense with overhead factor:
$101,739 $28,332 $15,008
$145,079
Consultant Cost In-house direct cost
In-house Overhead amount TOTAL
Construction cost $2 ,803 ,000 est. %PE 5.2%
Overhead rate on consultant contract: 144.8%
49

Project Pair 26 and 26A
District 24
#26 CSJ 2121-2 and 3 - Consultant No. 26
#26A CSJ 2121-3-83 SDHPT District 24
The State project of this pair has been evaluated as a good project
with no difficulties encountered. Problems encountered in the consultant
project were due to delays brought about by additional work required by
FHWA. Overall and despite delays, the consultant project was evaluated as a
good project by the District 24 staff. Both projects included roadway,
bridge, and structural design of medium complexity. The type of
construction work for this project is for new construction on an existing
facility in an urban location. Overall the complexity of the State project
was evaluated as being above medium complexity, and the consultant project was
determined to be of high overall complexity. The most difficult portions of
this project pair were the bridge widenings (4 State, 3 Consultant).
26 & 26B State Project
Start Date 11/83
Completion Date 7/84
l/26A
$142,536 Total recorded 32,875 Labor additive
$109,661 Direct cost + 58,087 Overhead
$167,748 Total project
Construction cost $3,600,000 %PE 4.7%
cost
cost
50
Consultant
9/4/84
6/3/86

#26
Total cost of consultant project including in-house expense with overhead factor:
$1,403,639 Consultant Cost $54,175 In-house direct cost $28,696 In-house Overhead amount
$1,486,510 TOTAL
Construction cost $16,765,000 est. %PE 8.9%
Overhead rate on consultant contract: 124.6%
51

Project Pair Summaries
The percent that engineering costs are of construction costs (%PE) was
smaller for the in-house projects in 15 of the 18 pairs. The 18 consultant
projects were generally rated as good to excellent by SDHPT district
evaluators. Most of the in-house projects were similarly assessed as good
to excel lent.
The adjustments for inflation on some projects had the effect of more
than doubling both the construction and the engineering costs. The %PE's
didn't change very much as a result.
The lowest %PE for in-house projects was 1.8% and for consultants was
2.6%. The highest in-house %PE was 9.5%; the highest for consultants was
9.7%.
As shown in Table 1 (next page), the average %PE in-house was 2.8% and
was 4.9% for consultants. The sensitivity of this result was examined by
hypothetically reducing the state's portion of the consultant project total
charges. When the state component of the consultant's projects was
completely removed, the %PE for the consultant's average falls to 4.2%,
s ti 11 we 11 above SDHPT' s 2.8 %PE.
Finally, the size of project lOA is so large relative.to the state
forces total construction that it creates some dominance in the data.
Removing project pair 10-lOA from the data base results in %PE for
consultants at 4.9% and for state forces at 3.5%.
The composite results for the projects in the data base are summarized
in Table 1 on the next page.
52

Table ·1. Construction Costs and P.E. Costs, All Projects
Consultant
Construction
1 & lA $13,703,587
6 & 6A 2,240,000
7 & 7A 981,000
8 & BA 5,121,350
10 & lOA 40,000,000
14/15 and 13A/15A 5,970,000
16 & 16A 10,714,997
17 & 17A 9,125,700
18 & 18A 39,833,648
19 & 19A 2,850,000
20 & 20A 5,675,951
21 & 21A 4,042,000
22 & 22A 12,215,000
23 & 23A 4,500,000
24 & 24A 8,474,586
25 & 25A 2,803,000
25 & 25B 2,803,000
26 & 26A 16,765,000
TOTALS $185,015,819
PE
$642,375
217,154
77,341
321,993
1,946,655
238,988
411, 604
312,751
1,339,546
247,411
364,385
286,352
303,084
338,333
322,672
145,079*
145,079*
1,486,510
$9,002,233
Average Consultant %PE 4.9%
In-house
Construction
$21,665,247
955,246
1,302,313
3,213,037
80,445,194
8,960,000
3,955,720
3, 590, 265
16,191,078
3,200,000
6,838,086
2,052,890
5,725,720
2,847,463
1,568,764
2,156,300
1,495,183
3, 600, 000
$169,762,506
PE
$390, 968
75,825
85,066
305, 696
1,563,576
175,354
233,825
130, 570
497,450
147,834
185,992
134,998
298,284
114,688
87 ,116
72 '764
48,357
167,748
$4, 716, 111
Average In-House %PE 2.8%
Average All Projects %PE 3.9%
*Only one of these projects is included in the totals and averages.
53

Use of Cost Curves
Several state and national agencies (Consulting Engineers Council of
Texas, Texas Society of Professional Engineers, and the American Society of
Civil Engineers) publish manuals which contain several generally accepted
methods of compensating the consulting engineer for the services he
performs. These manuals include different curves of median compensation.
The curves plot the compensation for engineering services in percent versus
the construction cost of the authorized work. There are different curves
for projects of varying complexity and guidelines for applying these methods
to aid in estimating the proper amount of compensation.
As Figures 1 and 2 show, two separate curves have been used--one for
relatively larger, more complex jobs and another for relatively smaller,
less complex jobs. Although the curves are primarily used to aid in
assessing fees for contract work, their acceptance over many years also
affords a guide for judging the reasonableness of the costs of engineering
services. The plots of the values in Figures 1 and 2 are derived from the
projects in the study data set (Table 2).
As shown in Figure 1 for projects above average complexity, SDHPT forces
have noticeably lower %PE's (2.4% weighted avg.) than do consultants (5.0%
weighted avg.). In fact in only one of six projects was the in-house %PE
above the TSPE median curve. And four of the six were off the scale on the
low side. For consultants projects of above average complexity, half of the
%PE's were on or above the median TSPE curve.
For projects of average or below average complexity, the plots on Figure
2 data show about the same results for in-house %PE and consultant %PE.
Five projects of each source (in-house; consultant) are above the median
TSPE curve; seven projects of each source are below the curve. The weighted
54

Table 2. % Engineering Costs of Construction Costs
Above Average Complexity
1 lA 8 8A 10 lOA 18 18A 20 20A 26 26A
Wtd. Avg.
Average or Below Average Complexity
6 6A 7 7A 14/15 13A/15A 16 16A 17 17A 19 19A 21 21A 22 22A 23 23A 24 24A 25 25A 25B
Wtd. Avg.
and Construction Costs, by Project Complexity
Consultant In-House % PE Const. $$ % PE Const. $$
4.7%
6.3
4.9
3.4
6.4
8.9
5.0%
9.7%
7.9
3.9
3.8
3.4
8.7
7.1
2.5
7.5
3.8
5.2
4.8%
$13.7m
55
1.8% S. lm
9.5 40,0m
1.9 39.8m
3 .1 S.7m
2.7 16.8m
4.7
Wtd. Ave. 2.4%
$2.2m
.98m
S.97m
10.7m
9.13m
2.9m
4.0m
12.2m
4.Sm
8.Sm
2.8m
7.9%
6.5
2.0
5.9
3.6
4.6
6.6
5.2
4.0
5.6
3.4 3.2
Wtd. Avg. 4.3%
$21. 7m
3.2m
80.4m
16.2m
6.84m
3.6m
$. 96m
l.3m
8. 96m
3. 96m
3.59m
3.2m
2. lm
S.7m
2.9m
1. 6m
2.2m I.Sm

I-z w u 0: ..,, w
"' (L
I w L'l 0: <( I u u
"' <( C'.1
14
13
12
11
lO
9
e
7
6
5
4
--l- - - -1- - ·- ---- -- -- -1-- -- ·- .. - _. ____ , ____ ...,.__,__, __ ,_ - _, _____ , __ _,__,_,__.._,_,._,
1----1--- - - - - - -- - ---- ---· ·--i.- -- --- -r----j---1--1-1-1-11-1-+-1-----+--'1---1--11-1-J-1--1
----1 ·-- -- - - - - ·· -f-----1---1--4--\--l-1- - -1-----11---1-1--l-~-1-1-1.-1-----1---1--l.-1~1-~I
---- --- - --~ - -1- -+· ---1-l--+--1-4-1-1- - -1-----11--4-1-1-.J-l-l--1--1--l-----1----l.--l--l--l--l--~I
·----1---<-+--+-l--l-~ -P~..----1---1--1-t-t-l-lf-l-4-----J---l--f-l-1-11-l--l--1-----1----l"---1--J--l-J-1--1 ''\_
'\. •S
~-1--'-~~"'~1-f-4-1-I
-t--4-+--+-+-+----1--~rr('~~~-+-+--+-~-+-----1---1-1-1-1-1-1-1-~-1----+--4-+-+-+-+-1--1
·----'--·J--l·-l-4-'-'.,_.._,_ ___ _,_ __ ,__,....~ -t-+-l·+-+-----1---+-+--+-+-+-1-4-ll--~-+---+-+--l--+-l--I--~-~~ ~
' ---1-1--+--l-·l--l-+-l-l-l-----1---1--1-t-1t':,.,. 1--•-----1--.1---i-t--·l-l-l-l-~-----J.--'---"-"'--'-"'-•-
" ..... 4--::-............,--~11~-1--1-+-1--H-H~~-+---l--ll-+-HH-I
IC
•s
----11-- - I'- - -i-- - -i-----t--1-- -~ f- '-1-l--i-----R---1--l--+-1-l--+-1--l-----1----1--1--1--1--+-I-
'
0.01 0.05 0.1 0.5 1 5 10 •S 50 100 ts •S
CONSTRUCTION COST MILLIONS OF DOLLARS
Figure 1. Relationship of Engineering Costs (as a % of Construction Costs) to the Construction Value (for above average complexity projects)

14 ----
13 ---,_ --
. 12
t-z 11 U.J u 0: U.J 0..
10 I "'
U.J ...., L'.l 0: <1: 9 :r: u u Ui 8 <1: r:a
1
6
5
.. 0.01
-- - -- - _,__ - -- - - - ·-·- -
- ~ - - - -- - -------,_ - - _,___ -- - -- - --- ·-,_
-~ -
f--- - f- - -
•C
i "-....
" C'u • ;i>"e """' lJ
c •C ·--.... !'-. c - f-
~ !'... • s ,<
"r-. ..... • s ,p
~ ,, ,___
--. ~ ~L •S
• < h .... . .c
• t:. ... c .s • • •s .. O.OS 0.1 0.5 I 5 10
CONSTRUCTION COST MILLIONS OF DOLLARS
Figure 2. Relationship of Engineering Costs (as a % of Construction Costs) to the Construction Value (for average to belowaverage complexity projects)
1-- -L.
L
-
,_ -
-
-- -,_ ·-
--
- -
,_ '--- -
-
50 100

average %PE for in-house projects of average or below average complexity is
4.3% PE. The similar datum for consultants is 4.8% PE.
If the TSPE curves are generally correct, then it would expected that
(in the present data comparison) relatively larger projects would exhibit
relatively smaller %PE's. To check this, another assessment of the data was
made to evaluate the usefulness of the %PE in explaining the differences
between in-house and consultant engineering outcomes. The data in Table 3
show the relative sizes of construction and %PE for each of the 18 project
pairs. Thus, for example, in Project lA and 1, the in-house project was the
larger of the pair in terms of construction and it also resulted in the
smaller %PE. Examination of the data in Table 3 shows that in 11 of the 18
pairs, the larger project was associated with the smaller %PE.
Interestingly, though, in all seven cases in which a reversal of the
tendency occurs, the in-house project (though less costly) produced the
sma 11 er %PE.
Project Pair
lA & 1 6A & 6 7A & 7 8A & 8
lOA & 10
Table 3. Relative Size of Construction Costs and %PE, by Project Pairs
Larger Project in Pair Smaller %PE
State State Consultant State
State State
in
Consultant Consultant State State
13A/15A & 14/15 State State 16A & 16 Consultant Consultant 17A & 17 Consultant Consultant 18A & 18 Consultant State 19A & 19 State State 20A & 20 State State 21A & 21 Consultant State 22A & 22 Consultant Consultant 23A & 23 Consultant State 24A & 24 Consultant Consultant 25A & 25 Consultant State 25B & 25 Consultant State 26A & 26 Consultant State
58
Pair

$2.65m
$1. 75m
$875K
Consultants I
$10m $20m
CONSTRUCTION COSTS
$30m
In-House \
Figure 3. Regression Lines for Consultant and In-house Preliminary Engineering and Construction Cost
$40m

Regression Analysis
To further analyze the relationship between preliminary engineering
cost and construction cost, a regression analysis was performed to estimate
the relationship of preliminary engineering cost to cost of construction.
The results of this analysis are summarized in Figure 3, which shows that
for any given cost of construction, consultant preliminary engineering cost
tends to be higher than similar in-house preliminary engineering cost.
Additional details of this regression analysis are presented in data and
charts in Appendix 1.
Sensitivity Analysis
In addition to the analyses already discussed in this chapter, the
study staff analyzed the effects of hypothesized changes in the magnitude of
the SDHPT's overhead rate. In terms of the %PE values for SDHPT projects,
the overhead rate used to calculate project costs must be almost quadrupled
before the %PE for SDHPT projects becomes greater than that for the consul-
tant projects in this study. Importantly, the SDHPT support costs for the
consultant projects were also subject to this sensitivity analysis. Thus,
any increase in SDHPT's overhead rate also yields, ceterus paribus, an
increase in the cost of the SDHPT support provided to consultants.
Additionally, a recalculation of SDHPT's overhead rate was performed
utilizing a method that included only direct labor in the allocative
base. For example, recalculating the project cost items (using an overhead
rate based upon direct labor) for Project lA yielded the following results:
$182,499 direct labor 76,622 labor additive 73,086 other direct
$332,207 Total recorded cost
60

When the amount of "other direct" is added to the previously derived
overhead of $135,383, the newly calculated overhead costs increase to
$208,469. However, and more importantly, close examination and comparison
with the original calculations for Project lA show that, as expected, the
total project cost remains absolutely unchanged. Thus, the "bottom-line"
cost relationships (as reflected in the calculated average %PE's) still show
that the cost of doing in-house work is less than the cost of comparable
work done by consultants.
Finally, the utilization rate for SDHPT labor was examined to observe
its effects upon the cost relationships. The results showed that,
principally due to accounting procedures, different assumptions about utili-
zation rates for labor (e.g., 100%, 95%, 90%) produced minimal changes in
the total project costs. The overall results were not at all sensitive to
different assumed levels of labor utilization.
Some Conclusions on Cost Comparisons
From this part of this study these principal points emerge:
i) the comparative costs of conducting preliminary engineering (PS&E) in-house are less than costs of similar work done by consultants.
ii) overhead rates for consultants are larger than the overhead rate assignable for in-house preliminary engineering.
iii) %PE for in-house projects is lower than for consultants projects in all categories:
a) more complex projects b) average/simple projects c) all projects
61

QUALITY ASSESSMENT
The data that were analyzed, evaluated and assessed to measure the
quality of the selected projects came from four areas in the interview
guide. These areas are: (a) organization structure, personnel and size of
operations, (b) use of consulting engineers, (c) quality of work appraisal
completed by both SDHPT personnel and consultants, and (d) comparison of in
house and consultant project characteristics. [See Appendix 2 and 3].
All the seven districts interviewed unanimously responded that the
controlling factors or reasons associated with the use of consultants are
twofold: (a) lack of available work force in the districts with which to
complete programmed projects on schedule especially during peak load
periods, and (b) for extremely complex or specialized design techniques
requiring the particular expertise not available in-house (e.g. cable-stayed
bridge span; excavation, removal and disposal of toxic soils; special struc
tural or marine problems, etc.).
Regarding the usage of consultants to particular types of projects, 4
out of the 7 districts interviewed reported that they do not restrict the
usage of consultants to a unique type of project. The remaining three (3)
districts restrict the use of consultants to particular types of projects
for the second reason given in the previous paragraph. Six out of seven
Districts responded "no" to the question on the usage of consul ting
engineers for only certain activities in the preliminary engineering and
PS&E processes.
The districts interviewed establish the budgets for each in-house
project using a percentage factor of the estimated construction costs
modified by the location and complexity of the project. This factor is
based on historical data and fluctuates between 2% and 5%. All the
districts conduct quality review of both consultant and in-house work.
62

Consultant work is reviewed by the contact or resident engineer at weekly or
bi-monthly monitoring visits and also at 30%, 60%, 90% and final stages.
Thus, consultants' work gets multiple reviews. Because the SDHPT's work is
done in-house, the review efforts tend to occur more continuously or simul
taneously and are less informal than with the review for a consultant's
work. The work characteristics normally evaluated, according to responses
received, include: (a) completeness of plans, specifications and
provisions, (b) clarity of drawings or plans, (c) accuracy of computations
of quantities, (d) adherence to schedule as well as to number and nature of
supplemental agreements, (e) need and extent of in-house monitoring and
review effort, (f) thoroughness of degree of coordination with other
governmental, public and private entities, (g) meeting budgetary
requirements, and (h) instructions followed or to be followed.
Four out of the seven (7) districts interviewed think that the PS&E
prepared in-house and by consultants have approximately the same quality.
The remaining 3 districts reported that in-house work is of better quality,
as a general rule than the consultant work. Most of the districts can
fairly well control the quality of consultants' work to their satisfaction
especially if consultants are local.
Further, interviews with some SDHPT field and headquarters
(principally bridge design) personnel indicated a concern that consultant
plans tend to be over-designed. When it occurs, over-design has cost as
well as quality implications that SDHPT thinks warrant close scrutiny.
Finally, it is important to note that many aspects of quality are unknown
until construction is completed. To date, a fairly small percentage of
consultant prepared plans have been built.
63

Information on Quality from the Consulting Industry
In the interview and data collection process, several consultants
contributed information and opinions about the comparison of quality plans
done by State forces and consultants. Some of the generally held views
were:
(1) project quality is very difficult to assess and compare;
(2) plan quality done by consultants is probably superior, certainly no worse, than plan quality by in-house forces;
(3) quality will probably vary widely from consultant to consultant and range from bad to excellent;
(4) computerized techniques improve quality; and
(5) incentives in the private sector tend to produce high quality outputs.
Quality Analysis
Interview guides were used to obtain data on the quality of planwork
done on the pairs of projects in the study. Questions were developed in 17
major response areas to discern indic~tors of plan quality. District
personnel most familiar with the projects were responsible for filling out
the interview guide and discussing the quality aspects with the study team.
To perform subsequent analysis on these data, an advisory panel at TT!
was appointed and tasked to: (a) analyze the most important characteristics
affecting quality of the pre-construction engineering plans that can be
quantified; and (b) assess the quality of each of the forty-eight projects
studied. using these characteristics and the data supplied by SDHPT district
personnel most familiar with the projects.
The five-member panel used data and information from the interview
guides to select the following six variables or factors as the most
important characteristics affecting quality of pre-construction plans:
(a) completeness of plans or drawings, specifications, general and special
64

provisions (simply called "completeness"), (b) clarity of drawings,
measuring the overall legibility of plans with respect to work required
(simply called "clarity"), (c) constructability of plans measuring the
practicality and ability to understand and use of the plans, (d) accuracy of
computations, quantities and measurements on or from the plans, (e) timeli
ness measuring the ability of designers to adhere to schedule, and (f)
coordination and communication measuring the communication, responsiveness,
thoroughness and degree of communication between the SDHPT, consultants,
other governmental, public and private entities. In addition, the Advisory
Panel assigned weights to each variable or factor in accordance with how
much they consider the variable or factor to contribute to quality in
general or how those factors affect the quality of a project being
evaluated.
Quality Evaluation
The TT! Advisory Panel, after determining the quality characteristics
and weights, was asked to assess or evaluate the quality of each of the
forty-eight projects using the data provided in the interview guide from
each of the seven districts. Evaluation forms (presented in Appendix 2)
were designed for use by the panel to evaluate the projects.
Comparison of In-House and Consultants' Quality of Work
Statistically based procedures were used to analyze the data used by the
Advisory Panel. The input and all output data from the statistically-based
procedures used are as found in Appendix 2. Tables 3 and 4 summarize the
correlation factors and standard deviations for the quality characteristics
identified by the panel using the procedure previously described. Tables 5
and 6 provide correlation factors as well as the means and F-ratio,
65

respectively for the same characteristics using an analysis of variance
procedure. Incidentally, the correlation factors produced by both
procedures are the same. Close observation and evaluation of the outputs in
Tables 4-6 in Appendix 2 yield the following evaluations:
(a) The quality variables or characteristics by themselves for both
in-house and consultant outputs perfectly correlate positively (i.e. the
existence or increase of one entails the existence or increase of the
others);
(b) Correlation between timeliness and clarity, completeness and
clarity, as well as constructability and timeliness for the SDHPT project
analysis produce correlation factors of .39, .39 and .48 respectively -
lowest among the group and less than .S;
(c) Correlation between accuracy and timeliness for the consultants'
analysis produces a factor of .59, the lowest among that group;
(d) Quality characteristics for the consultants' are slightly higher
correlated than the SDHPT's;
(e) The quality of work by both in-house and consultants are
approximately the same both in total and by districts; and
(f) Mean values for timeliness and communication are slightly lower
than the remaining quality characteristics.
Synthesis of the above evaluations produces the following general
observations:
(1) the variables or factors chosen by the panel actually contribute
to quality;
(2) the SDHPT, on the whole, is generally pleased with the quality
of the consultant's work since most of consultants' work
favorably compares with that of the SDHPT; and
66

(3) in general, the quality of consultants' work is considered good
but lack of communication, coordination or responsiveness and the
performance to schedule caused some concern and influenced the
overall evaluation of the consultant's quality performance.
Contractors' Opinions on Quality
To broaden the quality assessment, members of the study staff decided
to interview three highway building firms in the Houston area. At a later
time, at the suggestion of SDHPT, a fourth contractor located in San Antonio
was interviewed. The three contractors in Houston were directly contacted
and interviewed in person. The fourth contractor was contacted by telephone
and interviewed by a member of the study staff. The primary objective of
these interviews was to obtain from the contractors' objective appraisals of
the quality of SDHPT preliminary engineering work and consultant preliminary
engineering work. All of the contractors were candid; generally, their
thoughts on the quality issue were fairly uniform, with some minor
differences.
Overall, the contractors said that whenever there were any problems
with consultants' work it was not because of incompetence or low quality work
but usually attributable to a lack of familiarity by the consultant with
SDHPT procedures and specifications. Communication problems between consul
tants and SDHPT were commonly cited as a source of problems. The contractors
said that working with consultants who had good rapport, knowledge of what
they were supposed to do, and experience with SDHPT procedures was
indistinguishable from working with SDHPT.
Conclusions on Quality
The following are the conclusions drawn from the analysis, synthesis,
evaluations of the data obtained from study:
67

1. most of the responding districts indicated that the use of
consultants was seen as desirable in handling (a) peak work loads to meet
programmed schedules, and (b) specialized or complex jobs that the
department cannot handle in-house.
2. consultants seem to be doing good quality work and favorably compare
with the SDHPT's work.
3. coordination, communication, responsiveness and timeliness between
the SDHPT and the consultants could be improved.
4. in general, the use of consultants is relatively new with the
department and the SDHPT is going through the "learning curve" with the
usage of consultants.
S. with time, when the "learning curve" is over, the problems with
coordination, communication, responsiveness and timeliness between the
SDHPT and the consultants will improve.
68

POLICY
The SDHPT's policy of using consultants during periods of peak work
loads and to do specialty jobs is not unique to Texas. The Transportation
Research Board surveyed the fifty states' departments in 1984 and determined
that the two primary reasons given by states for hiring private firms were:
"to respond to increased or peak work loads" and "to obtain specially trained professionals and specialized equipment."
The remaining five reasons (in order of importance) for obtaining contracted
services were:
to replace mandated staff reductions;
to make use of all available funds;
to reduce costs;
to provide opportunities for private firms; and
to improve agency credibility with the public and to respond to a desire for less government.
The responses of the consulting engineering representatives in the
present study included all of the above reasons for SDHPT using private
services. Their emphasis, though, was on the ability of the private firms
to reduce costs, improve efficiencies, and boost productivity--all of which
were thought to result from the private sector's inherent incentives to keep
costs down and profits up.
There was general agreement that the risk-bearing nature of the private
sector was ideally suited to accomodate swings in the amount of highway work
done in the State. Private firms can acquire and release personnel and
other resour.ces _more rapidly than does the public sector. This characteris-
tic of the private sector works in support of the SDHPT's policy to use the
consulting firms more extensively during upswings of activity and less
extensively during level or downward movements of workloads.
69

The SDHPT policy of using consultants only to help with peak loads of
design work was generally opposed by the consulting engineering respondents.
The question "What is the peak?" was frequently raised. Beyond that,
though, there was an overriding concern that the health of the consulting
industry in Texas would be seriously impaired if the private sector was used
only in peak periods.
While no detailed analysis of capacity (either of SDHPT or the private
sector) was undertaken, there are some salient inferences about this "peak
load" policy that are possible. Consultants (though not unanimously)
generally expressed the thought that SDHPT should rely more and more on the
private sector to do the design and planwork for the Department. Support
for this position included the boundary view that: SDHPT cadres of
engineers should be used exclusively to manage programs of design work done
by private consultants (much as is done in some other states, e.g., Arizona,
Florida, Virginia). However, at the opposite boundary, California, with a
program comparable to Texas, has consistently used in-house personnel for
nearly all highway design and currently less than 5% of such work is being
handled by consultants. Also, the State of New York utilizes consultants
only for peak loads and specialty work, which presently combined, is about
15% of the design work.
If consultant engineers were assigned to do all of the preliminary
engineering and design, the SDHPT's engineering staff would be needed to
manage and direct the private sector in producing plans. While this could
probably be done without jeopardy during the short run ahead (2-5 years),
in a long run context, two self-limiting factors would become crucial:
(1) the career development of SDHPT's engineering staff would be shaped differently, due to its more limited role in highway planning and design; and
70

(2) the decentralized structure of the SDHPT would become a liability t.o the efficient management of consulting engineering.
In the first instance, the SDHPT would ultimately have to rely on
management personnel who did not have extensive experience and training in
design work --traditionally, the primary source of SDHPT's senior managers.
This concern was also a major finding in the 1984 nationwide survey of
highway departments conducted by TRB, to wit: "the increased usage of
consultants might result in the loss of staff engineering and design skills
and the (departmental) staff would become planning and management oriented,
depending on consultants for technical services."
Secondly, the ability to supervise successfully an engineering program
produced by consultants presupposes strong centralized organization and
control -- just the opposite of the much-admired strength of SDHPT's
decentralized 24-district structure. Extensive use of consultants seems to
be more prevalent in states which have a strong, centralized departmental
organization. This is certainly not the case in Texas.
Thus, while it would be possible to use consultants exclusively to
perform engineering services, to do so, however, would require an approach
to organization and management vastly different from the two markedly
successful traits of the Texas SDHPT: (1) top management personnel who have
been highly trained and experienced in highway design; and (2) decentralized
organizational structure.
Peak Load Concept
The peak workload that is a candidate for assignment to consultants has
two important aspects:
1) relativity--What is the peak relative to?
2) size and duration--How big is the peak and how long will it last?
71

First the notion of peak activity has meaning only relative to the
surrounding levels of activity. In the present context, the surrounding
levels of preliminary engineering are derived from the demands generated for
the production of plans to be let to contract. In Texas, increased highway
funding has driven construction lettings from $750 million in FY 82 to $1.9
billion in FY 86.
In terms of the current workload analysis, SDHPT expects that a $1.4-
$1.5 billion level of construction can be accommodated by in-house design
forces beginning in 1989 and continuing indefinitely. Presently, SDHPT is
conducting detailed manpower and workload assignment analyses to produce a
plan for augmenting in-house design capabilities to meet projected design
requirements.
In Figure 4, the expected contract amounts are shown for the next 7
years in which the construction program begins to level out in 1989. From
these data, the new plateau, when extended back to 1985, helps define the
peak in construction as defined by SDHPT. It is the period from 1985-89 and
comprises the shaded area in Figure 4.
The peaking that occurs in preliminary engineering will, given the
nature of the design and construction process, occur 12-18 months prior to
the peaking in construction lettings. Using a 12-month lag, the data
represented in Figure 5 show a similar concept of the peak load in
preliminary engineering. Although the relative amounts are sufficient to
describe the concept, the actual data are derived directly from the
construction data in Figure 4. The construction data was multiplied by
4.0%--the amount that preliminary engineering expenses are as a percentage
of the value of construction. This factor was calculated from the study's
project data.
72

MILLIOt1S 2500
2000
1500 -
1000
500
82
Figure 4 •
• ______ ,.. _____ .., ______ : .. ....-- ---~
87 FISCAL YEAR
ction Letting SDHPT Highway Constru
92
Figure 5 shows that the preliminary engineering peak period extends
from 1984 through 1987. Beginning in 1988, the effects of the expansion are
expected to be dissipated such that normal work loads will be re-established
by SDHPT at the new plateau levels. Future peaks will occur as departures
from the plateau level and will occur when new financing is injected, either
as Federal or State taxes, into the highway program.
The amounts of money being spent for consulting engineering are shown
in Figure 6 for the period 1981-1986. Based on these data, the peak in
expenditures for consultant services occurred in 1986, not in 1985 as
suggested in Figure 5. It is likely that the FY 87 amounts for consulting
preliminary engineering will be less than in FY 86, thus signaling the
movement downward as shown in Figure 5.
74
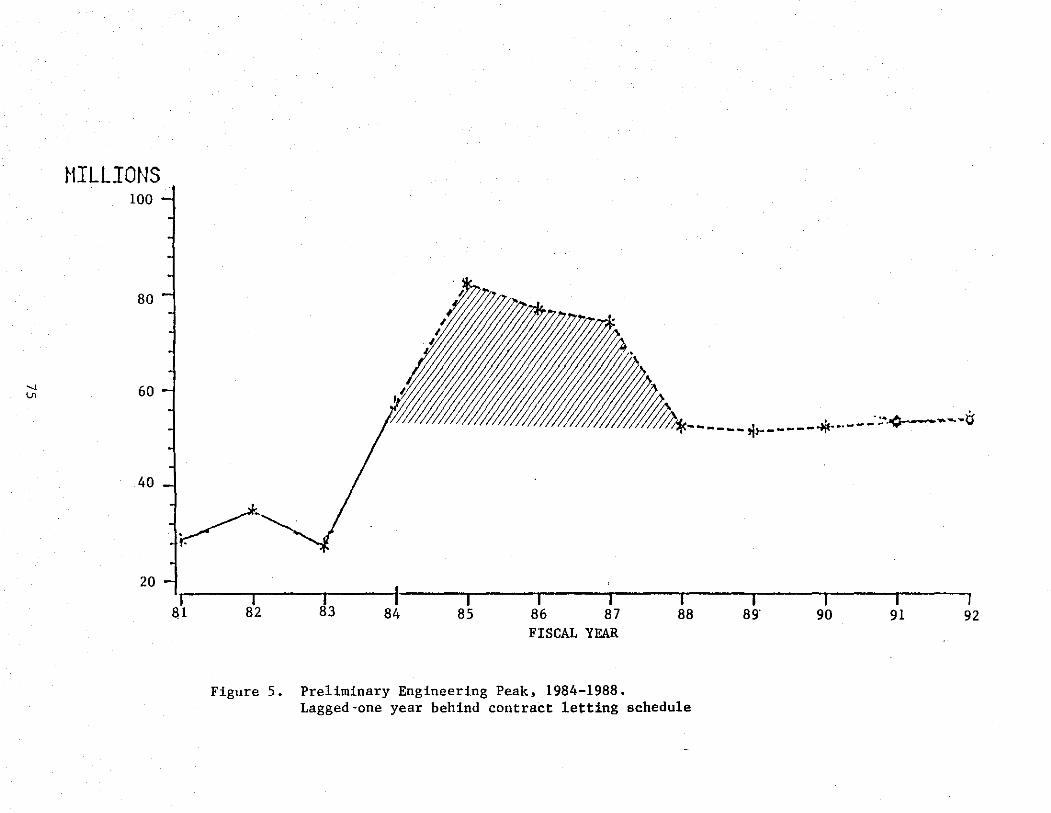
MILLIONS 100
80
60
40
20 I a1 I
82
Figure 5.
I 83 84 85 86 87 88
FISCAL YEAR
Preliminary Engineering Peak, 1984-1988. Lagged-one year behind contract letting schedule
89' 90 91 92

MILLIOtlS 42 -
32
22
12
•.-~~-.-~~-.-~~-1~,.._.--,,.._.,.._.~.--~~.--~~
81 82
Figure 6.
83 84 85 86 87
FISCAL YEAR Consulting Contract Amounts for Preliminary Engineering, 1981-1986

REFERENCES
American Road and Transportation Builders Association, A Guide for the Negotiation of Engineering Services for Highways, Bridges, and Related Projects, Bulletin No. 253 (1984).
American Society of Civil Engineers, Consulting Engineering: A Guide for the Engagement of Engineering Services, Manual No. 45, New York, 1981.
Bates, D.L. and W.G. Lyle, "When Do You Hire a Consultant?" Industrial Engineering, Vol. 11, 1979.
Consulting Engineers Council of Texas and Texas Society of Professional Engineers, A Manual of Practice for Engaging the Services of a Consulting Engineer, Austin, 1982.
Depuch, Nicholas, Jacob G. Birnberg, and Joel Demski, Cost Accounting: Data for Management Decisions, Second edition, Harcourt Brace Jovanovich, New York, 1974.
Davidson, Sidney, James S. Schindler, and Roman L. Weil, Fundamentals of Accounting, Drydon Press, Hindsdale, Ill., 1975.
National Association of Accountants, Separating and Using Costs as Fixed Variables, June 1983.
OMB Circular No. A-76 (Revised) Performance of Commercial Activities, Executive Office of the President of the United States. August 1983.
Transportation Research Board, "Use of Contract Services by State DOT's'', TR News, November-December 1985.
77

APPENDIX 1
Project Comparability
The purpose of this section is to perform a statistical analysis of the
degree of comparability between in-house and consultant projects. This
issue of project comparability is important in this study. For this reason,
it was decided to attempt to quantify the degree of comparibility to examine
the reliability of the original grouping of projects into pairs on the basis
of engineering judgement.
The statistical procedure to verify if two projects are or are not
comparable is based on a few independent (or relatively independent) project
characteristics. These "independent" (statistically independent)
characteristics were obtained by performing a correlation analysis of 19
project characteristics provided in the interview guide. After a
correlation matrix was obtained for these 19 characteristics, those least
related to any of the other 18 characteristics were deemed statistically
independent. The characteristics meeting the requirements of independence
are: o Length
o Nonstandard plansheets
o Number of bid items
o ADT
The above project characteristics can be measured for each project of the
data base developed in this study. For any pair of projects, let x1, xz•
x3, x4 be the numerical values associated with the in-house project, and let
Yl• yz, y3, y4 be the values associated with the consultant project.
It is possible to prove that if the project characteristics are
independent, the two projects being considered are totally comparable. The
quantity
78

x2 0
4
L: i=l
(xi Yi) 2
cr2 + cr2 xi Yi
follows a chi-square distribution with three degrees of freedom. In the
above mathematical expression, it is assumed that Xi
Yi "' , er 2 ). In statistical terms, the project comparison study is
Yi actually the testing of the hypothesis
Ho: µxi = µYi , i = l, 2, 3
against the alternative hypothesis
H1: µxi = µYi
for at least one value of i = l, 2, 3.
Given a critical value x 2 corresponding to a level of significance c
and four degrees of freedom, it is possible to check if the numerical value
of
x2 0
4 = L:
i=l cr2. + Xl.
2 x c
In case that the above relationship is satisfied, it is concluded that the
in-house and consultant projects are comparable at a 100 % level of
significance. Otherwise, the projects are not considered to be comparable.
The comparison methodology was conducted using the critical value
2 = 9.487, obtained.' from a chi-square significance table with ct = 0.05. Xe
used on available project data, the variance of each of the three project
characteristics was found to be equal· to:·
79

(a) For in-house projects:
o2 -6.09 Xl
02 s 17513.4 x2 2 -2463.9 o x3 2 = 1636380 o x4
(b) For consultant projects:
o2 = 7.74 Y1
02 z 30565.2 ~2
= 2852.7 o ~3
s 1344446 o Y4
The application of the statistical test for comparing the projects is
summarized in the following table. In this table two projects would be
perfectly comparable (from a statistical point of view) if the x2 /X 2 ratio . 0 c
were equal to zero; within the range of values between 0 and 1, this ratio
can still be used to conclude that two projects are comparable, assuming a
maximum probability of 5% that a wrong conclusion is reached. Outside the
range [ O, l] increasing values of the ratio x 2 Jx 2 would indicate that two 0 c
projects are more statistically different. According to the .above
statistical criterion, Pair #8 contains the most comparable projects, while
Pair #10 contains the most different projects.
Understandably, this procedure tends to select the projects that, by
nature, are less complex in their characteristics. Thus, the seven pairs of
"' statistically comparable projects are seven of the simplest, ordinary
projects in the data set and are not very representative of the full range
of work being done by SDHPT or consultants. On these 7 pairs, however the
average % PE for the state projects was lower (4.6%) than for the
consultants projects (5.2%).
80

This statistical analysis identifies Projects 10-lOA as the least
statistically comparable in the data set.
81

Table A-1. Project Comparison Results
PAIR ID X2 COMPARABLE X2/X2
1-lA N/A N/A N/A 2-2A N/A N/A N/A 5-5A N/A N/A N/A 12-12A 40.12 NO 4.22 6-6A 6.35 YES o. 7 7-7A 28.54 NO 3.0 8-8A 0.74 YES 0.078 10-lOA 1,090.32 NO 114. 9 17-17A 0.9142 YES 0.096 16-16A 0.9318 YES 0.098 25-25A 45.94 NO 4.84 26-26A 435.81 NO 45.85 27-27A 326. 10 NO 34.37 25-25B 45. 71 NO 4.81 22-22A 30.86 NO 3. 25 21-21A 3.623 YES 0.381 23-23A 6.56 YES 0.69 24-24A 4.41 YES 0.46 13-13A N/A N/A N/A 14-14A N/A N/A N/A 15-15A N/A N/A N/A 18-18A 460.12 NO 48.5 19-19A 317.01 NO 33.41 20-20A 56.81 NO 5.98
82

Year
1971 1972 1973 1974 1975 1976 1977 1978 1979 1980 1981 1982 1983 1984 1985 1986
Table A-2. Cost Deflators (1979=100)
Construction!.
34 .15* 36.68 40.97 61.01 63.00 57.45 64.69 83.84
100.00 122.64 113. 80 120.15 120.33 109.23 120.91 131.72
lsnHPT, Highway Cost Index, Construction Component
Engineeringl
53.95 57.43 61.14 67.55 73.69 78.99 84. 98 91. 77
100.00 109.67 120.61 127.93 135.24 142.44 149.52 157.64
2u.s. Department of Commerce, State Government Price Deflator
*Estimates
83

INDEX VALUE 200
150
100
50
COST DEFLATORS (1979=100)
71 72 73 74 75 76 77 78 79 80 81 82 83 84 85 86
YEAR
FIGURE A-1. COST DEFLATORS (1979=100)
CONST.
D ENGR.

=·E !'346655
+ + + + + + + + + + + + + + + + + + + + + + + + + + + + +
+ * + + 2
+ *
* ** * * * ** *
*
*
+
* *
*
++ + + + + + + + + + + + + + + + + + + + + + + + + + + + + + + + + + + + + + 7341
981000
CONSULTANT PROJECTS
i::ADER DATA FOR: A:CONSULTA LABEL: consultant UMBER OF CASES: 18 NUMBER OF VARIABLES: 2
REGRESSION EQUATION CSf1>:lwn by +' s on scattHp I •:it):
INTERCEPT= 82520.08099645 SLOPE= 4.0885905805127E-02
r = • '3036 r squar~d = .8165
Figure A-2
85
construe 40000000

--------------------- DESCJ;: I PT I VE ST AT I ST I CS ---------------------
HEADER DATA FOR: A:CONSULTA LABEL: consultant NUMBER OF CASES: 18 NUMBER OF VARIABLES: 2
NO. NAME 1 construe 2 PE
CONSULTANT PROJECTS
N MEAN STD. DEV. 1810434378. 83331156'3239. 4072 18 509139.1111 523473.0806
MINIMUM MAXIMUM 981000.000040000000.0000
77341.0000 1946655.0000
---------------------- REGRESSION ANALYSIS ----------------------
HEADER DATA FOR: A:CONSULTA LABEL: consultant NUMBER OF CASES: 18 NUMBER OF VARIABLES: 2
INDEX NAME 1 PE
DEF'. VAR.: construe
CONSULTNAT
MEAN 509139.1111
10434378.8333
DEPENDENT VARIABLE: construe
STD.DEV. 523473.0806
11569239. 4072
VAR. REGRESSION COEFFICIENT STD. ERROR T<DF= 16) PE 19.9708 CONSTANT 266485.2137
STD. ERROR OF EST. = 5108115.1'324
r SQUARED = .8165 r = .9036
2.3667 8.438
ANALYSIS OF VARIANCE TABLE
SOURCE REGRESSION RESIDUAL TOTAL
SUM OF SQUARES D.F. 1.85792E+15 1 4.17485E+14 16 2'.27540E+15 17
86
MEAN SQUARE 1. 85792E + 15 2. 60'328E+13
PROB. .00000
F RATIO PROB. 71.204 2.757E-07

PE 1563576
+ + + + + + + + + + + + + +· + + + + + + + + + + + + + * * + * + + :t.3+ + 2** + 2
* *
* *
++ + + + + + + + + + + + + + + + + + + + + + + + + + + + + + + + + + _.:.3357
955246
STATE PROJECTS
~EADER DATA FOR: A:STATE LABEL: STATE c<UMBER OF CASES: 18 NUMBER OF VARIABLES: 2
F:EGRESSION EQUATION <Shown by +'son scattE'rplot):
INTERCEPT= 89794.13054372 SLOPE= 1. 8285156385395E-02
r = .9794 r squarE'd =· • 9593
Figure A-3
87
+ + + + CONSTRUC 80445194

--------------------- DESCRIPTIVE STATISTICS ---------------------
HEADER DATA FOR: A:STATE LABEL: STATE NUMBER OF CASES: 18 NUMBER OF VARIABLES: 2
NO. 1 2
NAME CONS TR UC PE
STATE PROJECTS
N MEAN STD. DEV. 18 9406250.333318552913.3075 18 261788.8889 346368.4247
MINIMUM MAXIMUM 955246.000080445194.0000
48357.0000 1563576.0000
---------------------- REGRESSION ANALYSIS ----------------------
HEADER DATA FOR: A:STATE LABEL: STATE NUMBER OF CASES: 18 NUMBER OF VARIABLES: 2
STATE PROJECTS
INDEX 1
DEP. VAR.:
NAME PE CONSTRUC
MEAN 261788. 8889
9406250.3333
DEPENDENT VARIABLE: CONSTRUC
STD.DEV. 346368.4247
18552913.3075
VAR. REGRESSION COEFFICIENT STD. ERROR T<DF= 16) PE 52.4622 CONSTANT -4327765.0784
STD. ERROR OF EST. = 385'3091.4243
r SQUARED = .9593 r = • 9794
2.7022 19.414
ANALYSIS OF VARIANCE TABLE
SOURCE REGRESSION RESIDUAL TOTAL
SUM OF SQUARES D.F. 5~G1330E+15 1 2.38281E+14 16 5.85158E+15 17
88
MEAN SQUARE 5.61330E+15 1. 48926E+13
PROB. .00000
F RATIO PROB. 376.919 1.610E-12

APPENDIX 2
Procedure to Assign Quality Assessments of Projects
A statistical procedure was developed to identify meaningful factors
and scales in a point project quality evaluation plan by examining factor
overlapping, capability of factors to be quality indicators, and their
ability to discriminate among projects. A computer program was written to
facilitate the execution of the statistical procedure.
The validity of the factors and factor scales can only be judged by the
validity of the project quality relationships emanating from their
application. The fact.ors are generally selected and weighed on the basis of
past experience. The selection of the factors should be made by giving due
consideration to the fol lowing: (1) acceptabi 1i ty, (2) applicability, (3)
ratability, (4) distinctive nature, (5) number of factors, and (6) ease and
economy of administration.
Too many factors or factor levels will produce results which are
ambiguous and overlapping. On the other hand, if too few factors or levels
are selected the evaluation process will rather become generalized.
Consequently, the factors and factor scales should be selected carefully and
deliberately.
The main objective of this section is to describe the statistical
procedure for selecting factors and designing factor scales in an
evaluation plan so that the overall reliability and accuracy of the plan can
be improved. Emphasis is placed on the methodology that was especially
employed to conduct a systematic and relatively objective analysis of a
particular choice of factors and scales given a sample of key projects (both
for consultants and in-house).
89

For the application of the project quality evaluation methodology,
TTI's panel carefully examined the scope and content of each project from
considering the following factors: completeness, clarity, constructability,
accuracy, timeliness, and coordination/communication. For each of these six
factors, a five-level scale was designed in order to cover a range that
reflected all possible quality ratings for a given project.
The factor screening methodology is based on 23 in-house and 23
consultant projects. The statistical procedure developed in this can be
used to eliminate undesirable factors or to modify irregular factor scales,
according to a collection of four tests. A summary of each test is given
in Appendix 3.
90

Table 1. Advisory Panel Quality Evaluation Form
Project# District #~~~~~~~~~~~~~
Quality Hierarchicl Scale2 Remarks 3 Characteristic Weighting (%) A B c D E
1. Completeness
2. Clarity
3. Constructibility
4. Accuracy
5. Timeliness
6. Coordination & Communication
Sum of 1-6 100%
7. Complexity4 Low, Medium, High
8. Comparability4 Yes, No
1: Assign the proportionate weight (in%) to each of the quality characteristics. The weight you assign should reflect how this particular characteristic affects quality in general or how it affects the quality of the project you are evaluating.
2: See the attached sheet for the definition of the scaling system.
3: Comment or express any observation, judgement or opinion you might have, based on the data in the interview guide.
4: Circle appropriate ones please.
91

Table 2. llefln:l.tion of Sea ling System for Q.iality Characteristics
Scaling System (A, B, C, D, E) is Defined for Each Q.iality Characteristic as Follows:
' Q.iality Characteristic A B c D E
· Very Yood plans; no Good plans with below Good plans with below Satisfactory rlans with Satisfactory plans OOiiss ons; no conflicts average OOiissions, con- average errors, OOiis- average oml.ss ons, er- above average orals-
Completeness bet..,en plans and flicts and errors; slons, conflicts and rors, conflicts; eans sions, errors, con-spec. ; below average plans contain all the changes; eans contain contain mre of t flicts and changes; errors; plans maintain necessary elet1En.ts; no nnst of t necessary necessary elem:mts. plans contain essen-all the necessary ele- changes during con- elerrents. tially nnre of the ments; no changes dur- struction. necessary elements. ing construction.
Very neat; very legible; Very neat; legible; easy legible and neat; ave- legible but not so Barely legible; not so very neat to lroduce; no to reproduce; below ~e errorsi omissions neat; above average er- neat; above average
Clarity errors{ OOiiss. ons and average errors, omls- mlsspel ed words; rors, omissions and errors i OOiissions and misspe led words. sions and misspelled easy to produce. mlsspelled words; can mlssrv led words;
words. reproduce. bare y reproducible.
0 Very ~ood plans; no Good plans with below Good plans with average Satisfactory plans with Satisfactory plans with
" omlss ons, conflicts, average errorsi omis- errors, omlssions , con- above average OOiissions, above average errors, Constructibility errors, changes or sions, or conf lets; flicts, or changes• conflicts or c~es; conflicts, c~es;
claillll; design/plans are below average changes ~lans/design practlcal, average claillll; p ans/ plans/design f rly very practical. and no claillll; plans/ low average clail!B. design practical. practical.
desl.gn very practical.
Plans are free fron er- Plans have below aver- Plans have average er- Plans have above aver~ Plans have above aver-rors; plans confonn age errors, conflicts, rors, conflicts, and/or errors, conflicts, and age errors, conflicts,
Accuracy exactly to requlrerrents; cxnissions; plans confonn OOiissions; plans confonn or oml.ssions; plans con- and/or oml.ssions; plans no omissions or con- exact~\ to requirements; requirements; good plans. fonn to requlrem:mts; barely confonn to re-flicts; very good plans. good p ans. satisfactory plans. qulrerrents; satisfac-
tory plans.
Mhered very closelh.J' Mhered closely to or- Deviated f ron original Deviated fron original Deviated from orlgtna 1 original project sc - ~inal project ached- schedule by 60 days; ret schedule ~ 120 days; schedule by nnre than
Tirreliness ule; met all deadlines; es ; ret mst of dead- nnst deadlines; overrun OEt SODE 0 deadlines; 120 a:r.; designer de-perforrred within sched- lines; performed within was not designers' fault. both departnelt and con- fault • ule. schedule. sultant contributed to
overrun(s).
Excellent connunication Good to ve'1jood com- Good or average conm.utlc- Satisfactory conmmica- Poor conm.utlcation, co-Conmmicatioo and coordination; both nunication coo rd in- ation and coordination; tion, coordination, and ordination, and respon-
and department and consul- ation; department and res~iveness from ooe responsiveness; above siveness; excessive Coordination tant were very respon- consultant were very or th )urties was just average review. review.
sive; ·review was below responsive; normal re- mrmal; ust above aver-normal to nonMl. view. age review.

Table 3, Correlation Factors & Standard Deviations for the Consultant's Data
Correlation Between Factor and Quality
Factor
1.000 2.000 3.000 4.000 5.000 6.000
Correlation Description
0.935 o. 775 0.898 0.798 0.888 0.805
Completeness Clarity
Constructibility Accuracy
Timeliness Coord./Commun.
Correlation Between Factors
Factors
1 and 2 1 and 3 1 and 4 1 and 5 1 and 6 2 and 3 2 and 4 2 and 5 2 and 6 3 and 4 3 and 5 3 and 6 4 and 5 4 and 6 5 and 6
Factor
1 2 3 4 5 6
93
Correlation
0.693 0.856 0.739 0.834 0.699 0.605 0.667 0.614 o. 655 0.695 0.739 0.727 0.594 0.634 0.658
Std. Dev.
1.132 o. 778 0.920 0.972 1.231 1.102

Table 4. Correlation Factors & Standard Deviations for the Department's Data
Correlation Between Factor and Quality
Factor
1.000 2.000 3.000 4.000 5.000 6.000
Correlation Description
0.843 0.754 0.862 0.921 0.685 0.904
Completeness Clarity
Constructibility Accuracy
Timeliness Coord./Commun.
Correlation Between Factors
Factors Correlation
1 and 2 0.603 1 and 3 0.692 1 and 4 0.799 1 and 5 0.385 1 and 6 0.649 2 and 3 0.522 2 and 4 0.673 2 and 5 0.390 2 and 6 0.728 3 and 4 0.785 3 and 5 0.476 3 and 6 0.767 4 and 5 0.542 4 and 6 0.763 5 and 6 0.613
Factor Std. Dev.
1 0.928 2 0.550 3 0.751 4 0.792 5 1.216 6 0.991
94

Table 5. M:!ans and F-Ratios for the Q.iality Characteri~tics for both In-House and Consultant Data ,
Corrqlleteness Clarity Constructibility Accuracy Tineliness Conm.lnication Total
fupt. 16.l 12.4 14.3 12.9 8.7 ll.9 76.3 Dl2 Consul. 16.2 12.2 15.2 14.7 ll.8 16.2 86.1
F-Ratio .76 E--04 '0.02 0.9 0.7 1.0 1.6 0.8
fupt. 17.7 12.0 16.5 16.8 9.5 13.9 86.4 Dl4 Consul. 7.9 8.4 8.3 9.2 5.6 10.2 49.6
F-Ratio 17.8 3.9 15.9 7.0 2.9 2.7 10.0
fupt. 18.3 12.0 19.7 14.4 9.8 14.3 88.5 DIS Consul. 17.9 13.0 16.5 13.2 ll.3 10.7 82.3
F-Ratio o.os 1.0 6.0 1.0 1.0 2.6 0.8
.0 fupt • ll.4 9.6 13.0 13.2 12.l 11.4 70.7 "' Dl6 Consul. 13.3 12.0 13.3 10.8 9.1 17.5 76.0
F-Ratio 1.0 0.4 0.01 4.0 3.6 2.6 0.16
fupt. 11.4 10.0 10.1 8.4 6.9 9.6 56.5 DIS C.Onsul. 10.1 9.7 8.7 8.2 3.5 8.8 49.1
F-Ratio 0.3 0.05 0.6 0.02 o.s 0.09 0.9
fupt. 16.2 13.2 15.2 14.4 13.3 15.4 87.5 D20 Consul. 16.2 12.0 12.4 14.2 9.8 12.8 77.5
F-Ratio o.o o. 7 2.5 0.02 7.6 1.2 1.3
fupt. 16.2 12.0 16.2 14.4 12.4 14.4 85.5 D24 Consul. 14.3 11.3 14.3 15.3 9.8 12.8 77.6
F-Ratio 2.0 1.0 2.0 1.0 3.4 1.0 1.3

Table 6. ANOVA Means and F-Ratios for Both Department and Consultants
Header Data For: A:llOODEPT Number of Cases: 23
Label: Department Analysis Number of Variables: 7
Department Analysis
Complete Clarity Construt Accuracy Complete 1.00000 Clarity .60346 1.00000 Construt .6917S .S2208 1.00000 Accuracy .79930 .672S2 .78S27 1.00000 Timely .38716 .39014 .4764S .S4167 Coor/Com .64894 • 72804 • 76 718 • 762 94 Qualvalu .8432S .7S393 .8612S .92146
Critical Value (1-Tail, .OS) = + or - .3S214 Critical Value (2-Tail, .OS) = + or - .41228
N = 23
Timely
1.00000 .61316 .68420
Coor/Com Qualvalu
1.00000 .90327 1.00000
Header Data For: A:llOOCONS Number of Cases: 23
Label: Consultants' Analysis Number of Variables: 7
Consultant Analysis
Complete Clarity Construt Accuracy Timely Coor/Com Qualvalu Complete 1.00000 Clarity .6934S 1.00000 Construt .8S642 .60481 1.00000 Accuracy .738S3 .667SO .69Sl4 1.00000 Timely .83401 • 61390 .73906 .S9377 1.00000 Coor/Com .69874 .6SS26 .72721 .63364 .6S779 1.00000 Qualvalu .93Sl4 • 77S24 .89813 .797S4 .88828 .80S20 1.00000
Critical Value (1-Tail, .OS) + or - .3S214 Critical Value (2-Tail, .05) = + or - .41228
N = 23
96

APPENDIX 3
Statistical Quality Evaluation Procedure
A. Basic Purpose of Statistical Tests
The factor screening methodology is based on a sample of key projects.
The computerized statistical procedure developed in this study can be used
to eliminate undesirable factors or to modify irregular factor scales,
according to a collection of four tests, A summary of each test is given
below:
Test 1. Analysis of the degree of field super-position for all
factors. Find the correlation coefficient for any two factors and compare
it with a specified value. If the correlation coefficient is larger than
the specified value, it is suggested that the two factors, to a significant
extent, are measuring the same field or requirement. In this case, one of
the factors may be eliminated.
Test 2. Analysis of the capability of each factor to be a quality rate
indicator. Find the correlation coefficient of every factor and quality
rate. If the coefficient is larger than a specified value, or less than
another specified value, then the factor is a good quality indicator.
Otherwise, the factor may be eliminated because its poor power to measure
quality.
Test 3. Analysis of the ability of each factor scale to discriminate
among projects. Determine the standard deviation of each factor. The
standard deviation is a measure of the ability_ of a factor to discriminate
among the projects under consideration. Factors with a good discriminative
power are very desirable.
Test 4. Analysis of the degree of utilization of the midpoints of each
factor scale. Determine the absolute different between the observed mean
97

degree and the midpoint of the scale. The scale of a given factor can be
redefined on the basis of this analysis.
B. Description of Statistical Tests
Consider the following notation:
P • number of key project
Ni = number of degrees in the scale of factor l
Xij= number of key project assigned to the jth degree of the scale of factor i
Yk = Salary of the kth key project
. ' Jik= degree of the scale of factor i to which key project. is assigned
The observed mean degree of factor i is defined by
(2)
The observed standard deviation 'of the degrees of factor i is given by
(3)
Test I. Find the correlation coefficient for any two factors and
compare it with a specified value. If the correlation coefficient is larger
than the specified value, it is suggested that the two factors, to a
significant extent, are measuring the same field or requirement. In this
case, one of the factors may be eliminated.
Consider the factors i and 2; the correlation coefficient for these
factors is defined as pit = cov (i,2 )/Sis 2 , where
98

cov (i,t) (4)
and -1 .5. Pu,< 1. If vl is the specified value, then Pit> Vi implies that
one factor may be eliminated.
The assessment of v1, v2, v3, and v4 is a subjective activity which
presents some difficulty because such parameters reflect to the extent of
any acceptable degree of superposition between any two factors.
Test 2. Find the correlation coefficient of every factor and,project
qua~ity. If this coefficient is larger than a specified positive value, or
less than another specified negative value, then the factor is a good tool
to measure quality. Otherwise, the factor may be eliminated because its
power to measure quality is poor. In other words, the purpose of this test
is to identify those factors that show a high negative or positive
correlation with project quality. The correlation coefficient between
factor i and quality y is given by
Piy = cov (i,y) I sisy ,
where cov (i,y) indicates the covariance of i and y; this covariance is
defined as
where Y
p
cov (i,y) = !l::(Jik - Xi) (Yk _y ),
k=l
in ali cases -l~pi y ~ 1.
If v2
is a specified value against which piy can be compared, then !Piyl < v 2
implies that factor i may be eliminated.
Test 3. The standard deviation is a measure of the ability of a factor
99

to discriminate among the projects under consideration. Factors•with~a gOOd
discriminative power are very desirable.
As an alternative measure of discrimination among jobs (dispersion) the
coefficient of variation may be used; this is defined as the standard
deviation divided by the mean, i.e., c i=S JX i' If v3is a specified value
for the minimal acceptable standard deviation or for the coefficient of
variation, whichever quality is chosen, then ci < v3 implies that factor i
may be eliminated.
. ' Test 4, Let µi be the midpoint of the scale of the factor i. Then
Iii - µJ measures the deviation of the observed mean degree with respect to
the midpoint of the scale. Obviously, factors with a low Iii - \!ii value
are of major interest. Therefore, if v4 is a specified upper bound for the
lack of symmetry of the distribution of factor i, this factor should be
eliminated if lxi - µJ > v4•
100