utilisation of magnesium phosphate cements to facilitate
TRANSCRIPT
Utilisation of magnesium phosphate cements to facilitate biodegradation
within a stabilised/solidified contaminated soil
Reginald B. Kogbara1*, Abir Al-Tabbaa1 and Srinath R. Iyengar1,2
1Department of Engineering, University of Cambridge, Trumpington Street, Cambridge CB2 1PZ, UK
2Present Address: Mechanical Engineering Program, Texas A&M University at Qatar,
Engineering Building, Education City, PO Box 23874, Doha, Qatar
*Corresponding author email: [email protected], Tel: +44 1223 765610
Abstract Stabilisation/solidification (S/S) of heavy metals and a parallel biodegradation of an organic
contaminant using Magnesium phosphate cements (MPC) was investigated under laboratory
conditions. The study was aimed at improving the robustness of S/S technology by
encouraging biodegradation in order to bring about some form of contaminant attenuation
over time. A silty sand soil, amended with compost was spiked with an organic contaminant,
2-chlorobenzoic acid (2CBA), and two heavy metal compounds, lead nitrate and zinc
chloride. Two formulations of the MPC grouts based on different proportions of the cement
constituents, with paste pH of approximately 6.5 and 10, were utilised for S/S treatment. The
study involved treating the organic contaminant present in the soil with and without the heavy
metals by employing the low and high pH MPC grout mixes, and using 10 and 25% compost
content. Microbial activity was monitored using dehydrogenase assay, whilst the tests
pertaining to the performance criteria such as contaminant concentration, unconfined
compressive strength, elastic stiffness, permeability and batch leaching tests were evaluated
at set periods. Contaminant recovery analysis after 140 days indicated a similar reduction in
2CBA concentration to approximately 56% in the different grout mixes. The cement
constituents exhibited stimulatory and inhibitory effects on soil dehydrogenase activity.
Heavy metal leachability as well as the engineering behaviour of the treated soils conformed
to acceptable standards. The results of the investigations show considerable promise for the
application of MPC in contaminated land remediation. This is an author-created version: [email protected] (RB Kogbara). A definitive version was subsequently published at http://rd.springer.com/article/10.1007/s11270-010-0541-7 in Water, Air & Soil Pollution, Volume 216, Issue 1 – 4, pp 411 – 427 (2011). The final publication is available at www.springerlink.com.
1
2
Utilisation of magnesium phosphate cements to facilitate biodegradation
within a stabilised/solidified contaminated soil
Reginald B. Kogbara1*, Abir Al-Tabbaa
1 and Srinath R. Iyengar
1,2
1Department of Engineering, University of Cambridge, Trumpington Street, Cambridge CB2 1PZ, UK
2Present Address: Mechanical Engineering Program, Texas A&M University at Qatar,
Engineering Building, Education City, PO Box 23874, Doha, Qatar
*Corresponding author email: [email protected], Tel: +44 1223 765610
Abstract
Stabilisation/solidification (S/S) of heavy metals and a parallel biodegradation of an organic
contaminant using Magnesium phosphate cements (MPC) was investigated under laboratory
conditions. The study was aimed at improving the robustness of S/S technology by
encouraging biodegradation in order to bring about some form of contaminant attenuation
over time. A silty sand soil, amended with compost was spiked with an organic contaminant,
2-chlorobenzoic acid (2CBA), and two heavy metal compounds, lead nitrate and zinc
chloride. Two formulations of the MPC grouts based on different proportions of the cement
constituents, with paste pH of approximately 6.5 and 10, were utilised for S/S treatment. The
study involved treating the organic contaminant present in the soil with and without the heavy
metals by employing the low and high pH MPC grout mixes, and using 10 and 25% compost
content. Microbial activity was monitored using dehydrogenase assay, whilst the tests
pertaining to the performance criteria such as contaminant concentration, unconfined
compressive strength, elastic stiffness, permeability and batch leaching tests were evaluated
at set periods. Contaminant recovery analysis after 140 days indicated a similar reduction in
2CBA concentration to approximately 56% in the different grout mixes. The cement
constituents exhibited stimulatory and inhibitory effects on soil dehydrogenase activity.
Heavy metal leachability as well as the engineering behaviour of the treated soils conformed
to acceptable standards. The results of the investigations show considerable promise for the
application of MPC in contaminated land remediation.
Keywords: Stabilisation/solidification, Biodegradation, Soil contamination, Magnesium
Phosphate Cement, Land reclamation.
3
1. Introduction
Many contaminated soils are characterised by the concomitant presence of both organics and
heavy metals, which limits the deployment of a single remedial technology to achieve a
successful cleanup of contaminated sites, since most treatment technologies are contaminant
group specific. Hence, developing a remediation technology, which could robustly deal with
a wide range of contamination, is not only desirable but also more sustainable.
Stabilisation/Solidification (S/S), which usually employs the addition of cementitious
binders, mainly Portland cement (PC) based, has emerged as an efficient and cost-effective
method for the treatment of a wide range of heavy metals in both hazardous wastes and
contaminated soils, and has gained wide international acceptance (Al-Tabbaa and Stegemann
2005). Its effectiveness for the immobilisation of organic compounds has however been less
successful due to interference of organics with setting and hydration processes of the cement.
The mechanisms of conventional S/S treatment include chemical fixation and physical
encapsulation of contaminants thereby reducing the potential for pollutant transfer into the
environment (Al-Tabbaa and Stegemann 2005). S/S treatment therefore reduces the migration
of contaminants, both organics and heavy metals, rather than their elimination.
Biodegradation, which generally entails the transformation and degradation of organic
compounds through metabolic processes of microorganisms, is the most effective
remediation technique for organic contamination to date. Therefore, it would be desirable to
facilitate the biodegradation of organic contaminants within a S/S treated contaminated soil to
bring about some form of contaminant attenuation over time. However, the characteristic
high pH of PC (around 12-13) along with its low porosity impede microbial survival.
Moreover, it has been documented that the PC industry contributes to around 5% of global
anthropogenic CO2 emissions; one of the major green house gases contributing to climate
change (Worrell et al. 2001; van Oss and Padovani 2003). Hence, the application of a binder
with a relatively lower pH, which could also address the sustainability issue with regard to
CO2 emissions, was considered in this work.
Magnesium phosphate cements (MPCs) are formed at room temperature by rapid acid-base
reaction between dead burned magnesia and an acid phosphate source. Different variants of
MPCs can be formed depending on the acid phosphate. For example, using ammonium
4
phosphate (NH4H2PO4) would lead to magnesium ammonium phosphate cement, while use of
potassium phosphate (KH2PO4) would lead to magnesium potassium phosphate cement. The
main reaction product of conventional magnesium ammonium phosphate cement employing
NH4H2PO4 is struvite (MgNH4PO4.6H2O) (Abdelrazig et al. 1989). The reaction of MgO
with KH2PO4 yields magnesium potassium phosphate hexahydrate or K-struvite
(MgKPO4.6H2O) (Wagh 2004). MPCs have found application in structural repair works,
refractory materials, borehole sealants in oil drilling and completion works, recycling of
benign wastes like coal ashes and mineral waste for use as construction products, and in-
drum S/S of radioactive and hazardous wastes (Rao et al. 2000). Such cements have been
credited with certain technical advantages beneficial to S/S treatment including reduced
leachability, higher propensity for binding with waste inclusion, higher resistance to sulphate
attack, lower permeability, higher early-age and long-term strengths and higher durability
(Abdelrazig et al. 1989).
An added advantage of MPC is its potential to form mixes with different pH ranges,
depending on the magnesia (i.e. basic component) and phosphate (i.e. acidic component)
contents. This suits environmental applications like biodegradation wherein certain range of
pH (5.5 – 8.5) is desired. One potential concern with such low pHs is that heavy metals are
likely to leach out as the solubility of a number of metal speciations increase. However, it has
been reported that MPCs immobilise heavy metals converting them to phosphates, which are
relatively insoluble at the aforementioned pH range (Wagh 2004). This work utilised
previously developed MPC mixes (Iyengar and Al-Tabbaa 2007; Iyengar 2008: PhD thesis,
Cambridge University) at two extremes of the paste pH range, approximately 6.5 and 10,
based on different proportions of the component materials i.e. dead burned magnesia and
triple super phosphate (TSP). The ability of these mixes to bring about significant reduction
in the leached concentrations of heavy metals from S/S treated contaminated soils has been
reported (Iyengar and Al-Tabbaa 2008).
There is a paucity of literature on facilitation of biodegradation within stabilised/solidified
waste systems, which were considered in the context of different applications and scenarios.
The earliest studies in similar direction focussed on microbial influenced degradation of
stabilised/solidified wastes disposed of in landfills (Knight et al. 2002; Sophia et al. 2007).
However, these studies highlighted the possible effects on stabilised/solidified waste forms
5
through microbial action, which may be a problem if microbial growth is encouraged. The
possibility of facilitating biodegradation within stabilised/solidified soil systems using a
range of additives to PC-based as well as alternative grout systems in the form of
Magnesium Oxide Cement and MPC have been investigated (Al-Tabbaa et al. 2007;
Harbottle and Al-Tabbaa 2006; Harbottle and Al-Tabbaa 2008). The findings of these studies
highlighted the importance of compost addition in encouraging the growth and survival of
microbial life within soil-grout systems. However, these studies were limited to organic
contaminants; but mixed contamination, which presents a much more complex scenario and
is the characteristic of most contaminated soils, was not considered. Furthermore, the
engineering behaviour of the S/S treated soil, which is likely to be affected by the
incorporation of a biodegradative mechanism, was not evaluated in previous studies.
In this work, 2-Chlorobenzoic acid (2CBA) was used as organic contaminant, and lead nitrate
and zinc chloride as metallic contaminants. Chlorobenzoates (CBs) are present in the
environment because of the widespread use of herbicides deriving from compounds such as
2,3,6-TCB, dicamba and others; as dead-end products in the degradation of
polychlorobiphenyls (PCBs) (Baggi and Zangrossi 1999) and as metabolites of
chlorotuolenes (Lehning et al. 1997). 2CBA is the main CB that originates from PCB
(Harkness et al. 1993). It was chosen because of its relatively low toxicity and relative ease of
degradation (Harbottle and Al-Tabbaa 2008).
Lead and zinc were chosen as typical heavy metal contaminants. Soil pollution due to these
metals is from a wide range of industrial and other processes including mining activities,
metal processing, electronic industries, various chemical industries, including solvent
applications, medical and dental applications, etc (Landner and Reuther 2004; Kabata-
Pendias and Mukherjee 2007). The principal factors influencing potential risks of heavy
metals are their solubility (or mobility), environmental bioavailability (adsorbed dose), and
their toxicological bioavailability (effective dose). Metal mobility and bioavailability are
mainly governed by abiotic factors, such as pH, redox conditions, and soil contents of organic
matter and clay minerals (Ragnvaldsson et al. 2007).
Specific remediation techniques for soils contaminated by the above-mentioned contaminants
include cover systems, in-ground barriers, stabilisation/solidification, soil vapour extraction,
6
air sparging, in situ soil flushing, bioremediation and soil washing. Although some of these
techniques are potentially applicable, their application to the remediation of a specific
contaminated site is dependent on a number of factors. Those factors considered of particular
importance are the clean-up target, technical feasibility relative to the particular site, soil and
contaminant characteristics, long-term monitoring arrangements for slow remedial techniques
or for immobilisation and containment techniques, validation of the remediation, health and
safety aspects, regulator and public acceptance and cost (Pearl 2000). The present study
focuses on the combination of stabilisation/solidification and bioremediation.
The objective of this study was to investigate the feasibility of facilitating organic
contaminant degradation and heavy metal immobilisation within a S/S treated soil without
compromising the structural integrity of the treated material.
2. Materials and methods
2.1 Model contaminated soil
A model contaminated silty sand providing a simplified simulation of contamination
conditions was prepared using Fraction-D Leighton Buzzard sand (D50 ~150-300 µm, David
Ball Ltd., UK) and silt (silica flour, D50< 150 µm, David Ball Ltd, UK). Eco-compost (sieved
past 2 mm; Scotsdales Ltd., Cambridge, UK), with oven dried moisture content of 100%, was
added as organic matter to provide a microbial inoculum as well as a source of nutrients. As
the experiments involved different treatment options, three variants of the same soil type with
similar composition were used. The sand-silt ratios used were 3, 3.5 and 4 due to difference
in compost content, since the effects of compost addition and abiotic contaminant loss were
investigated:
• The soil in majority of the mixes was composed of 70% sand, 20% silt and 10%
compost.
• One of the mixes had increased compost content and its soil was composed of 60%
sand, 15% silt and 25% compost.
• Two mixes were used as abiotic controls, the soil was composed of 75% sand and
25% silt.
In all cases, the soil was prepared with a moisture content of 15%, which includes the
moisture content of the compost added. The soils were contaminated with 3000 mg/kg of

7
each of the three contaminants, 2CBA, lead nitrate and zinc chloride. This resulted in
theoretical concentrations of around 1877 and 1439 mg/kg for lead and zinc respectively.
2.2 Binder materials
Two MPC mixes were used, one at the lower pH end (pH ~6.5) and the other at the higher pH
end (pH ~10), based on two different combinations of TSP (supplied by RS Minerals, UK)
and dead burned magnesia (MgO, Richard Baker Harrison, UK). TSP is a common fertiliser,
it is predominantly calcium dihydrogen phosphate, and contains some gypsum (Iyengar and
Al-Tabbaa 2008). Dead burned magnesia is composed of 82.6% by weight MgO, 7.5% SiO2,
5.6% CaO, 3.4% Al2O3 and 0.9% Fe2O3. The cement constituents were mixed in the ratio,
TSP:MgO = 8:1 for the lower pH end, and TSP:MgO = 1:2 for the higher pH end. De-ionised
water was used to produce the wet grout in which the cement:water ratio was 2:1. This water
content was chosen to ensure a moist environment for microorganisms and was based on
related S/S work (Iyengar 2008, PhD thesis, Cambridge University).
2.3 Preparation of stabilised/solidified soil systems
In preparing the model-contaminated soil, the dry soil components (which include the compost)
were mixed in a pre-dried and clean rotary drum mixer for several minutes until a consistent mix
was achieved. 2CBA was then added in dry powdered form and the soil mixed for several
minutes. The metallic compounds were dissolved in de-ionised water and then added to the mix.
However, not all mixes included the metallic contaminants. Further mixing was carried out until
the mix appeared homogenous. The soil was then incubated at room temperature (i.e. 20 ± 2 °C)
for 5 hours. Thereafter, soil samples were taken for initial measurements of contaminant
concentration and dehydrogenase activity, prior to cement grout addition. The soil was then
mixed with the cement grout in the rotary drum mixer at a dry soil: grout ratio of 2:1. A set of
S/S treated uncontaminated soil mixes were used as control samples for engineering
behaviour and their preparation followed the same procedure described above except that
there was no contaminant addition. Similarly, S/S treated soil containing all three
contaminants, prepared in the same way described above but without compost addition, were
used as abiotic controls. However, the soil used in the abiotic controls was sterilised in an
autoclave at 121 °C, twice, before addition of the contaminants and cement grout. Soil
containing compost, autoclaved as above, was initially used for abiotic controls but after S/S

8
treatment, there was evidence of microbial activity in mixes treated with the higher pH
cement formulation. Hence, they were discontinued and soil without compost was used.
Soil-cement mixes were produced by carefully casting the mix materials into cylindrical
moulds, 50 mm diameter with length 100 mm, while ensuring a uniform and homogenous
mass devoid of air bubbles. The average mass of each cylindrical sample containing the soil-
cement grout was approximately 440 g. The moulded samples were stored in curing tanks at
room temperature of 20 ± 2 °C for 3 days after which they were demoulded and incubated at
32 ± 4 °C and 95 ± 3% relative humidity in order to encourage biodegradation. The samples
were loosely covered with plastic film to prevent excessive moisture loss.
2.4 Experimental design
Nine treatment options were employed as detailed in Table 1. Each soil-cement mix had three
replicate samples for each time point of analysis. In addition, the standard mixes on which
permeability testing was conducted had extra duplicate samples for each of three time points
of analysis. Analysis of all the S/S treated samples was conducted at 0, 14, 28, 84, and 140
days, unless specified otherwise. The ideas behind the different treatments are as follows:
• Mixes 1 and 2: Standard mixes (mixed contamination scenario)
• Mixes 3 and 4: Effect of the absence of heavy metals, in comparison to mixes 1 and 2
• Mix 5: Effect of increasing the compost content in comparison to mix 2
• Mixes 6 and 7: Uncontaminated controls (for engineering behaviour)
• Mixes 8 and 9: Abiotic controls in comparison to mixes 1 and 2
2.5 Sampling
Generally, the unconfined compressive strength (UCS) of the cylindrical samples was first
determined before they were destructively sampled for other tests. Destructive sampling
involved crushing the S/S material in a mortar with pestle subsequent to which granular or
powdered samples were taken. As a result, samples at different time points were not taken
from the same S/S monolith. Separate monolithic cylindrical samples were used for
permeability tests.

9
Table 1. Components for each of the nine mixes (% by weight) 1
Mix description
Soil Cement Contaminants
Sand Silt Compost Water TSP MgO Water 2CBA Pb(NO3)2 ZnCl2
1: Soil with 10% compost containing organic
and metallic contaminants, treated with
TSP:MgO = 8:1 grout
37.65 10.76 5.38 5.38 23.91 2.99 13.45 0.16 0.16 0.16
2: Soil with 10% compost containing organic
and metallic contaminants, treated with
TSP:MgO =1:2 grout
37.65 10.76 5.38 5.38 8.97 17.93 13.45 0.16 0.16 0.16
3: Soil with 10% compost containing only
organic contaminant, treated with
TSP:MgO = 8:1 grout
37.68 10.77 5.38 5.38 23.93 2.99 13.46 0.16 - -
4: Soil with 10% compost containing only
organic contaminant, treated with
TSP:MgO = 1:2 grout
37.68 10.77 5.38 5.38 8.97 17.95 13.46 0.16 - -
5: Soil with 25% compost containing organic
and metallic contaminants, treated with
TSP:MgO = 1:2 grout
32.28 8.07 13.45 5.38 8.97 17.93 13.45 0.16 0.16 0.16
6: Soil with 10% compost without contaminants,
stabilised/solidified with TSP:MgO = 8:1 grout
37.84 10.81 5.41 5.41 24.03 3.00 13.51 - - -
7: Soil with 10% compost without contaminants,
stabilised/solidified with TSP:MgO = 1:2 grout
37.84 10.81 5.41 5.41 9.01 18.02 13.51 - - -
8: Autoclaved soil without compost containing
organic and metallic contaminants, treated with
TSP:MgO = 8:1 grout
40.34 13.45 - 5.38 23.91 2.99 13.45 0.16 0.16 0.16
9: Autoclaved soil without compost containing
organic and metallic contaminants, treated with
TSP:MgO = 1:2 grout
40.34 13.45 - 5.38 8.97 17.93 13.45 0.16 0.16 0.16
10
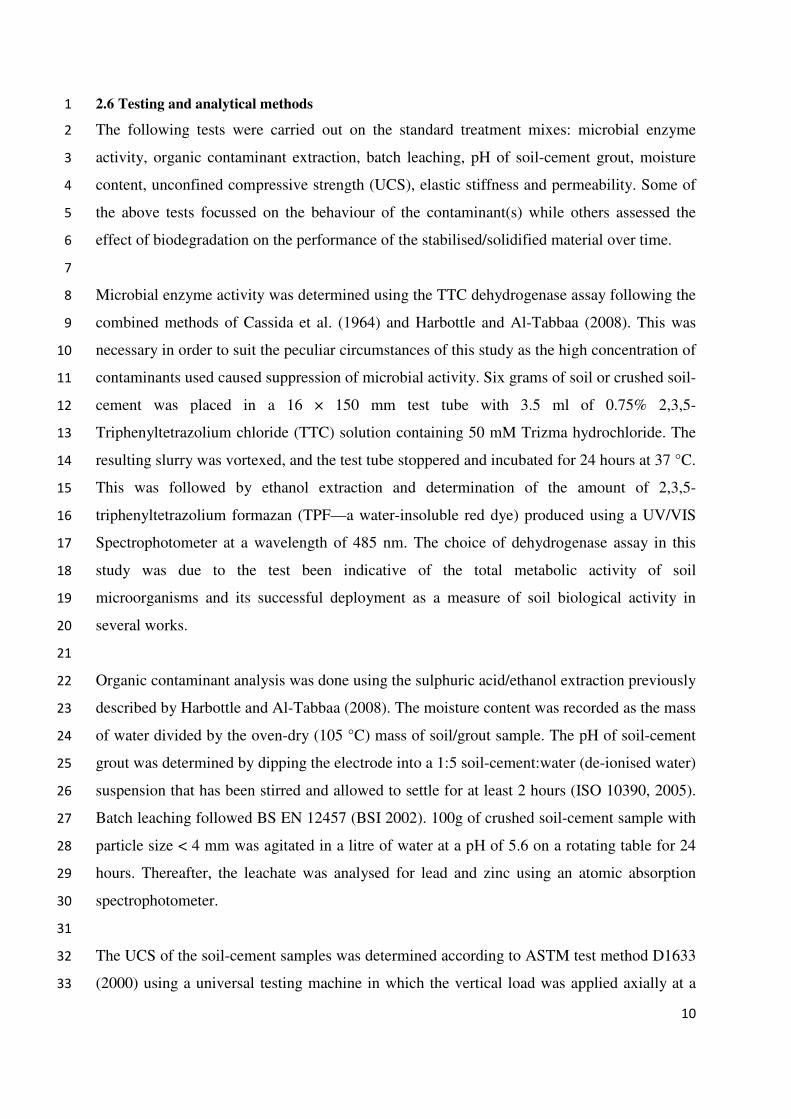
2.6 Testing and analytical methods 1
The following tests were carried out on the standard treatment mixes: microbial enzyme 2
activity, organic contaminant extraction, batch leaching, pH of soil-cement grout, moisture 3
content, unconfined compressive strength (UCS), elastic stiffness and permeability. Some of 4
the above tests focussed on the behaviour of the contaminant(s) while others assessed the 5
effect of biodegradation on the performance of the stabilised/solidified material over time. 6
7
Microbial enzyme activity was determined using the TTC dehydrogenase assay following the 8
combined methods of Cassida et al. (1964) and Harbottle and Al-Tabbaa (2008). This was 9
necessary in order to suit the peculiar circumstances of this study as the high concentration of 10
contaminants used caused suppression of microbial activity. Six grams of soil or crushed soil-11
cement was placed in a 16 × 150 mm test tube with 3.5 ml of 0.75% 2,3,5-12
Triphenyltetrazolium chloride (TTC) solution containing 50 mM Trizma hydrochloride. The 13
resulting slurry was vortexed, and the test tube stoppered and incubated for 24 hours at 37 °C. 14
This was followed by ethanol extraction and determination of the amount of 2,3,5-15
triphenyltetrazolium formazan (TPF—a water-insoluble red dye) produced using a UV/VIS 16
Spectrophotometer at a wavelength of 485 nm. The choice of dehydrogenase assay in this 17
study was due to the test been indicative of the total metabolic activity of soil 18
microorganisms and its successful deployment as a measure of soil biological activity in 19
several works. 20
21
Organic contaminant analysis was done using the sulphuric acid/ethanol extraction previously 22
described by Harbottle and Al-Tabbaa (2008). The moisture content was recorded as the mass 23
of water divided by the oven-dry (105 °C) mass of soil/grout sample. The pH of soil-cement 24
grout was determined by dipping the electrode into a 1:5 soil-cement:water (de-ionised water) 25
suspension that has been stirred and allowed to settle for at least 2 hours (ISO 10390, 2005). 26
Batch leaching followed BS EN 12457 (BSI 2002). 100g of crushed soil-cement sample with 27
particle size < 4 mm was agitated in a litre of water at a pH of 5.6 on a rotating table for 24 28
hours. Thereafter, the leachate was analysed for lead and zinc using an atomic absorption 29
spectrophotometer. 30
31
The UCS of the soil-cement samples was determined according to ASTM test method D1633 32
(2000) using a universal testing machine in which the vertical load was applied axially at a 33
11
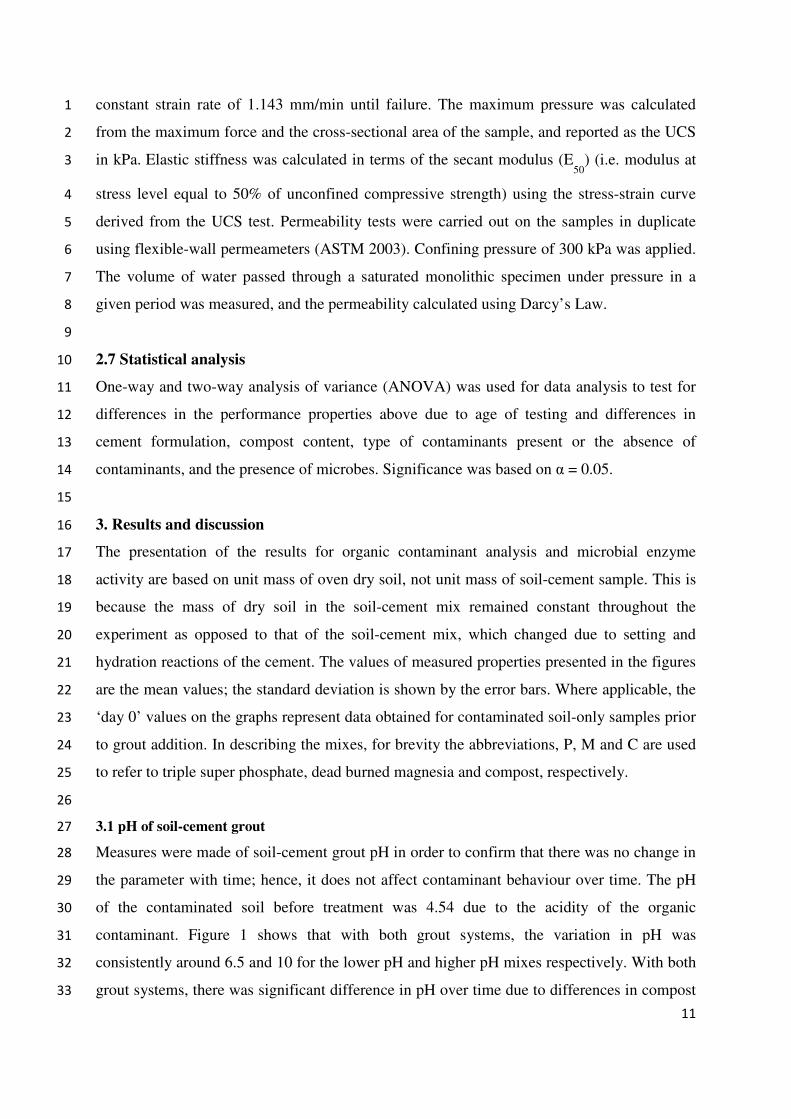
constant strain rate of 1.143 mm/min until failure. The maximum pressure was calculated 1
from the maximum force and the cross-sectional area of the sample, and reported as the UCS 2
in kPa. Elastic stiffness was calculated in terms of the secant modulus (E50
) (i.e. modulus at 3
stress level equal to 50% of unconfined compressive strength) using the stress-strain curve 4
derived from the UCS test. Permeability tests were carried out on the samples in duplicate 5
using flexible-wall permeameters (ASTM 2003). Confining pressure of 300 kPa was applied. 6
The volume of water passed through a saturated monolithic specimen under pressure in a 7
given period was measured, and the permeability calculated using Darcy’s Law. 8
9
2.7 Statistical analysis 10
One-way and two-way analysis of variance (ANOVA) was used for data analysis to test for 11
differences in the performance properties above due to age of testing and differences in 12
cement formulation, compost content, type of contaminants present or the absence of 13
contaminants, and the presence of microbes. Significance was based on α = 0.05. 14
15
3. Results and discussion 16
The presentation of the results for organic contaminant analysis and microbial enzyme 17
activity are based on unit mass of oven dry soil, not unit mass of soil-cement sample. This is 18
because the mass of dry soil in the soil-cement mix remained constant throughout the 19
experiment as opposed to that of the soil-cement mix, which changed due to setting and 20
hydration reactions of the cement. The values of measured properties presented in the figures 21
are the mean values; the standard deviation is shown by the error bars. Where applicable, the 22
‘day 0’ values on the graphs represent data obtained for contaminated soil-only samples prior 23
to grout addition. In describing the mixes, for brevity the abbreviations, P, M and C are used 24
to refer to triple super phosphate, dead burned magnesia and compost, respectively. 25
26
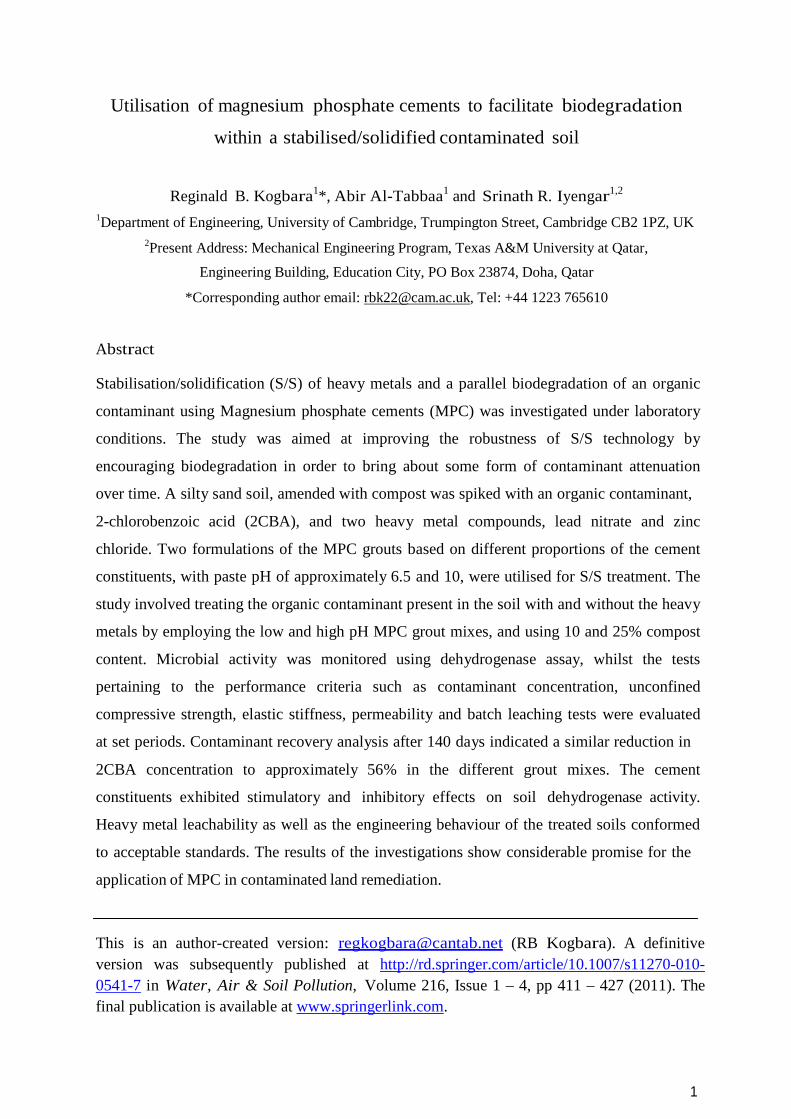
3.1 pH of soil-cement grout 27
Measures were made of soil-cement grout pH in order to confirm that there was no change in 28
the parameter with time; hence, it does not affect contaminant behaviour over time. The pH 29
of the contaminated soil before treatment was 4.54 due to the acidity of the organic 30
contaminant. Figure 1 shows that with both grout systems, the variation in pH was 31
consistently around 6.5 and 10 for the lower pH and higher pH mixes respectively. With both 32
grout systems, there was significant difference in pH over time due to differences in compost 33

12
content and type of contaminant(s) present, at the 0.1% level. However, the variation in pH 1
was consistently around the aforementioned values; hence, the variability was unlikely to 2
affect contaminant behaviour. The consistence of the pH stems from the fact that after S/S 3
treatment, the behaviour of the resulting monolith is governed by the grout characteristics. 4
5
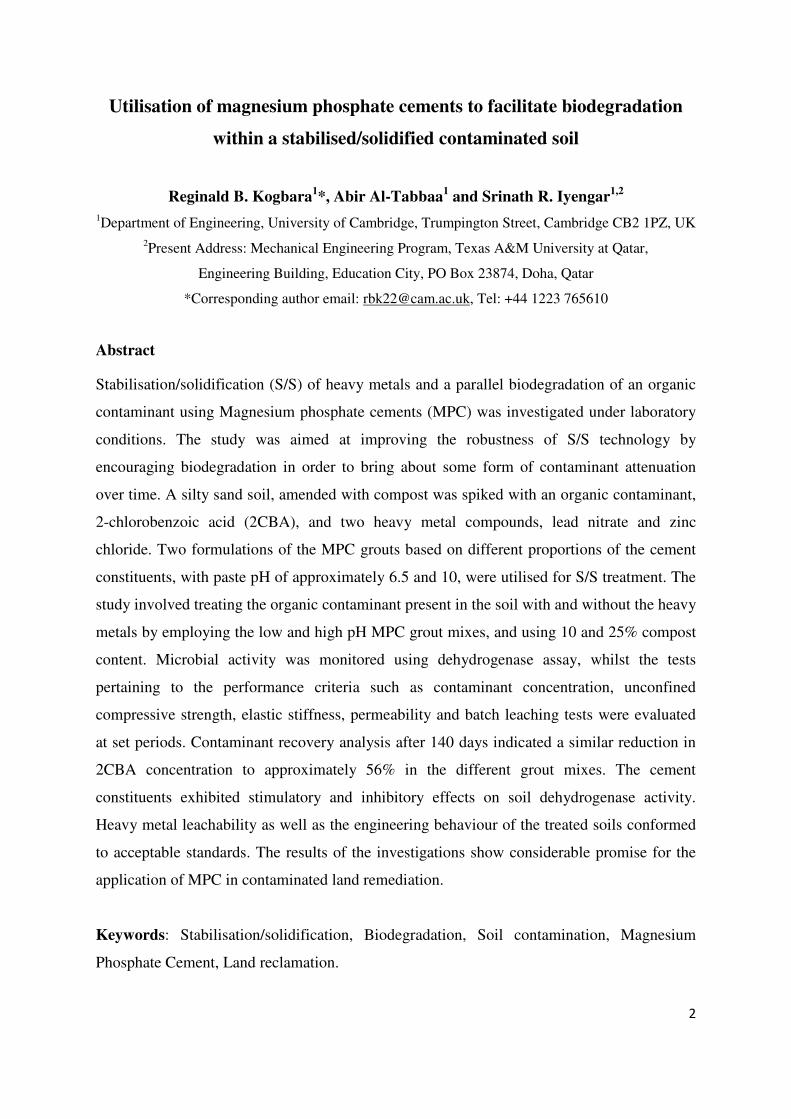
3.2 Moisture content 6
Moisture content was monitored in order to assess the effects of fluctuations in the parameter 7
on microbial activity. It has been reported that soil microbial biomass and activity declined 8
with decreasing water content (Van Gestel et al. 1993). The water content clearly increased at 9
14 days from its 0-day value of the untreated soil due to grout addition (Figure 2). Thereafter 10
it decreased over time due to evaporation (caused by drying in the curing conditions) and 11
possibly because of the cement hydration reactions (Harbottle and Al-Tabbaa 2008). There 12
was significant moisture loss with increase in sample age (p < 0.1%), but there was no 13
significant difference between the moisture content of both cement formulations. The dip in 14
moisture content at 84 days in the soil-cement systems is mainly due to fluctuations in 15
temperature and relative humidity in the incubator in which the samples were stored. As 16
analytical samples were taken from different soil-cement systems at each sampling point, 17
fluctuations in the aforementioned properties of the incubator is bound to affect the results 18
obtained at the various time points. Moreover, amidst the high relative humidity of the 19
incubator there were still problems with maintaining steady moisture content in the soil-grout 20
systems. The differences in moisture content of the samples cannot be directly linked to any 21
treatment, as these were mainly response of the mixes to fluctuations in environmental 22
conditions, which is likely to have been affected by factors such as position within the 23
incubator and time of sample preparation/storage. 24

13
1
P: triple super phosphate, M: dead burned magnesia, C: compost, 2CBA: 2-chlorobenzoic acid 2
Figure 1. pH of soil-cement grout 3
4
P: triple super phosphate, M: dead burned magnesia, C: compost, 2CBA: 2-chlorobenzoic acid 5
Figure 2. Moisture content of S/S treated contaminated soils 6
7

14
3.3 Organic contaminant analysis 1
Table 2 shows 2CBA recovery from the mixes over time. At 28 days, it appeared that mixes 1 2
and 2 (with mixed contamination) indicated higher contaminant loss than the mixes with only 3
organic contamination and higher compost content. However, from 84 to 140 days of treatment, 4
contaminant loss in the mixes with 10% compost content (mixes 1, 2, 3 and 4) were similar. After 5
140 days, there was a reduction in 2CBA concentration to ~56.5% and ~56.3% of the initial 6
amount within the lower and higher pH mixes with mixed contamination (mixes 1 and 2), 7
respectively. Contaminant reduction in samples without heavy metals was down to 8
approximately 56.5% of the initial value for both cement formulations. Hence, both binders 9
were as effective in contaminant degradation. The contaminant concentrations observed in mix 2 10
with 10% compost were significantly lower (p = 0.002) than those in mix 5 with 25% compost. A 11
similar observation was made by Harbottle (2006) (unpublished results) wherein 10% compost 12
addition to soil was found to cause better contaminant attenuation than 20% compost addition. 13
There was no statistically significant difference in contaminant concentration (p = 0.74) between 14
the two cement formulations, but the contaminant concentrations recorded over time were 15
significantly different at the 1% level. 16
17
The abiotic controls (mixes 8 and 9) were monitored for 84 days, unlike the other mixes, which 18
were monitored for 140 days. Hence, comparison between the abiotic controls and the standard 19
mixes (i.e. mix 1 and mix 8, and mix 2 and mix 9) is done at 84 days. There was a large decrease 20
in 2CBA concentration in the abiotic controls between 0 and 14 days compared to the standard 21
mixes. However, at 28 days, 2CBA concentration was marginally lower in the abiotic mixes than 22
the standard mixes. The large difference in contaminant concentration in both sets of mixes at the 23
initial stage may be due to differences in hydration process of the cement formulations since they 24
had different composition. The standard mixes contained compost but the abiotic mixes did not. 25
After 84 days, there was a reduction in 2CBA concentration to 75.9% and 75.4% of the initial 26
value in the lower and higher pH mixes of the abiotic controls, respectively. In the standard 27
mixes, 2CBA concentration was reduced to 56.7% and 57.3% for the lower and higher pH mixes 28
respectively, at 84 days. There was significant difference (p = 0.04) between the standard mix and 29
the abiotic control of the higher pH cement formulation. However, in the lower pH mixes, there 30
was no significant difference (p = 0.576) between the standard mix and the abiotic control, but 31
there was significant interaction (p = 0.001) between age and biological activity. In both cement 32
formulations, contaminant reduction with time was significant at the 0.1% level. 33
34

15
Table 2. Organic contaminant concentration for the mixes 1
Mix description
Time (days)
0 14 28 84 140
Contaminant concentration (mg 2CBA/kg dry soil)
1: P:M=8:1, 10% C, mixed
contamination
3000 2890
± 110
2474
± 189
1701
± 289
1694
± 326
2: P:M=1:2, 10% C, mixed
contamination
3000 2683
± 193
2552
± 272
1719
± 35
1688
± 144
3: P:M=8:1, 10% C, 2CBA
only
3000 2976
± 20
2920
± 42
1715
± 129
1694
± 84
4: P:M=1:2, 10% C, 2CBA
only
3000 2992
± 157
2982
± 53
1718
± 185
1695
± 170
5: P:M=1:2, 25% C, mixed
contamination
3000 2906
± 79
2805
± 91
1956
± 171
1950
± 188
8: P:M=8:1, No C, mixed
contamination (abiotic)
3000 2504
± 97
2419
± 105
2278
± 126
-
9: P:M=1:2, No C, mixed
contamination (abiotic)
3000 2702
± 55
2522
± 62
2262
± 122
-
P: triple super phosphate, M: dead burned magnesia, C: compost, 2CBA: 2-chlorobenzoic acid 2
3
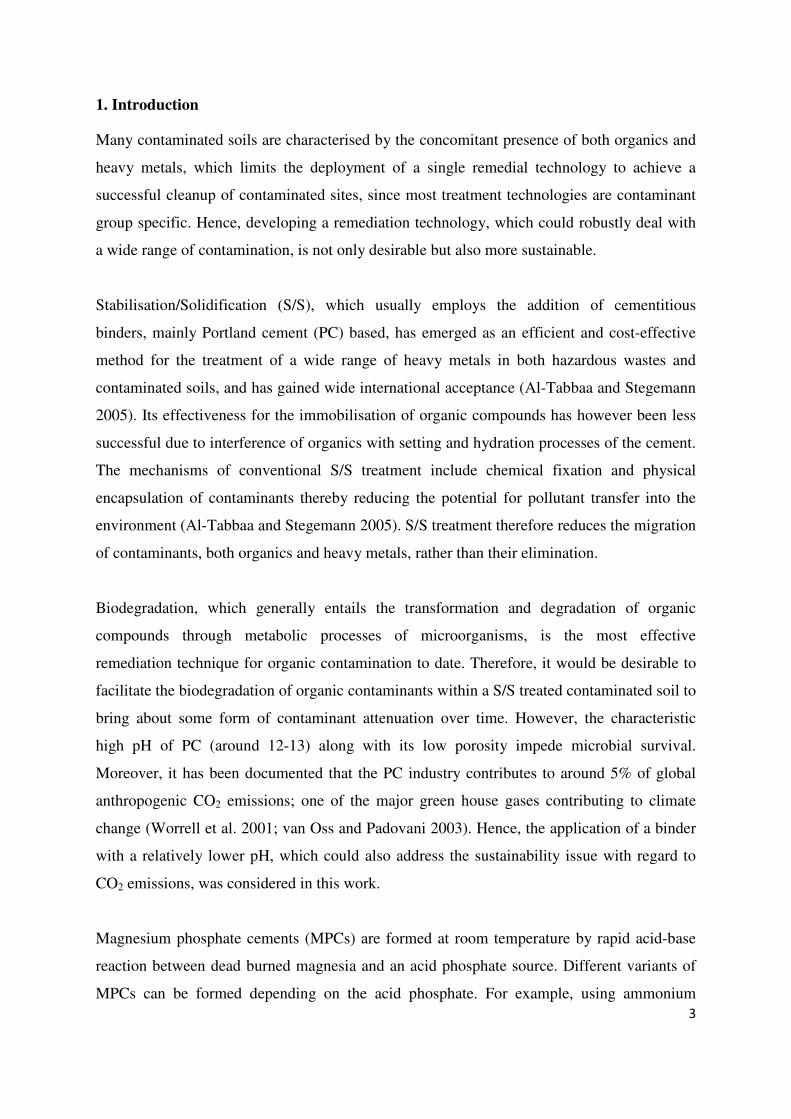
3.4 Microbial enzyme activity 4
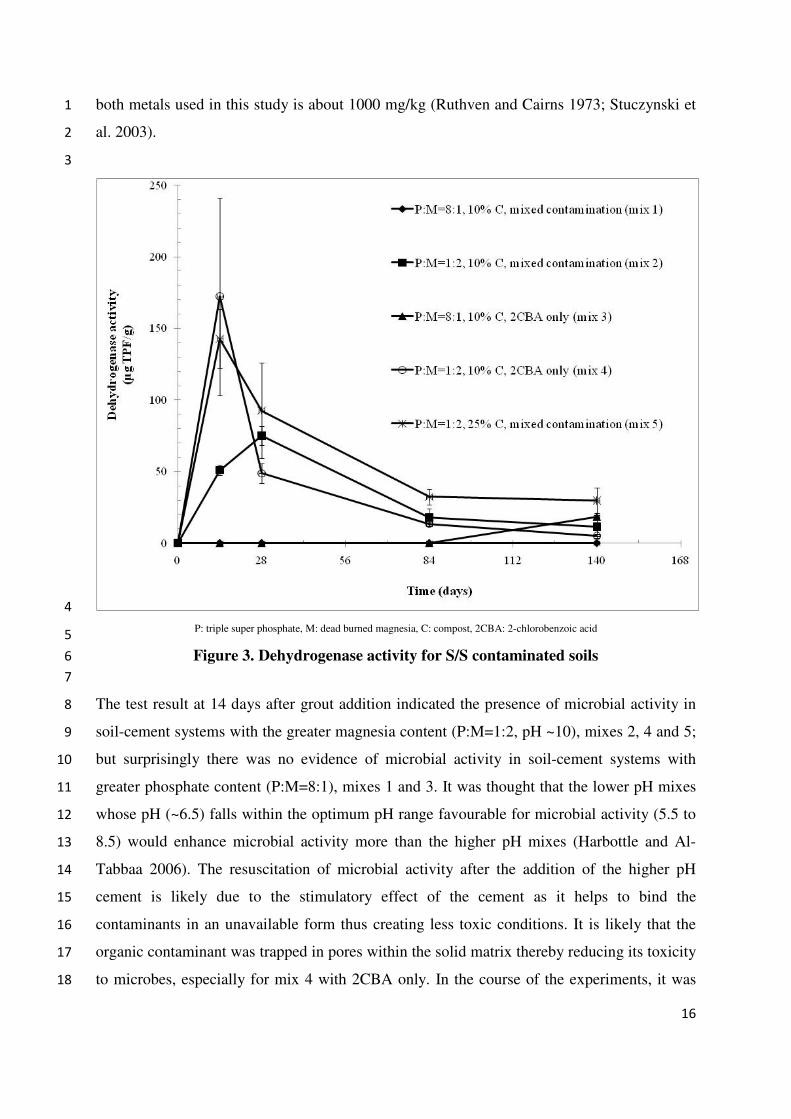
The day 0 points (i.e. the contaminated soils immediately prior to S/S treatment) in Figure 3 5
indicate that in the aftermath of soil contamination by the organic contaminant with or 6
without the presence of heavy metals and with both compost contents, there was no evidence 7
of dehydrogenase activity in the soil. However, the model soil composition with 10% 8
compost content had a mean dehydrogenase activity of 29.9 µg TPF/g before contamination. 9
With 25% compost content, the uncontaminated model soil had a mean dehydrogenase 10
activity of 52.3 µg TPF/g (see Table 3, section 1). Details of further investigations on 11
dehydrogenase activity, which explains the reason for lack of microbial activity in the day 0 12
samples, are shown in Table 3, section 2. It was observed that at mixed contamination levels 13
of 93.75 and 187.5 mg/kg, dehydrogenase activity was higher than that in uncontaminated 14
soil, but was reduced at 750 mg/kg and inhibited at 1500 mg/kg and above. Harbottle and Al-15
Tabbaa (2006) used soil contaminated with 500 mg/kg of the organic contaminant, and there 16
was considerable amount of dehydrogenase activity. These show that the absence of 17
dehydrogenase activity in the contaminated soils prior to S/S treatment was due to the high 18
level of contamination. A similar observation in which dehydrogenase activity was stimulated 19
at low levels of mixed contamination and inhibited at higher levels was reported by Gong et 20
al. (1996). It has been documented that the maximum level microbes can tolerate for each of 21
16
both metals used in this study is about 1000 mg/kg (Ruthven and Cairns 1973; Stuczynski et 1
al. 2003). 2
3
4
P: triple super phosphate, M: dead burned magnesia, C: compost, 2CBA: 2-chlorobenzoic acid 5
Figure 3. Dehydrogenase activity for S/S contaminated soils 6
7
The test result at 14 days after grout addition indicated the presence of microbial activity in 8
soil-cement systems with the greater magnesia content (P:M=1:2, pH ~10), mixes 2, 4 and 5; 9
but surprisingly there was no evidence of microbial activity in soil-cement systems with 10
greater phosphate content (P:M=8:1), mixes 1 and 3. It was thought that the lower pH mixes 11
whose pH (~6.5) falls within the optimum pH range favourable for microbial activity (5.5 to 12
8.5) would enhance microbial activity more than the higher pH mixes (Harbottle and Al-13
Tabbaa 2006). The resuscitation of microbial activity after the addition of the higher pH 14
cement is likely due to the stimulatory effect of the cement as it helps to bind the 15
contaminants in an unavailable form thus creating less toxic conditions. It is likely that the 16
organic contaminant was trapped in pores within the solid matrix thereby reducing its toxicity 17
to microbes, especially for mix 4 with 2CBA only. In the course of the experiments, it was 18
17
observed that TSP was responsible for the suppression of dehydrogenase activity in the lower 1
pH mixes. The lower pH mixes did not indicate any trace of dehydrogenase activity up to 2
when sampling was done at 84 days. However, it was observed that 140-day samples of mix 3
3 (P:M=8:1, 2CBA only, pH~6.5) had evidence of dehydrogenase activity. The exact 4
mechanism responsible for this is poorly understood but it is likely that the interaction of age 5
and absence of heavy metals may have had some effect on such anomalous behaviour. It is 6
suspected that dehydrogenase activity in mix 1 (P:M=8:1, mixed contamination, pH~6.5) 7
may have recovered over time like mix 3 but for its rapid moisture loss and slight decrease in 8
pH (see Figures 1 and 2). Figure 3 also shows that for samples treated with the higher pH 9
grout, compared to 10% compost content, 25% compost content led to comparatively 10
increased microbial activity. In all samples treated with the higher pH grout, considerable 11
amounts of dehydrogenase activity were sustained for over 28 days, thereafter the activity 12
decreased with time. There was significant difference in dehydrogenase activity between 13
mixes with 10% and 25% compost content at the 0.1% level. The difference between 14
dehydrogenase activities observed in the higher pH mixes with and without heavy metals was 15
not statistically significant (p = 0.06). However, the dehydrogenase activities recorded at 16
different sample ages were significantly different at 0.1% level. 17
18
Further investigations into the absence of dehydrogenase activity in the lower pH mixes, 19
which ought to encourage biological activity revealed two interesting findings. Dead burned 20
magnesia was found to interfere with the test result by inducing a similar colour change (pink 21
colouration) associated with TPF production, which is brought about by the action of 22
dehydrogenase enzymes in the assay. Thus, it apparently stimulates dehydrogenase activity. It 23
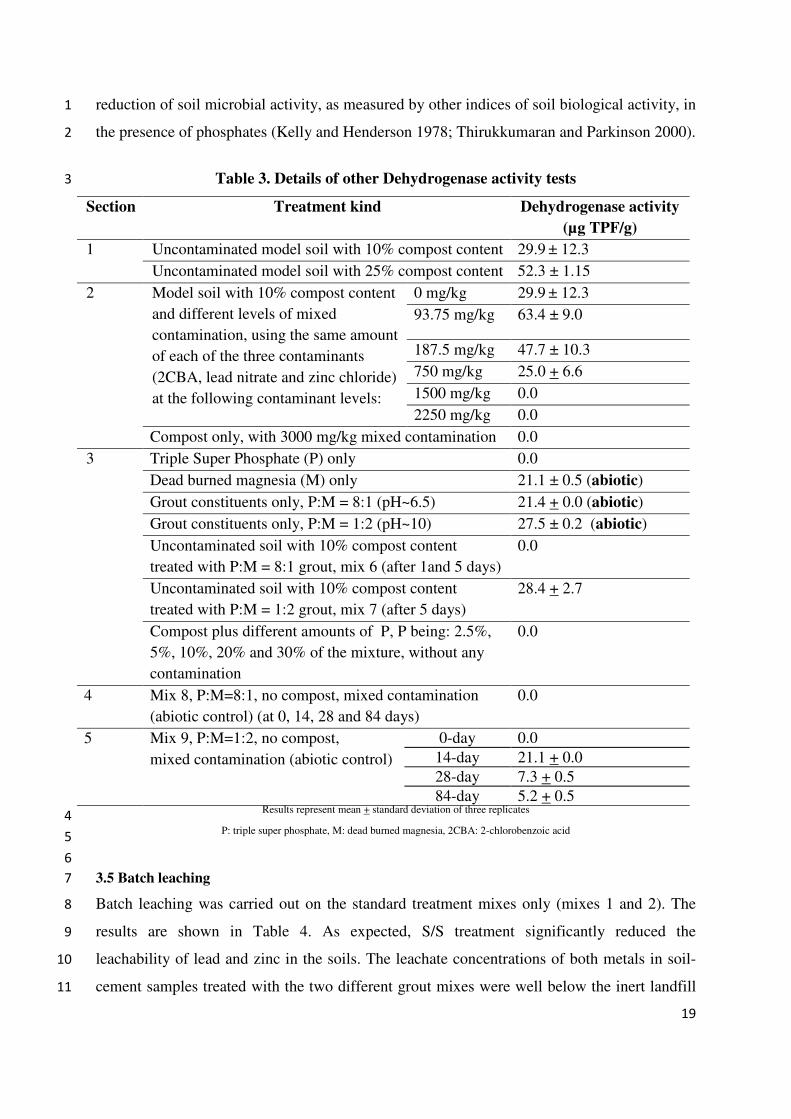
was also observed that TSP apparently inhibits soil dehydrogenase activity. The results of the 24
tests are shown in Table 3, section 3. The abiotic dehydrogenase activity due to magnesia 25
content was quantified to be about 21.1 µg TPF/g. Cement constituents (MgO and TSP) only, 26
in the ratio P:M=1:2 (pH ~10), had an increased amount of about 27.5 µg TPF/g, while the 27
cement formulation with pH ~ 6.5 (P:M=8:1) had an activity of 21.4 µg TPF/g. Tests on the 28
abiotic control with higher magnesia content showed a similar amount of the abiotic 29
dehydrogenase activity, which appeared to fade with time (Table 3, section 5). These results 30
suggest that the presence of dead burned magnesia or perhaps some impurities/compounds 31
within it stimulates soil dehydrogenase activity, though there are indications that the main 32
reaction product of the cementitious system, Ca-Struvite (Iyengar 2008: PhD thesis, 33
18
Cambridge University), further enhances the stimulation. A list of substances that could cause 1
a similar stimulation of soil dehydrogenase activity has been identified in the literature 2
(Weaver et al. 1994) but magnesium was not listed. The work of Takahashi and Weiner 3
(1980) which reported the stimulation of catalytic activity of horse liver aldehyde 4
dehydrogenase by magnesium ions is probably the only related case in the literature. 5
However, the steady state assay used in the said work did not involve soil. The results of this 6
study also show that the influence of pH noted by Mahmoud and Ghaly (2004), whereby high 7
pH environments (9.5 < pH < 13) can lead to non-enzymatic production of TPF in the TTC 8
dehydrogenase assay, does not seem to be responsible for the aforementioned abiotic 9
dehydrogenase activity. This is because both cement mixes, with pH 10 and 6.5, indicated the 10
non-enzymatic TPF production; hence, the abiotic dehydrogenase activity is due to the effect 11
of magnesia not pH. The results further indicate that the dehydrogenase activity observed in 12
the higher pH soil-cement mixes has a biotic and an abiotic component. 13
14
The investigations suggested that TSP apparently inhibits soil dehydrogenase activity, which 15
explains the absence of dehydrogenase activity in the lower pH soil-cement mixes. TSP was 16
found to inhibit dehydrogenase activity in pristine compost even at 2.5% TSP content in 17
compost-TSP mixture (Table 3, section 3). In the light of the above, it is interesting to note 18
that although the percentage of TSP in soil-cement samples with the higher pH was ~ 9%, 19
and that in the combination of only TSP and MgO (P:M=8:1), was 88.9%, dehydrogenase 20
activity was still observed in these mixtures. It is likely that this is due to the relative amounts 21
of magnesia and TSP in the said mixtures, as reaction between TSP and sufficient amount of 22
magnesia removes the inhibitory effect of TSP. Moreover, the results in section 3 of Table 3 23
show that the abiotic dehydrogenase activity was reduced when TSP was in greater amount 24
than magnesia. This is probably one of the first studies reporting inhibition of dehydrogenase 25
activity by TSP. It is in the literature that added phosphates stimulated soil dehydrogenase 26
activity, and although substances that seemed to inhibit the activity have been identified, TSP 27
is not listed (Weaver et al. 1994). A different phosphate source, potassium dihydrogen 28
phosphate (KH2PO4), was employed in a similar study (Harbottle and Al-Tabbaa 2008) but 29
no such inhibition was observed. However, the percentage of KH2PO4 was about 10% in the 30
said work, which is similar to the amount of TSP in the higher pH soil-cement mixes that 31
indicated dehydrogenase activity in this study. Furthermore, a few studies have reported 32
19
reduction of soil microbial activity, as measured by other indices of soil biological activity, in 1
the presence of phosphates (Kelly and Henderson 1978; Thirukkumaran and Parkinson 2000). 2
Table 3. Details of other Dehydrogenase activity tests 3
Section Treatment kind Dehydrogenase activity
(µg TPF/g)
1 Uncontaminated model soil with 10% compost content 29.9 ± 12.3
Uncontaminated model soil with 25% compost content 52.3 ± 1.15
2
Model soil with 10% compost content
and different levels of mixed
contamination, using the same amount
of each of the three contaminants
(2CBA, lead nitrate and zinc chloride)
at the following contaminant levels:
0 mg/kg 29.9 ± 12.3
93.75 mg/kg 63.4 ± 9.0
187.5 mg/kg 47.7 ± 10.3
750 mg/kg 25.0 + 6.6
1500 mg/kg 0.0
2250 mg/kg 0.0
Compost only, with 3000 mg/kg mixed contamination 0.0
3 Triple Super Phosphate (P) only 0.0
Dead burned magnesia (M) only 21.1 ± 0.5 (abiotic)
Grout constituents only, P:M = 8:1 (pH~6.5) 21.4 + 0.0 (abiotic)
Grout constituents only, P:M = 1:2 (pH~10) 27.5 ± 0.2 (abiotic)
Uncontaminated soil with 10% compost content
treated with P:M = 8:1 grout, mix 6 (after 1and 5 days)
0.0
Uncontaminated soil with 10% compost content
treated with P:M = 1:2 grout, mix 7 (after 5 days)
28.4 + 2.7
Compost plus different amounts of P, P being: 2.5%,
5%, 10%, 20% and 30% of the mixture, without any
contamination
0.0
4 Mix 8, P:M=8:1, no compost, mixed contamination
(abiotic control) (at 0, 14, 28 and 84 days)
0.0
5 Mix 9, P:M=1:2, no compost,
mixed contamination (abiotic control)
0-day 0.0
14-day 21.1 + 0.0
28-day 7.3 + 0.5
84-day 5.2 + 0.5 Results represent mean + standard deviation of three replicates
4
P: triple super phosphate, M: dead burned magnesia, 2CBA: 2-chlorobenzoic acid 5
6
3.5 Batch leaching 7
Batch leaching was carried out on the standard treatment mixes only (mixes 1 and 2). The 8
results are shown in Table 4. As expected, S/S treatment significantly reduced the 9
leachability of lead and zinc in the soils. The leachate concentrations of both metals in soil-10
cement samples treated with the two different grout mixes were well below the inert landfill 11

20
waste acceptance criteria (WAC) specified in the EU Landfill Directive (European 1
Commission 1999) at all sampling times. A comparison of the leachate concentration of zinc 2
in both grout systems indicates that the higher pH system achieved a slightly better 3
immobilisation of the contaminant than the lower pH system over time. It is common 4
knowledge that metal solubility usually increases with decreasing pH and this seems to have 5
been more pronounced in the grout systems, with zinc than lead. There was significant 6
difference (p = 0.002) in the leached concentrations of lead over time in both cement 7
formulations. The difference in the leached concentrations of zinc over time between both 8
cement formulations was significant at the 0.1% level. 9
10
Table 4. Batch leaching results for Lead and Zinc recovery 11
Mix description
Time (days) Time (days)
28 84 140 28 84 140
Lead leachate concentration
(mg/kg)
Zinc leachate concentration
(mg/kg)
1: P:M=8:1, 10% C,
mixed contamination
0.005
±
0.0005
0.002
±
0.0001
0.0095
±
0.0002
0.815
±
0.045
0.833
±
0.056
0.94
±
0.036
2: P:M=1:2, 10% C,
mixed contamination
0.0075
±
0.0008
0.018
±
0.003
0.0045
±
0.0006
0.34
±
0.0006
0.1
±
0.021
0.1
±
0.014 Maximum concentrations of lead and zinc expected are 1325 and 1016 mg/kg respectively
12 Waste acceptance criteria for inert landfills for lead and zinc are 0.5 and 4 mg/kg respectively
13 P: triple super phosphate, M: dead burned magnesia, C: compost
14
15
16
3.6 Linkage between dehydrogenase activity and concentration of contaminants 17
The results in Table 2 and Figure 3 show that loss of the organic contaminant in mix 5 (25% 18
compost content) was lower than that in mix 2 (10% compost content), although the 19
dehydrogenase assay showed that 25% compost content led to increased microbial activity 20
than 10% compost content. As mentioned earlier, this has been previously observed 21
(Harbottle 2006, unpublished results) but the exact mechanism responsible for the behaviour 22
is not clearly understood. Furthermore, loss of the organic contaminant in the lower pH mixes 23
in which dehydrogenase activity was inhibited was similar to that observed in the higher pH 24
mixes with evidence of microbial activity. Moreover, there was contaminant reduction in 25
abiotic controls too, and the contaminant concentrations recorded at the initial stage was 26
lower than those obtained in the standard mixes. However, the attenuation recorded in the 27

21
standard mixes at 84 days was significantly lower than that in the abiotic controls. In the 1
higher pH cement, the difference was significant at the 1% level; in the lower pH cement, it 2
was significant at the 5% level. Figure 3 shows that by 84 days, dehydrogenase activity in the 3
higher pH mixes had significantly declined such that data obtained at 140 days were only 4
slightly lower. This is corroborated by the results in Table 2 in which contaminant 5
concentrations at 84 and 140 days followed a similar trend. Dehydrogenase activity was also 6
observed for the first time in a set of soil-cement samples treated with the lower pH cement 7
(mix 3) at 140 days, when 44% of the organic was lost. These observations question the 8
influence of microbes in the contaminant reduction recorded, as well as the suitability of 9
dehydrogenase assay for evaluating microbial activity in the cementitious system. It also 10
suggests the likelihood of abiotic sources of contaminant loss. It is thought that contaminant 11
loss is due to the combined effect of biodegradation and other abiotic factors like chemical 12
fixation of the contaminant by interaction between the cement’s hydration product(s) and the 13
contaminant, especially as volatilisation is ruled out since 2CBA is non-volatile. The 14
potential for direct immobilisation of organic contaminants by S/S treatment processes, albeit 15
with low efficiency, has been reported (Paria and Yuet 2006). 16
The results of the batch leaching test suggest that the effect of heavy metals on biological 17
activity in the treated soils is ruled out, especially as leachability of the metals was 18
significantly reduced and also considering the fact that some of the treated soils indicated 19
biological activity. 20
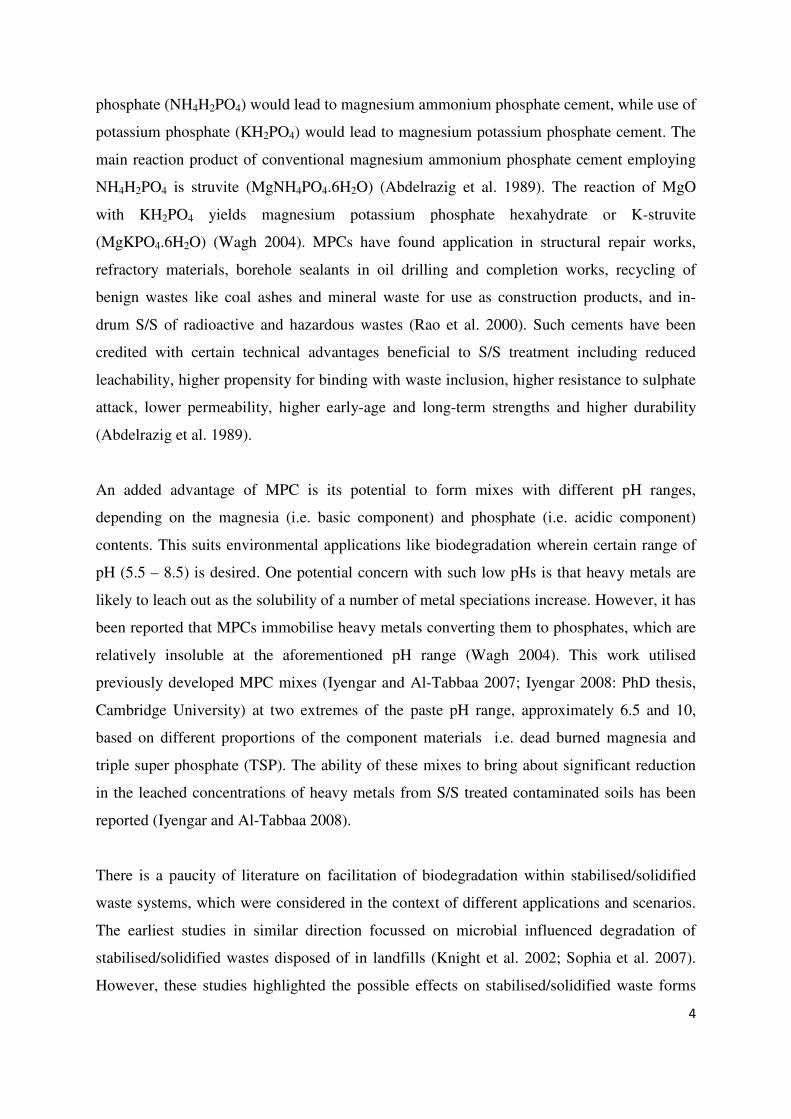
3.7 Engineering properties 21
The results of UCS, elastic stiffness and permeability are presented in Figures 4, 5 and 6 22
respectively. These tests sought to evaluate the effect of grout mix, mixed contamination and 23
increased compost content on the measured properties. Hence, only results of the standard 24
mixes (mixes 1 and 2), the mix with 25% compost content (mix 5) and those of the 25
uncontaminated control mixes for engineering behaviour (mix 6 and 7) are shown. 26
27
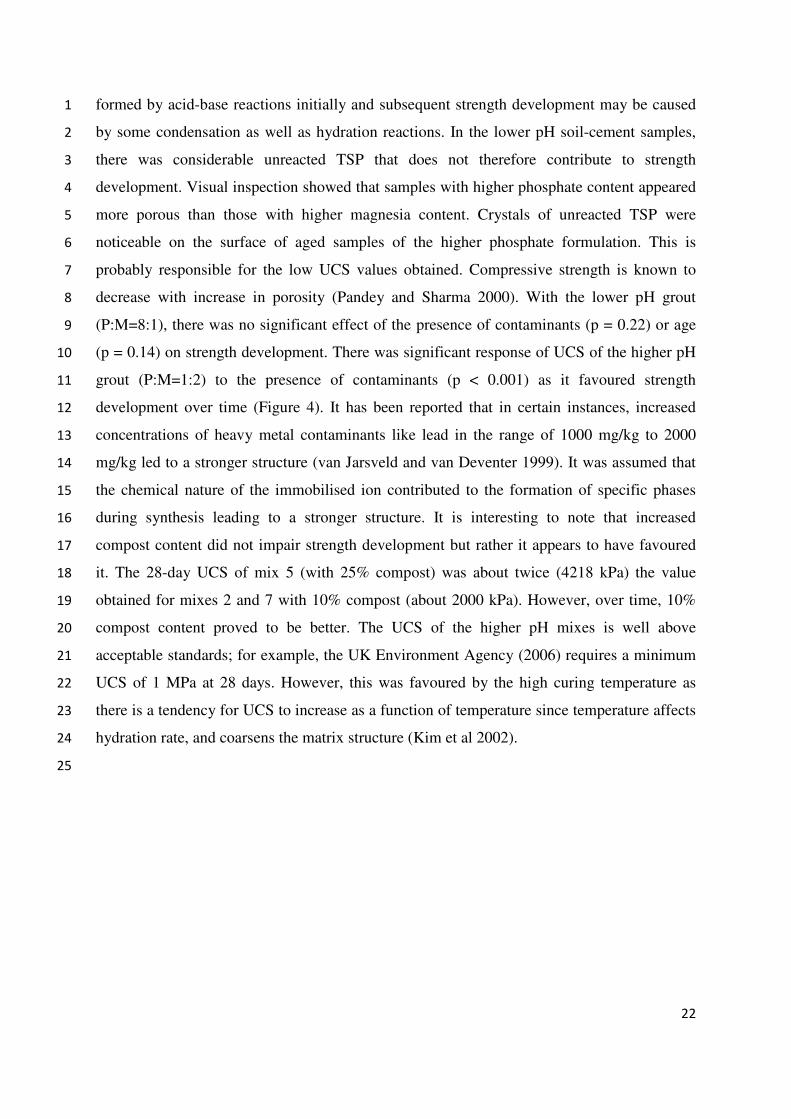
There was a marked difference (p < 0.001) in the UCS of soil-cement systems treated with 28
both cement formulations. Figure 4 shows that the higher pH grout system (mixes 2, 5, and 7) 29
had UCS values of at least 2000 kPa after 28 days of treatment while the UCS of the lower 30
pH grout system (mixes 1 and 6) was about 200 kPa. There was an appreciable increase in the 31
UCS of the former over time while that of the latter was fairly constant. MPCs are primarily 32
22
formed by acid-base reactions initially and subsequent strength development may be caused 1
by some condensation as well as hydration reactions. In the lower pH soil-cement samples, 2
there was considerable unreacted TSP that does not therefore contribute to strength 3
development. Visual inspection showed that samples with higher phosphate content appeared 4
more porous than those with higher magnesia content. Crystals of unreacted TSP were 5
noticeable on the surface of aged samples of the higher phosphate formulation. This is 6
probably responsible for the low UCS values obtained. Compressive strength is known to 7
decrease with increase in porosity (Pandey and Sharma 2000). With the lower pH grout 8
(P:M=8:1), there was no significant effect of the presence of contaminants (p = 0.22) or age 9
(p = 0.14) on strength development. There was significant response of UCS of the higher pH 10
grout (P:M=1:2) to the presence of contaminants (p < 0.001) as it favoured strength 11
development over time (Figure 4). It has been reported that in certain instances, increased 12
concentrations of heavy metal contaminants like lead in the range of 1000 mg/kg to 2000 13
mg/kg led to a stronger structure (van Jarsveld and van Deventer 1999). It was assumed that 14
the chemical nature of the immobilised ion contributed to the formation of specific phases 15
during synthesis leading to a stronger structure. It is interesting to note that increased 16
compost content did not impair strength development but rather it appears to have favoured 17
it. The 28-day UCS of mix 5 (with 25% compost) was about twice (4218 kPa) the value 18
obtained for mixes 2 and 7 with 10% compost (about 2000 kPa). However, over time, 10% 19
compost content proved to be better. The UCS of the higher pH mixes is well above 20
acceptable standards; for example, the UK Environment Agency (2006) requires a minimum 21
UCS of 1 MPa at 28 days. However, this was favoured by the high curing temperature as 22
there is a tendency for UCS to increase as a function of temperature since temperature affects 23
hydration rate, and coarsens the matrix structure (Kim et al 2002). 24
25
23
1
P: triple super phosphate, M: dead burned magnesia, C: compost 2
Figure 4. Unconfined Compressive Strength for the mixes 3
4
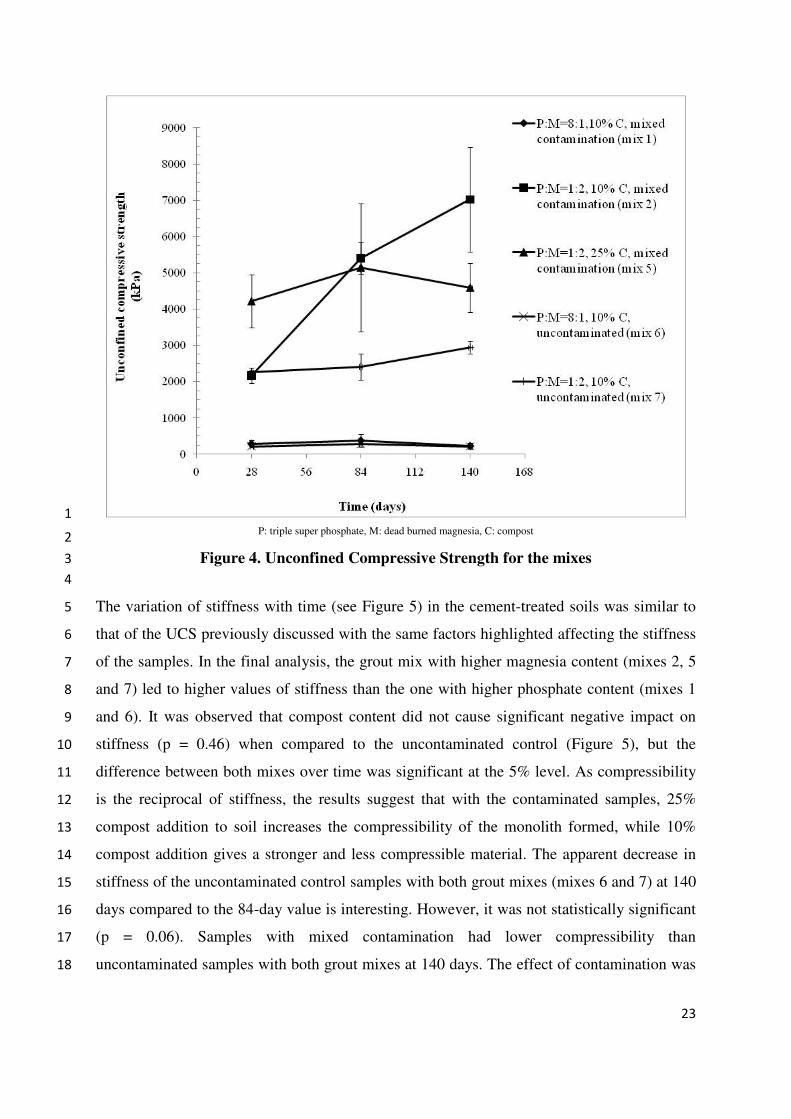
The variation of stiffness with time (see Figure 5) in the cement-treated soils was similar to 5
that of the UCS previously discussed with the same factors highlighted affecting the stiffness 6
of the samples. In the final analysis, the grout mix with higher magnesia content (mixes 2, 5 7
and 7) led to higher values of stiffness than the one with higher phosphate content (mixes 1 8
and 6). It was observed that compost content did not cause significant negative impact on 9
stiffness (p = 0.46) when compared to the uncontaminated control (Figure 5), but the 10
difference between both mixes over time was significant at the 5% level. As compressibility 11
is the reciprocal of stiffness, the results suggest that with the contaminated samples, 25% 12
compost addition to soil increases the compressibility of the monolith formed, while 10% 13
compost addition gives a stronger and less compressible material. The apparent decrease in 14
stiffness of the uncontaminated control samples with both grout mixes (mixes 6 and 7) at 140 15
days compared to the 84-day value is interesting. However, it was not statistically significant 16
(p = 0.06). Samples with mixed contamination had lower compressibility than 17
uncontaminated samples with both grout mixes at 140 days. The effect of contamination was 18

24
significant in the lower pH mixes (p = 0.012) but was not statistically significant (p = 0.08) in 1
the higher pH mixes. 2
3
4
P: triple super phosphate, M: dead burned magnesia, C: compost 5
Figure 5. Elastic stiffness for the mixes 6
7
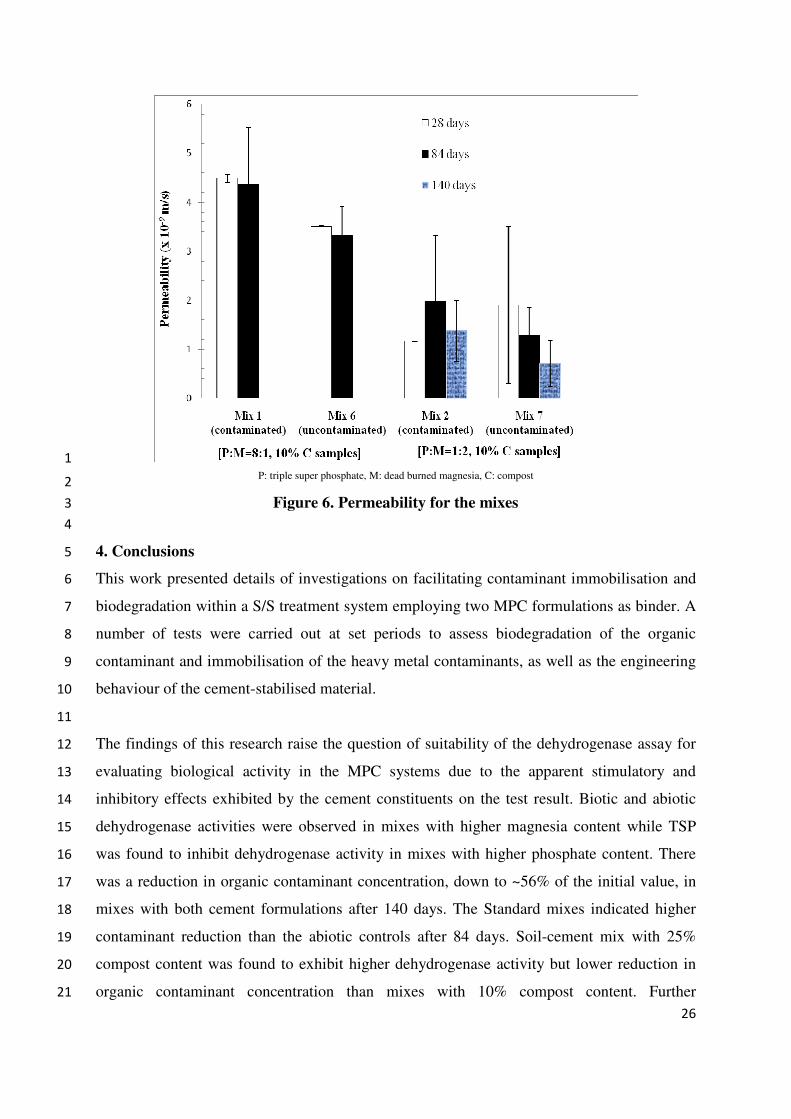
Figure 6 shows the permeability of soil-cement systems with both grout mixes, with and 8
without contaminants. These served to evaluate the effect of contaminant immobilisation and 9
degradation on permeability of the treated soils. The higher pH cement formulation, which 10
had clear evidence of microbial activity, was monitored for a longer period (140 days), while 11
the lower pH formulation without clear evidence of microbial activity was monitored for 84 12
days. Therefore, analysis for P:M=1:2 soil-cement systems (mixes 2 and 7) was done at 28, 13
84 and 140 days, while that of P:M=8:1 soil-cement systems (mixes 1 and 6) was done at 28 14
and 84 days. Samples treated with the higher phosphate content grout were found to be more 15
permeable (p = 0.005) than those treated with the higher magnesia content grout. This 16
corroborates the aforementioned UCS results. The permeability of the former was relatively 17
constant over time, around 4.49 x 10⁻⁹
m/s for contaminated samples, and 3.4 x 10⁻⁹
m/s for 18
uncontaminated samples, while that of the latter slightly varied over time with 140-day values 19
at 1.38 x 10⁻⁹
m/s and 0.72 x 10⁻⁹
m/s for contaminated and uncontaminated samples 20

25
respectively. There was significant difference in permeability due to the presence of 1
contaminants at 0.1% level in the higher pH mixes. In the lower pH mixes, the effect of 2
contaminants was significant at the 5% level. One of the contaminants used, zinc, has been 3
found to increase the permeability of Portland cement, probably by promoting ettringite 4
formation, and some other organics have been reported to increase the porosity, and hence 5
permeability of cement (Trussell and Spence 1994). Thus, the presence of contaminants is 6
likely to cause a significant difference in permeability. 7
8
In some mixes (e.g. mix 7, 28 days), there is high variation between the duplicate samples 9
tested. This is probably a reflection of imperfections in recreating conditions from one sample 10
to the next during sample preparation. Permeability measurement is sensitive to changes that 11
have occurred during the experiments, for example, different patterns of cracks being formed. 12
The differences in permeability between contaminated and uncontaminated samples confirm 13
the findings of Smith and Al-Tabbaa (2007) in which contaminated S/S treated soils 14
(contaminated with lead and zinc) were found to exhibit higher values of permeability than 15
their uncontaminated counterparts. These values conform to acceptable standards. The 16
permeability limit is usually taken as 10-9
m/s in the UK for in-ground treatment. The United 17
States Environmental Protection Agency tends to use the same value for disposal to landfill. 18
The same value is used in Canada for utilisation, while a higher limit value of 10-8
m/s is used 19
for disposal scenarios (Al-Tabbaa and Stegemann 2005). Generally, permeability 20
demonstrates a decreasing tendency as age increases (p < 0.001) save for the 28-day result of 21
mix 2. The decreasing tendency in permeability with age is possibly due to continued 22
condensation and hydration reactions in the cementitious system, as opposed to previous 23
studies where permeability was found to increase with age. However, it appears to support 24
the durability of MPCs reported in the literature. 25
26
26
1
P: triple super phosphate, M: dead burned magnesia, C: compost 2
Figure 6. Permeability for the mixes 3
4
4. Conclusions 5
This work presented details of investigations on facilitating contaminant immobilisation and 6
biodegradation within a S/S treatment system employing two MPC formulations as binder. A 7
number of tests were carried out at set periods to assess biodegradation of the organic 8
contaminant and immobilisation of the heavy metal contaminants, as well as the engineering 9
behaviour of the cement-stabilised material. 10
11
The findings of this research raise the question of suitability of the dehydrogenase assay for 12
evaluating biological activity in the MPC systems due to the apparent stimulatory and 13
inhibitory effects exhibited by the cement constituents on the test result. Biotic and abiotic 14
dehydrogenase activities were observed in mixes with higher magnesia content while TSP 15
was found to inhibit dehydrogenase activity in mixes with higher phosphate content. There 16
was a reduction in organic contaminant concentration, down to ~56% of the initial value, in 17
mixes with both cement formulations after 140 days. The Standard mixes indicated higher 18
contaminant reduction than the abiotic controls after 84 days. Soil-cement mix with 25% 19
compost content was found to exhibit higher dehydrogenase activity but lower reduction in 20
organic contaminant concentration than mixes with 10% compost content. Further 21

27
investigations are required to elucidate the influence of microbes in the observed contaminant 1
degradation. The leached concentrations of heavy metals were significantly reduced in both 2
cement formulations to <0.01 and 0.1 mg/kg for lead and zinc respectively. Generally, the 3
engineering behaviour of the treated soils conformed to acceptable standards. 4
5
The results of the study showed that with the appropriate magnesia content, contaminant 6
immobilisation and biodegradation could occur simultaneously without detrimental impacts 7
on the structural integrity of the stabilised material. The application of such MPC grout mix 8
appeared to stimulate microbial activity in a heavily contaminated soil and the fact that 9
microbes could still survive and remain active at pH levels slightly above the upper limit for 10
microbial survival (pH 8.5) further supports the view. 11
12
This work presented a useful assessment of the effectiveness of MPC formulations for 13
stabilisation/solidification of contaminated soils. Although, the research was limited to an 14
organic contaminant and two heavy metals, it has highlighted the strong and weak aspects of 15
the treatment system and areas that require further investigations. The results so far are 16
promising for the application of the cement in contaminated land remediation. 17
18
Acknowledgements 19
The authors are thankful to the Cambridge Commonwealth Trust for provision of financial 20
support to the first author. 21
22
References 23
Abdelrazig, B.E.I., Sharp, J.H., Ei-Jazairi, B. (1989). The microstructure and mechanical 24
properties of mortars made from magnesia-phosphate cement. Cement and Concrete 25
Research, 19, 247-258. 26
27
Al-Tabbaa, A., & Stegemann, J.A. (2005). Stabilisation/Solidification Treatment and 28
Remediation. Proceedings of the International Conference, April. London: Taylor & Francis. 29
30
Al-Tabbaa, A., Harbottle, M., & Evans, C. (2007). Robust sustainable technical solutions. In 31
T. Dixon, M. Raco, P. Catney, D. Lerner, (Eds), Sustainable brownfield regeneration: 32
Liveable places from problem spaces (pp 203 – 236). Oxford: Blackwell. 33
34
ASTM D 5084-03 (2003). Standard test methods for measurement of hydraulic conductivity 35
of saturated porous materials using a flexible wall permeameter. West Conshohocken: 36
American Society for Testing of Materials. 37
38
28
ASTM Test Method D1633-00 (2000). Standard method for compressive strength of moulded 1
soil–cement cylinders. West Conshohocken: American Society for Testing of Materials. 2
3
Baggi, G., Zangrossi, M. (1999). Degradation of chlorobenzoates in soil suspensions by 4
indigenous populations and a specialized organism: interactions between growth and non-5
growth substrates. FEMS Microbiology Ecology, 29: 311–318. 6
7
BS EN 12457: Part 2 (2002). Characterisation of waste – Leaching; Compliance test for 8
leaching of granular waste materials and sludges –Part 2: One stage batch test at a liquid to 9
solid ratio of 10 l/kg for materials with particle size below 4 mm (without or with size 10
reduction). London: British Standards Institution. 11
12
Cassida, L.E., Jr., Klein, D.A., Santoro, T. (1964). Soil dehydrogenase activity. Soil Science, 13
98, 371–376. 14
15
Environment Agency. (2006). Guidance for waste destined for disposal in landfills – 16
Interpretation of the waste acceptance requirements of the landfill (England and Wales) 17
Regulations 2002, version 2. London: Environment Agency. 18
19
European Commission (1999). Council Directive 1999/31/EC of 26 April 1999 on the 20
Landfill of Waste, 399L0031, Official Journal L 182, 16/07/1999. 21
22
Gong P., Sun, T-H., Beudert, G., Hahn, H.H. (1996). Ecological effects of combined organic 23
or inorganic pollution on soil microbial activities. Water, Air, and Soil Pollution, 96, 133-24
143. 25
26
Harbottle, M., & Al-Tabbaa, A. (2006). Combining stabilisation/solidification with 27
biodegradation to enhance long-term remediation performance. In L. Ubetini, (Ed). 28
Proceedings of the second IASTED International Conference on Advanced Technology in the 29
Environmental Field, (pp 222 – 227), February. Lanzarote, Spain: Acta Press. 30
31
Harbottle, M.J., Al-Tabbaa, A. (2008). Degradation of 2-chlorobenzoic acid in 32
stabilised/solidified soil systems. International Biodeterioration & Biodegradation, 61, 173-33
181. 34
35
Harkness, M.R., McDermott, J.B., Abramowicz, D.A., Salvo, J.J., Flanagan, W.P., Stephens, 36
M.L., et al. (1993). In situ stimulation of aerobic PCB biodegradation in Hudson river sediments. 37
Science, 259(5094), 503–507. 38
39
International Organisation for Standardisation (ISO) (2005). Soil quality: determination of 40
pH. ISO 10390. Geneva: ISO. 41
42
Iyengar, S., & Al-Tabbaa, A. (2008). Application of two novel magnesia-based cements in 43
stabilisation/solidification of contaminated soils. In Proceedings of GeoCongress: 44
Geotechnics of waste management and remediation, (pp. 716 - 723), March. New Orleans: 45
American Society of Civil Engineers. 46
47
29
Iyengar, S.R., Al-Tabbaa, A. (2007). Developmental study of a low-pH magnesium 1
phosphate cement for environmental applications. Environmental Technology, 28(12), 1387-2
1401. 3
4
Kabata-Pendias, A., & Mukherjee, A.B. (2007). Trace elements from soil to human. Berlin: 5
Springer. 6
7
Kelly, J.M., Henderson, G.S. (1978). Effects of nitrogen and phosphorus additions on 8
deciduous litter decomposition. Soil Science Society of America Journal, 42, 972–976. 9
10
Kim J-K, Han, S.H., Park, S.K. (2002). Effect of temperature and aging on the mechanical 11
properties of concrete, Part II. Prediction model. Cement and Concrete Research, 32, 1095–12
1100. 13
14
Knight, J., Cheeseman, C., Rogers, C. (2002). Microbial influenced degradation of solidified 15
waste binder. Waste Management, 22, 187–193. 16
17
Landner, L. & Reuther, R. (2004). Metals in society and in the environment. Dordrecht: 18
Kluwer Academic Publishers. 19
20
Lehning, A., Fock, U., Wittich, R-M., Timmis, K.N., Pieper, D.H. (1997). Metabolism of 21
chlorotoluenes by Burkholderia sp. strain PS12 and toluene dioxygenase of pseudomonas 22
putida F1: evidence for monooxygenation by toluene and chlorobenzene dioxygenases. 23
Applied and Environmental Microbiology, 63(5), 1974-1979. 24
25
Mahmoud, N.S., Ghaly, A.E. (2004). Influence of temperature and pH on the nonenzymatic 26
reduction of triphenyltetrazolium chloride. Biotechnology Progress, 20, 346–353. 27
28
Pandey, S.P., Sharma, R.L. (2000). The influence of mineral additives on the strength and 29
porosity of OPC mortar. Cement and Concrete Research, 30(1), 19–23. 30
31
Paria, S., Yuet, P.K. (2006). Solidification/stabilization of organic and inorganic 32
contaminants using Portland cement: a literature review. Environmental Reviews, 14, 217-33
255. 34
35
Pearl, M. (2000). Technologies for remediating radioactively contaminated land. Nuclear 36
Energy-Journal of the British Nuclear Energy Society, 39(2), 107-112. 37
38
Ragnvaldsson, D., Berglind, R., Tysklind, M., Leffler, P. (2007). Environmental hazard screening 39
of a metal polluted site using pressurized liquid extraction and two in vitro bioassays. Ambio, 40
36(6), 494-501. 41
42
Rao, A.J., Pagilla, K.R., Wagh, A.S. (2000). Stabilisation and solidification of metal-laden 43
wastes by compaction and magnesium phosphate-based binder. Journal of Air Waste 44
Management Association, 50(9), 1623-1631. 45
46
Ruthven, J.A., Cairns, J. (1973). Response of fresh-water protozoan artificial communities to 47
metals. Journal of Protozoology, 20, 127-135. 48
49
30
Smith, S.E., & Al-Tabbaa, A. (2007). Climate change impacts on the physical and 1
mechanical properties of stabilised/solidified contaminated soil. In Proceedings of the Hong 2
Kong Institution of Civil Engineers International Conference on Climate Change, May. 3
4
Sophia, A.C., Swaminathan, K., Sandhya, S. (2007). Microbially-influenced degradation of 5
solidified/stabilized metal waste. Bioresource Technology, 98, 2562–2567. 6
7
Stuczynski, T.I., McCarty, G.W., Siebielec, G. (2003). Response of soil microbiological 8
activities to cadmium, lead, and zinc salt amendments. Journal of Environmental Quality, 9
32,1346–1355. 10
11
Takahashi, K., Weiner, H. (1980). Magnesium stimulation of catalytic activity of horse liver 12
aldehyde dehydrogenase. Journal of Biological Chemistry, 255(17), 8206–8209. 13
14
Thirukkumaran, C.M., Parkinson, D. (2000). Microbial respiration, biomass, metabolic 15
quotient and litter decomposition in a lodgepole pine forest floor amended with nitrogen and 16
phosphorous fertilizers. Soil Biology and Biochemistry, 32, 59–66. 17
18
Trussell, S., Spence, R.D. (1994). A review of solidification/stabilisation interferences. Waste 19
Management, 14(6), 507–519. 20
21
van Jarsveld, J.G.S., van Deventer, J.S.J. (1999). The effect of metal contaminants on the 22
formation and properties of waste-based geopolymers. Cement and Concrete Research, 29, 23
1189–1200. 24
25
Van Gestal, M., Merckx, R., Vlassak, K. (1993). Microbial biomass and activity in soils with 26
fluctuating water contents. Geoderma, 56, 617-626. 27
28
van Oss, H.G., Padovani, A.C. (2003). Cement manufacture and the environment Part II: 29
Environmental challenges and opportunities. Journal of Industrial Ecology, 7(1), 93–126. 30
31
Wagh, A.S. (2004). Chemically bonded phosphate ceramics. Oxford: Elsevier. 32
33
Weaver, R.W., Angle, J.S., & Bottomley, P.S. (eds) (1994). Methods of soil analysis, Part 2 – 34
microbiological and biological and biochemical properties. Madison: Soil Science Society of 35
America Book series, No. 5. 36
37
Worrell, E., Price, L., Martin, N., Hendriks, C., Meida, L.O. (2001). Carbon dioxide 38
emissions from the global cement industry. Annual Review of Energy and Environment, 26, 39
303–329. 40