utica shale regression modeling 5_19 update
TRANSCRIPT

Analysis of Ohio Utica Shale Production & Model DevelopmentMatt Greenisen4/22/2015
UTICA SHALE REGRESSION MODELING
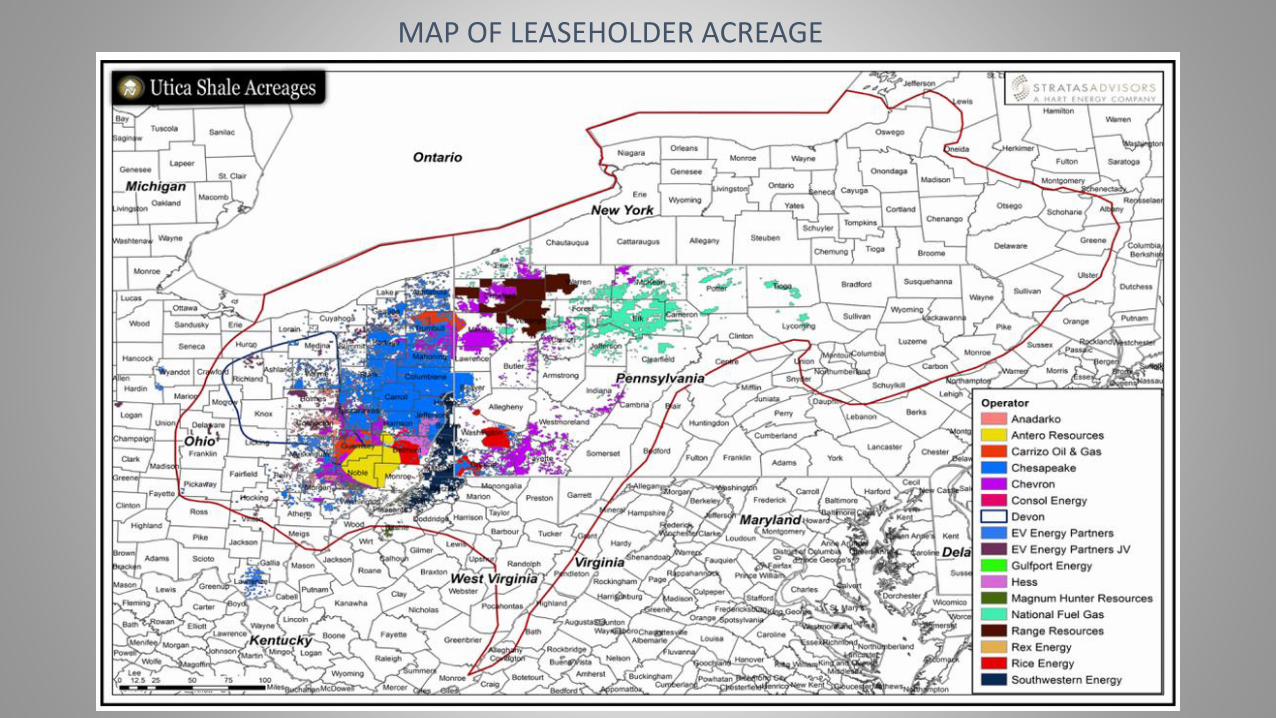
MAP OF LEASEHOLDER ACREAGE

MAP OF LEASEHOLDER ACREAGE
Total of ~4.8 Million Acres under Lease
Total of ~$12 Billion Spent5 YR Typical Lease Duration

OHIO GEOLOGICAL COLUMN

OVERALL METHODOLOGY OF ANALYSIS
1
2
4
3

SECTION #1WELL PRODUCTION DATA ANALYSIS/PREPARATION

WELL PRODUCTION DATA ANALYSIS/PREPARATION

WELL PRODUCTION DATA ANALYSIS/PREPARATION
API Well Number and Spatial Data Spatial and
Production
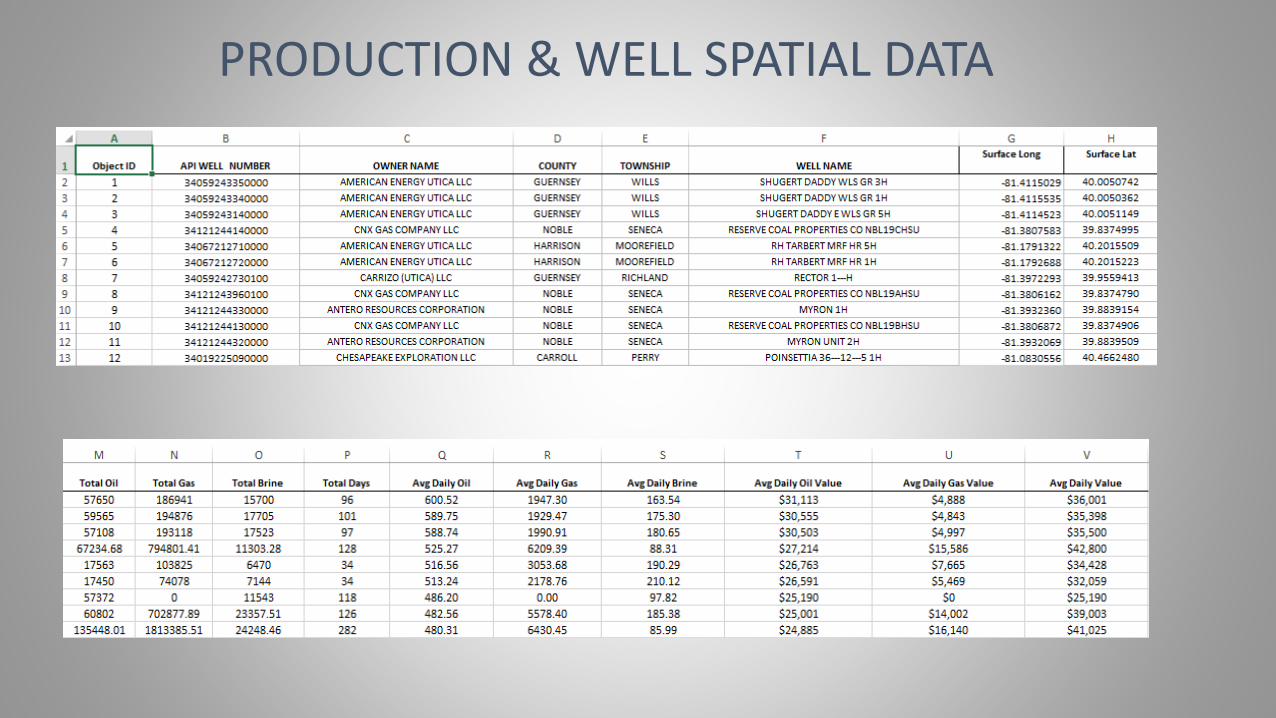
PRODUCTION & WELL SPATIAL DATA

WELL PRODUCTION AVG $/DAY
Georeferenced with Latitude and Longitude
data transformed
from NAD 1983 to WGS
1984
Well Productivity
Categorized by Avg $/Day
Based on Hub Prices (Wells in
Production > 30 Days)

MAP POLYGONS/INDEPENDENT VARIABLES

POTENTIAL ADDITIONAL INDEPENDENT VARIABLESFUTURE WORK AS OF 4/21/2015

GEOREFERENCED TIFF IMAGES TO OHIO TOWNSHIPS IN WGS 1984
DIGITIZED TO POLYGONAL SHAPE FILES

S2/S1/TOC RO POLYGONAL LAYER CLIPPED ODNR LAYER (2012 INCIDENT)

CLIPPED ODNR LAYERCAI & RO REGRESSION PETROLEUM TYPE
POLYGONAL LAYER

CLIPPED ODNR LAYERUTICA SHALE THICKNESS POLYGONAL LAYER

CLIPPED ODNR LAYERUTICA SHALE S2 MAXIMUM

CLIPPED ODNR LAYERUTICA SHALE S1 MAXIMUM

CLIPPED ODNR LAYERUTICA SHALE MAX TOTAL ORGANIC CARBON
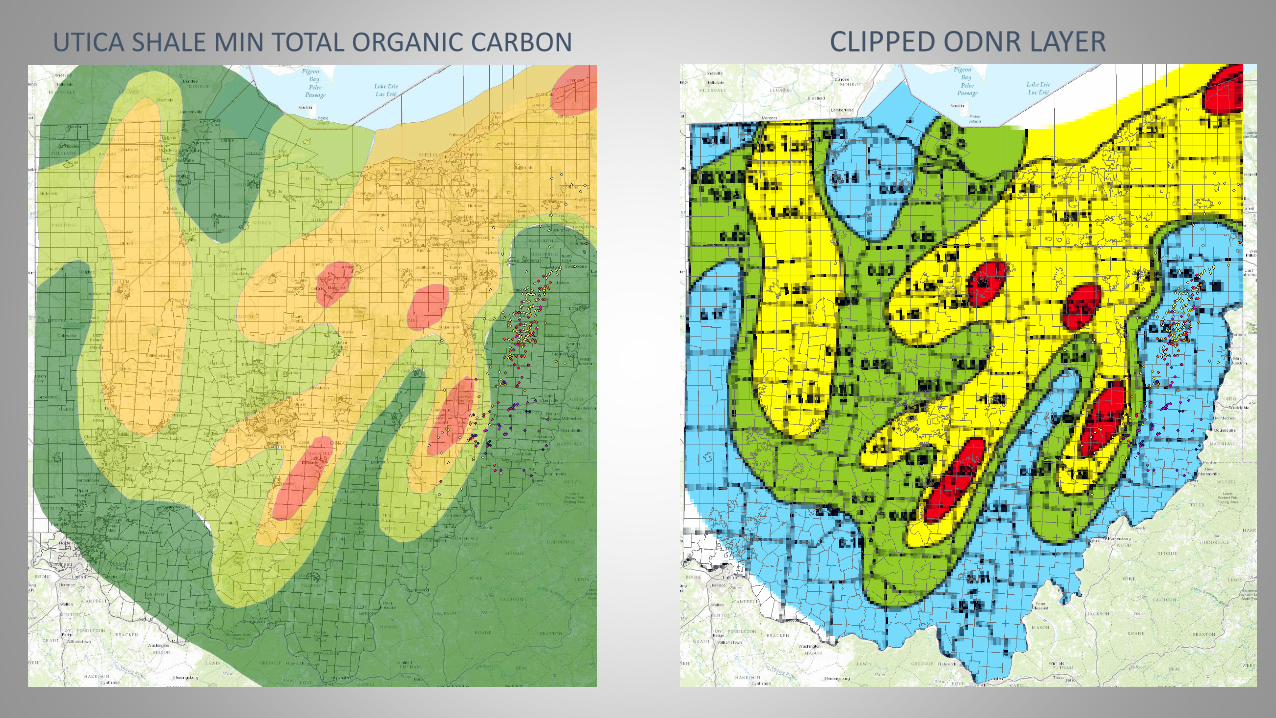
CLIPPED ODNR LAYERUTICA SHALE MIN TOTAL ORGANIC CARBON

CLIPPED ODNR LAYERUTICA SHALE AVG TOTAL ORGANIC CARBON

CLIPPED ODNR LAYERTOTAL ORGANIC CARBON 2013 PUBLICATION

CLIPPED ODNR LAYERSTACKED SHALE THICKNESS
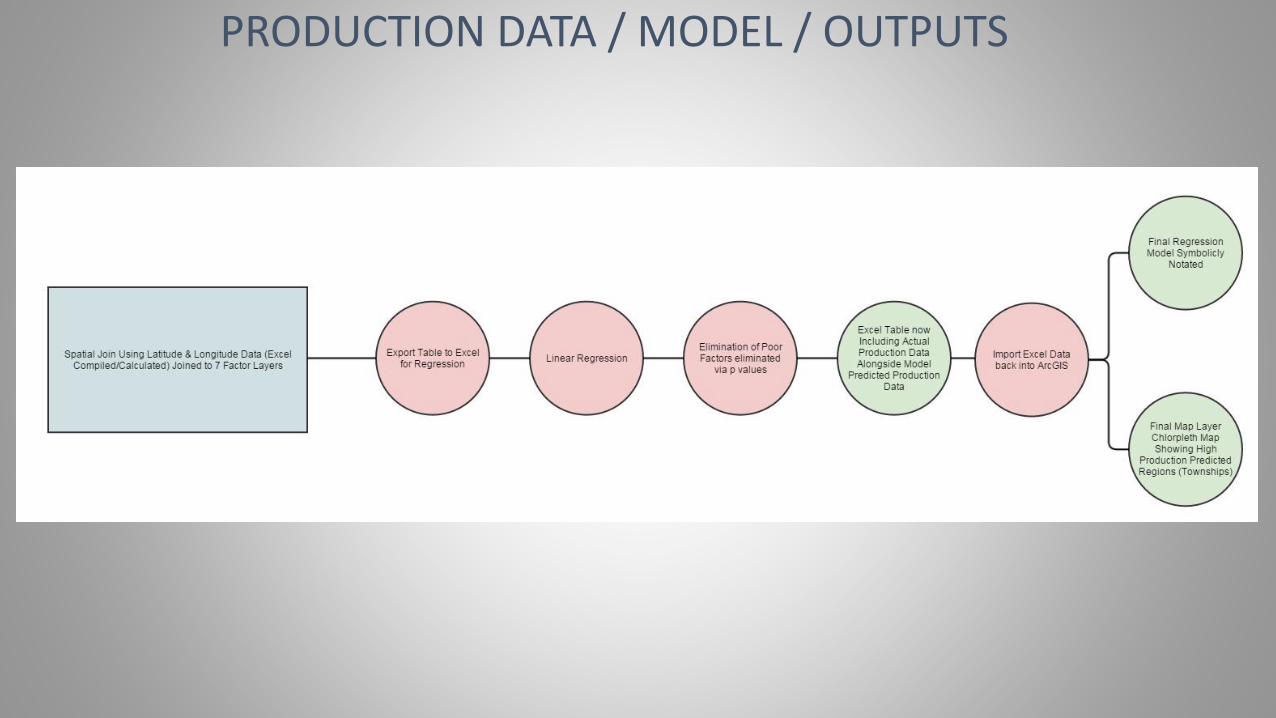
PRODUCTION DATA / MODEL / OUTPUTS

SPATIAL JOIN OF PRODUCTION DATA / POLYGONAL LAYER DATA & ELEVATION DATA

SPATIAL JOIN OF PRODUCTION DATA / POLYGONAL LAYER DATA & ELEVATION DATA (EXCEL)

SPATIAL JOIN OF PRODUCTION DATA / POLYGONAL LAYER DATA & ELEVATION DATA (EXCEL)
UtiOnlyThick Remains even though P value >0.05 as P values a
recalculated as each highest P value is
removed one at a time, final P value for
UtiOnlyThick was <0.05

SPATIAL JOIN OF PRODUCTION DATA / POLYGONAL LAYER DATA & ELEVATION DATA (EXCEL)
Factor Interactions and Composite Factors (e.g.
Productivity Index, Hydrogen Index) are excluded from this
presentation for simplicity purposes.
Coefficient sign utilized to refine zones (positive isolating higher classifications, negative isolating lower classifications within the individual layers/factors)

REGRESSION VALUES OVERLAID TO DEPICT HOT SPOTS WITHIN THE HIGHER LEVEL INTERSECTION8 LAYER/FACTOR INTERSECTION
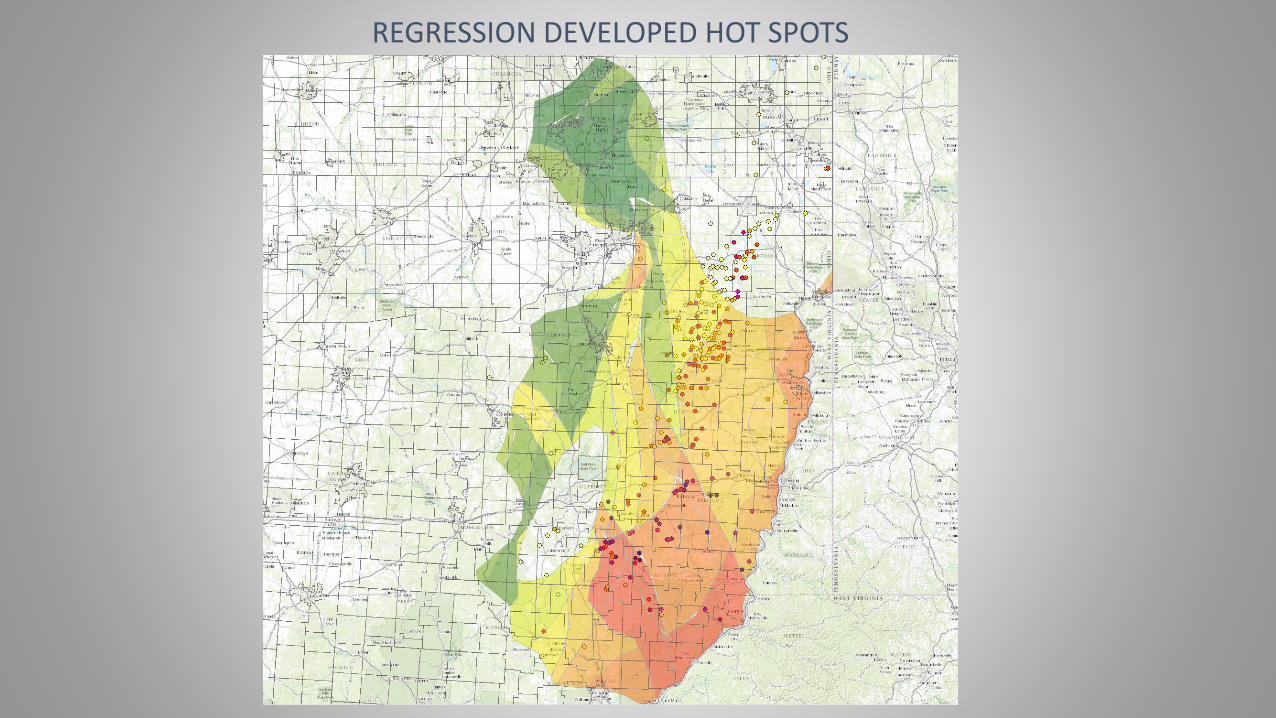
REGRESSION DEVELOPED HOT SPOTS

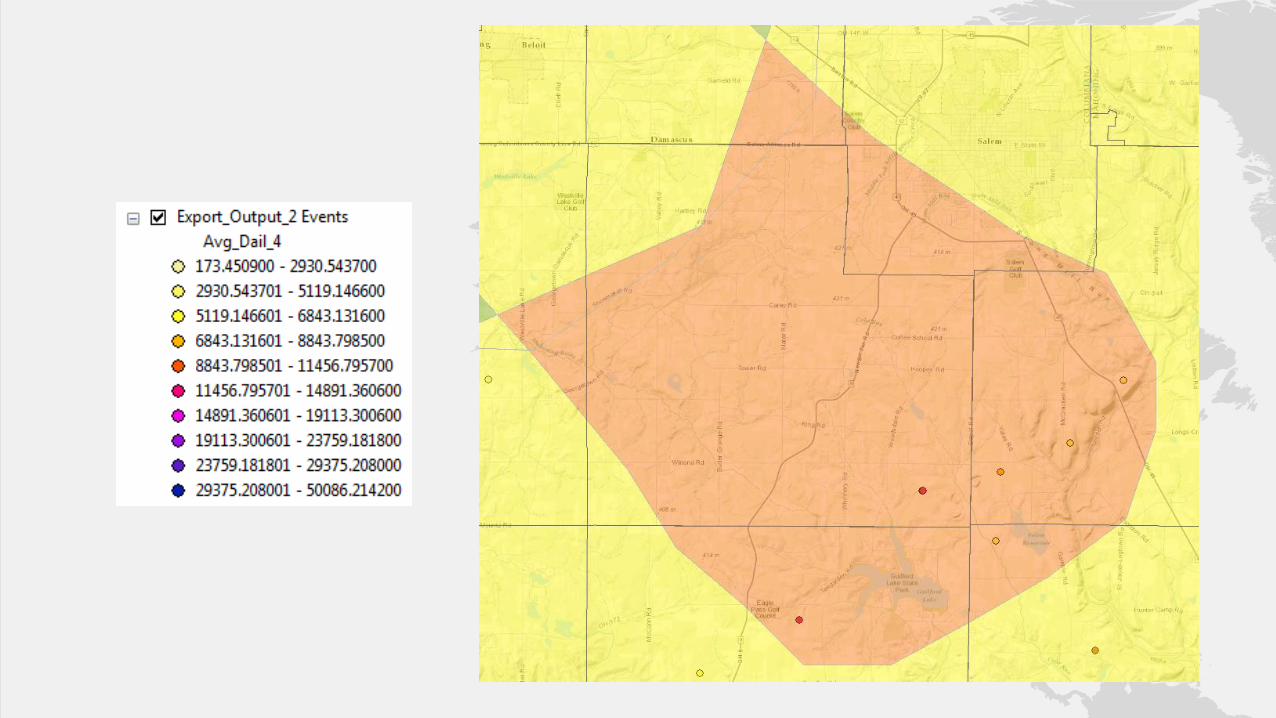
IMPROVED REGRESSION DEVELOPED HOT SPOTS
Further Factors known to provide better resolution and model quality include:
• Production Index (S1/[S1+S2])
• Horizontal Leg Length• Hydrogen Index
(S2/TOC)
These factors will be added in a later version of this regression –ongoing development/refinement – current R^2 ~50% w/further factors
TOC Layer Extent increased to cover the full scope of current acreage in play
Good improvement in demonstration of unique areas in Columbiana County (nice explanation of variation in that specific region geologically)


Low prices for natural gas and related liquids are forcing Chesapeake Energy Corp. to cut into Ohio operations.The Oklahoma-based energy giant said Wednesday that it intends to scale back its Utica Shale drilling in the coming months as profits drop and production continues to climb.Chesapeake will lower the number of drilling rigs in Ohio from five to two by the middle of the third quarter and will reduce the number of Ohio crews that hydraulically fracture, or frack, the rock from four to 2.5 for the rest of 2015, the company said in an earnings call with analysts and the media.Similar cuts are being made elsewhere, with some of the biggest reductions coming in the Eagle Ford Shale in Texas.The company needs to maintain two drilling rigs in order to hold on to its leased acreage in eastern Ohio.Chesapeake, the No. 1 player in the Utica Shale and No. 2 producer of natural gas in the United States, said it is has been verypleased with recent natural gas results in Columbiana County.Three wells recently completed there show significantly more potential than nine earlier-drilled wells, spokesman Chris Doyle said.The company is seeing a 50 percent improvement in production with the new wells, he said, and the company could expand its core area beyond neighboring Carroll County into Columbiana County.Chesapeake is continuing to expand its laterals in Ohio to produce better results, officials said.The company in 2012 averaged 4,900 feet per lateral. That grew to 5,150 feet in 2013 and to 6,200 feet in 2014.Laterals likely will average about 7,900 feet with 41 frack stages in 2015, about 27 percent longer than the previous year, officials said.Longer laterals with additional fracking pay out far more than shorter laterals, the company said.Extending Ohio laterals will cost Chesapeake more, however. It anticipates spending $8.2 million per well in 2015, up from $6.7 million in 2013 and $7.2 million in 2014.Chesapeake began production on 38 Utica wells in the first quarter. The average peak production of those wells was 1,272 barrelsof oil equivalents per day.Net production in the Utica Shale in the first quarter averaged about 110 thousand barrels of oil equivalents per day, an increase of 10 percent from the previous quarter, the company said.Chief Executive Officer Doug Lawler reported that despite commodity low prices, Chesapeake’s overall production grew by 14 percent in the first quarter compared to first-quarter 2014.Bob Downing can be reached at 330-996-3745
Chesapeake Energy to scale back Utica Shale drilling in eastern Ohio May 6th, 2015

End