utah economic indicators source: council of economic advisors' revenue assumptions committee
TRANSCRIPT
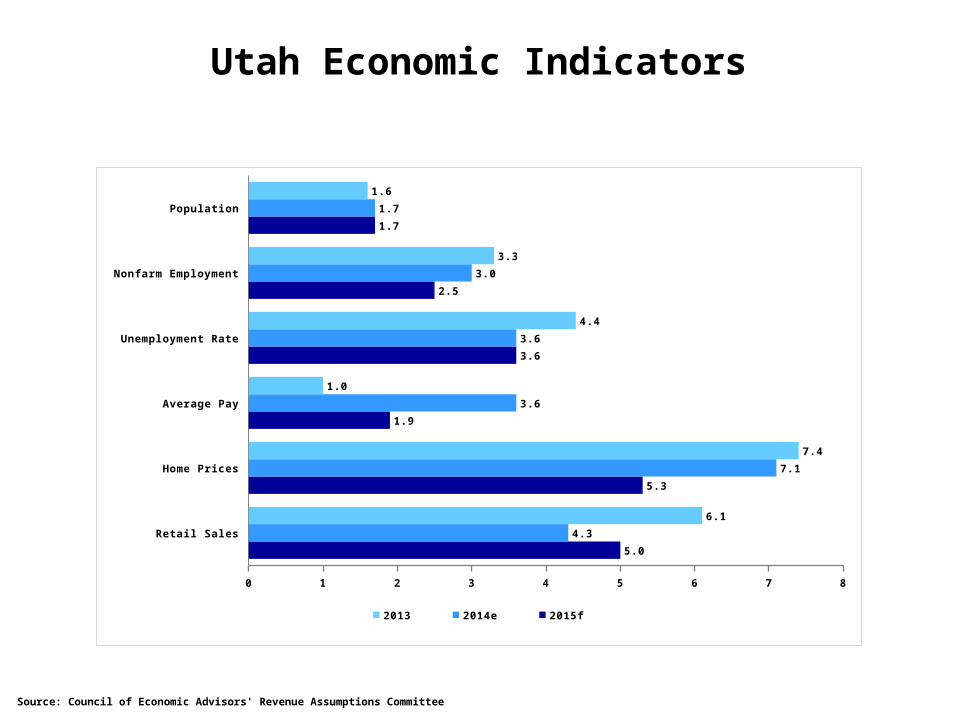
Utah Economic Indicators
Source: Council of Economic Advisors' Revenue Assumptions Committee
Retail Sales
Home Prices
Average Pay
Unemployment Rate
Nonfarm Employment
Population
0 1 2 3 4 5 6 7 8
5.0
5.3
1.9
3.6
2.5
1.7
4.3
7.1
3.6
3.6
3.0
1.7
6.1
7.4
1.0
4.4
3.3
1.6
2013 2014e 2015f
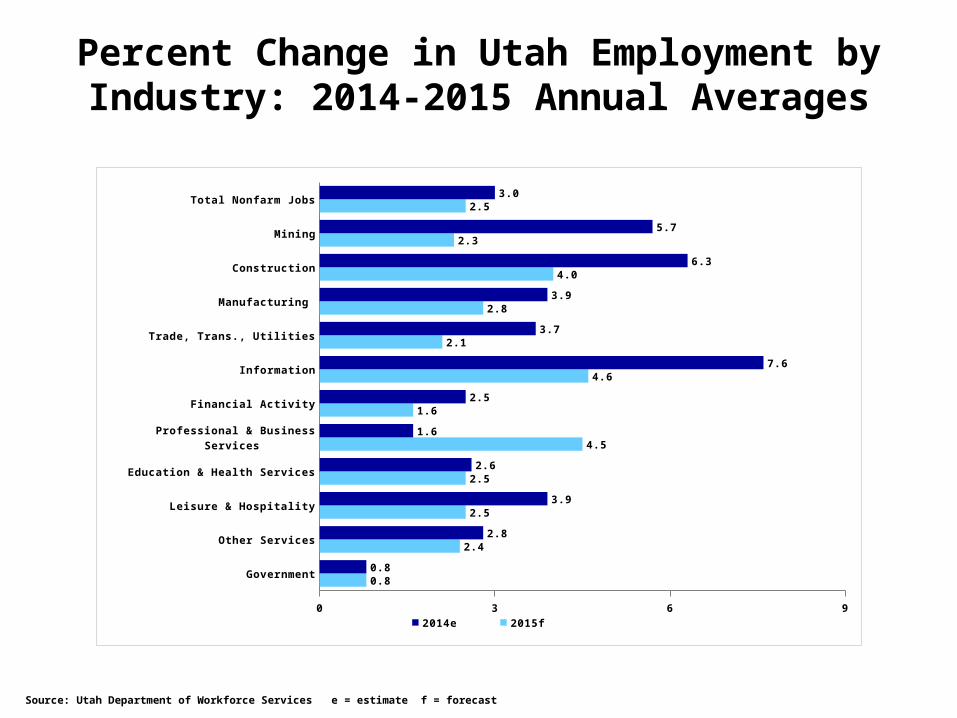
Percent Change in Utah Employment by Industry: 2014-2015 Annual Averages
Source: Utah Department of Workforce Services e = estimate f = forecast
Government
Other Services
Leisure & Hospitality
Education & Health Services
Professional & Business Services
Financial Activity
Information
Trade, Trans., Utilities
Manufacturing
Construction
Mining
Total Nonfarm Jobs
0 3 6 9
0.8
2.4
2.5
2.5
4.5
1.6
4.6
2.1
2.8
4.0
2.3
2.5
0.8
2.8
3.9
2.6
1.6
2.5
7.6
3.7
3.9
6.3
5.7
3.0
2014e 2015f
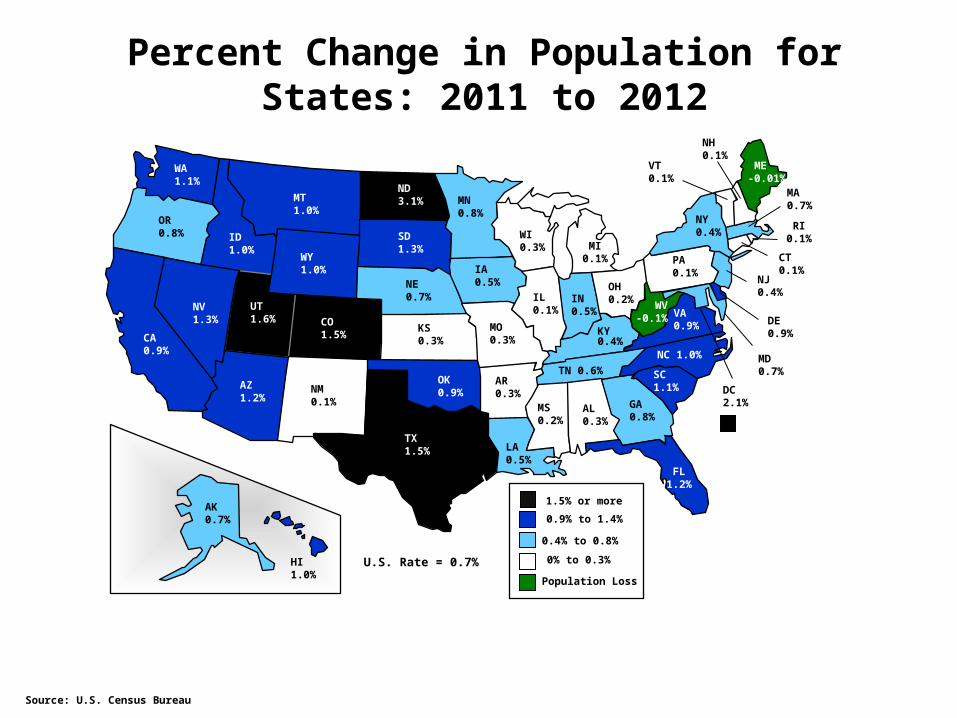
Population Loss
NM0.1%
UT1.6%
AZ1.2%
CA0.9%
NV1.3%
OR0.8%
TX1.5%
OK0.9%
CO1.5%
WA1.1%
ID1.0%
MT1.0%
WY1.0%
ND3.1%
SD1.3%
MN0.8%
NE0.7%
KS0.3%
IA0.5%
MO0.3%
AR0.3%
LA0.5%
WI0.3%
IL0.1%
IN0.5%
OH0.2%
FL1.2%
TN 0.6%
KY0.4%
MS0.2%
AL0.3%
GA0.8%
SC1.1%
NC 1.0%
VA0.9%
WV-0.1%
PA0.1%
NY0.4%
ME-0.01%
AK0.7%
HI1.0%
MA0.7%
VT0.1%
NH0.1%
RI0.1%
CT0.1%
NJ0.4%
DE0.9%
MD0.7%
MI0.1%
0.9% to 1.4%
0.4% to 0.8%
DC2.1%
1.5% or more
0% to 0.3%
Percent Change in Population for States: 2011 to 2012
U.S. Rate = 0.7%
Source: U.S. Census Bureau
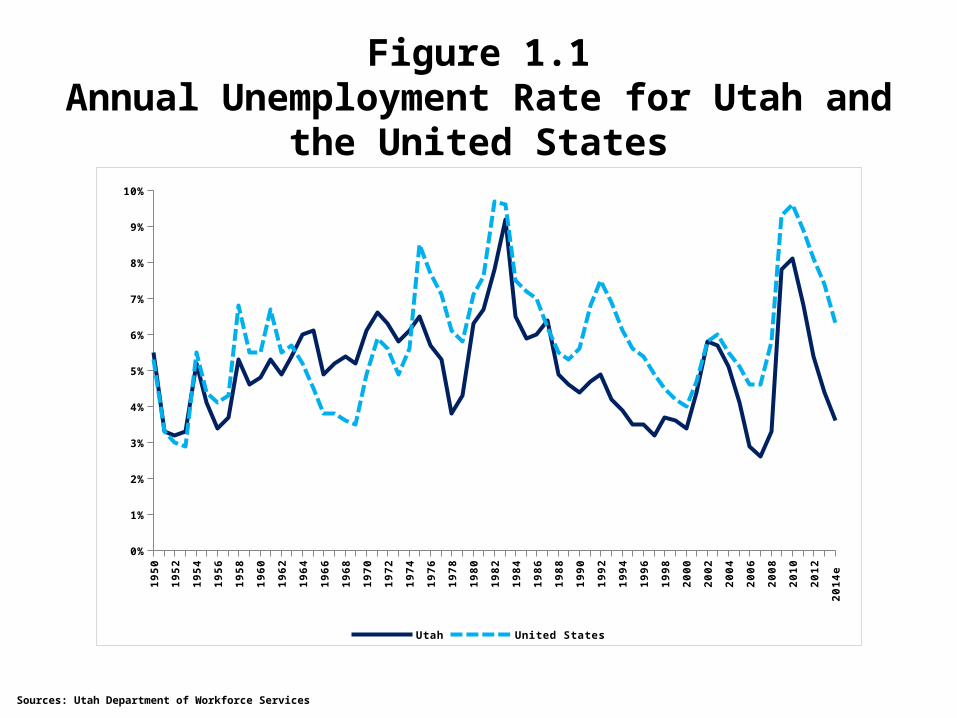
Figure 1.1Annual Unemployment Rate for Utah
and the United States1
95
0
19
52
19
54
19
56
19
58
19
60
19
62
19
64
19
66
19
68
19
70
19
72
19
74
19
76
19
78
19
80
19
82
19
84
19
86
19
88
19
90
19
92
19
94
19
96
19
98
20
00
20
02
20
04
20
06
20
08
20
10
20
12
20
14
e
0%
1%
2%
3%
4%
5%
6%
7%
8%
9%
10%
Utah United States
Sources: Utah Department of Workforce Services
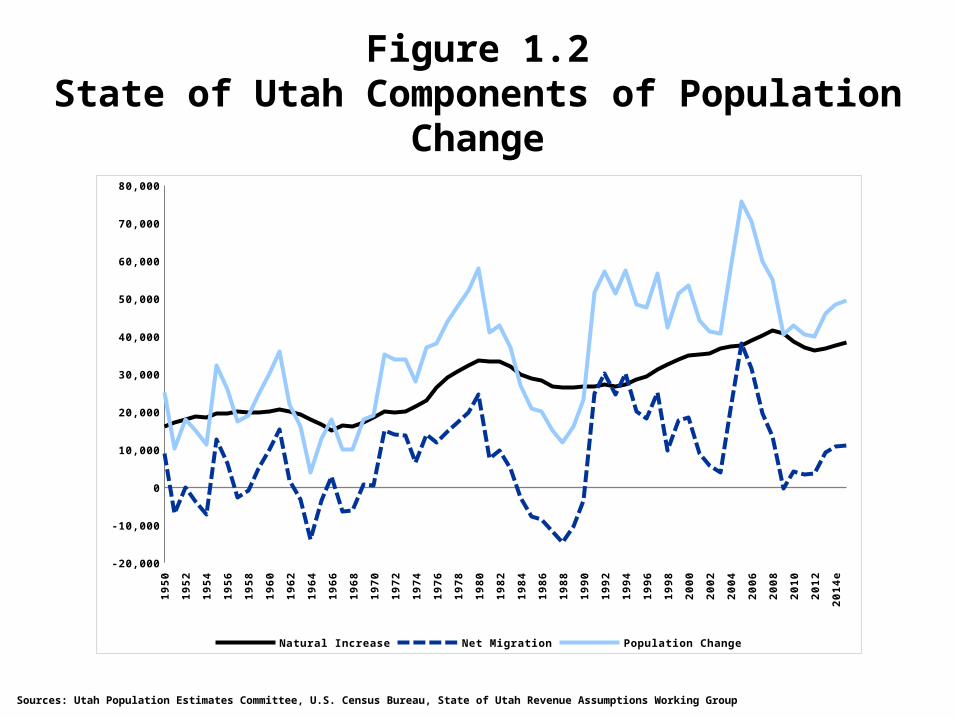
Figure 1.2State of Utah Components of Population
Change
Sources: Utah Population Estimates Committee, U.S. Census Bureau, State of Utah Revenue Assumptions Working Group
19
50
19
52
19
54
19
56
19
58
19
60
19
62
19
64
19
66
19
68
19
70
19
72
19
74
19
76
19
78
19
80
19
82
19
84
19
86
19
88
19
90
19
92
19
94
19
96
19
98
20
00
20
02
20
04
20
06
20
08
20
10
20
12
20
14
e
-20,000
-10,000
0
10,000
20,000
30,000
40,000
50,000
60,000
70,000
80,000
Natural Increase Net Migration Population Change
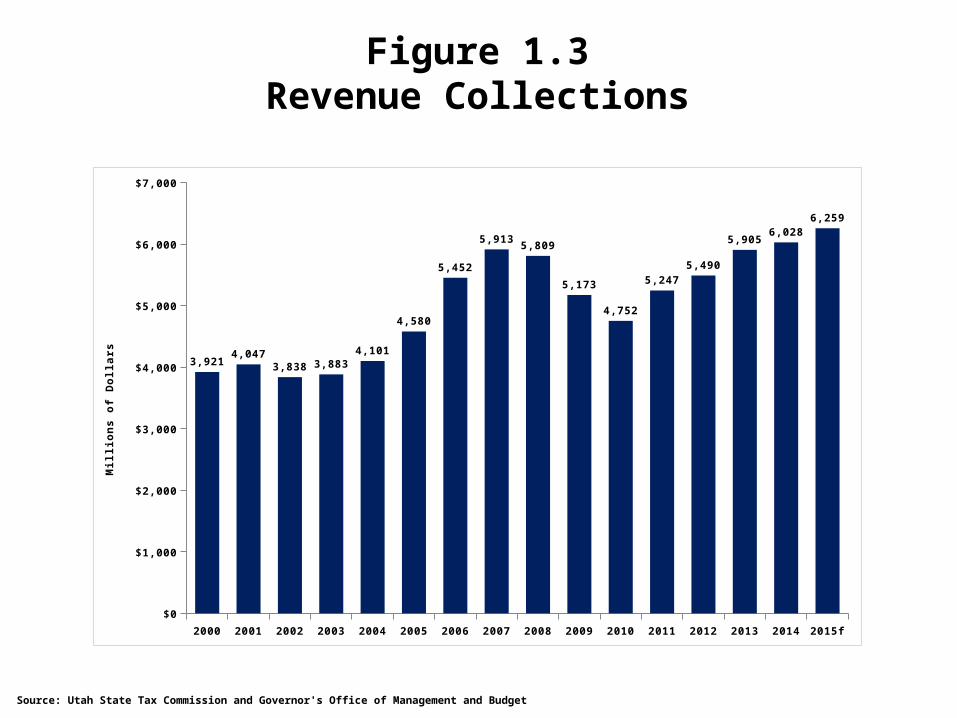
Figure 1.3Revenue Collections
2000 2001 2002 2003 2004 2005 2006 2007 2008 2009 2010 2011 2012 2013 2014 2015f
$0
$1,000
$2,000
$3,000
$4,000
$5,000
$6,000
$7,000
3,9214,047
3,838 3,8834,101
4,580
5,452
5,9135,809
5,173
4,752
5,2475,490
5,9056,028
6,259
Mil
lio
ns o
f D
oll
ars
Source: Utah State Tax Commission and Governor's Office of Management and Budget
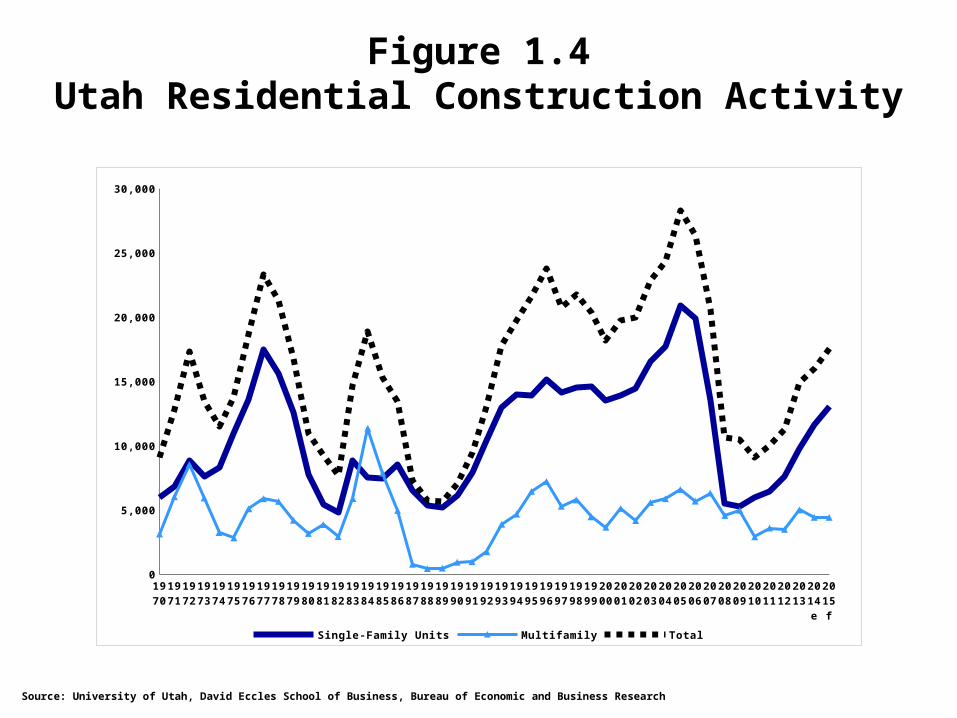
Figure 1.4Utah Residential Construction Activity
Source: University of Utah, David Eccles School of Business, Bureau of Economic and Business Research
1970
1971
1972
1973
1974
1975
1976
1977
1978
1979
1980
1981
1982
1983
1984
1985
1986
1987
1988
1989
1990
1991
1992
1993
1994
1995
1996
1997
1998
1999
2000
2001
2002
2003
2004
2005
2006
2007
2008
2009
2010
2011
2012
2013
2014e
2015f
0
5,000
10,000
15,000
20,000
25,000
30,000
Single-Family Units Multifamily Total
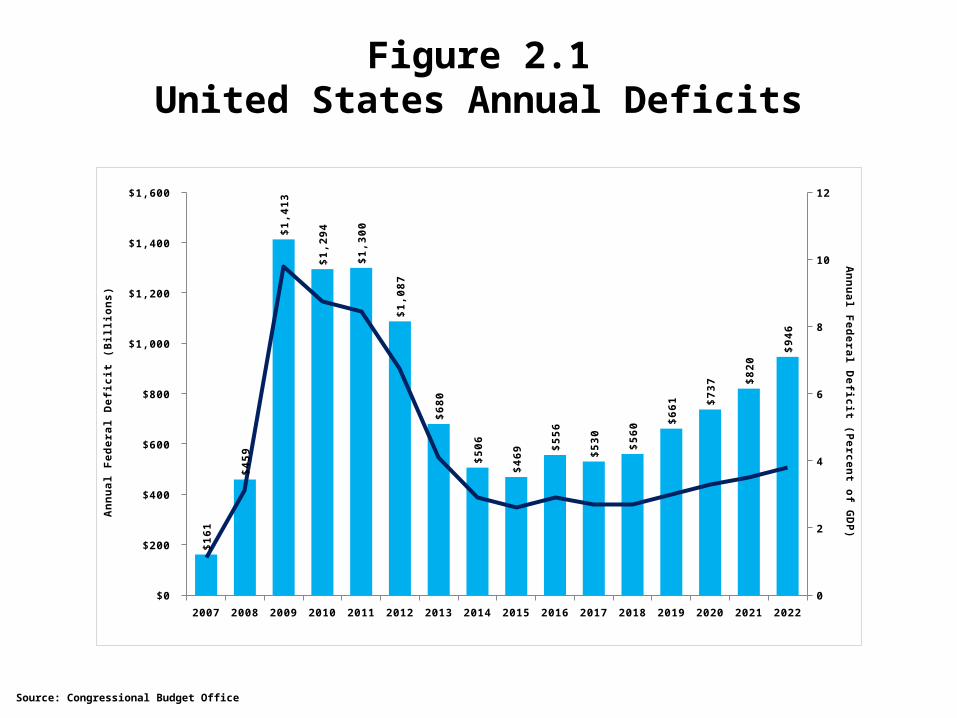
Figure 2.1United States Annual Deficits
2007 2008 2009 2010 2011 2012 2013 2014 2015 2016 2017 2018 2019 2020 2021 2022
$0
$200
$400
$600
$800
$1,000
$1,200
$1,400
$1,600
0
2
4
6
8
10
12$
16
1
$4
59
$1
,41
3
$1
,29
4
$1
,30
0
$1
,08
7
$6
80
$5
06
$4
69
$5
56
$5
30
$5
60
$6
61
$7
37
$8
20
$9
46
An
nu
al
Fed
era
l D
efi
cit
(B
illi
on
s)
An
nu
al F
ed
era
l Defi
cit (P
erc
en
t of G
DP
)
Source: Congressional Budget Office
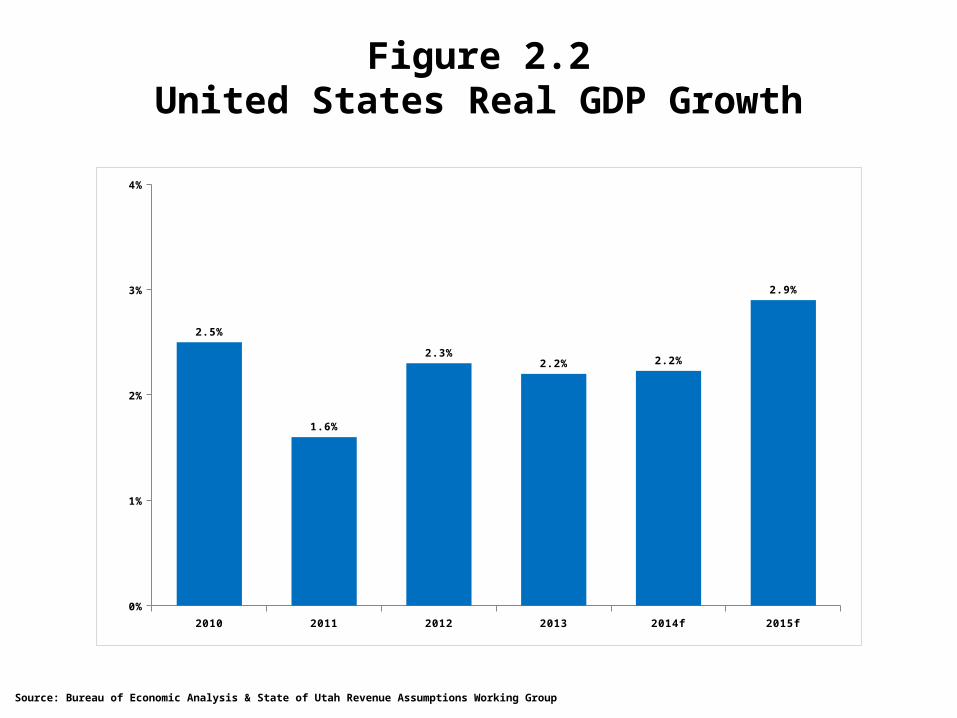
Figure 2.2United States Real GDP Growth
2010 2011 2012 2013 2014f 2015f
0%
1%
2%
3%
4%
2.5%
1.6%
2.3%2.2% 2.2%
2.9%
Source: Bureau of Economic Analysis & State of Utah Revenue Assumptions Working Group
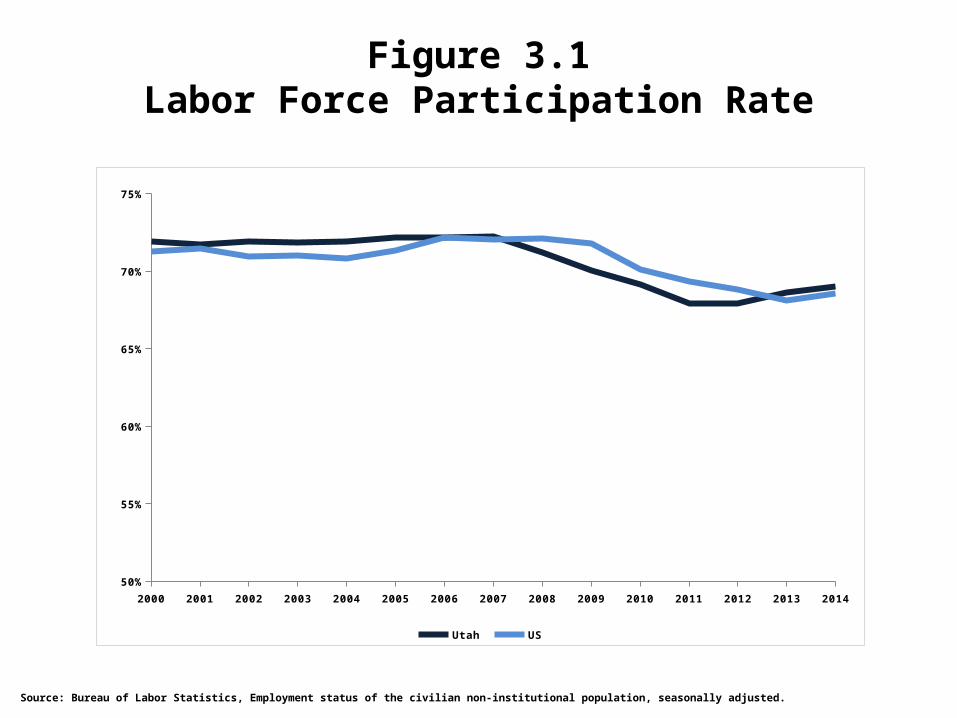
Figure 3.1Labor Force Participation Rate
2000 2001 2002 2003 2004 2005 2006 2007 2008 2009 2010 2011 2012 2013 2014
50%
55%
60%
65%
70%
75%
Utah US
Source: Bureau of Labor Statistics, Employment status of the civilian non-institutional population, seasonally adjusted.
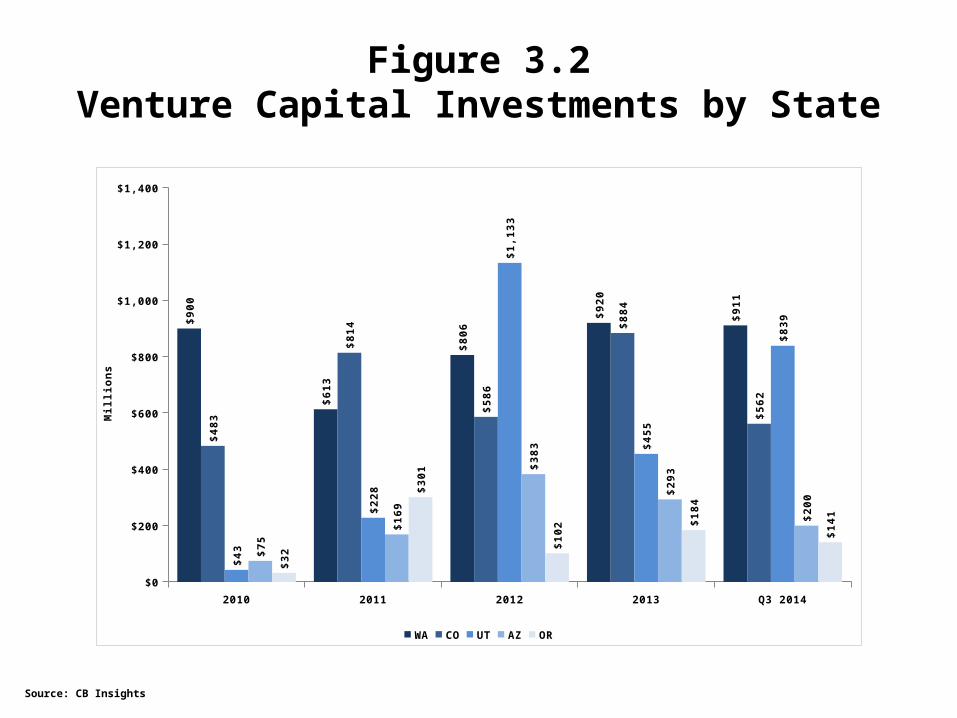
Figure 3.2Venture Capital Investments by State
Source: CB Insights
2010 2011 2012 2013 Q3 2014
$0
$200
$400
$600
$800
$1,000
$1,200
$1,400$
90
0
$6
13
$8
06
$9
20
$9
11
$4
83
$8
14
$5
86
$8
84
$5
62
$4
3
$2
28
$1
,13
3
$4
55
$8
39
$7
5
$1
69
$3
83
$2
93
$2
00
$3
2
$3
01
$1
02 $1
84
$1
41
WA CO UT AZ OR
Mil
lio
ns
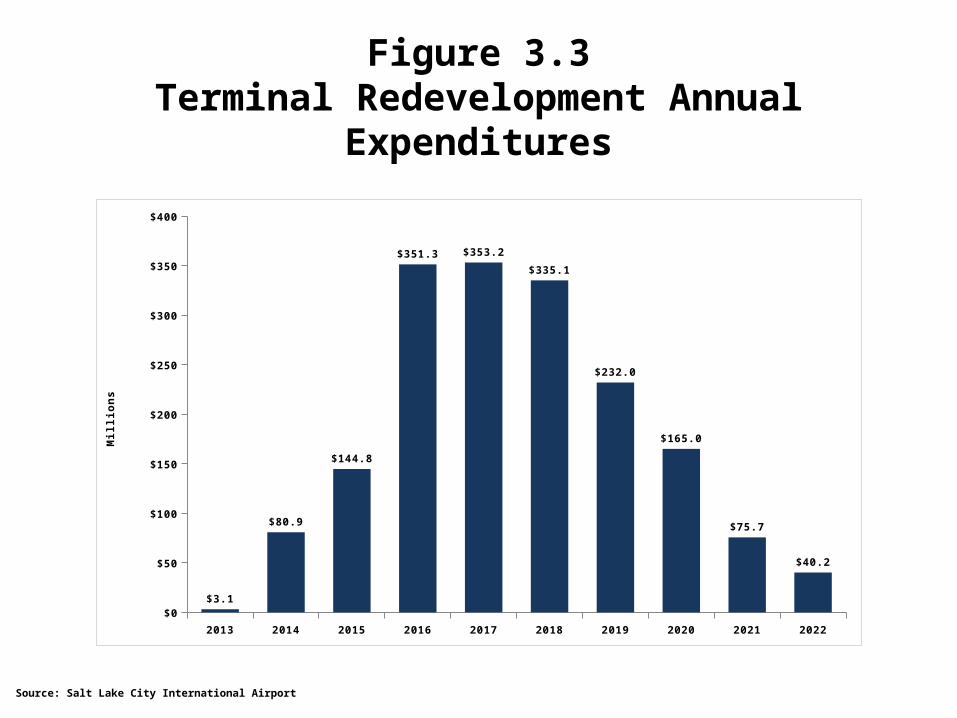
Figure 3.3Terminal Redevelopment Annual
Expenditures
Source: Salt Lake City International Airport
2013 2014 2015 2016 2017 2018 2019 2020 2021 2022
$0
$50
$100
$150
$200
$250
$300
$350
$400
$3.1
$80.9
$144.8
$351.3 $353.2
$335.1
$232.0
$165.0
$75.7
$40.2
Mil
lio
ns
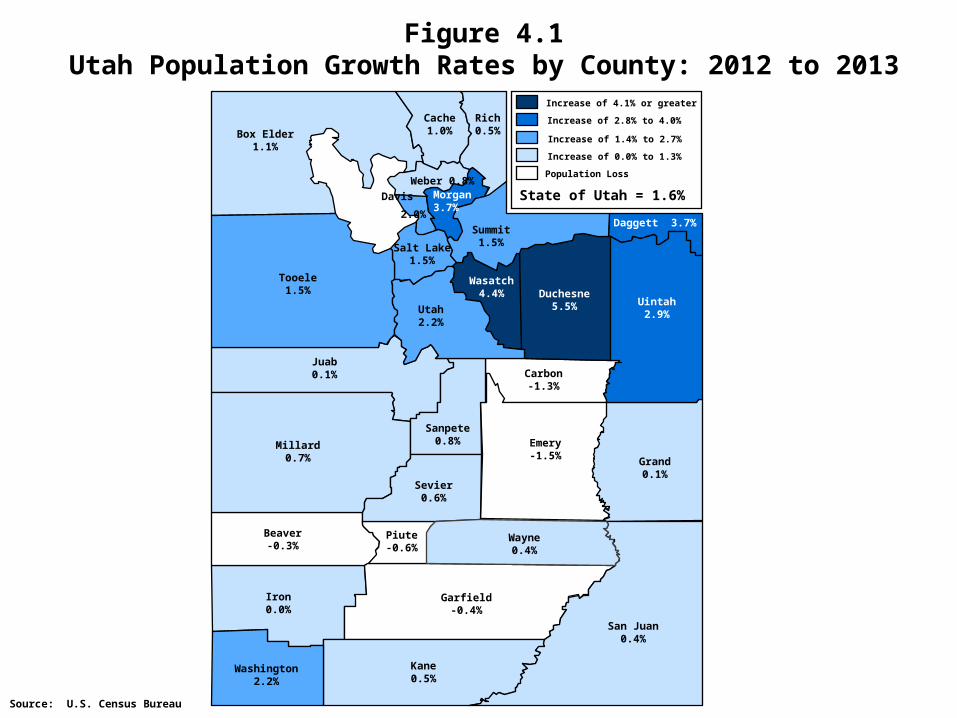
Figure 4.1Utah Population Growth Rates by County: 2012 to 2013
Source: U.S. Census Bureau
Box Elder1.1%
Cache1.0%
Rich0.5%
Weber 0.8%
Tooele1.5%
Salt Lake1.5%
Morgan3.7%
Summit1.5%
Daggett 3.7%
Utah2.2%
Wasatch4.4% Duchesne
5.5% Uintah2.9%
Juab0.1%
Sanpete0.8%
Carbon-1.3%
Emery-1.5% Grand
0.1%
Millard0.7%
Piute-0.6%
Garfield-0.4%
Sevier0.6%
Wayne0.4%
San Juan0.4%
Iron0.0%
Beaver-0.3%
Washington2.2%
Kane0.5%
Davis
2.0%
State of Utah = 1.6%
Increase of 1.4% to 2.7%
Population Loss
Increase of 4.1% or greater
Increase of 2.8% to 4.0%
Increase of 0.0% to 1.3%

Figure 4.2State of Utah Components of Population
Change
Source: Utah Population Estimates Committee, U.S. Census Bureau, State of Utah Revenue Assumptions Working Group
19
50
19
52
19
54
19
56
19
58
19
60
19
62
19
64
19
66
19
68
19
70
19
72
19
74
19
76
19
78
19
80
19
82
19
84
19
86
19
88
19
90
19
92
19
94
19
96
19
98
20
00
20
02
20
04
20
06
20
08
20
10
20
12
20
14
e
-20,000
-10,000
0
10,000
20,000
30,000
40,000
50,000
60,000
70,000
80,000
Natural Increase Net Migration Population Change
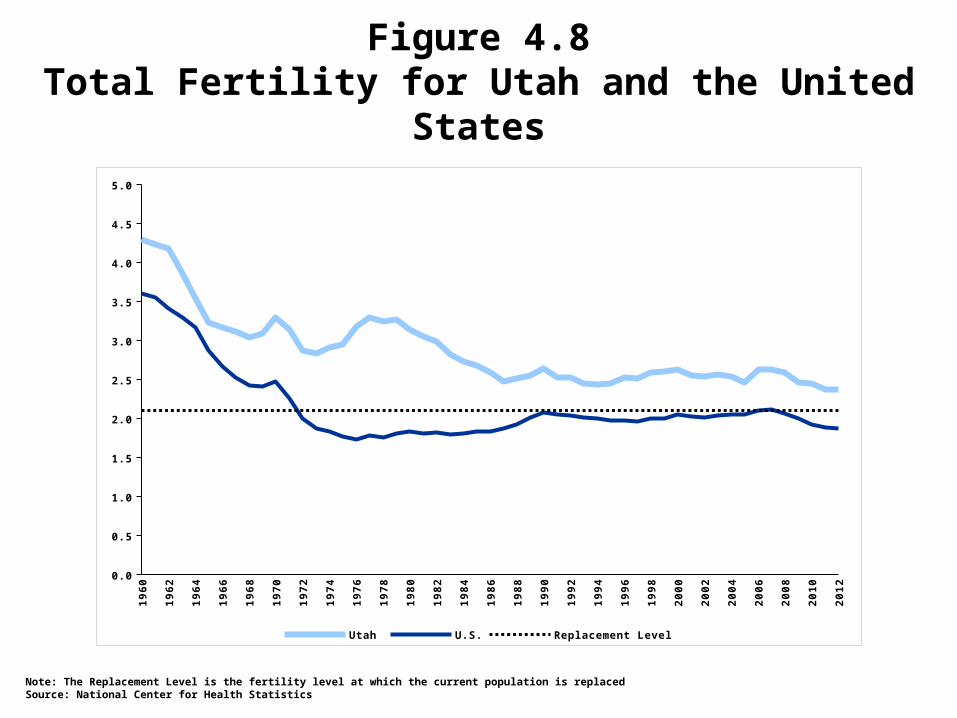
Note: The Replacement Level is the fertility level at which the current population is replacedSource: National Center for Health Statistics
Figure 4.8Total Fertility for Utah and the United States
19
60
19
61
19
62
19
63
19
64
19
65
19
66
19
67
19
68
19
69
19
70
19
71
19
72
19
73
19
74
19
75
19
76
19
77
19
78
19
79
19
80
19
81
19
82
19
83
19
84
19
85
19
86
19
87
19
88
19
89
19
90
19
91
19
92
19
93
19
94
19
95
19
96
19
97
19
98
19
99
20
00
20
01
20
02
20
03
20
04
20
05
20
06
20
07
20
08
20
09
20
10
20
11
20
12
0.0
0.5
1.0
1.5
2.0
2.5
3.0
3.5
4.0
4.5
5.0
Utah U.S. Replacement Level
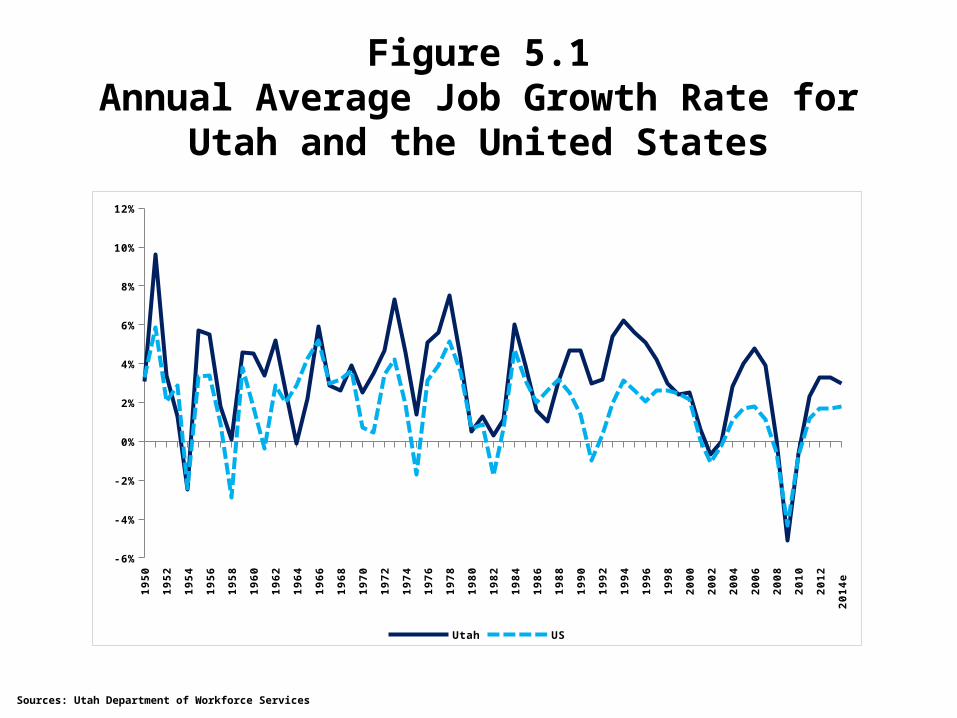
Figure 5.1Annual Average Job Growth Rate for
Utah and the United States1
95
0
19
52
19
54
19
56
19
58
19
60
19
62
19
64
19
66
19
68
19
70
19
72
19
74
19
76
19
78
19
80
19
82
19
84
19
86
19
88
19
90
19
92
19
94
19
96
19
98
20
00
20
02
20
04
20
06
20
08
20
10
20
12
20
14
e
-6%
-4%
-2%
0%
2%
4%
6%
8%
10%
12%
Utah US
Sources: Utah Department of Workforce Services
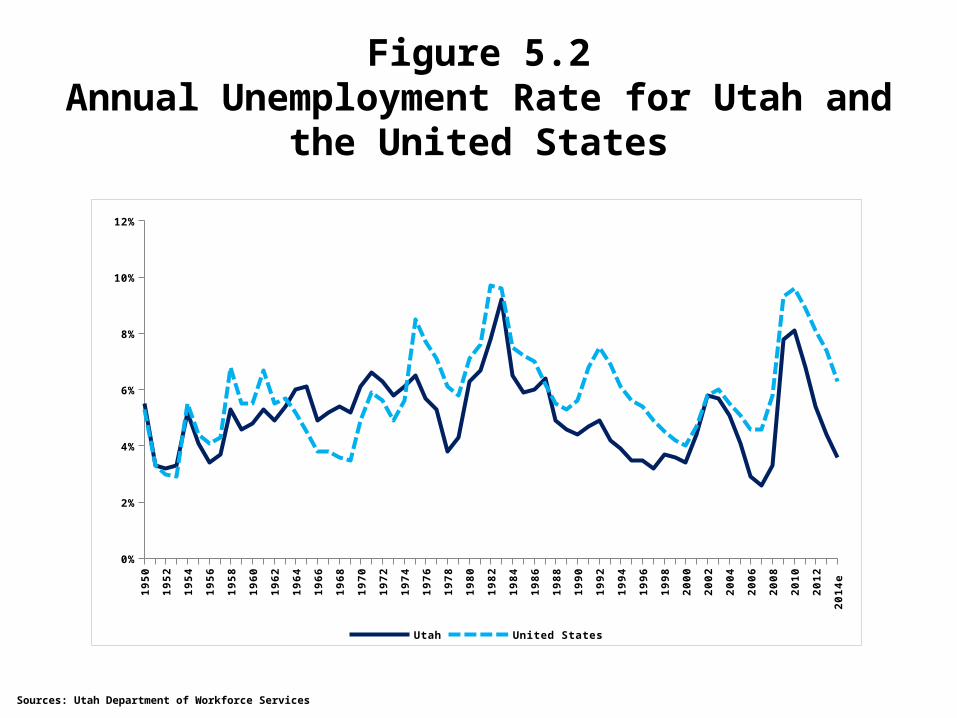
Figure 5.2Annual Unemployment Rate for Utah
and the United States1
95
0
19
52
19
54
19
56
19
58
19
60
19
62
19
64
19
66
19
68
19
70
19
72
19
74
19
76
19
78
19
80
19
82
19
84
19
86
19
88
19
90
19
92
19
94
19
96
19
98
20
00
20
02
20
04
20
06
20
08
20
10
20
12
20
14
e
0%
2%
4%
6%
8%
10%
12%
Utah United States
Sources: Utah Department of Workforce Services
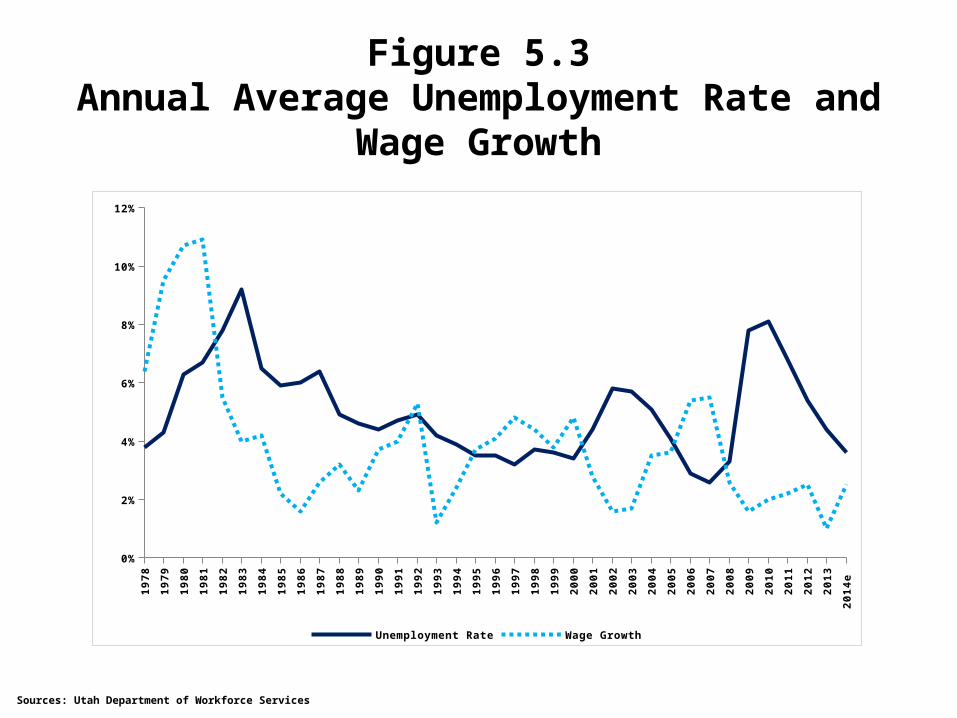
Figure 5.3Annual Average Unemployment Rate
and Wage Growth1
97
8
19
79
19
80
19
81
19
82
19
83
19
84
19
85
19
86
19
87
19
88
19
89
19
90
19
91
19
92
19
93
19
94
19
95
19
96
19
97
19
98
19
99
20
00
20
01
20
02
20
03
20
04
20
05
20
06
20
07
20
08
20
09
20
10
20
11
20
12
20
13
20
14
e
0%
2%
4%
6%
8%
10%
12%
Unemployment Rate Wage Growth
Sources: Utah Department of Workforce Services
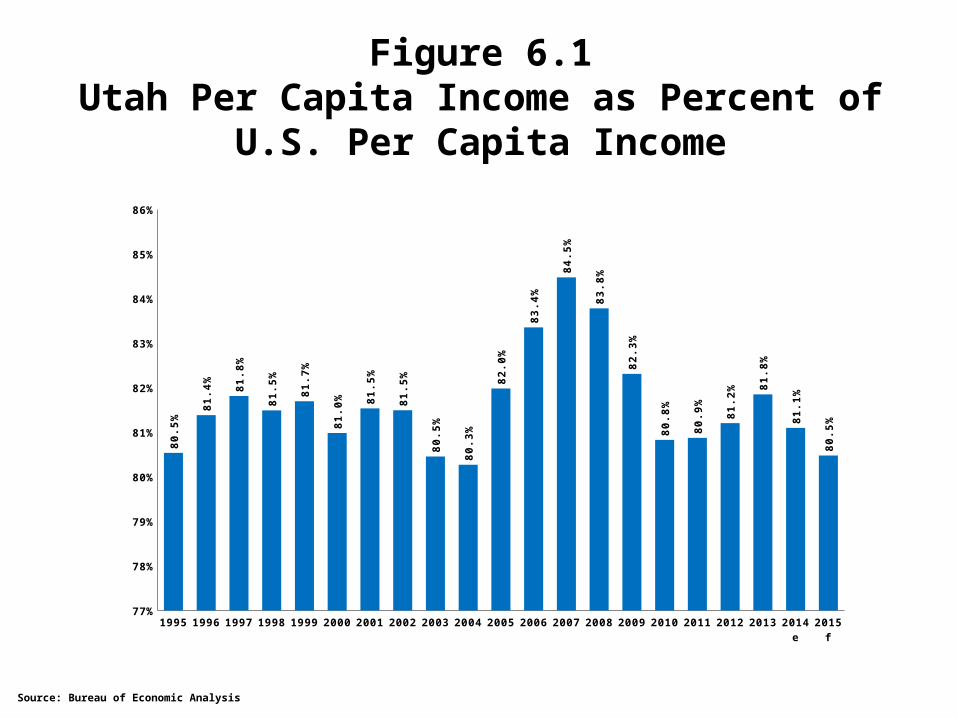
1995
1996
1997
1998
1999
2000
2001
2002
2003
2004
2005
2006
2007
2008
2009
2010
2011
2012
2013
2014e
2015f
77%
78%
79%
80%
81%
82%
83%
84%
85%
86%
80
.5%
81
.4%
81
.8%
81
.5%
81
.7%
81
.0% 81
.5%
81
.5%
80
.5%
80
.3%
82
.0%
83
.4%
84
.5%
83
.8%
82
.3%
80
.8%
80
.9%
81
.2% 8
1.8
%
81
.1%
80
.5%
Figure 6.1Utah Per Capita Income as Percent of
U.S. Per Capita Income
Source: Bureau of Economic Analysis
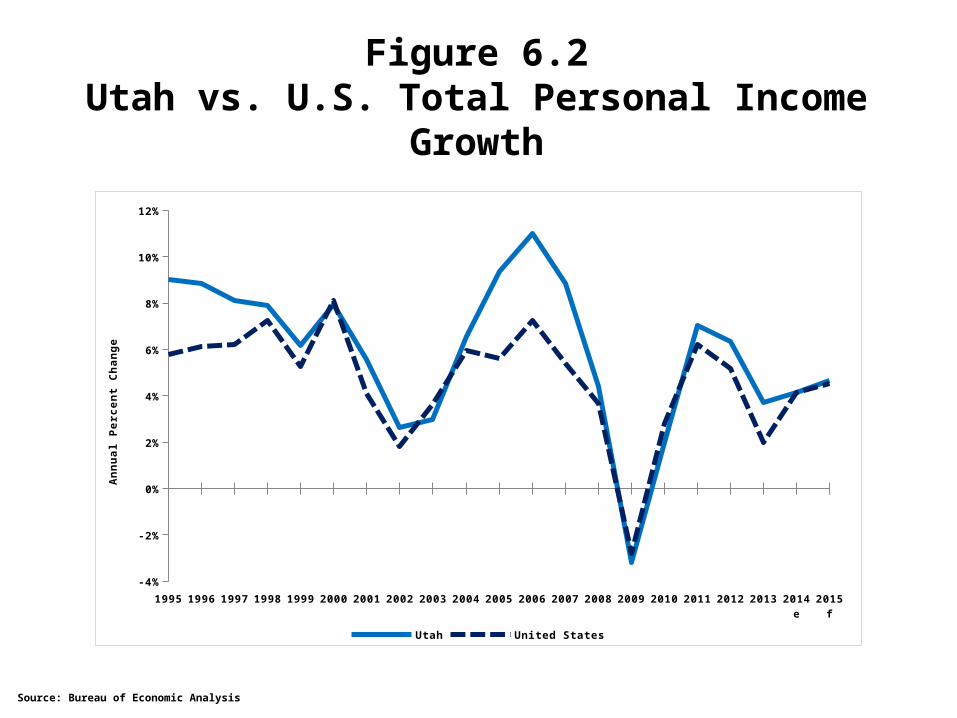
Figure 6.2Utah vs. U.S. Total Personal Income
Growth
1995
1996
1997
1998
1999
2000
2001
2002
2003
2004
2005
2006
2007
2008
2009
2010
2011
2012
2013
2014e
2015f
-4%
-2%
0%
2%
4%
6%
8%
10%
12%
Utah United States
An
nu
al
Perc
en
t C
han
ge
Source: Bureau of Economic Analysis
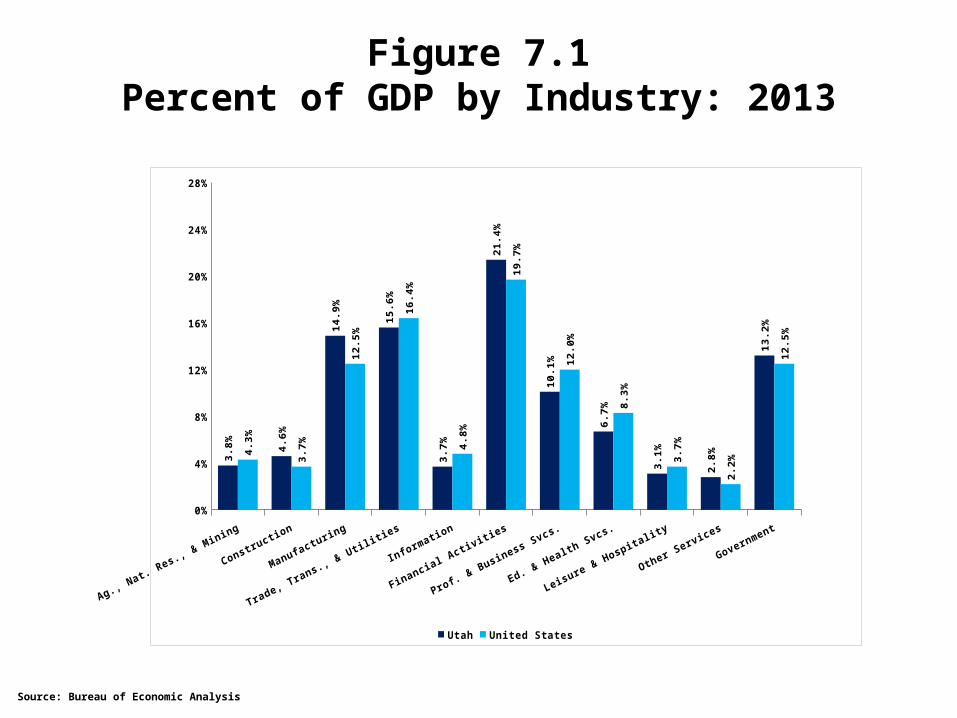
Figure 7.1Percent of GDP by Industry: 2013
0%
4%
8%
12%
16%
20%
24%
28%
3.8
%
4.6
%
14
.9%
15
.6%
3.7
%
21
.4%
10
.1%
6.7
%
3.1
%
2.8
%
13
.2%
4.3
%
3.7
%
12
.5%
16
.4%
4.8
%
19
.7%
12
.0%
8.3
%
3.7
%
2.2
%
12
.5%
Utah United States
Source: Bureau of Economic Analysis
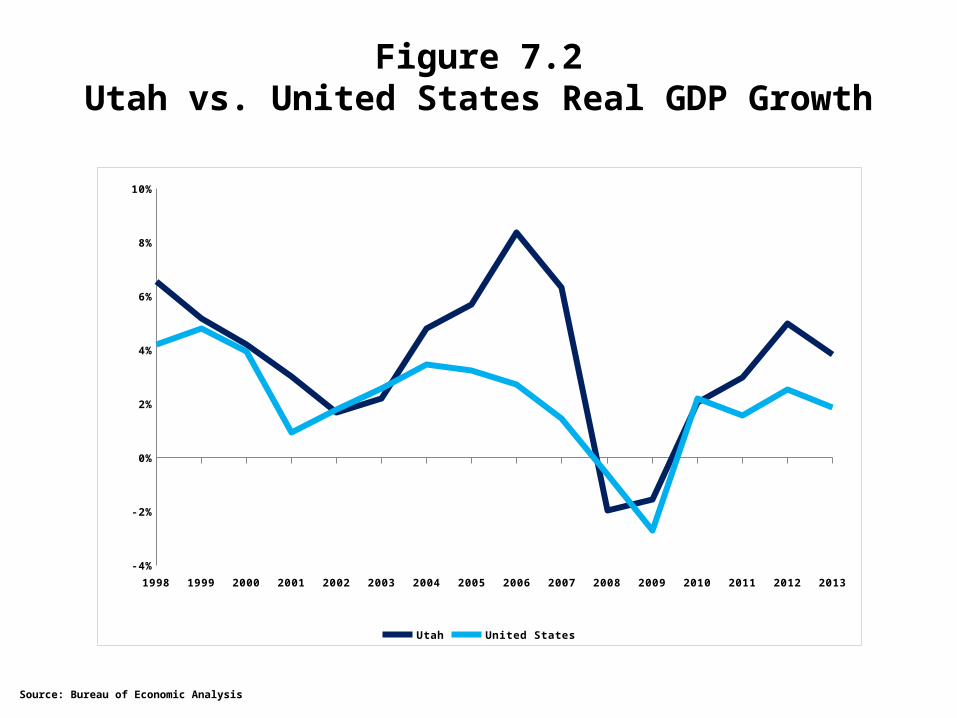
Figure 7.2Utah vs. United States Real GDP Growth
1998 1999 2000 2001 2002 2003 2004 2005 2006 2007 2008 2009 2010 2011 2012 2013
-4%
-2%
0%
2%
4%
6%
8%
10%
Utah United States
Source: Bureau of Economic Analysis
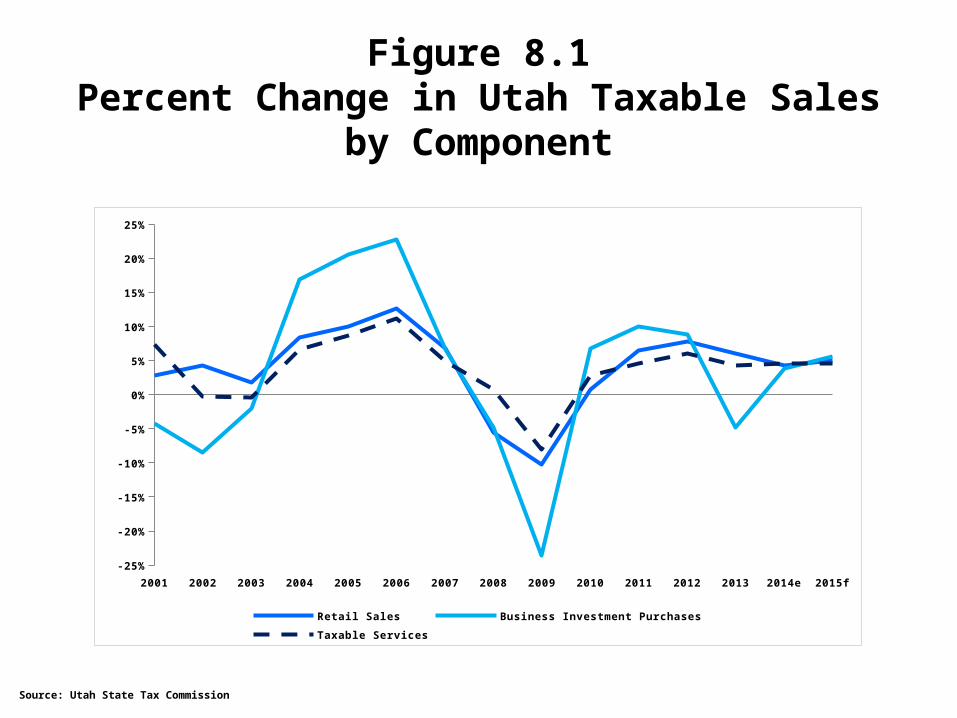
Figure 8.1Percent Change in Utah Taxable Sales
by Component
2001 2002 2003 2004 2005 2006 2007 2008 2009 2010 2011 2012 2013 2014e 2015f
-25%
-20%
-15%
-10%
-5%
0%
5%
10%
15%
20%
25%
Retail Sales Business Investment Purchases
Taxable Services
Source: Utah State Tax Commission
19
75
19
76
19
77
19
78
19
79
19
80
19
81
19
82
19
83
19
84
19
85
19
86
19
87
19
88
19
89
19
90
19
91
19
92
19
93
19
94
19
95
19
96
19
97
19
98
19
99
20
00
20
01
20
02
20
03
20
04
20
05
20
06
20
07
20
08
20
09
20
10
20
11
20
12
20
13
20
14
20
15
f
20
16
f
-20
-15
-10
-5
0
5
10
15
20
25
3.8
8.0
10.2
7.1
6.4
6.3
-1.5
3.5
-3.7
19.4
5.7
0.0
2.1
8.9
3.5
1.2
0.6
3.0
5.0
9.6
8.8
7.4
6.1
4.8
2.9
8.0
0.7
-7.2
-1.0
3.2
9.0
15.3
6.1
-3.9
-13.9
-8.5
9.1
2.3
7.9
0.2
2.2
1.8
Fiscal Years
Perc
en
t C
han
ge
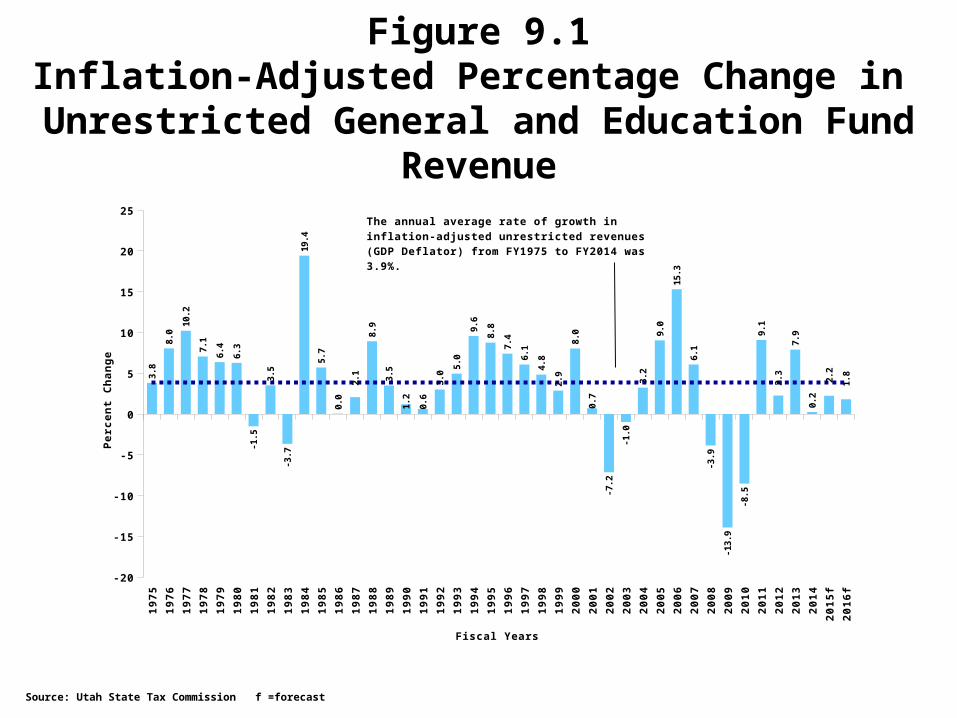
The annual average rate of growth in infla-tion-adjusted unrestricted revenues (GDP De-flator) from FY1975 to FY2014 was 3.9%.
Figure 9.1Inflation-Adjusted Percentage Change in Unrestricted General and Education Fund
Revenue
Source: Utah State Tax Commission f =forecast
19
73
19
74
19
75
19
76
19
77
19
78
19
79
19
80
19
81
19
82
19
83
19
84
19
85
19
86
19
87
19
88
19
89
19
90
19
91
19
92
19
93
19
94
19
95
19
96
19
97
19
98
19
99
20
00
20
01
20
02
20
03
20
04
20
05
20
06
20
07
20
08
20
09
20
10
20
11
20
12
20
13
-$200
-$100
$0
$100
$200
$300
$400
$500
2014 Real (GDP Deflator)
Fiscal Years
Mil
lio
ns o
f D
oll
ars
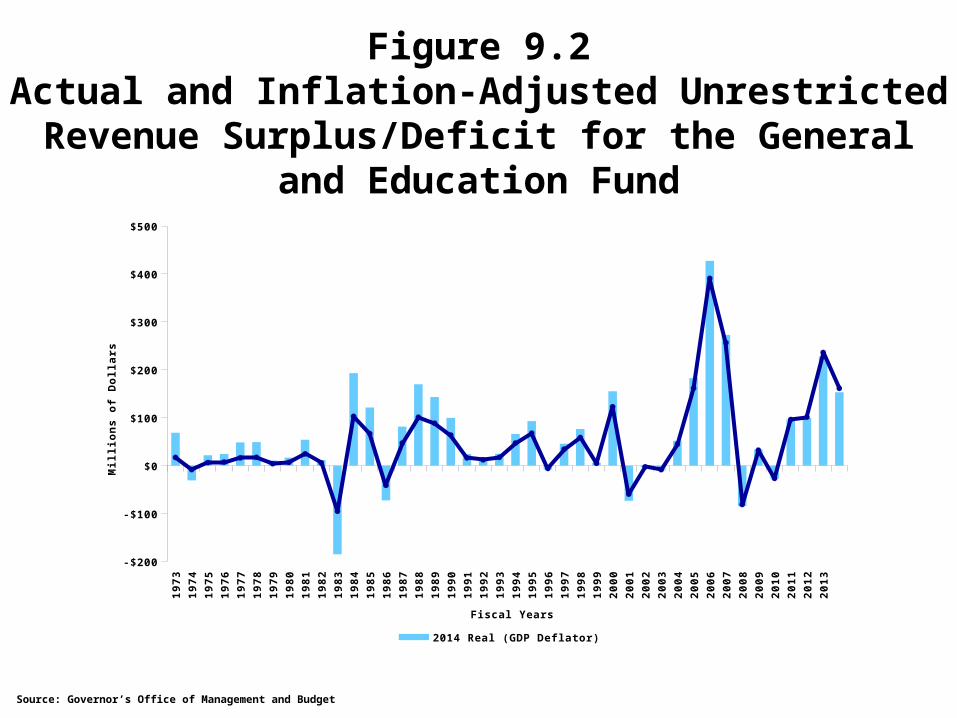
Figure 9.2Actual and Inflation-Adjusted Unrestricted
Revenue Surplus/Deficit for the General and Education Fund
Source: Governor’s Office of Management and Budget
19
81
19
82
19
83
19
84
19
85
19
86
19
87
19
88
19
89
19
90
19
91
19
92
19
93
19
94
19
95
19
96
19
97
19
98
19
99
20
00
20
01
20
02
20
03
20
04
20
05
20
06
20
07
20
08
20
09
20
10
20
11
20
12
20
13
20
14
20
15
f
20
16
f
0
10
20
30
40
50
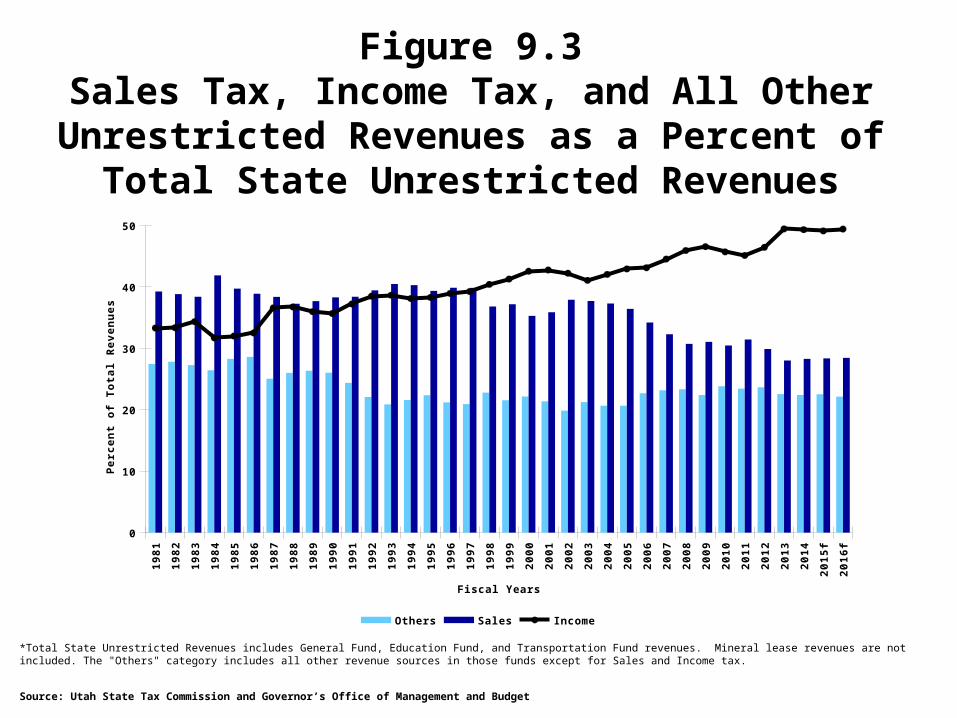
Others Sales Income
Fiscal Years
Perc
en
t o
f T
ota
l R
even
ues
*Total State Unrestricted Revenues includes General Fund, Education Fund, and Transportation Fund revenues. Mineral lease revenues are not included. The "Others" category includes all other revenue sources in those funds except for Sales and Income tax.
Source: Utah State Tax Commission and Governor’s Office of Management and Budget
Figure 9.3Sales Tax, Income Tax, and All Other
Unrestricted Revenues as a Percent of Total State Unrestricted Revenues
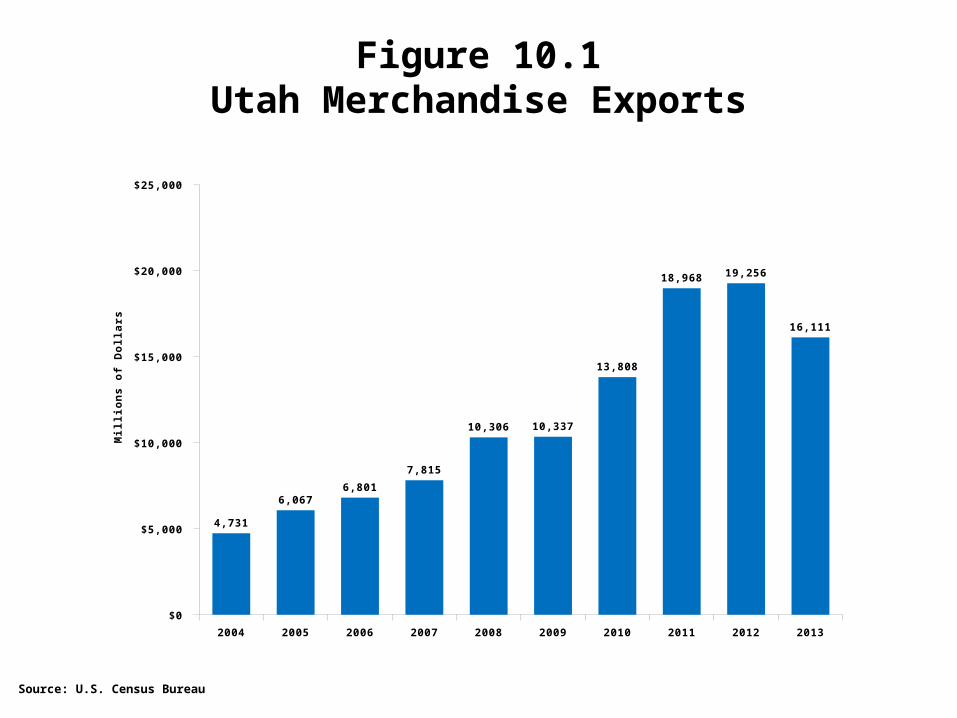
Figure 10.1Utah Merchandise Exports
2004 2005 2006 2007 2008 2009 2010 2011 2012 2013
$0
$5,000
$10,000
$15,000
$20,000
$25,000
4,731
6,0676,801
7,815
10,306 10,337
13,808
18,968 19,256
16,111
Mil
lio
ns o
f D
oll
ars
Source: U.S. Census Bureau
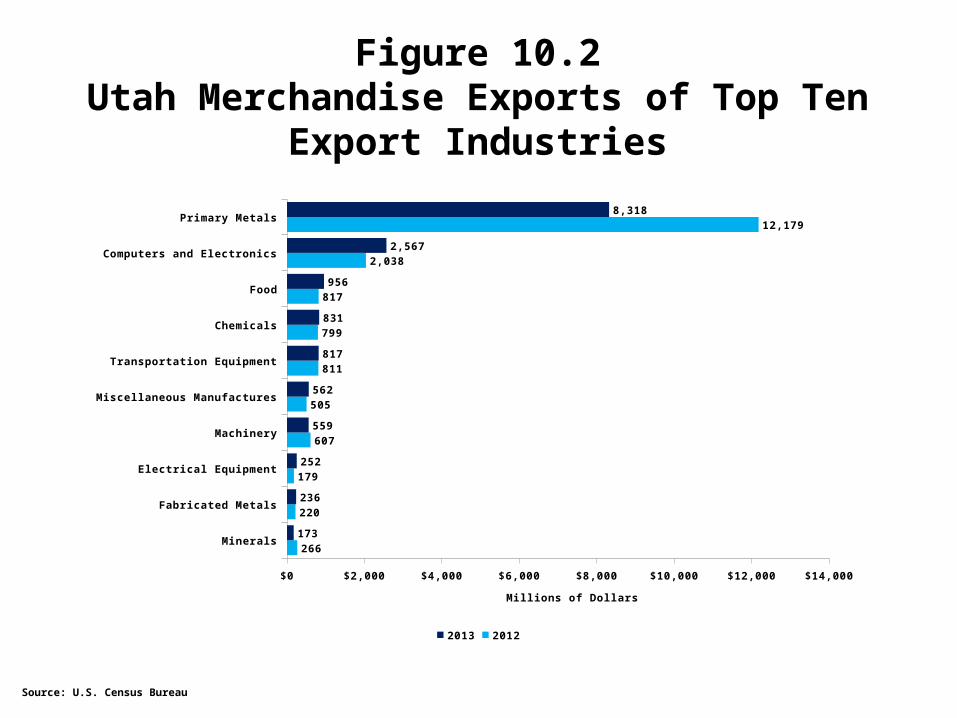
Figure 10.2Utah Merchandise Exports of Top Ten
Export Industries
Minerals
Fabricated Metals
Electrical Equipment
Machinery
Miscellaneous Manufactures
Transportation Equipment
Chemicals
Food
Computers and Electronics
Primary Metals
$0 $2,000 $4,000 $6,000 $8,000 $10,000 $12,000 $14,000
266
220
179
607
505
811
799
817
2,038
12,179
173
236
252
559
562
817
831
956
2,567
8,318
2013 2012
Millions of Dollars
Source: U.S. Census Bureau
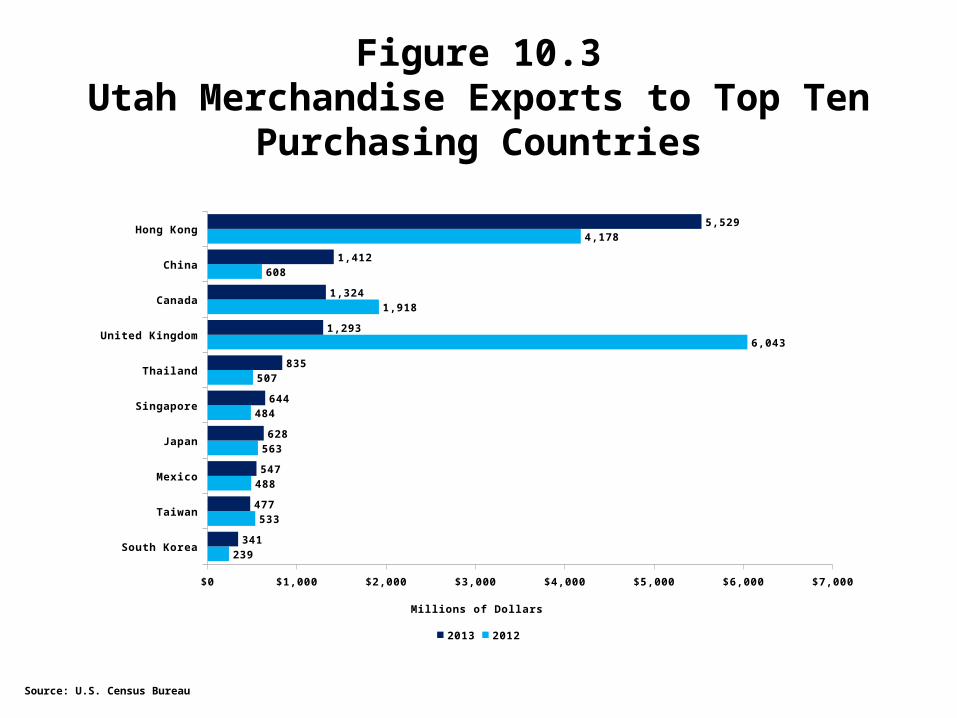
Figure 10.3Utah Merchandise Exports to Top Ten
Purchasing Countries
South Korea
Taiwan
Mexico
Japan
Singapore
Thailand
United Kingdom
Canada
China
Hong Kong
$0 $1,000 $2,000 $3,000 $4,000 $5,000 $6,000 $7,000
239
533
488
563
484
507
6,043
1,918
608
4,178
341
477
547
628
644
835
1,293
1,324
1,412
5,529
2013 2012
Millions of Dollars
Source: U.S. Census Bureau
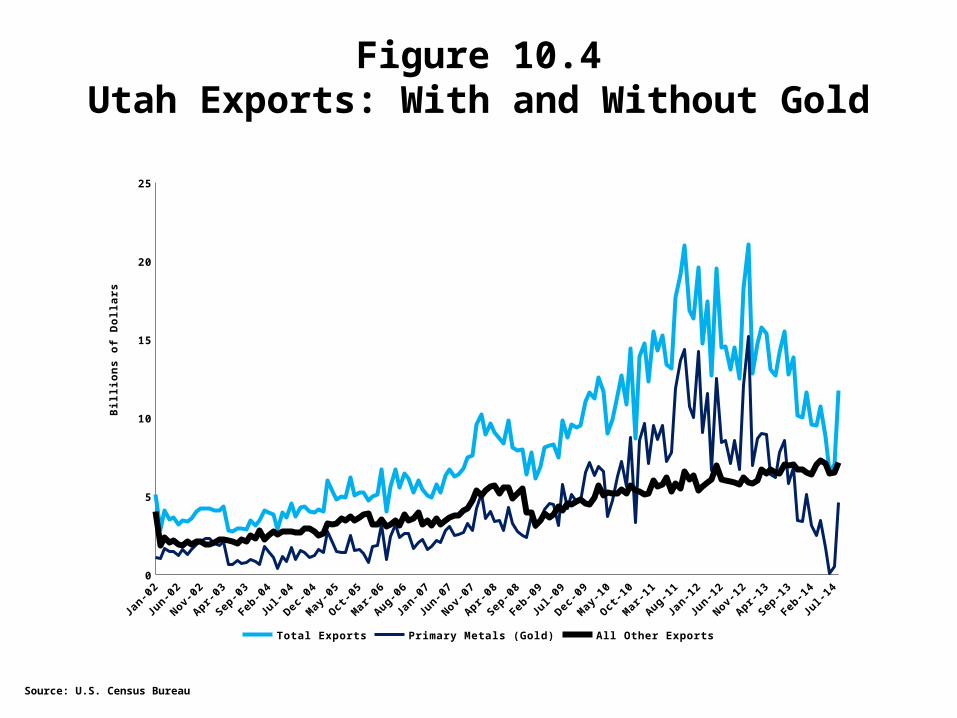
Figure 10.4Utah Exports: With and Without Gold
Source: U.S. Census Bureau
2002 2003 2004 2005 2006 2007 2008 2009 2010 2011 2012 2013 20140
5
10
15
20
25
Total Exports Primary Metals (Gold) All Other Exports
Bil
lio
ns o
f D
oll
ars
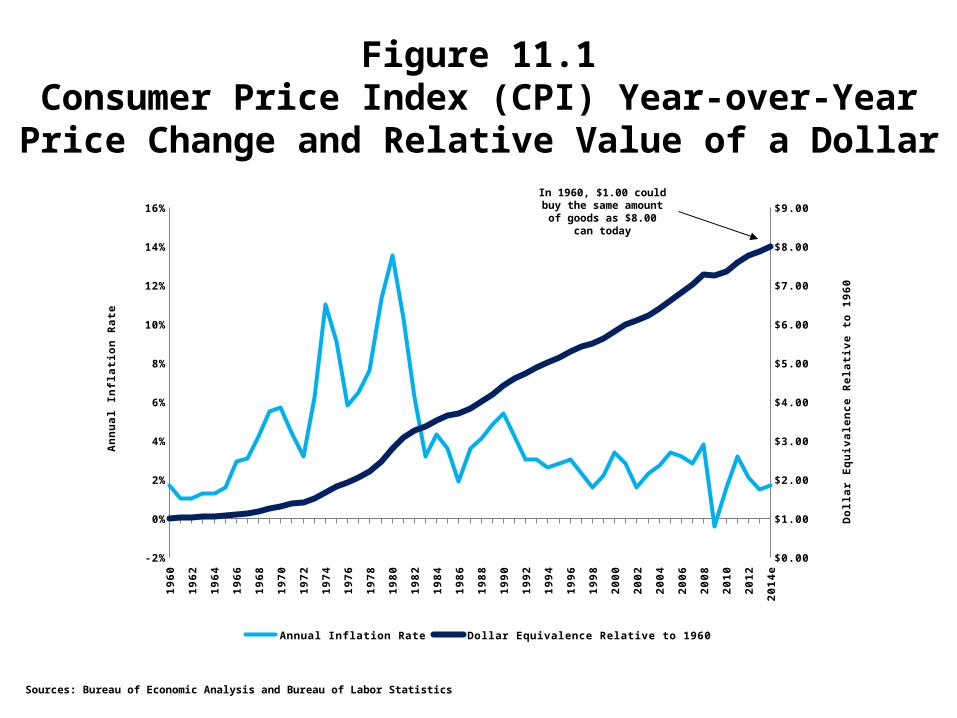
Figure 11.1Consumer Price Index (CPI) Year-over-Year
Price Change and Relative Value of a Dollar
Sources: Bureau of Economic Analysis and Bureau of Labor Statistics
19
60
19
62
19
64
19
66
19
68
19
70
19
72
19
74
19
76
19
78
19
80
19
82
19
84
19
86
19
88
19
90
19
92
19
94
19
96
19
98
20
00
20
02
20
04
20
06
20
08
20
10
20
12
20
14
e
-2%
0%
2%
4%
6%
8%
10%
12%
14%
16%
$0.00
$1.00
$2.00
$3.00
$4.00
$5.00
$6.00
$7.00
$8.00
$9.00
Annual Inflation Rate Dollar Equivalence Relative to 1960
An
nu
al
Infl
ati
on
Rate
Do
llar
Eq
uiv
ale
nce R
ela
tive t
o 1
96
0
In 1960, $1.00 could buy the same amount of goods as $8.00 can
today
0.0%
0.2%
0.4%
0.6%
0.8%
1.0%
1.2%
1.4%
1.6%
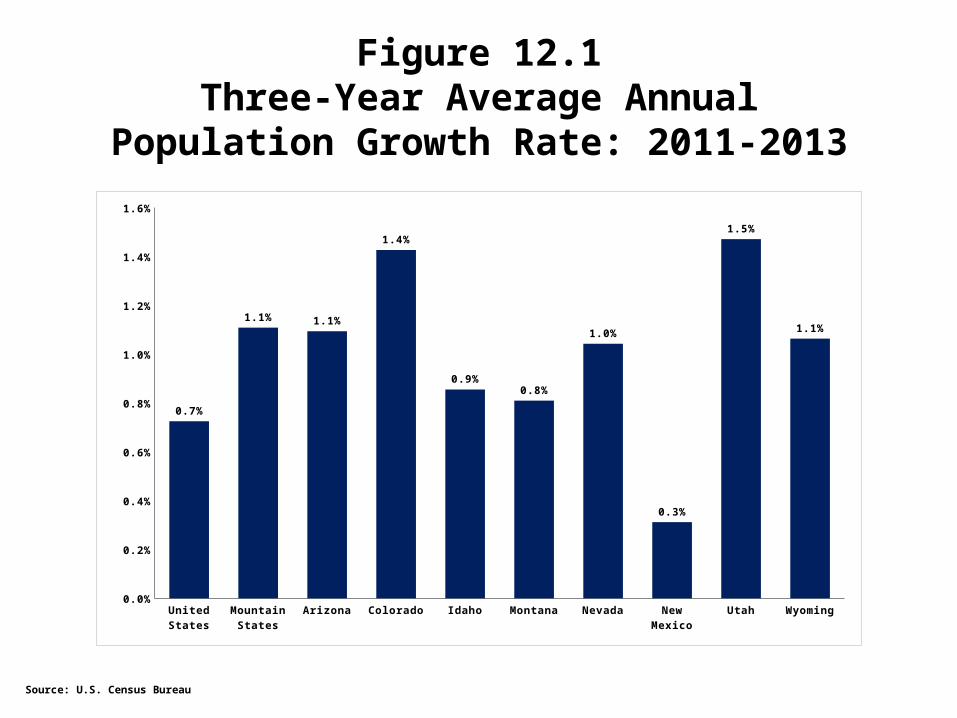
0.7%
1.1% 1.1%
1.4%
0.9%0.8%
1.0%
0.3%
1.5%
1.1%
Figure 12.1Three-Year Average Annual
Population Growth Rate: 2011-2013
Source: U.S. Census Bureau
Unit
ed S
tate
s
Mounta
in S
tate
s
Arizo
na
Colora
do
Idah
o
Monta
na
Nev
ada
New
Mex
ico
Uta
h
Wyo
min
g0.0%
0.5%
1.0%
1.5%
2.0%
2.5%
3.0%
3.5%
4.0%
4.5%
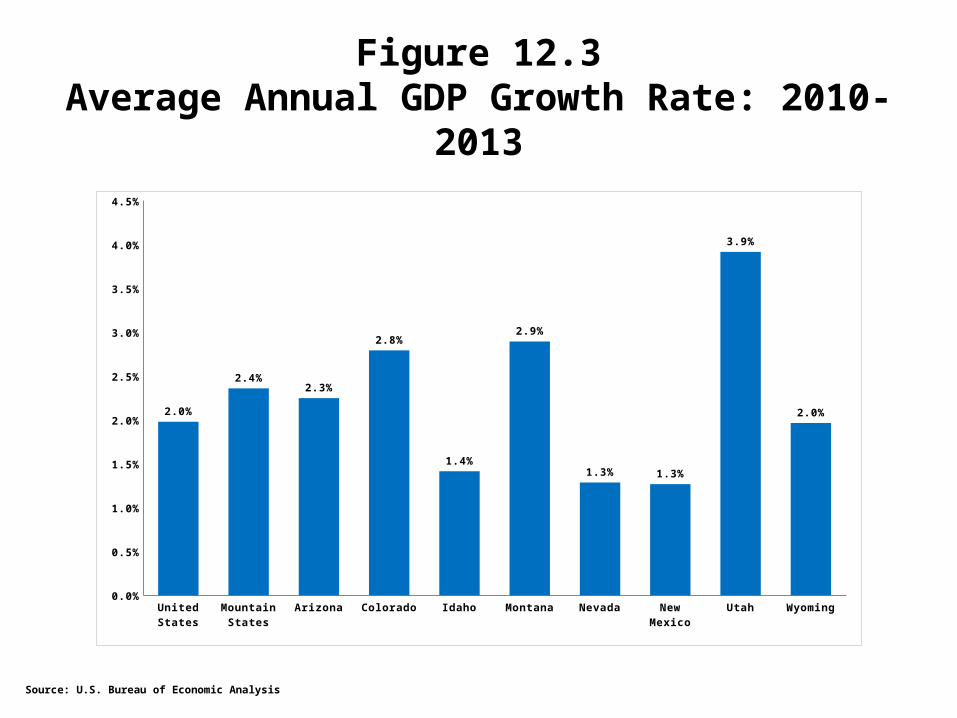
2.0%
2.4%2.3%
2.8%
1.4%
2.9%
1.3% 1.3%
3.9%
2.0%
Figure 12.3Average Annual GDP Growth Rate:
2010-2013
Source: U.S. Bureau of Economic Analysis
United States
Arizona Colorado Idaho Montana Nevada New Mexico Utah Wyoming0.0
0.5
1.0
1.5
2.0
2.5
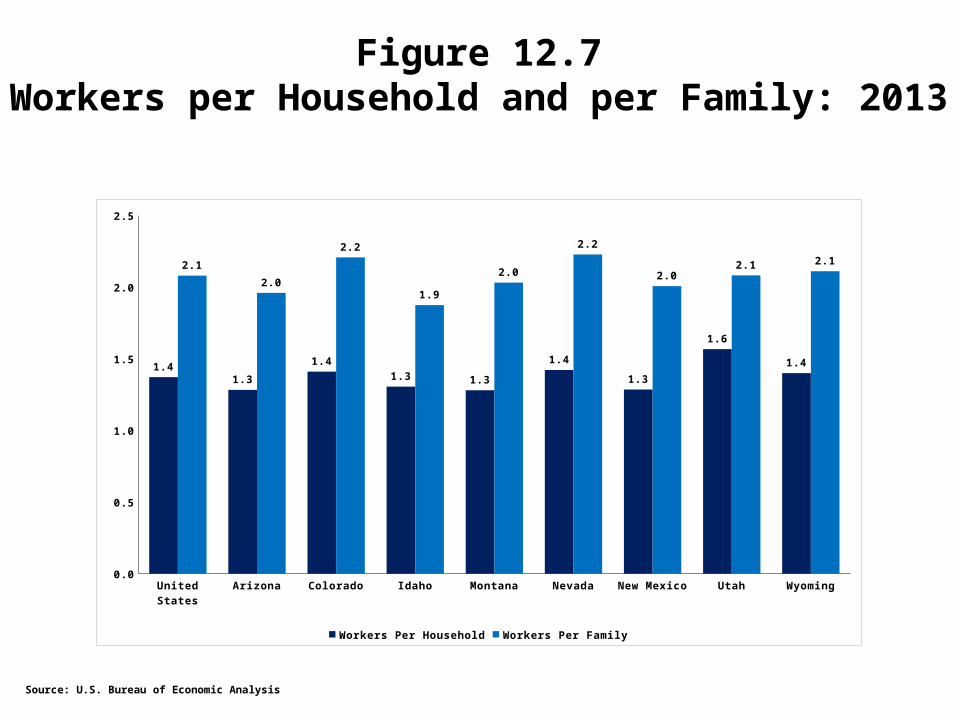
1.41.3
1.41.3 1.3
1.4
1.3
1.6
1.4
2.1
2.0
2.2
1.9
2.0
2.2
2.02.1 2.1
Workers Per Household Workers Per Family
Figure 12.7Workers per Household and per Family:
2013
Source: U.S. Bureau of Economic Analysis
Unit
ed S
tate
s
Mounta
in S
tate
s
Arizo
na
Colora
do
Idah
o
Monta
na
Nev
ada
New
Mex
ico
Uta
h
Wyo
min
g0.0%
0.5%
1.0%
1.5%
2.0%
2.5%
3.0%
3.5%
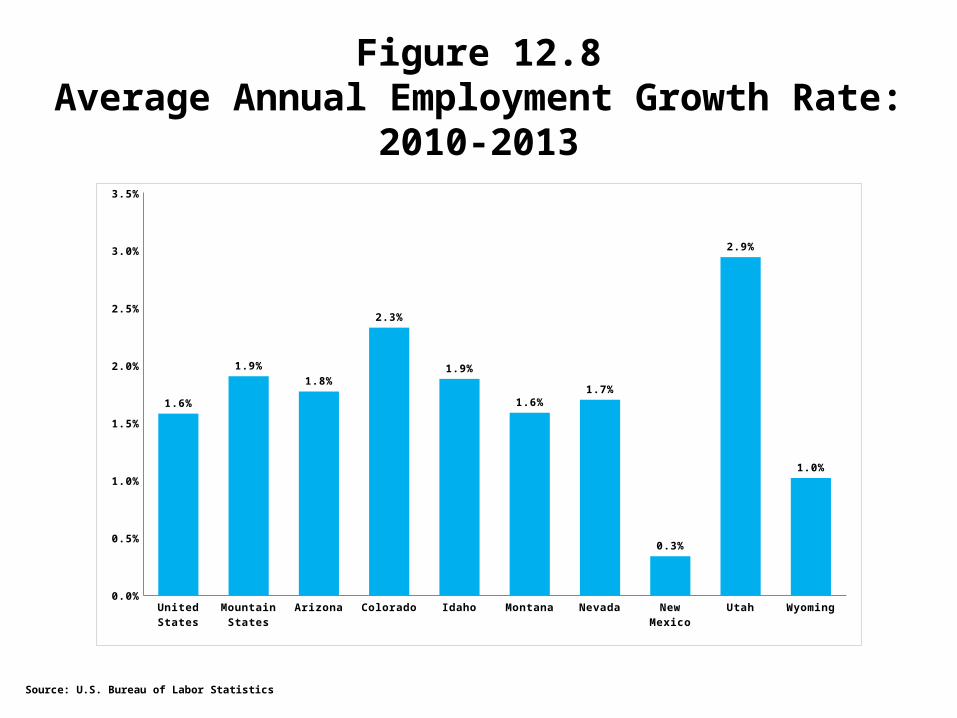
1.6%
1.9%1.8%
2.3%
1.9%
1.6%1.7%
0.3%
2.9%
1.0%
Figure 12.8Average Annual Employment Growth
Rate: 2010-2013
Source: U.S. Bureau of Labor Statistics
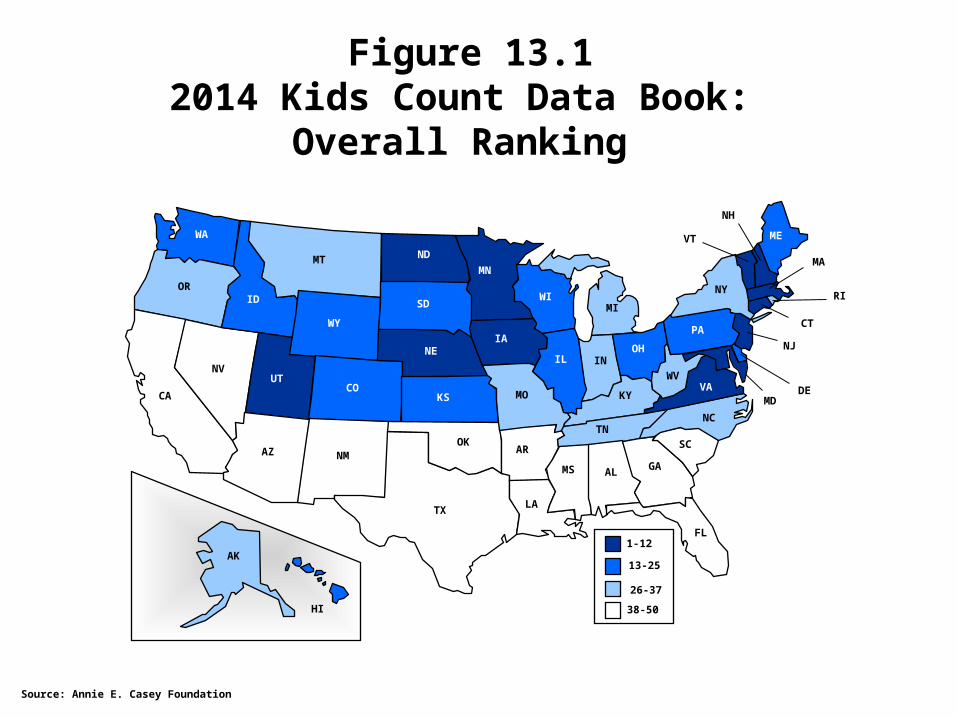
Figure 13.12014 Kids Count Data Book:
Overall Ranking
Source: Annie E. Casey Foundation
NM
UT
AZ
CA
NV
OR
TX
OK
CO
WA
ID
MT
WY
ND
SD
MN
NE
KS
IA
MO
AR
LA
WI
IL INOH
FL
TN
KY
MS AL GA
SC
NC
VAWV
PA
NY
ME
AK
HI
MA
VT
NH
RI
CT
NJ
DEMD
MI
38-50
13-25
26-37
1-12
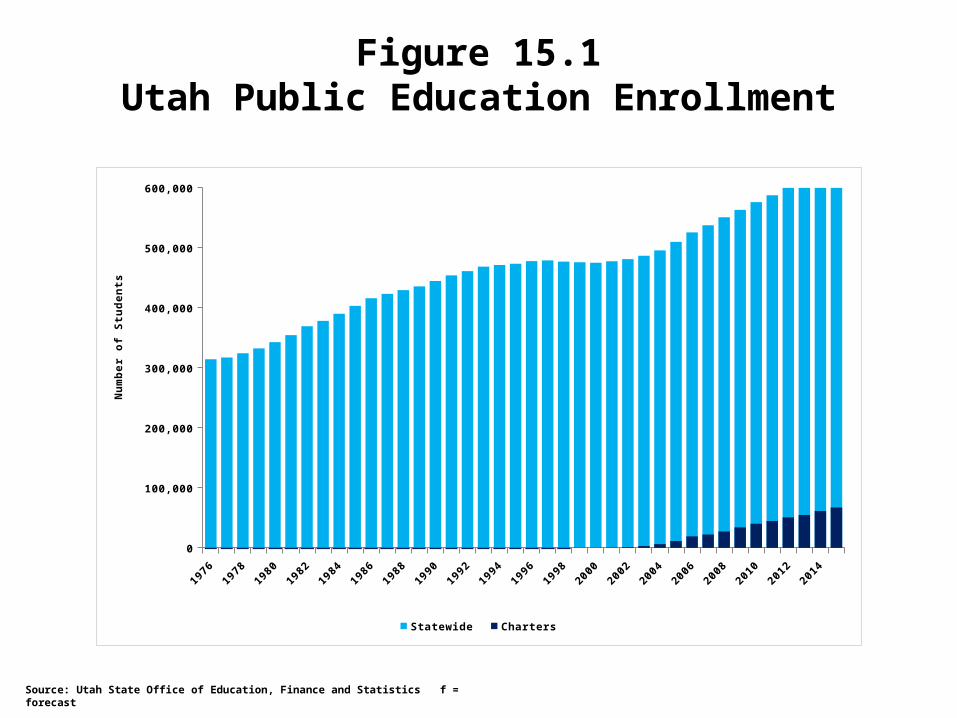
Source: Utah State Office of Education, Finance and Statistics f = forecast
Figure 15.1Utah Public Education Enrollment
1976
1978
1980
1982
1984
1986
1988
1990
1992
1994
1996
1998
2000
2002
2004
2006
2008
2010
2012
2014
0
100,000
200,000
300,000
400,000
500,000
600,000
Statewide Charters
Nu
mb
er
of
Stu
den
ts
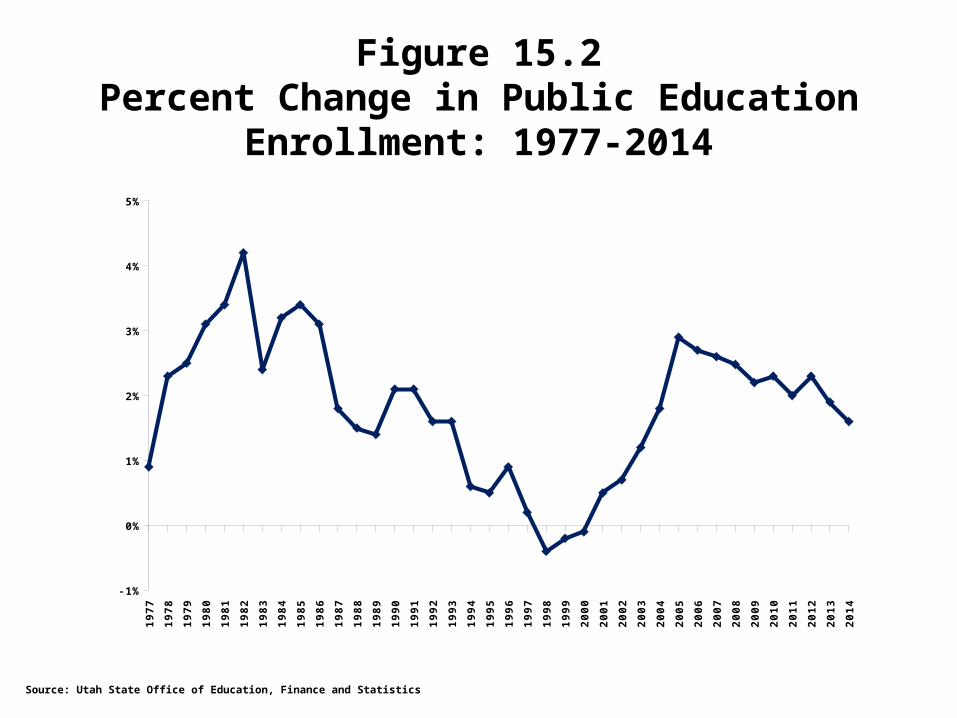
Figure 15.2Percent Change in Public Education
Enrollment: 1977-2014
Source: Utah State Office of Education, Finance and Statistics
19
77
19
78
19
79
19
80
19
81
19
82
19
83
19
84
19
85
19
86
19
87
19
88
19
89
19
90
19
91
19
92
19
93
19
94
19
95
19
96
19
97
19
98
19
99
20
00
20
01
20
02
20
03
20
04
20
05
20
06
20
07
20
08
20
09
20
10
20
11
20
12
20
13
20
14
-1%
0%
1%
2%
3%
4%
5%
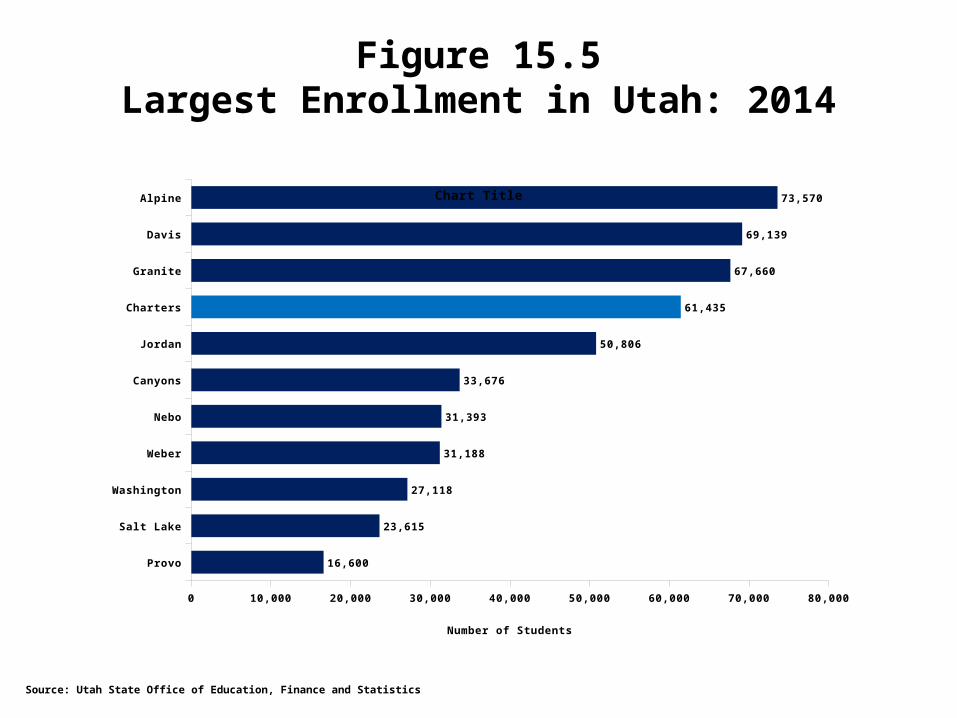
Figure 15.5Largest Enrollment in Utah: 2014
Provo
Salt Lake
Washington
Weber
Nebo
Canyons
Jordan
Charters
Granite
Davis
Alpine
0 10,000 20,000 30,000 40,000 50,000 60,000 70,000 80,000
16,600
23,615
27,118
31,188
31,393
33,676
50,806
61,435
67,660
69,139
73,570Chart Title
Number of Students
Source: Utah State Office of Education, Finance and Statistics
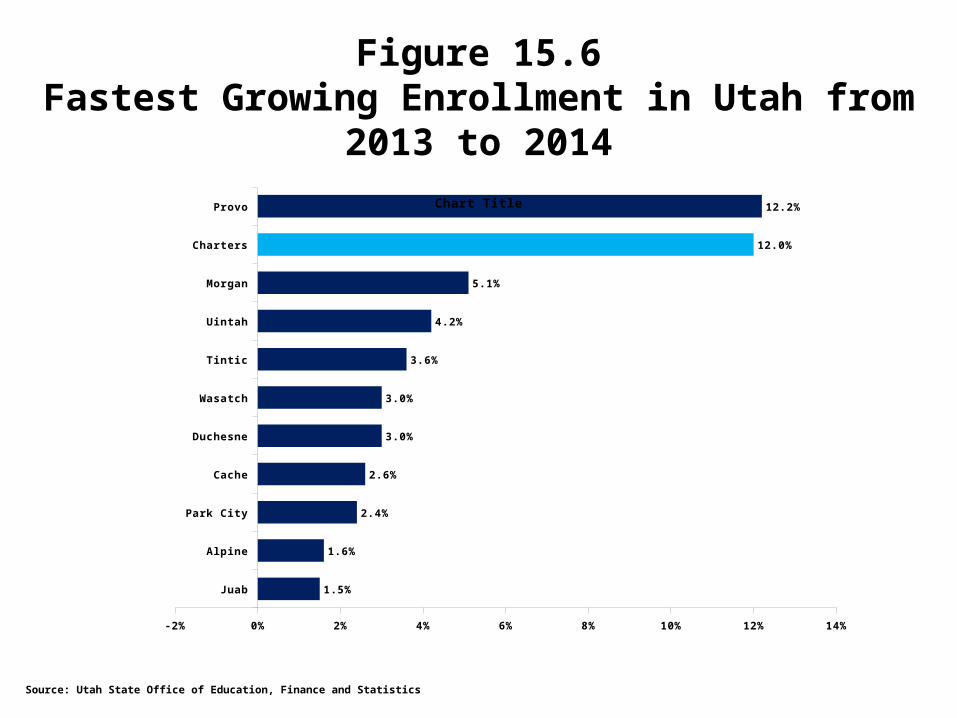
Figure 15.6Fastest Growing Enrollment in Utah from
2013 to 2014
Juab
Alpine
Park City
Cache
Duchesne
Wasatch
Tintic
Uintah
Morgan
Charters
Provo
-2% 0% 2% 4% 6% 8% 10% 12% 14%
1.5%
1.6%
2.4%
2.6%
3.0%
3.0%
3.6%
4.2%
5.1%
12.0%
12.2%Chart Title
Source: Utah State Office of Education, Finance and Statistics
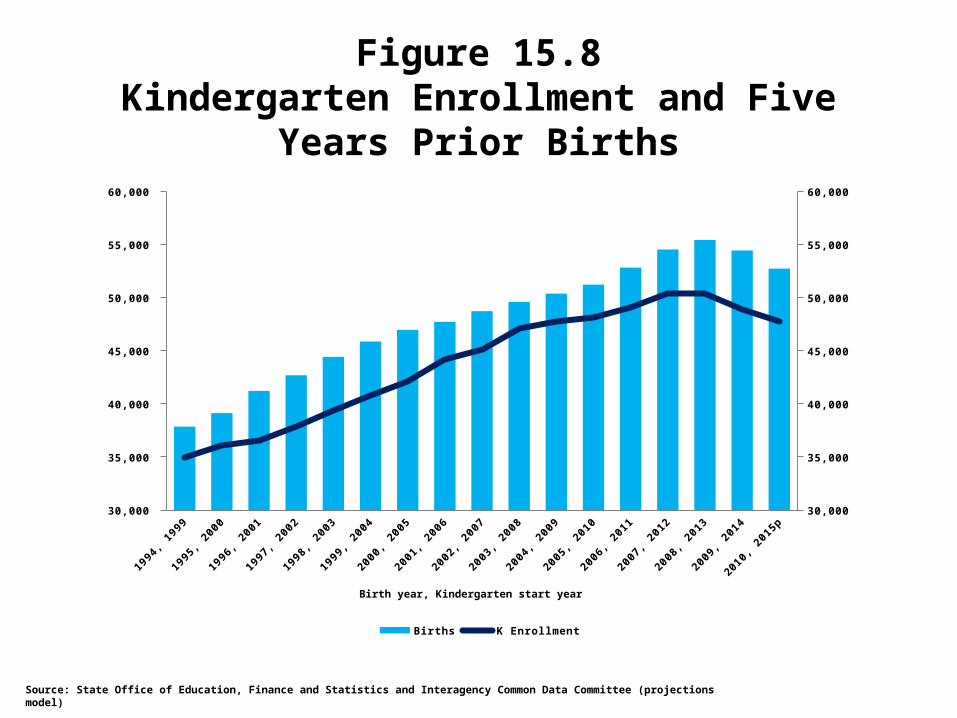
Figure 15.8Kindergarten Enrollment and Five Years
Prior Births
1994, 1999
1995, 2000
1996, 2001
1997, 2002
1998, 2003
1999, 2004
2000, 2005
2001, 2006
2002, 2007
2003, 2008
2004, 2009
2005, 2010
2006, 2011
2007, 2012
2008, 2013
2009, 2014
2010, 2015p
30,000
35,000
40,000
45,000
50,000
55,000
60,000
30,000
35,000
40,000
45,000
50,000
55,000
60,000
Births K Enrollment
Birth year, Kindergarten start year
Source: State Office of Education, Finance and Statistics and Interagency Common Data Committee (projections model)
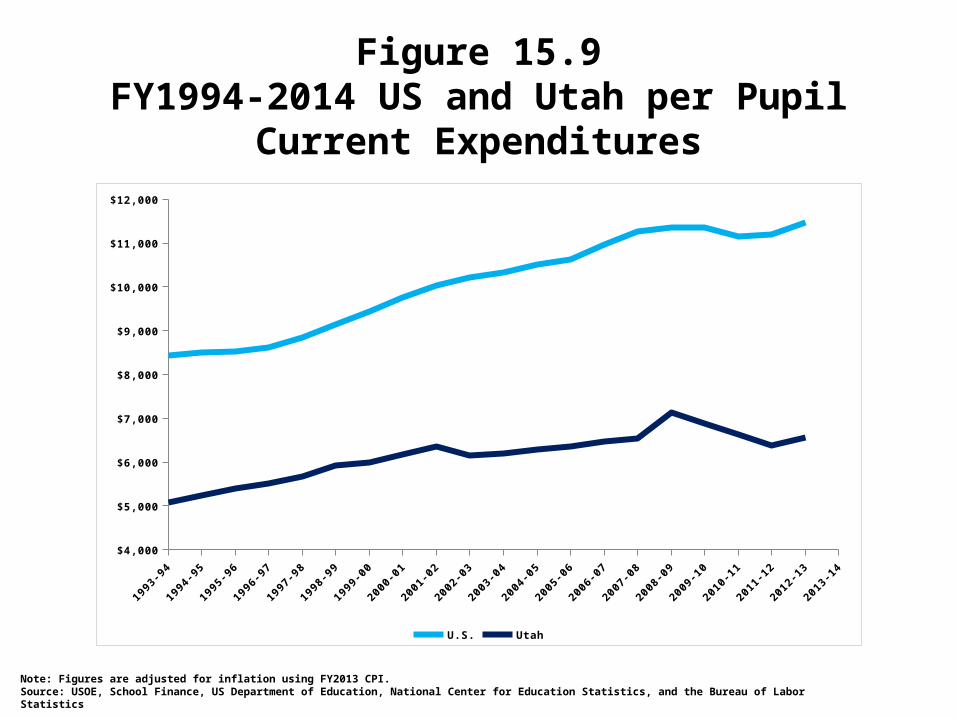
Figure 15.9FY1994-2014 US and Utah per Pupil
Current Expenditures
1993-94
1994-95
1995-96
1996-97
1997-98
1998-99
1999-00
2000-01
2001-02
2002-03
2003-04
2004-05
2005-06
2006-07
2007-08
2008-09
2009-10
2010-11
2011-12
2012-13
2013-14
$4,000
$5,000
$6,000
$7,000
$8,000
$9,000
$10,000
$11,000
$12,000
U.S. Utah
Note: Figures are adjusted for inflation using FY2013 CPI. Source: USOE, School Finance, US Department of Education, National Center for Education Statistics, and the Bureau of Labor Statistics
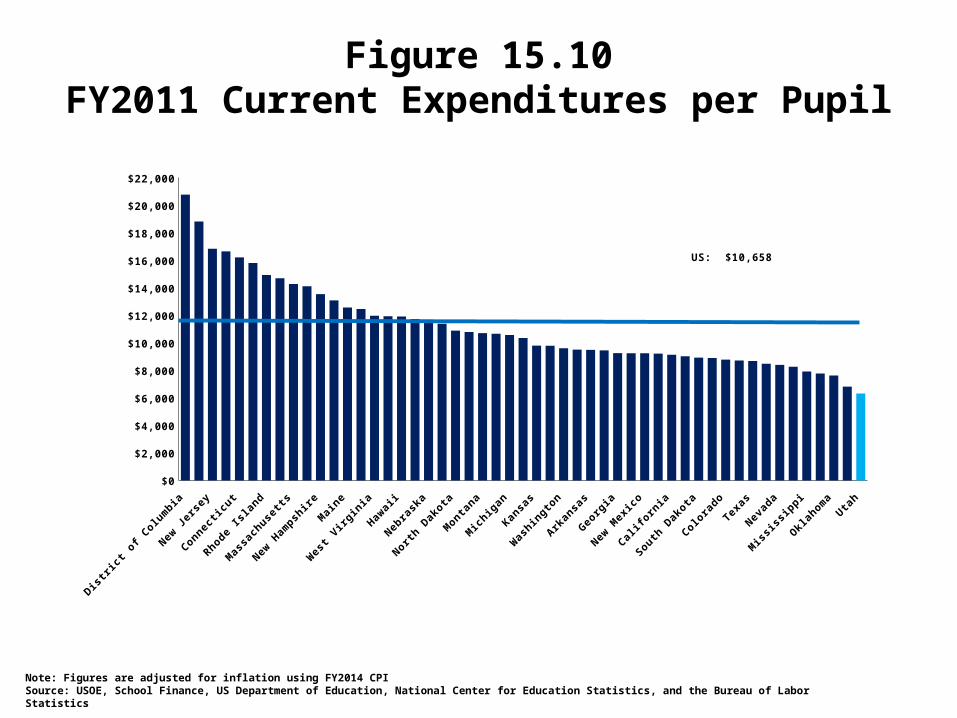
Figure 15.10FY2011 Current Expenditures per Pupil
$0
$2,000
$4,000
$6,000
$8,000
$10,000
$12,000
$14,000
$16,000
$18,000
$20,000
$22,000
US: $10,658
Note: Figures are adjusted for inflation using FY2014 CPISource: USOE, School Finance, US Department of Education, National Center for Education Statistics, and the Bureau of Labor Statistics
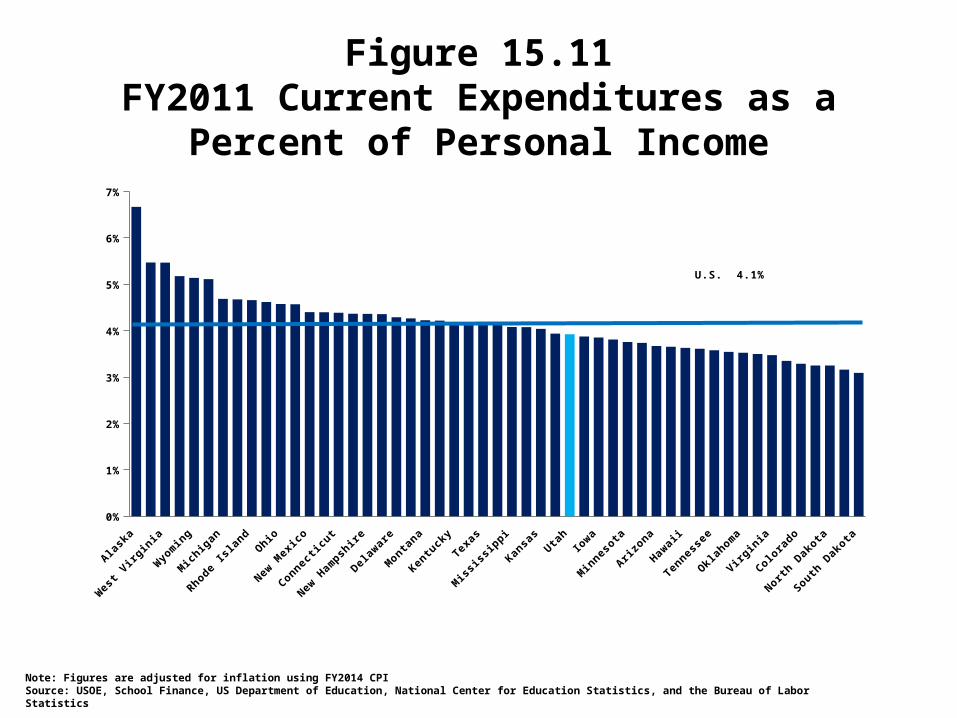
Figure 15.11FY2011 Current Expenditures as a
Percent of Personal Income
Ala
ska
Wes
t Virgin
ia
Wyo
min
g
Mic
higan
Rhode Is
land
Ohio
New
Mex
ico
Connecticu
t
New
Ham
pshire
Del
awar
e
Monta
na
Ken
tuck
y
Texas
Mis
siss
ippi
Kan
sas
Uta
h
Iowa
Min
nesota
Arizo
na
Haw
aii
Tennes
see
Okl
ahom
a
Virgin
ia
Colora
do
Nort
h Dak
ota
South D
akota
0%
1%
2%
3%
4%
5%
6%
7%
U.S. 4.1%
Note: Figures are adjusted for inflation using FY2014 CPI Source: USOE, School Finance, US Department of Education, National Center for Education Statistics, and the Bureau of Labor Statistics
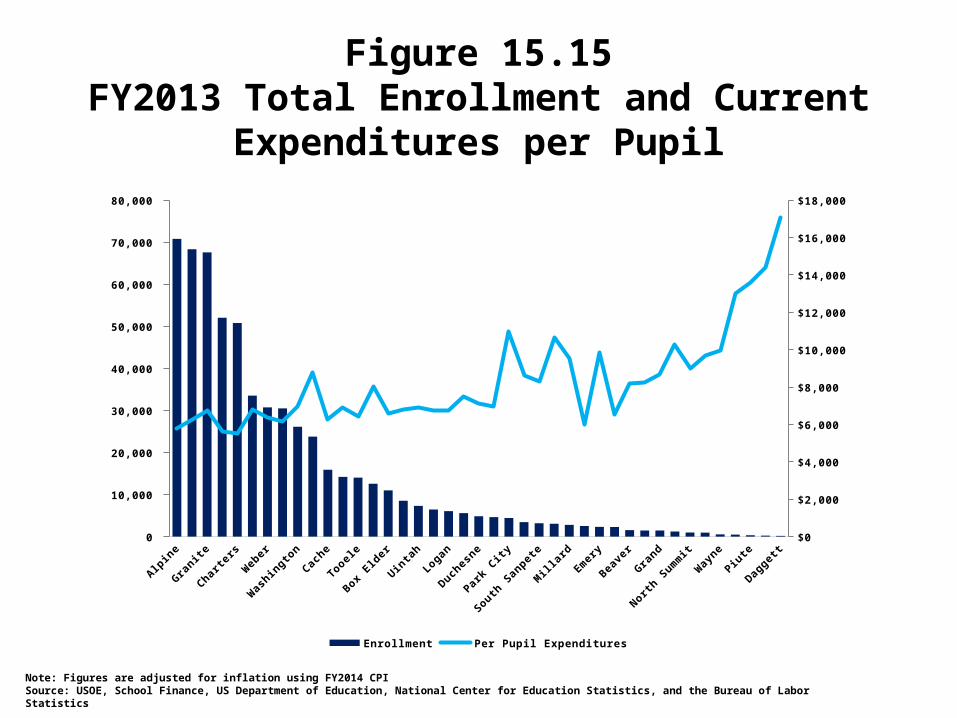
Figure 15.15FY2013 Total Enrollment and Current
Expenditures per Pupil
Alp
ine
Gra
nite
Charte
rs
Web
er
Was
hingto
n
Cache
Tooele
Box Eld
er
Uin
tah
Logan
Duch
esne
Park
City
South S
anpet
e
Mill
ard
Emer
y
Beave
r
Gra
nd
Nort
h Sum
mit
Way
ne
Piute
Dag
gett
0
10,000
20,000
30,000
40,000
50,000
60,000
70,000
80,000
$0
$2,000
$4,000
$6,000
$8,000
$10,000
$12,000
$14,000
$16,000
$18,000
Enrollment Per Pupil Expenditures
Note: Figures are adjusted for inflation using FY2014 CPISource: USOE, School Finance, US Department of Education, National Center for Education Statistics, and the Bureau of Labor Statistics
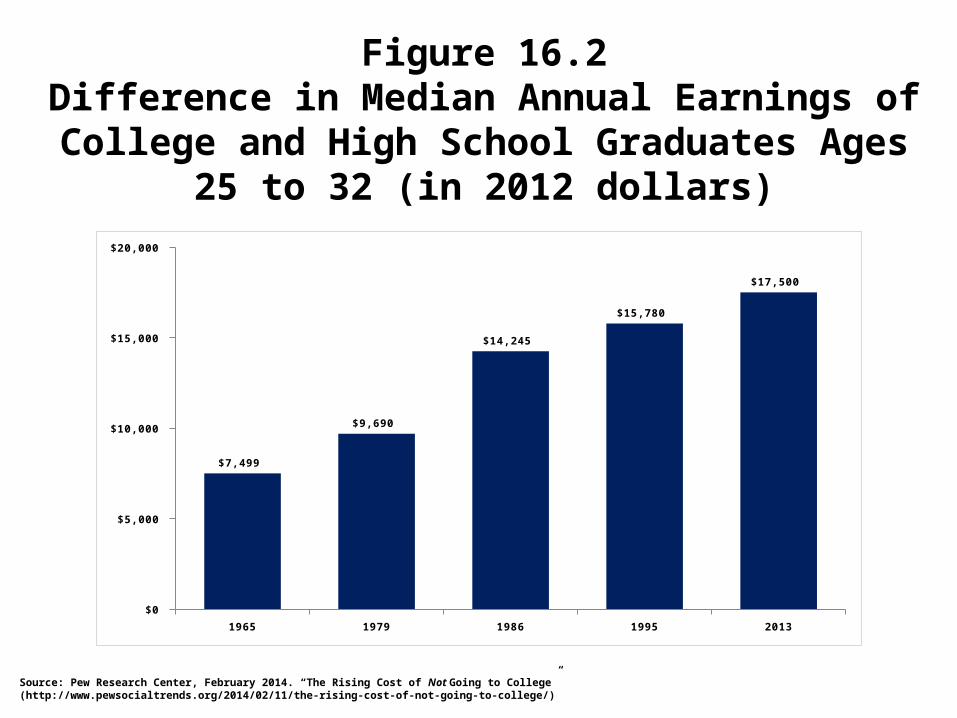
Source: Pew Research Center, February 2014. “The Rising Cost of Not Going to College” (http://www.pewsocialtrends.org/2014/02/11/the-rising-cost-of-not-going-to-college/)
Figure 16.2Difference in Median Annual Earnings of College and High School Graduates Ages
25 to 32 (in 2012 dollars)
1965 1979 1986 1995 2013
$0
$5,000
$10,000
$15,000
$20,000
$7,499
$9,690
$14,245
$15,780
$17,500
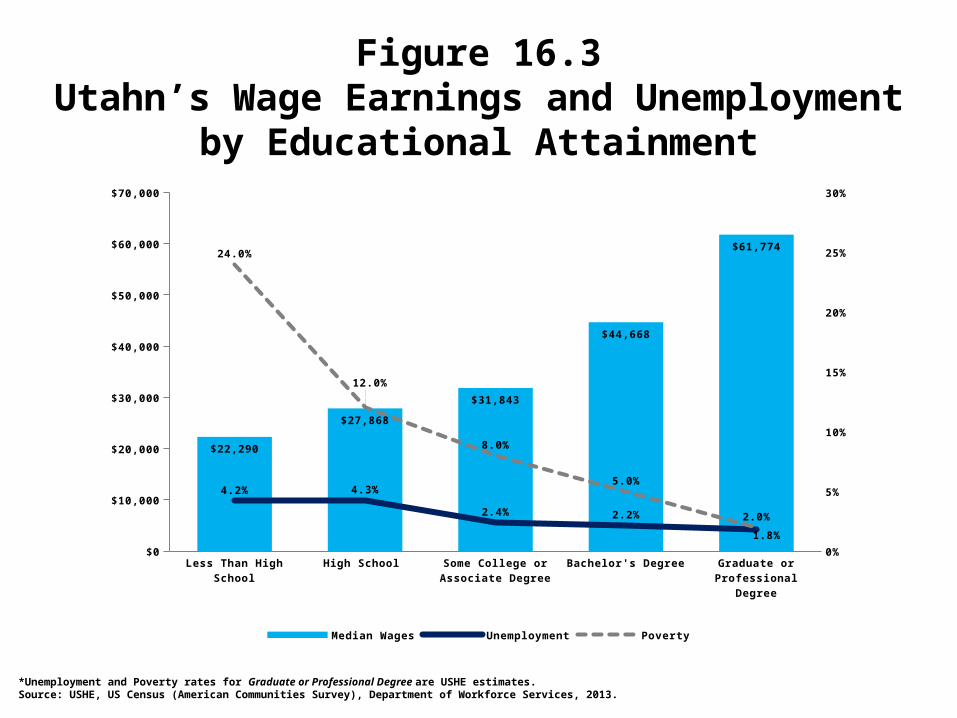
Figure 16.3Utahn’s Wage Earnings and
Unemployment by Educational Attainment
Less
Than
Hig
h Sch
ool
Hig
h Sch
ool
Some
College
or Ass
ociat
e Deg
ree
Bachel
or's D
egre
e
Gra
duate
or Pro
fess
ional
Deg
ree
0%
5%
10%
15%
20%
25%
30%
$0
$10,000
$20,000
$30,000
$40,000
$50,000
$60,000
$70,000
$22,290
$27,868$31,843
$44,668
$61,774
4.2% 4.3%2.4% 2.2%
1.8%
24.0%
12.0%
8.0%
5.0%
2.0%
Median Wages Unemployment Poverty
*Unemployment and Poverty rates for Graduate or Professional Degree are USHE estimates.Source: USHE, US Census (American Communities Survey), Department of Workforce Services, 2013.
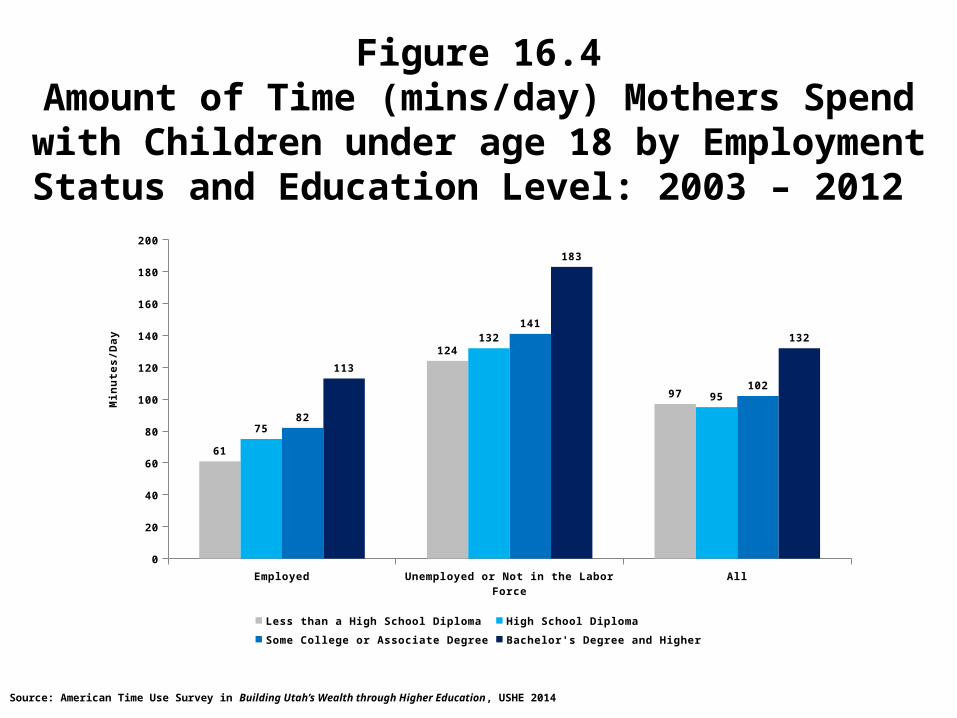
Source: American Time Use Survey in Building Utah’s Wealth through Higher Education, USHE 2014
Employed Unemployed or Not in the Labor Force
All
0
20
40
60
80
100
120
140
160
180
200
61
124
97
75
132
95
82
141
102
113
183
132
Less than a High School Diploma High School Diploma
Some College or Associate Degree Bachelor's Degree and Higher
Min
ute
s/D
ay
Figure 16.4Amount of Time (mins/day) Mothers Spend with Children under age 18 by Employment Status and Education Level: 2003 – 2012
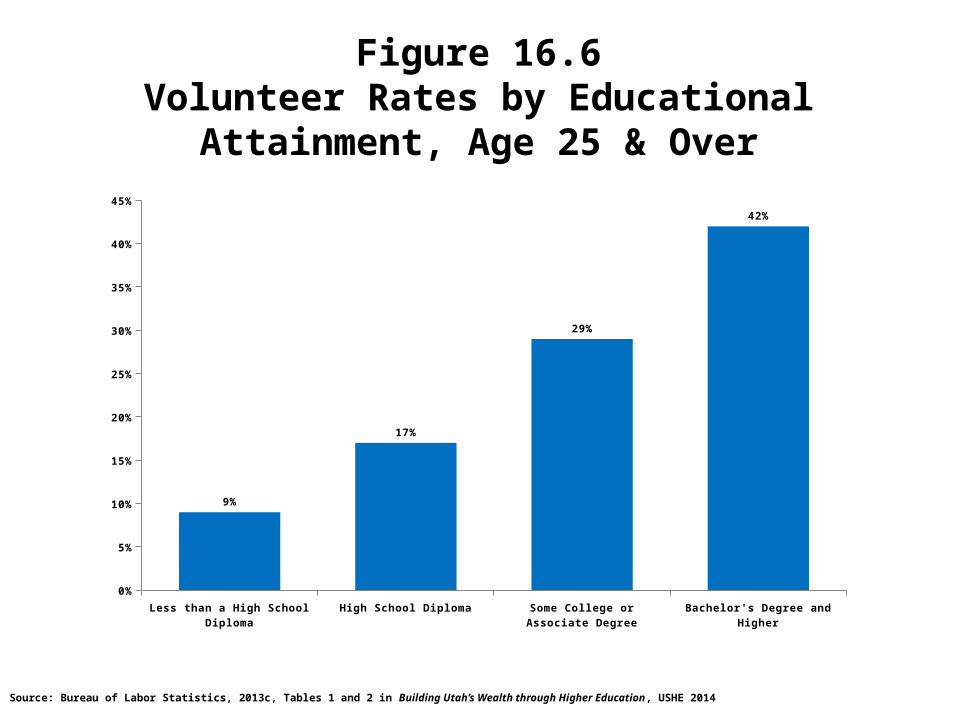
Source: Bureau of Labor Statistics, 2013c, Tables 1 and 2 in Building Utah’s Wealth through Higher Education, USHE 2014
Less
than
a H
igh S
chool D
iplo
ma
Hig
h Sch
ool Dip
lom
a
Some
College
or Ass
ociat
e Deg
ree
Bachel
or's D
egre
e an
d Hig
her
0%
5%
10%
15%
20%
25%
30%
35%
40%
45%
9%
17%
29%
42%
Figure 16.6Volunteer Rates by Educational
Attainment, Age 25 & Over
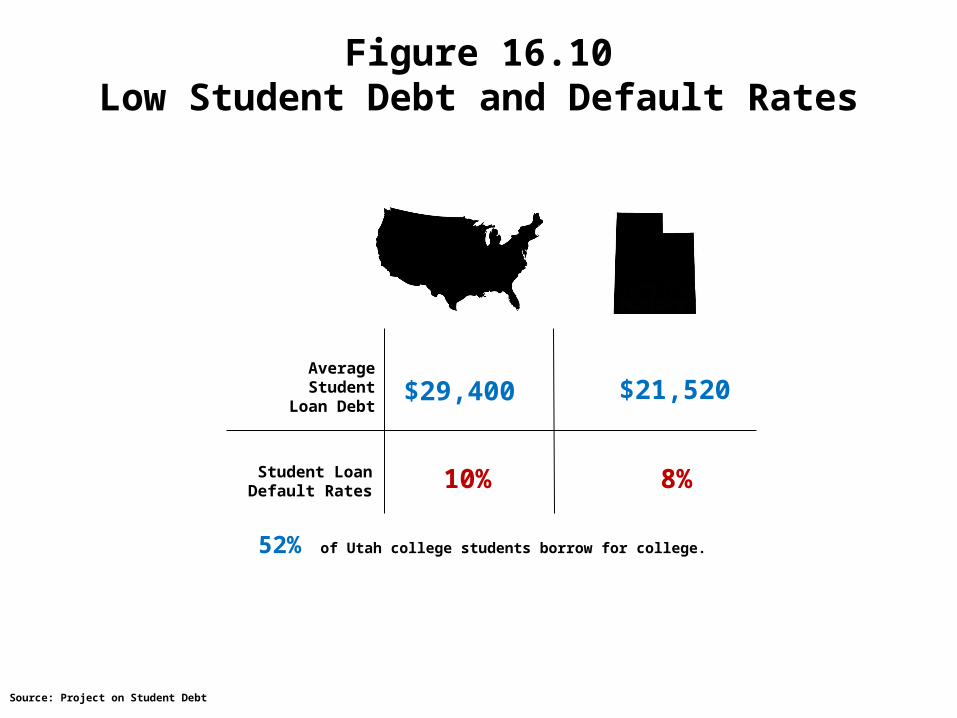
Figure 16.10Low Student Debt and Default Rates
Source: Project on Student Debt
52% of Utah college students borrow for college.
Student Loan Default Rates
Average Student
Loan Debt$29,400 $21,520
10% 8%
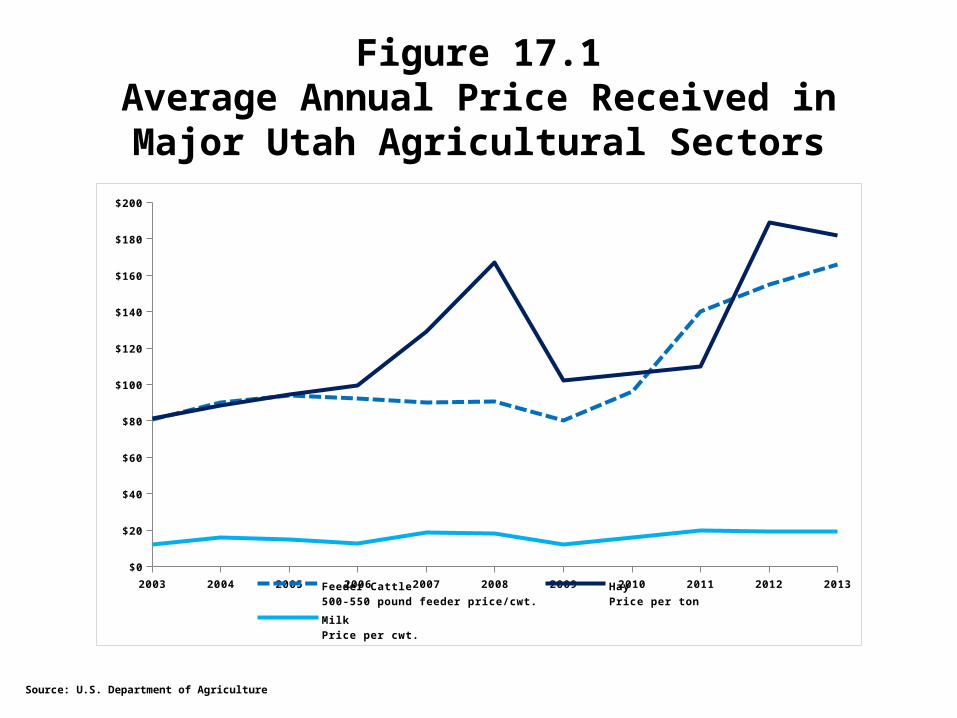
2003 2004 2005 2006 2007 2008 2009 2010 2011 2012 2013
$0
$20
$40
$60
$80
$100
$120
$140
$160
$180
$200
Feeder Cattle500-550 pound feeder price/cwt.
HayPrice per ton
MilkPrice per cwt.
Figure 17.1Average Annual Price Received in Major
Utah Agricultural Sectors
Source: U.S. Department of Agriculture
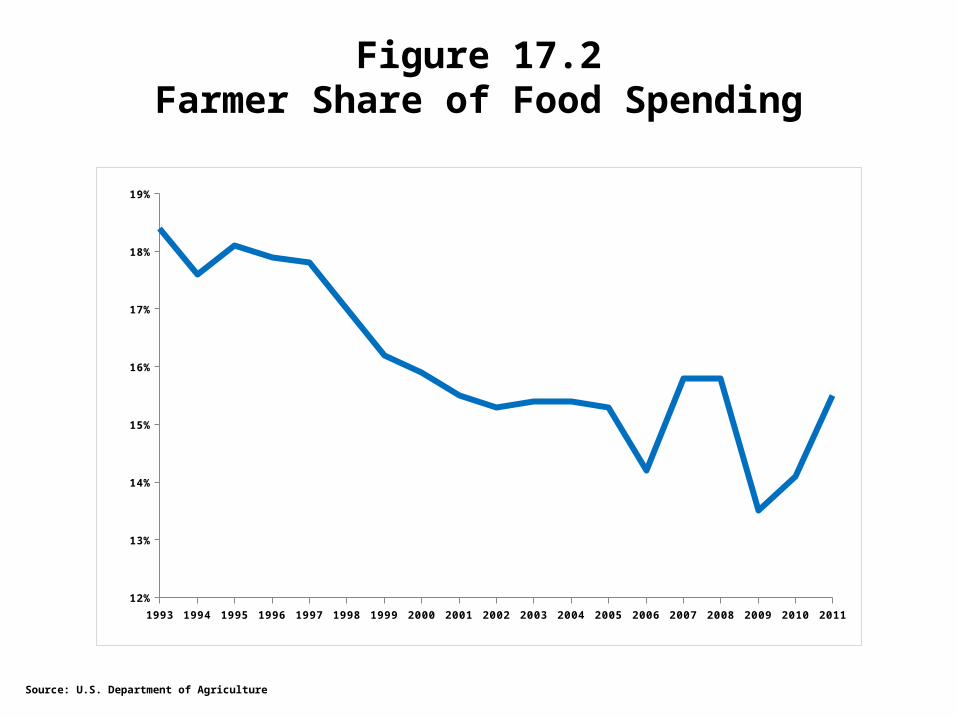
1993 1994 1995 1996 1997 1998 1999 2000 2001 2002 2003 2004 2005 2006 2007 2008 2009 2010 2011
12%
13%
14%
15%
16%
17%
18%
19%
Figure 17.2Farmer Share of Food Spending
Source: U.S. Department of Agriculture
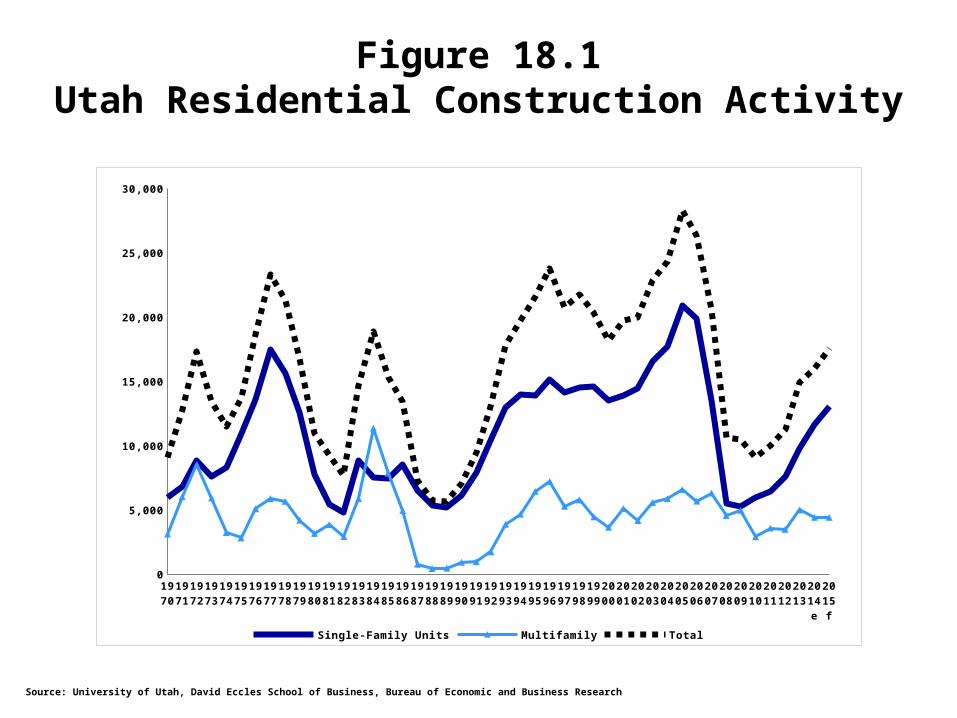
Figure 18.1Utah Residential Construction Activity
Source: University of Utah, David Eccles School of Business, Bureau of Economic and Business Research
1970
1971
1972
1973
1974
1975
1976
1977
1978
1979
1980
1981
1982
1983
1984
1985
1986
1987
1988
1989
1990
1991
1992
1993
1994
1995
1996
1997
1998
1999
2000
2001
2002
2003
2004
2005
2006
2007
2008
2009
2010
2011
2012
2013
2014e
2015f
0
5,000
10,000
15,000
20,000
25,000
30,000
Single-Family Units Multifamily Total
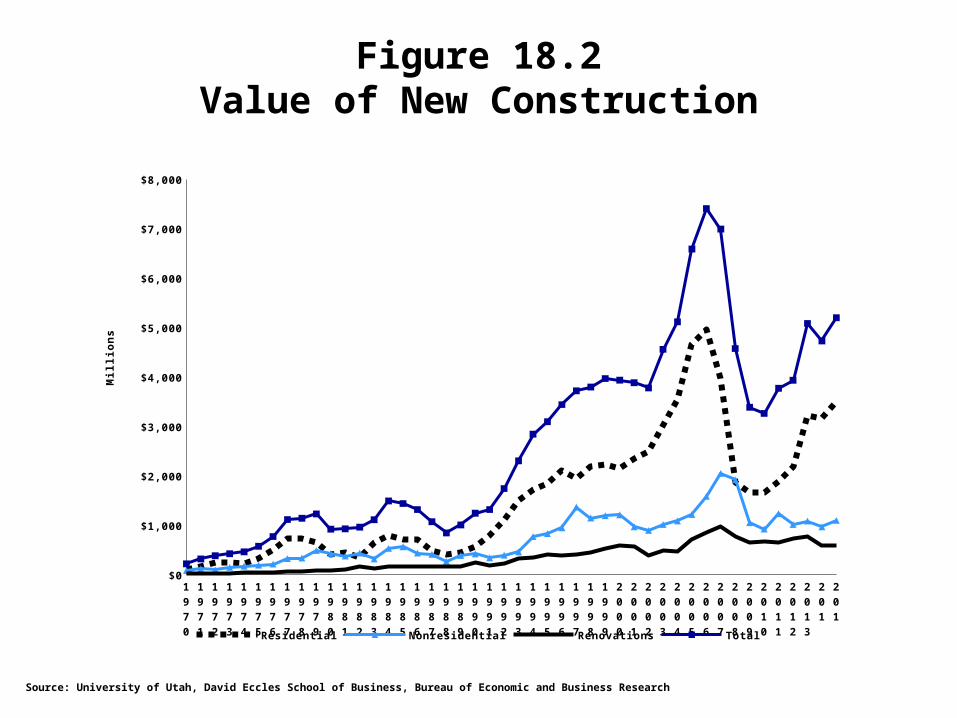
Figure 18.2Value of New Construction
Source: University of Utah, David Eccles School of Business, Bureau of Economic and Business Research
1970
1971
1972
1973
1974
1975
1976
1977
1978
1979
1980
1981
1982
1983
1984
1985
1986
1987
1988
1989
1990
1991
1992
1993
1994
1995
1996
1997
1998
1999
2000
2001
2002
2003
2004
2005
2006
2007
2008
2009
2010
2011
2012
2013
2014e
2015f
$0
$1,000
$2,000
$3,000
$4,000
$5,000
$6,000
$7,000
$8,000
Residential Nonresidential Renovations Total
Mil
lio
ns
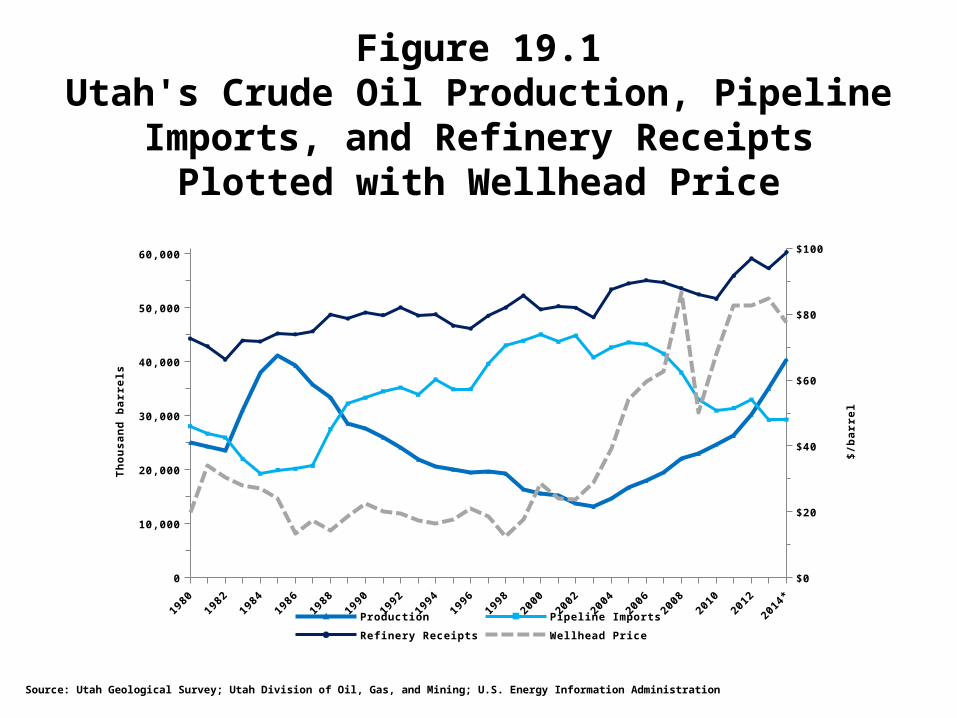
Figure 19.1Utah's Crude Oil Production, Pipeline
Imports, and Refinery Receipts Plotted with Wellhead Price
1980
1982
1984
1986
1988
1990
1992
1994
1996
1998
2000
2002
2004
2006
2008
2010
2012
2014*
0
10,000
20,000
30,000
40,000
50,000
60,000
$0
$20
$40
$60
$80
$100
Production Pipeline Imports Refinery Receipts Wellhead Price
Th
ou
san
d b
arr
els
$/b
arr
el
Source: Utah Geological Survey; Utah Division of Oil, Gas, and Mining; U.S. Energy Information Administration
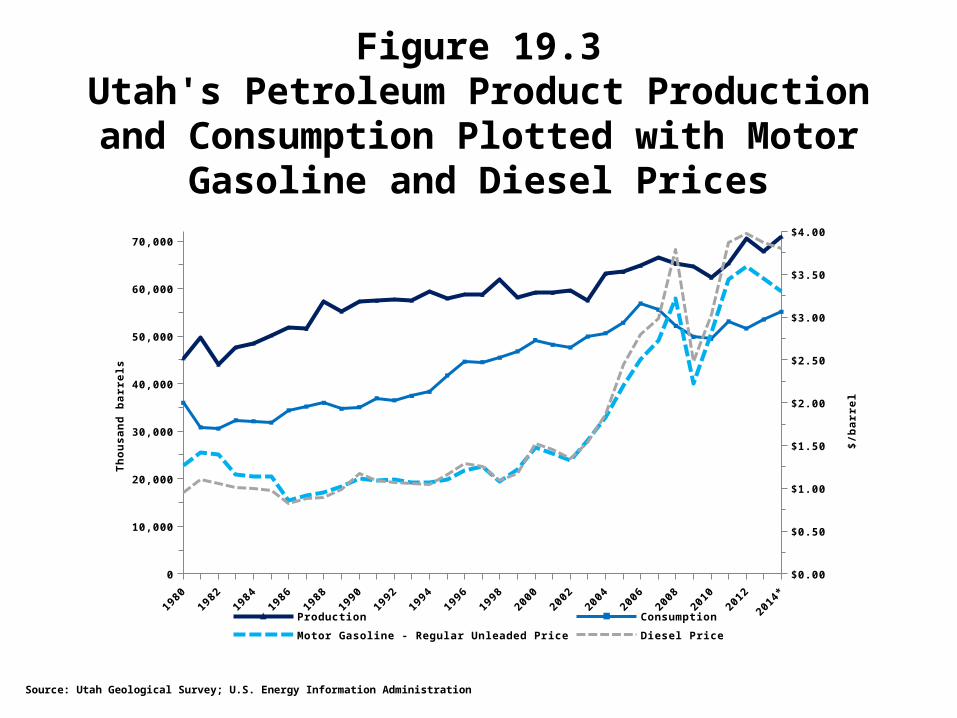
Figure 19.3Utah's Petroleum Product Production and Consumption Plotted with Motor
Gasoline and Diesel Prices
1980
1982
1984
1986
1988
1990
1992
1994
1996
1998
2000
2002
2004
2006
2008
2010
2012
2014*
0
10,000
20,000
30,000
40,000
50,000
60,000
70,000
$0.00
$0.50
$1.00
$1.50
$2.00
$2.50
$3.00
$3.50
$4.00
Production Consumption
Motor Gasoline - Regular Unleaded Price Diesel Price
Th
ou
san
d b
arr
els
$/b
arr
el
Source: Utah Geological Survey; U.S. Energy Information Administration
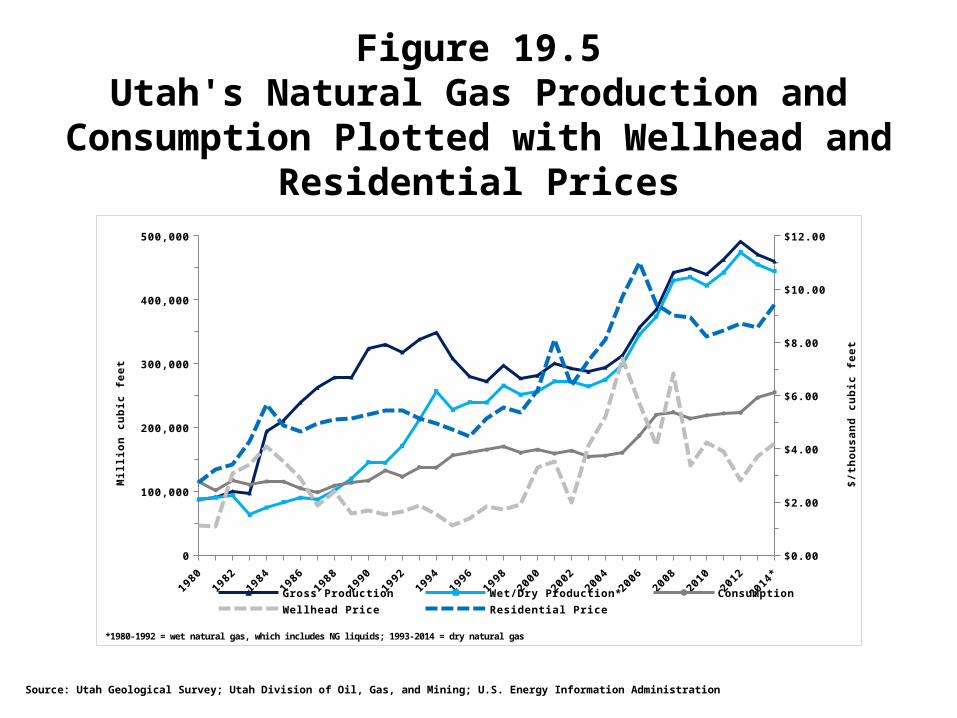
Figure 19.5Utah's Natural Gas Production and
Consumption Plotted with Wellhead and Residential Prices
1980
1982
1984
1986
1988
1990
1992
1994
1996
1998
2000
2002
2004
2006
2008
2010
2012
2014*
0
100,000
200,000
300,000
400,000
500,000
$0.00
$2.00
$4.00
$6.00
$8.00
$10.00
$12.00
Gross Production Wet/Dry Production* Consumption
Wellhead Price Residential Price
Mil
lio
n c
ub
ic f
eet
*1980-1992 = wet natural gas, which includes NG liquids; 1993-2014 = dry natural gas
$/t
ho
usan
d c
ub
ic f
eet
Source: Utah Geological Survey; Utah Division of Oil, Gas, and Mining; U.S. Energy Information Administration
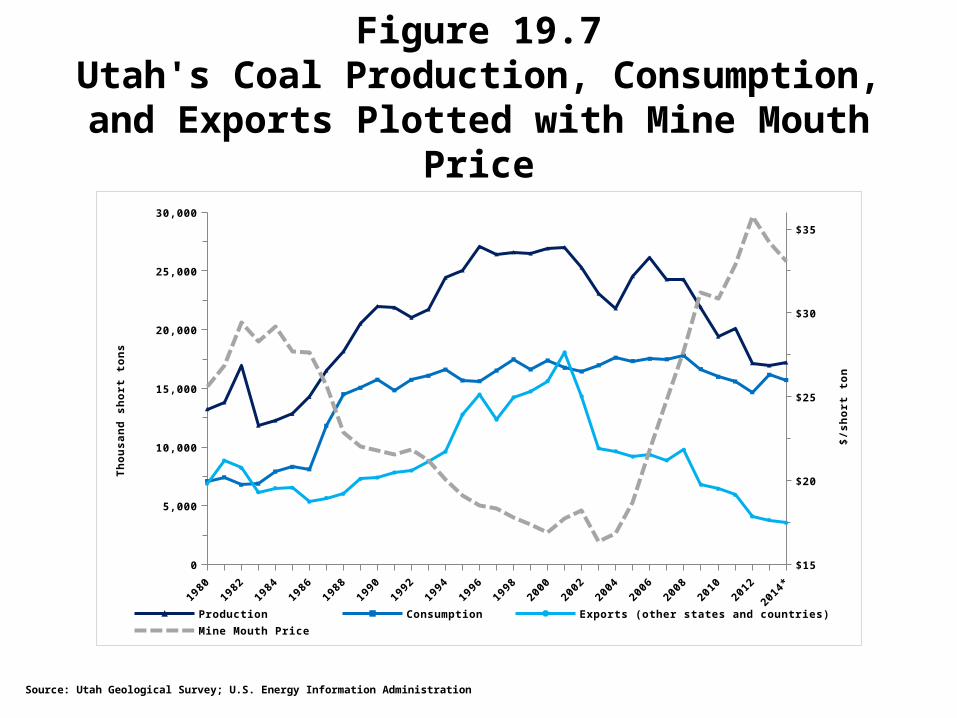
Figure 19.7Utah's Coal Production, Consumption, and
Exports Plotted with Mine Mouth Price
1980
1982
1984
1986
1988
1990
1992
1994
1996
1998
2000
2002
2004
2006
2008
2010
2012
2014*
0
5,000
10,000
15,000
20,000
25,000
30,000
$15
$20
$25
$30
$35
Production Consumption Exports (other states and countries) Mine Mouth Price
Th
ou
san
d s
ho
rt t
on
s
$/s
ho
rt t
on
Source: Utah Geological Survey; U.S. Energy Information Administration
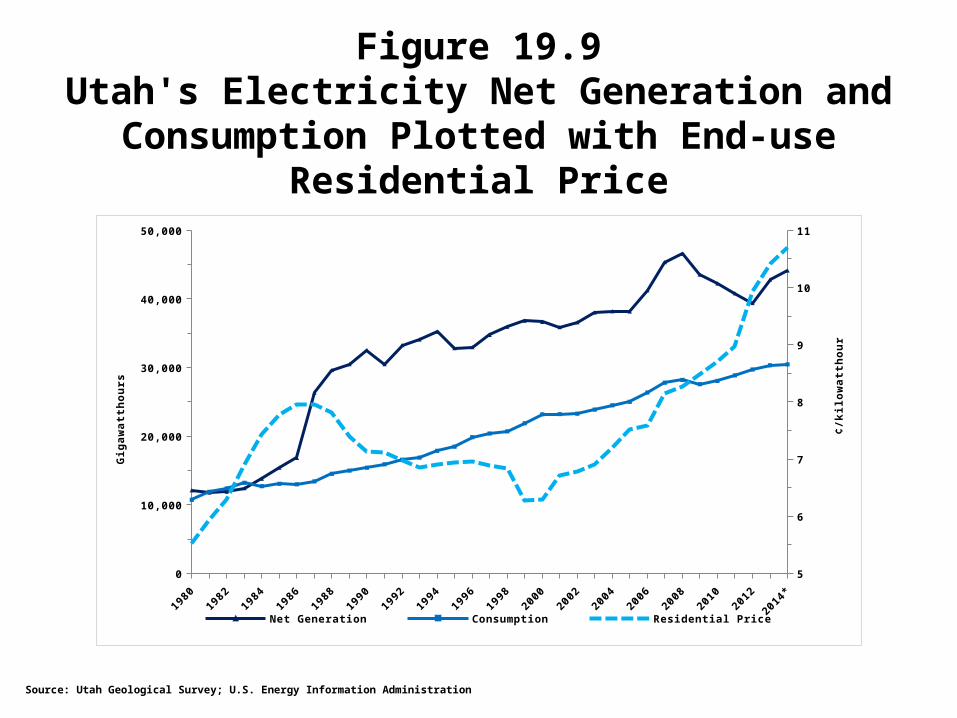
Figure 19.9Utah's Electricity Net Generation and
Consumption Plotted with End-use Residential Price
1980
1982
1984
1986
1988
1990
1992
1994
1996
1998
2000
2002
2004
2006
2008
2010
2012
2014*
0
10,000
20,000
30,000
40,000
50,000
5
6
7
8
9
10
11
Net Generation Consumption Residential Price
Gig
aw
att
ho
urs
¢/k
ilo
watt
ho
ur
Source: Utah Geological Survey; U.S. Energy Information Administration
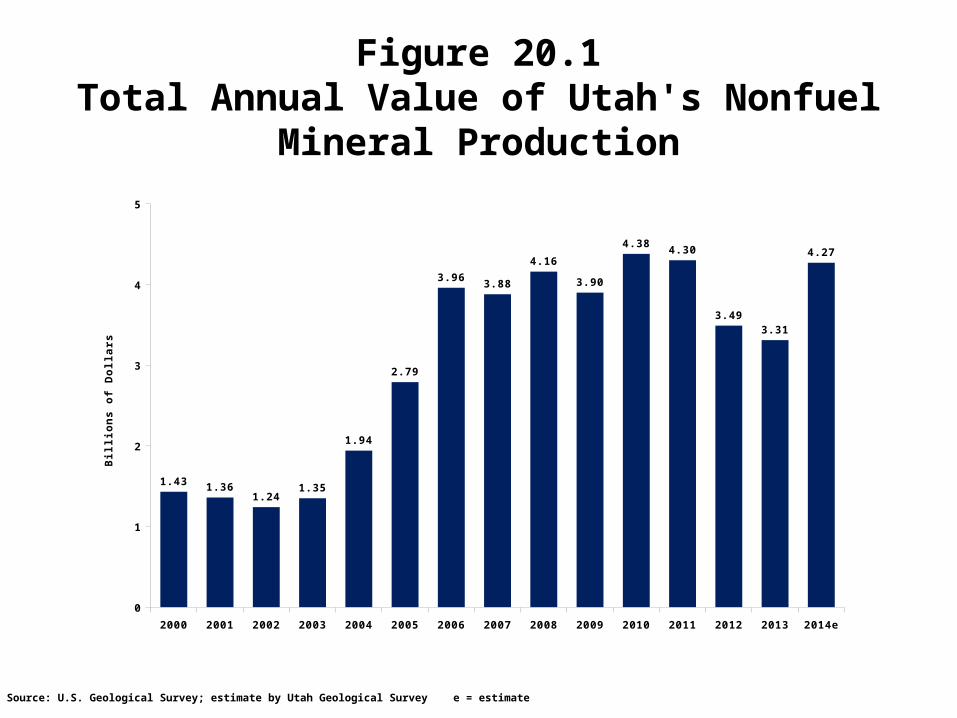
Figure 20.1Total Annual Value of Utah's Nonfuel
Mineral Production
2000 2001 2002 2003 2004 2005 2006 2007 2008 2009 2010 2011 2012 2013 2014e
0
1
2
3
4
5
1.43 1.361.24
1.35
1.94
2.79
3.963.88
4.16
3.90
4.384.30
3.493.31
4.27
Bil
lio
ns o
f D
oll
ars
Source: U.S. Geological Survey; estimate by Utah Geological Survey e = estimate
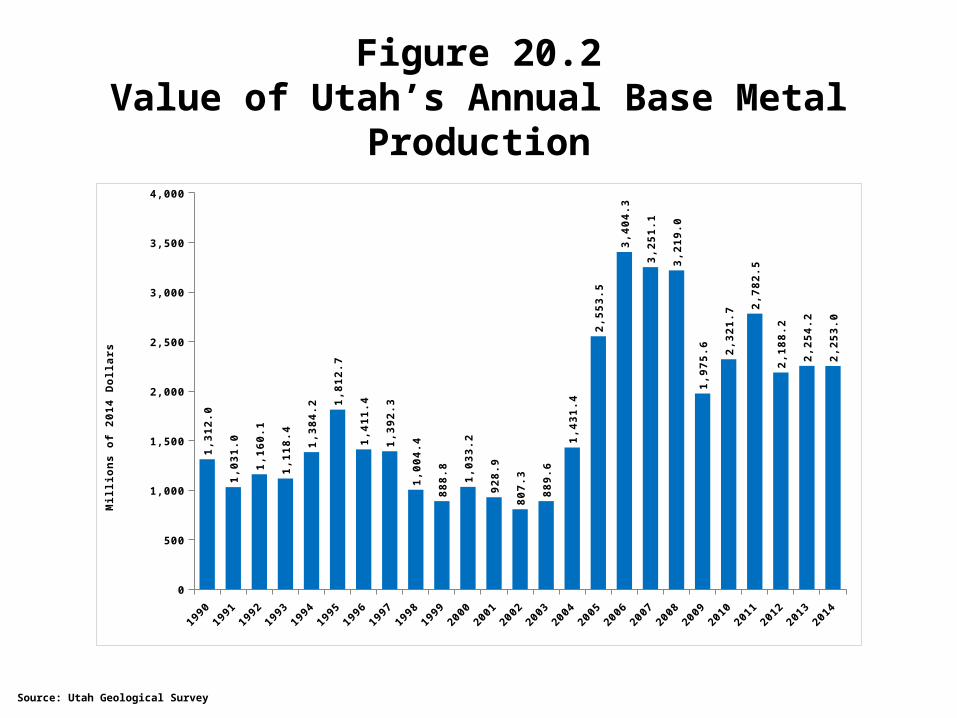
Figure 20.2Value of Utah’s Annual Base Metal
Production
1990
1991
1992
1993
1994
1995
1996
1997
1998
1999
2000
2001
2002
2003
2004
2005
2006
2007
2008
2009
2010
2011
2012
2013
2014
0
500
1,000
1,500
2,000
2,500
3,000
3,500
4,0001
,31
2.0
1,0
31
.0
1,1
60
.1
1,1
18
.4
1,3
84
.2
1,8
12
.7
1,4
11
.4
1,3
92
.3
1,0
04
.4
88
8.8
1,0
33
.2
92
8.9
80
7.3
88
9.6
1,4
31
.4
2,5
53
.5
3,4
04
.3
3,2
51
.1
3,2
19
.0
1,9
75
.6 2,3
21
.7
2,7
82
.5
2,1
88
.2
2,2
54
.2
2,2
53
.0
Mil
lio
ns o
f 2
01
4 D
oll
ars
Source: Utah Geological Survey
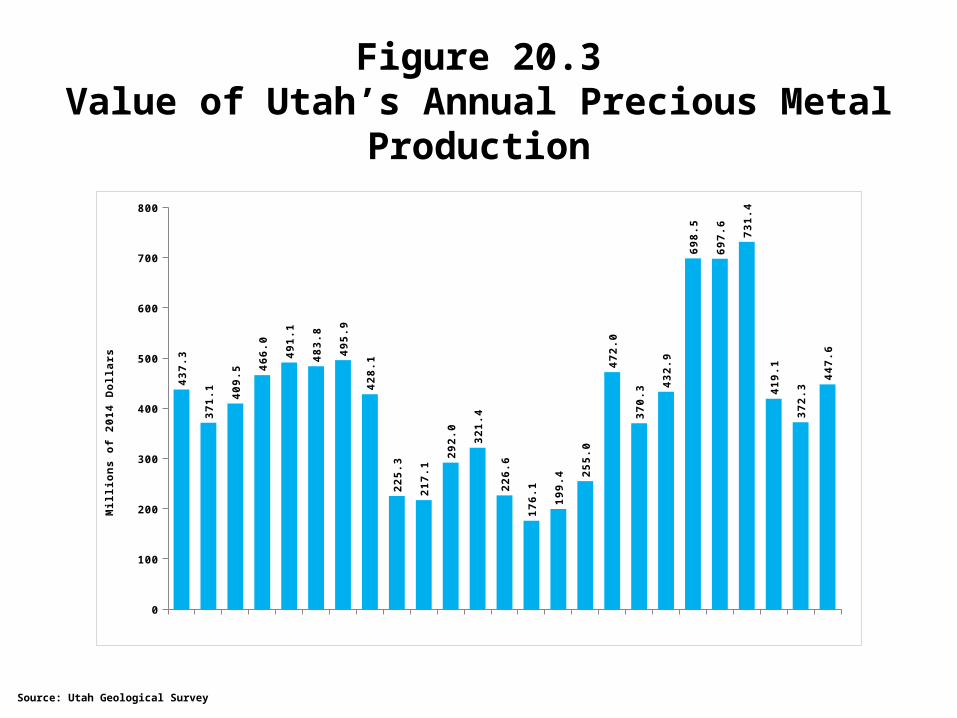
Figure 20.3Value of Utah’s Annual Precious Metal
Production
0
100
200
300
400
500
600
700
800
43
7.3
37
1.1 40
9.5 4
66
.0
49
1.1
48
3.8
49
5.9
42
8.1
22
5.3
21
7.1
29
2.0
32
1.4
22
6.6
17
6.1
19
9.4 2
55
.0
47
2.0
37
0.3
43
2.9
69
8.5
69
7.6
73
1.4
41
9.1
37
2.3
44
7.6
Mil
lio
ns o
f 2
01
4 D
oll
ars
Source: Utah Geological Survey
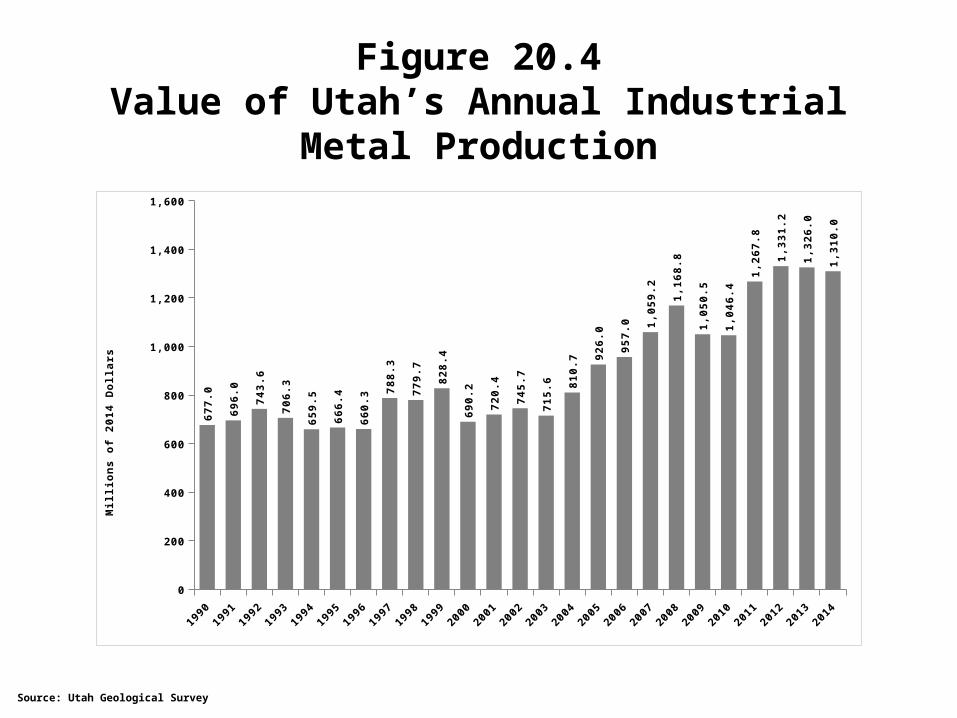
Figure 20.4Value of Utah’s Annual Industrial Metal
Production
1990
1991
1992
1993
1994
1995
1996
1997
1998
1999
2000
2001
2002
2003
2004
2005
2006
2007
2008
2009
2010
2011
2012
2013
2014
0
200
400
600
800
1,000
1,200
1,400
1,6006
77
.0
69
6.0
74
3.6
70
6.3
65
9.5
66
6.4
66
0.3
78
8.3
77
9.7
82
8.4
69
0.2
72
0.4
74
5.7
71
5.6 81
0.7 9
26
.0
95
7.0 1
,05
9.2
1,1
68
.8
1,0
50
.5
1,0
46
.4
1,2
67
.8
1,3
31
.2
1,3
26
.0
1,3
10
.0
Mil
lio
ns o
f 2
01
4 D
oll
ars
Source: Utah Geological Survey
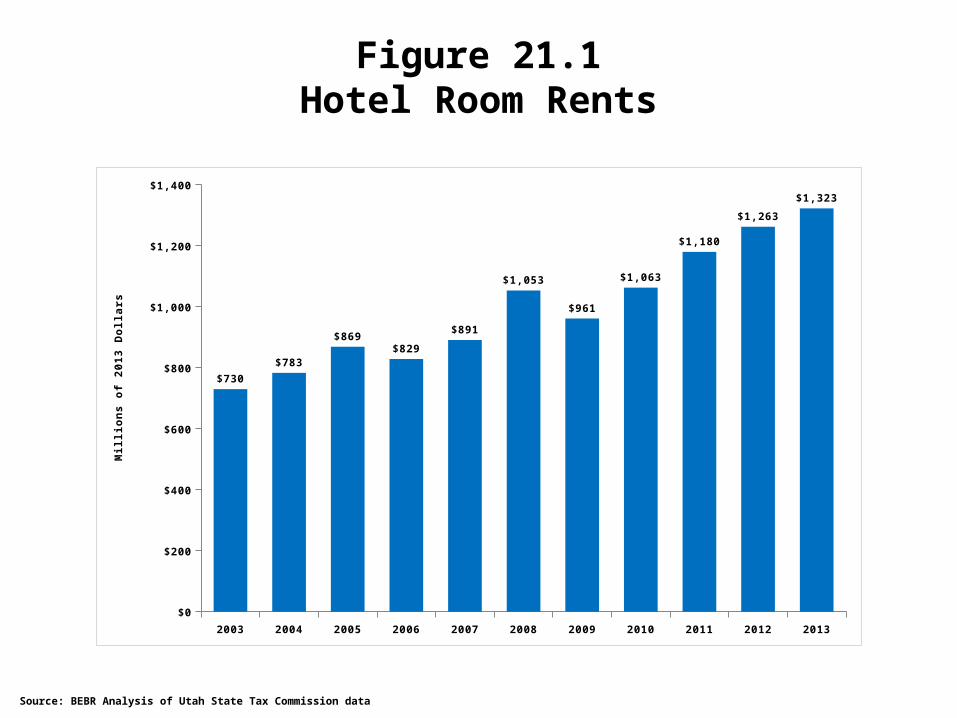
Figure 21.1Hotel Room Rents
2003 2004 2005 2006 2007 2008 2009 2010 2011 2012 2013
$0
$200
$400
$600
$800
$1,000
$1,200
$1,400
$730
$783
$869$829
$891
$1,053
$961
$1,063
$1,180
$1,263
$1,323
Mil
lio
ns o
f 2
01
3 D
oll
ars
Source: BEBR Analysis of Utah State Tax Commission data
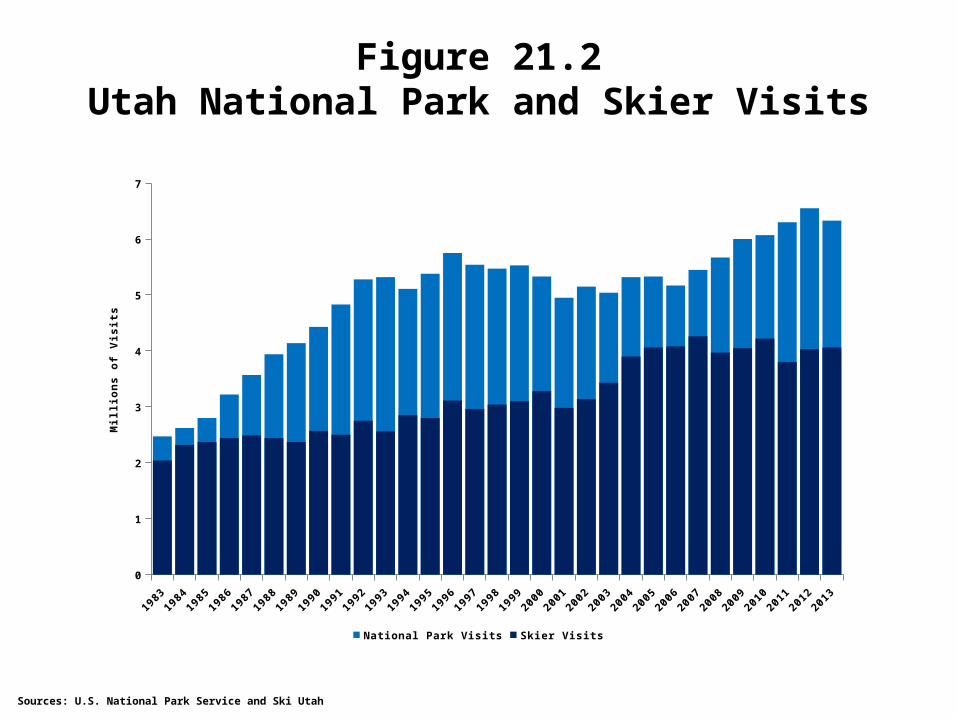
Figure 21.2Utah National Park and Skier Visits
1983
1984
1985
1986
1987
1988
1989
1990
1991
1992
1993
1994
1995
1996
1997
1998
1999
2000
2001
2002
2003
2004
2005
2006
2007
2008
2009
2010
2011
2012
2013
0
1
2
3
4
5
6
7
National Park Visits Skier Visits
Mil
lio
ns o
f V
isit
s
Sources: U.S. National Park Service and Ski Utah
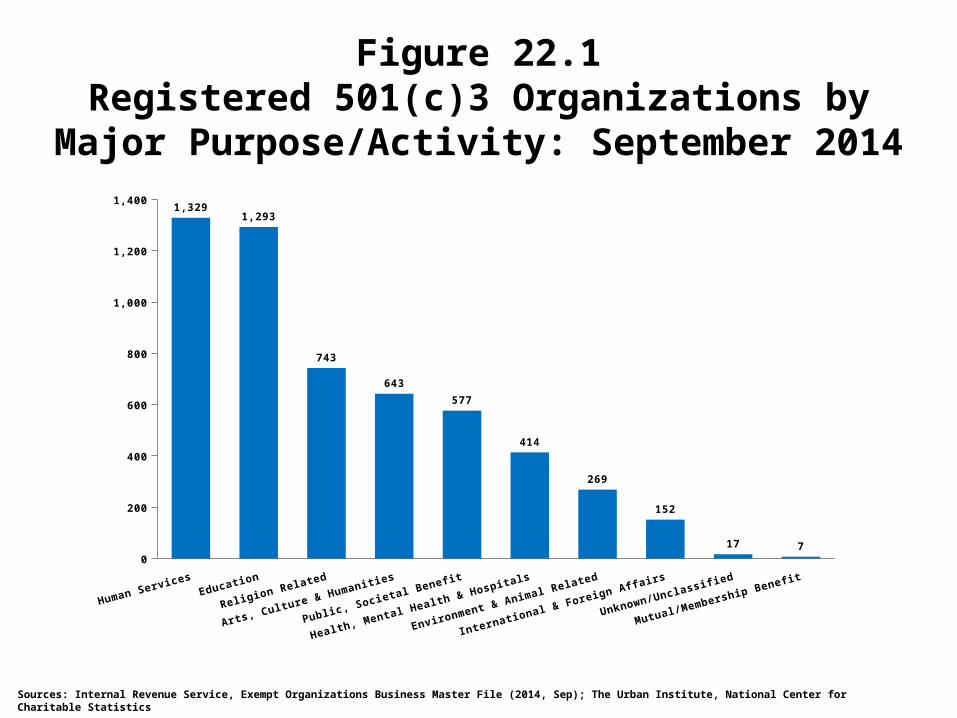
Figure 22.1Registered 501(c)3 Organizations by Major
Purpose/Activity: September 2014
0
200
400
600
800
1,000
1,200
1,4001,329
1,293
743
643
577
414
269
152
17 7
Sources: Internal Revenue Service, Exempt Organizations Business Master File (2014, Sep); The Urban Institute, National Center for Charitable Statistics
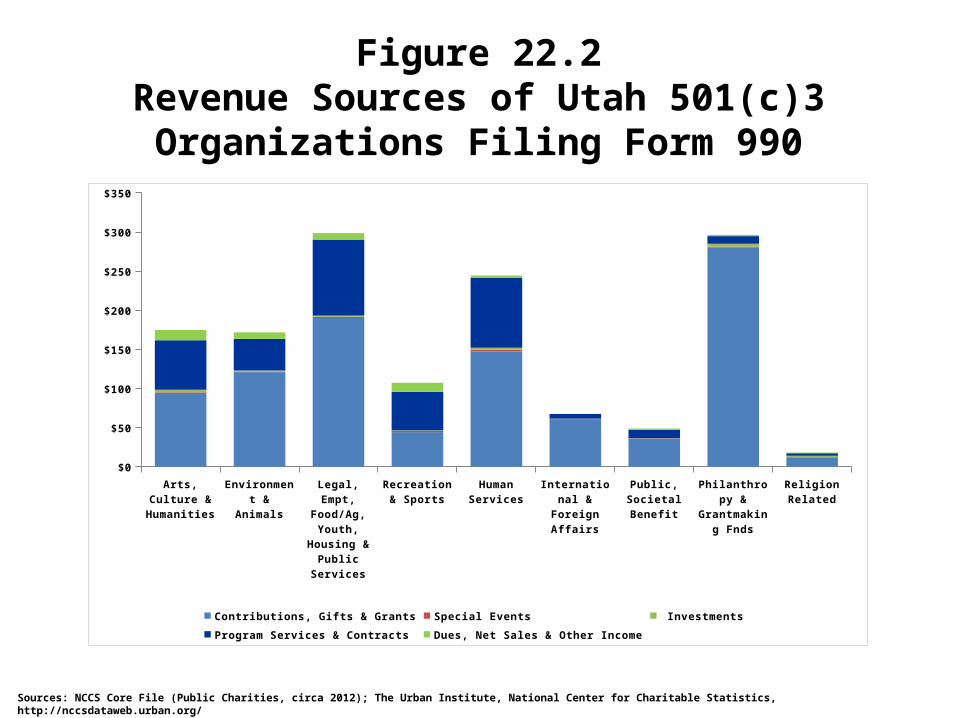
Figure 22.2Revenue Sources of Utah 501(c)3
Organizations Filing Form 990
Sources: NCCS Core File (Public Charities, circa 2012); The Urban Institute, National Center for Charitable Statistics, http://nccsdataweb.urban.org/
Arts, Cul-ture &
Humani-ties
Environ-ment & An-
imals
Legal, Empt,
Food/Ag, Youth,
Housing & Public
Services
Recreation & Sports
Human Services
Interna-tional &
Foreign Af-fairs
Public, So-cietal Bene-
fit
Philan-thropy &
Grantmak-ing Fnds
Religion Re-lated
$0
$50
$100
$150
$200
$250
$300
$350
Contributions, Gifts & Grants Special Events Investments
Program Services & Contracts Dues, Net Sales & Other Income
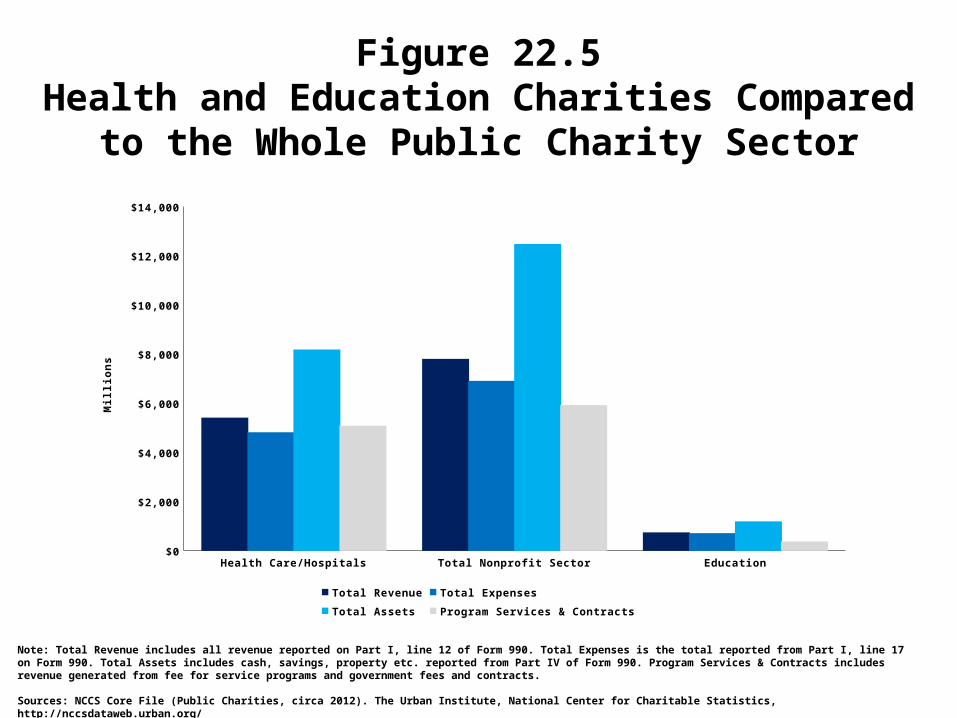
Figure 22.5Health and Education Charities Compared to
the Whole Public Charity Sector
Note: Total Revenue includes all revenue reported on Part I, line 12 of Form 990. Total Expenses is the total reported from Part I, line 17 on Form 990. Total Assets includes cash, savings, property etc. reported from Part IV of Form 990. Program Services & Contracts includes revenue generated from fee for service programs and government fees and contracts.
Sources: NCCS Core File (Public Charities, circa 2012). The Urban Institute, National Center for Charitable Statistics, http://nccsdataweb.urban.org/
Health Care/Hospitals Total Nonprofit Sector Education$0
$2,000
$4,000
$6,000
$8,000
$10,000
$12,000
$14,000
Total Revenue Total Expenses
Total Assets Program Services & Contracts
Mil
lio
ns
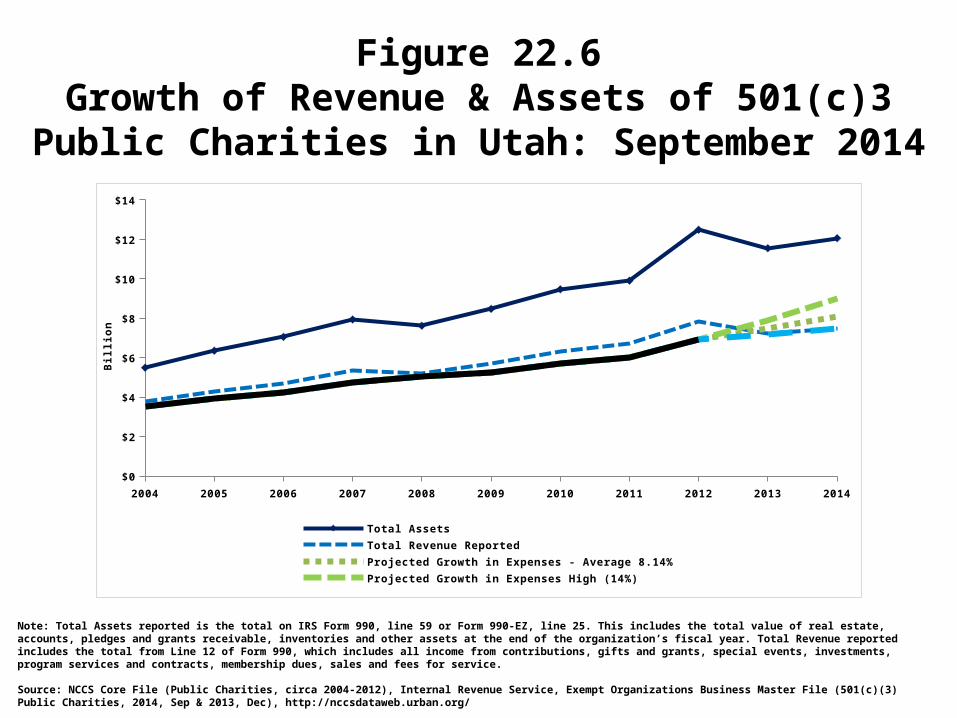
Figure 22.6Growth of Revenue & Assets of 501(c)3
Public Charities in Utah: September 2014
Note: Total Assets reported is the total on IRS Form 990, line 59 or Form 990-EZ, line 25. This includes the total value of real estate, accounts, pledges and grants receivable, inventories and other assets at the end of the organization’s fiscal year. Total Revenue reported includes the total from Line 12 of Form 990, which includes all income from contributions, gifts and grants, special events, investments, program services and contracts, membership dues, sales and fees for service.
Source: NCCS Core File (Public Charities, circa 2004-2012), Internal Revenue Service, Exempt Organizations Business Master File (501(c)(3) Public Charities, 2014, Sep & 2013, Dec), http://nccsdataweb.urban.org/
2004 2005 2006 2007 2008 2009 2010 2011 2012 2013 2014
$0
$2
$4
$6
$8
$10
$12
$14
Total Assets Total Revenue Reported
Projected Growth in Expenses - Average 8.14% Projected Growth in Expenses High (14%)
Projected Growth in Expenses Low (4%) Total Expenses
Bil
lio
n
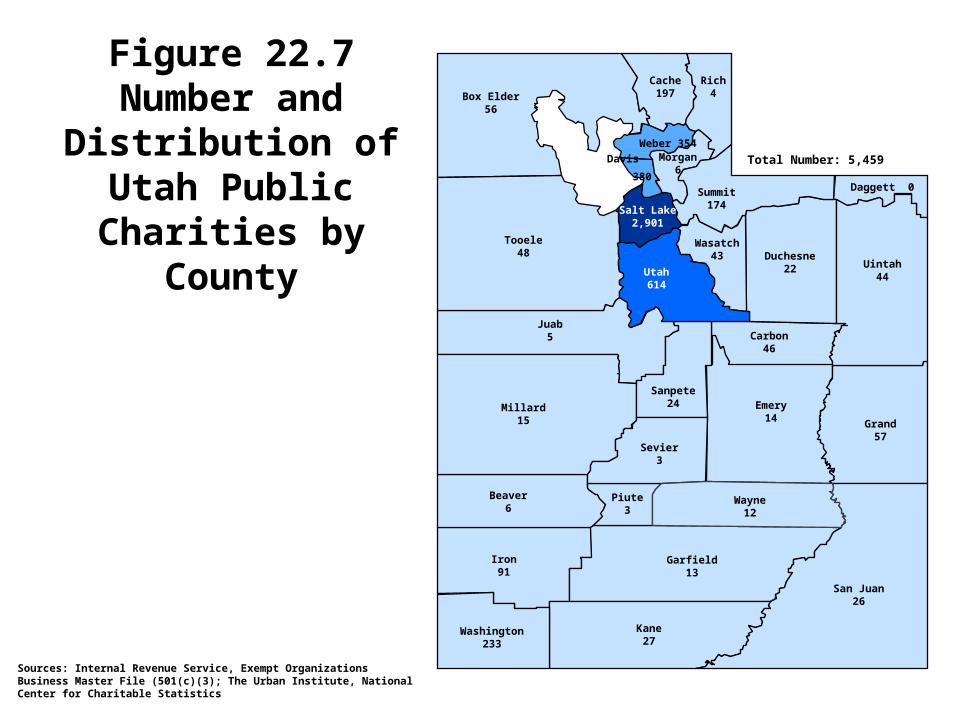
Figure 22.7Number and
Distribution of Utah Public Charities by
County
Sources: Internal Revenue Service, Exempt Organizations Business Master File (501(c)(3); The Urban Institute, National Center for Charitable Statistics
Box Elder56
Cache197
Rich4
Weber 354
Tooele48
Salt Lake2,901
Morgan6
Summit174
Utah614
Wasatch43 Duchesne
22 Uintah44
Juab5
Sanpete24
Carbon46
Emery14 Grand
57
Millard15
Piute3
Garfield13
Sevier3
Wayne12
San Juan26
Iron91
Beaver6
Washington233
Kane27
Davis 380
Daggett 0
Total Number: 5,459
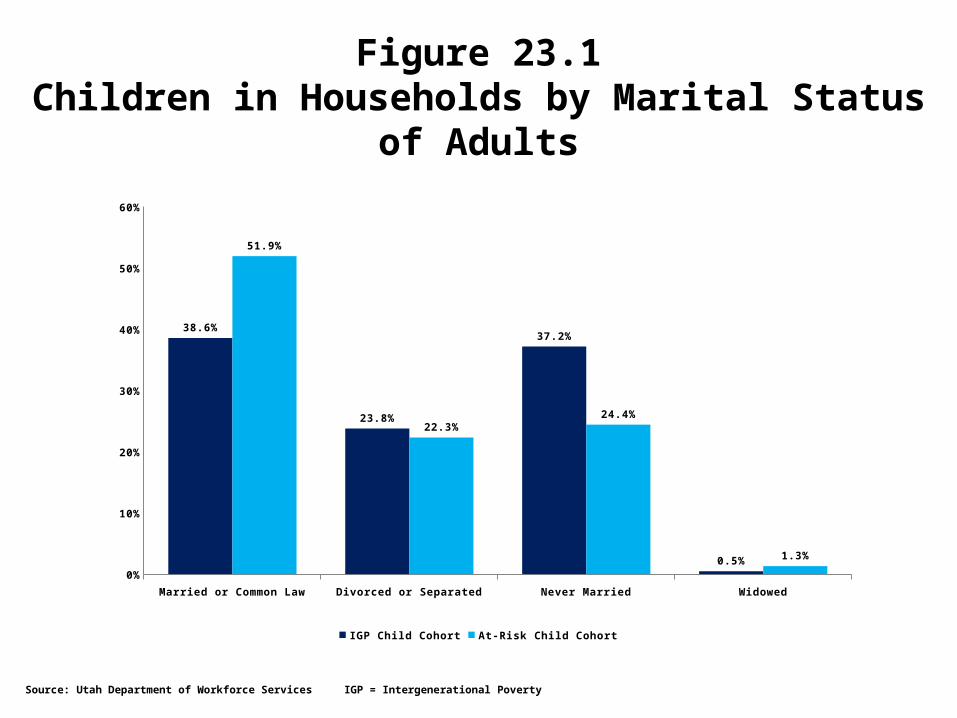
Married or Common Law Divorced or Separated Never Married Widowed
0%
10%
20%
30%
40%
50%
60%
38.6%
23.8%
37.2%
0.5%
51.9%
22.3%24.4%
1.3%
IGP Child Cohort At-Risk Child Cohort
Figure 23.1Children in Households by Marital Status of
Adults
Source: Utah Department of Workforce Services IGP = Intergenerational Poverty
0%
10%
20%
30%
40%
50%
60%
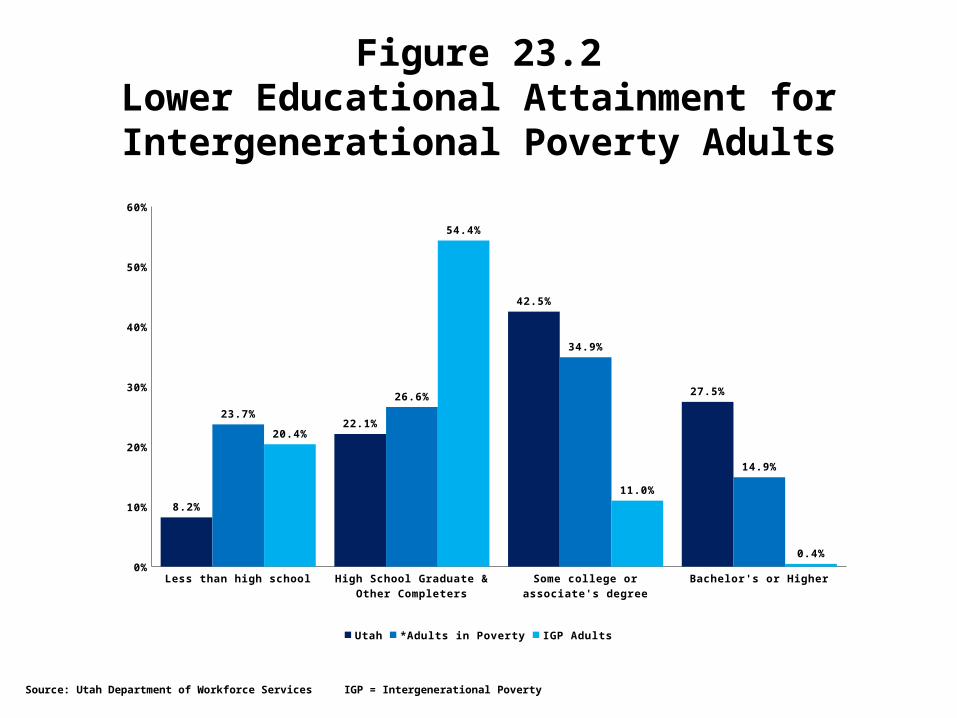
8.2%
22.1%
42.5%
27.5%
23.7%
26.6%
34.9%
14.9%
20.4%
54.4%
11.0%
0.4%
Utah *Adults in Poverty IGP Adults
Figure 23.2Lower Educational Attainment for Intergenerational Poverty Adults
Source: Utah Department of Workforce Services IGP = Intergenerational Poverty
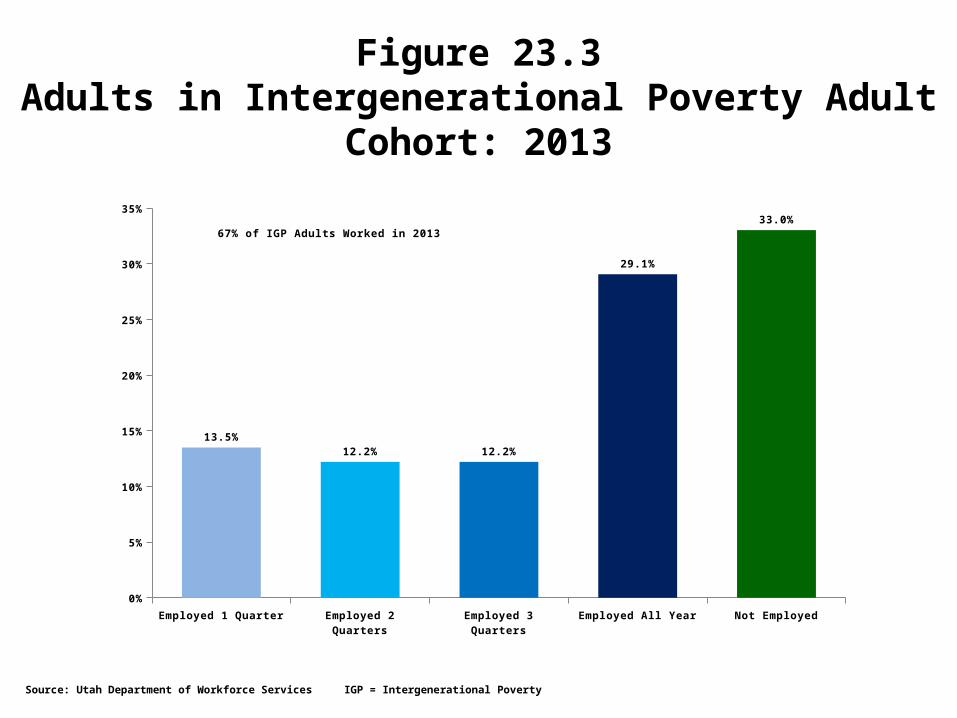
Employed 1 Quarter Employed 2 Quarters Employed 3 Quarters Employed All Year Not Employed
0%
5%
10%
15%
20%
25%
30%
35%
13.5%12.2% 12.2%
29.1%
33.0%67% of IGP Adults Worked in 2013
Figure 23.3Adults in Intergenerational Poverty Adult
Cohort: 2013
Source: Utah Department of Workforce Services IGP = Intergenerational Poverty
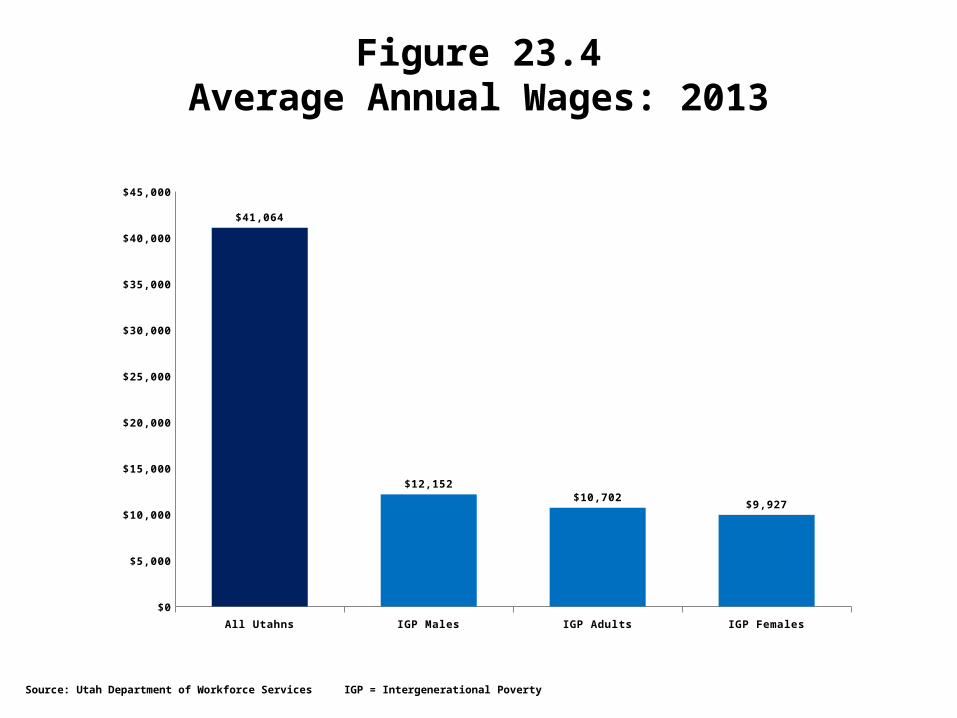
All Utahns IGP Males IGP Adults IGP Females
$0
$5,000
$10,000
$15,000
$20,000
$25,000
$30,000
$35,000
$40,000
$45,000
$41,064
$12,152$10,702
$9,927
Figure 23.4Average Annual Wages: 2013
Source: Utah Department of Workforce Services IGP = Intergenerational Poverty
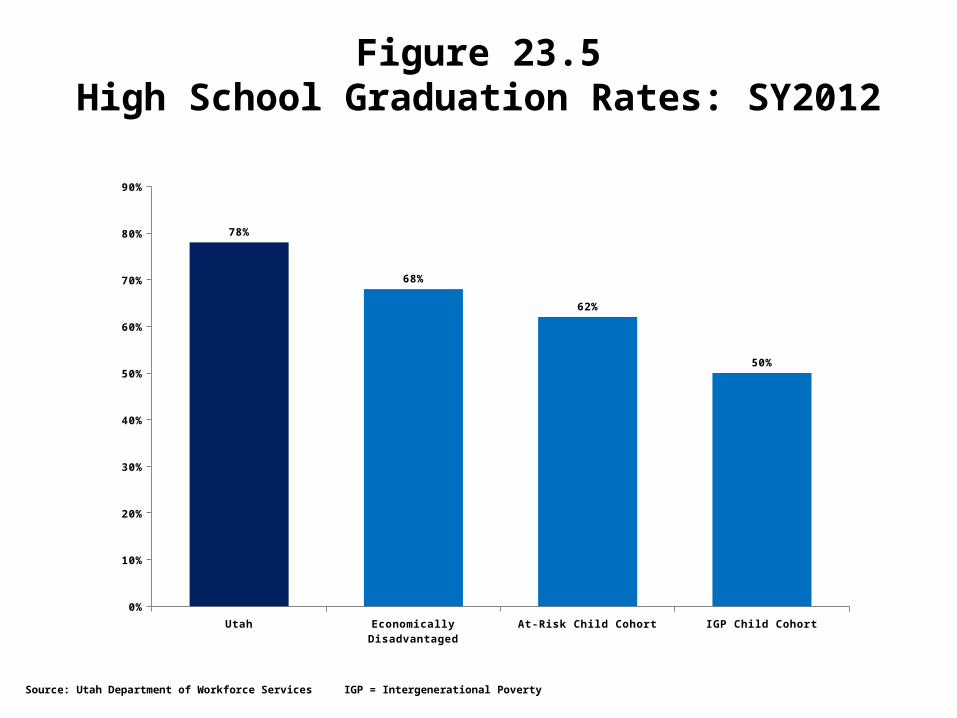
Utah Economically Disadvantaged At-Risk Child Cohort IGP Child Cohort
0%
10%
20%
30%
40%
50%
60%
70%
80%
90%
78%
68%
62%
50%
Figure 23.5High School Graduation Rates: SY2012
Source: Utah Department of Workforce Services IGP = Intergenerational Poverty
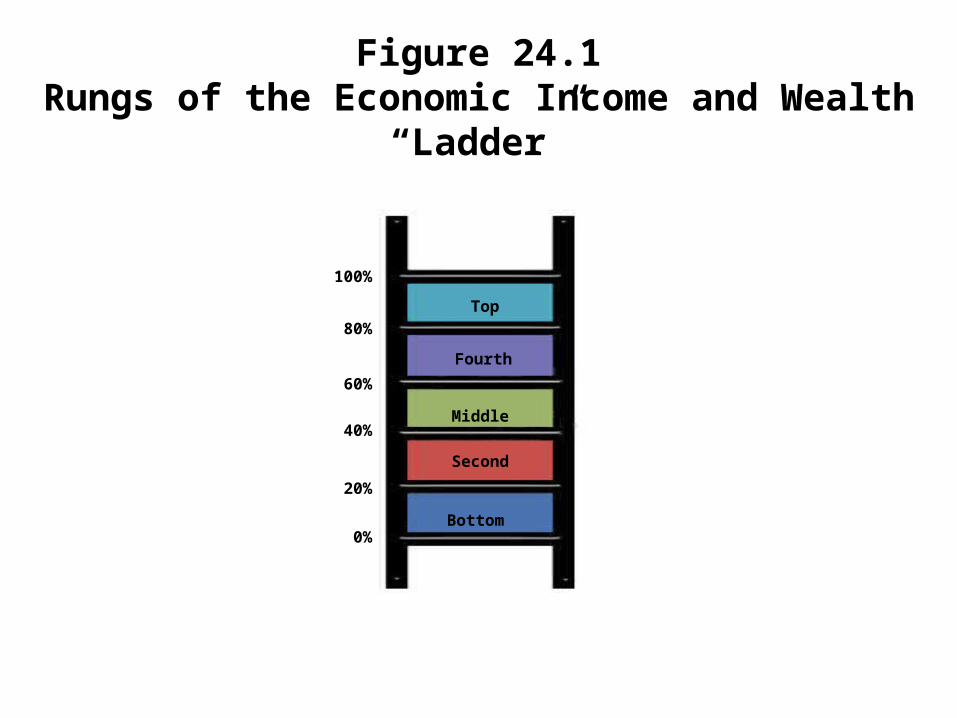
Figure 24.1Rungs of the Economic Income and Wealth
“Ladder”
0%Bottom
20%
40%
60%
80%
100%
Second
Middle
Fourth
Top
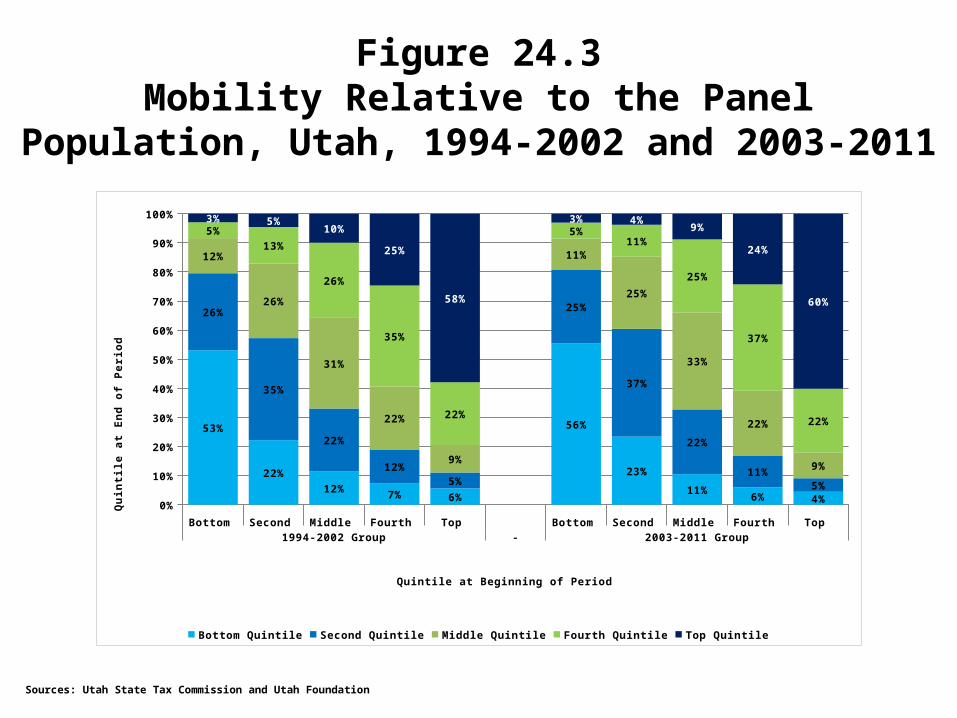
Figure 24.3Mobility Relative to the Panel Population,
Utah, 1994-2002 and 2003-2011
Sources: Utah State Tax Commission and Utah Foundation
Bottom Second Middle Fourth Top Bottom Second Middle Fourth Top 1994-2002 Group - 2003-2011 Group
0%
10%
20%
30%
40%
50%
60%
70%
80%
90%
100%
53%
22%
12% 7% 6%
56%
23%
11%6% 4%
26%
35%
22%
12%5%
25%
37%
22%
11%5%
12%
26%
31%
22%
9%
11%
25%
33%
22%
9%
5%13%
26%
35%
22%
5%11%
25%
37%
22%
3% 5%10%
25%
58%
3% 4%9%
24%
60%
Bottom Quintile Second Quintile Middle Quintile Fourth Quintile Top Quintile
Quintile at Beginning of Period
Qu
inti
le a
t E
nd
of
Peri
od