usps-t-29 before the off,ce 0; t!jf s:.c,iulz’( … · 2000-01-13 · usps-t-29, page iii list of...
TRANSCRIPT

USPS-T-29
RECEIVEL~
BEFORE THE poj~l, *$:!: cu:I”::;::i~‘~ii OFF,CE 0; T!jf S:.C,iUlZ’(
POSTAL RATE COMMISSION WASHINGTON, D.C. 20268-0001
POSTAL RATE AND FEE CHA~GES,~OOO Docket No. R2000-1
DIRECT TESTIMONY OF
CHRIS F. CAMPBELL ON BEHALF OF
UNITED STATES POSTAL SERVICE


USPS-T-29, page ii
TABLE OF CONTENTS
AUTOBIOGRAPHICAL SKETCH . . . . . . . . . . . . . . . . . . . . . . . . . . . . . . . . . . . . . . . . . . . . . . . . . . . . . . . . . . . . . . . . . . . . . . . . 1
I.
II.
III.
A. B. C. D. E. F. G. H.
IV.
A. B. C. D.
V.
A. B. C.
P,URPOSE OF TESTIMONY ....................................................................... 1
INFORMATION SOURCES ........................................................................ 2
SPECIAL SERVICES .................................................................................. 2
ADDRESS CORRECTION SERVICE.. ......................................................................................... 2 BUSINESS REPLY MAIL.. ............................................................................................................. 5 CALLER SERVICE ............................................................. .......................................................... 22 MAILING LIST SERVICES ......................................................................................................... 25 PERIODICALS APPLICATION .................................................................................................. 27 PERMIT IMPRINT. ......................................................... .............................................................. 29 STAMPED CARDS .............................................................. ......................................................... 30 STAMPED ENVELOPES ............................................................................................................. 31
QUALIFIED BUSINESS REPLY MAIL DISCOUNT .................................. 38
SCOPE OF ANALYSIS ........................................................ ......................................................... 38 BACKGROUND.. .................................................. ......................................................................... 38 COST METHODOLOGY ............................................................................................................. 39 QBRM COST AVOIDANCE.. ....................................................................................................... 40
ADDITIONAL COST STUDIES ................................................................. 40
PICKUP SERVICE ........................................................................................................................ 40 EXPRESS MAIL RATE CATEGORY COST DIFFERENTIALS ............................................ 4 I NONLETTER-SIZE BUSINESS REPLY MAIL. ........................................................................ 42
APPENDIX 1: BRM RATING AND BILLING STUDY . . . . . . . . . . . . . . . . . . . . . . . . . . . . . . . . . . . . . . . 45
APPENDIX 2: CALLER SERVICE STUDY METHODOLOGY . . . . . . . . . . . . . . . . . . . . . . . . . 51

USPS-T-29, page iii
LIST OF TABLES
TABLE 1 TEST YEAR BRM COSTS 21 TABLE 2 TEST YEAR CALLER SERVICE COSTS 24 TABLE 3 TEST YEAR PERIODICALS APPLICATION COSTS 29 TABLE 4 TEST YEAR STAMPED CARD COSTS 31 TABLE 5 TEST YEAR PLAIN STAMPED ENVELOPE COSTS 36 TABLE 6 TEST YEAR PRINTED STAMPED ENVELOPE COSTS 31 TABLE 7 QBRM AND HANDWRITTEN SINGLE PIECE MODEL ASSUMPTIONS 39 TABLE 8 COST DIFFERENTIALS ACROSS EXPRESS MAIL RATE CATEGORIES 42 TABLE 9 TEST YEAR NONLETTER-SIZE BRM COSTS 44

USPS-T-29,pagel
1 DIRECT TESTIMONY I
2 OF
3 CHRIS F. CAMPBELL
4 AUTOBIOGRAPHICAL SKETCH
5
6
I
8
9
10
11
12
13
14
My name is Chris F. Campbell. I am an Operations Research Specialist
in Special Studies at Postal Service Headquarters. Since joining the Postal
Service in 1998, I have worked on costing issues with a primary focus on Special
Services and Qualified Business Reply Mail.
Prior to joining the Postal Service, I worked as an Environmental Engineer
for the U.S. Environmental Protection Agency in Chicago. My work focused
primarily on Clean Air Act implementation in the State of Michigan.
I earned a Bachelor of Science Degree in Industrial Engineering from
Purdue University in 1992 and an MBA from the University of Michigan in 1998
with a concentration in Finance.
15 My appearance in this docket represents my first appearance before the
16 Postal Rate Commission (PRC).
17 I. PURPOSE OF TESTIMONY
18 The purpose of this testimony is to present estimated costs that provide a
19 foundation for the testimonies of several Postal Service rate design witnesses.
20 Section II presents estimated costs for a number of special services and
21 supports the testimony of Postal Service witness Mayo (USPS-T-39). The
22 special services covered are address correction service (manual and

USPS-T-29, page 2
1
2
automated), business reply mail (BRM), caller service, mailing list services,
Periodicals application, permit imprint, stamped cards, and Stamped Envelopes.
3
4
5
6
Section III presents the estimated mail processing cost avoidance of a
Qualified Business Reply Mail (QBRM) mail piece. This cost avoidance applies
to letters and cards and supports the testimony of Postal Service witness Fronk
(USPS-T-33) concerning QBRM.
I Section IV presents updated cost estimates for three additional services.
8 First, cost estimates are provided for on-call and scheduled pickup service,
9 which support USPS witness Robinson (USPS-T-34). Secondly, Express Mail
10 rate category cost differential estimates are presented, supporting USPS witness
11 Plunkett (USPS-T-36). Lastly, cost estimates are provided for nonletter-size
12 business reply mail, which support USPS witness Mayo (USPS-T-39).
13 II.
14
INFORMATION SOURCES
The following Docket No. R2000-1 Library References are associated with
15 my testimony:
16 . USPS LR-I-l IO 17 l USPS LR-I-160 18 . USPS LR-I-172
19 Ill. SPECIAL SERVICES
20 A. ADDRESS CORRECTION SERVICE
21 1. Scope of Analysis
22 This section provides estimates of the test year costs of providing manual
23 Address Correction Service per use and automated Address Change Service
USPS-T-29, page 3
I- 1
2
3
4
6
7
8
9
10
11
- 12
13
14
15
16
17
18
19
20
21
22
(ACS) per use. These costs serve as a basis for the fees proposed by Postal
Service witness Mayo (USPS-T-39).
2. Background
Address Correction Service provides mailers with change of address
information for recipients who have moved. Address correction notifications are
sent to mailers through one of two methods: (1) manual Address Correction
Service or (2) automated ACS. Manual Address Correction Service provides a
photocopy of the mail piece with the recipients forwarding address on a USPS
Form 3547 card for First-Class Mail, Standard A, and Standard B mail. The
original mail piece is either forwarded to the recipients new address or treated
as waste, depending on the sender’s preference and/or the class of mail. For
Periodicals, the Postal Service provides mailers with the front cover of the
recipients periodical, with the change-of-address label affixed on the cover
(known as Form 3579). The periodical is treated as waste. These activities are
conducted at a Computerized Forwarding System (CFS), normally housed within
a Processing and Distribution Center. The Postal Service charges a fee for each
address correction notification provided to a mailer.
ACS is an electronic notification service providing changes of address and
reasons for non-delivery. Users of this service access the data electronically via
a computer and modem. The Postal Service charges a fee for each address
correction and reason for non-delivery provided to the customer. ACS mail
pieces that are undeliverable are called “ACS nixie mail pieces.”

1
2
3
4
5
6
7
s
9
10
11
12
13
14
15
16
17
18
19
20
21
22
USPS-T-29, page 4
3. Address Correction Service Cost Methodology
The test year cost estimates for manual Address Correction Service and
automated ACS are derived separately using the costing methodologies
presented below.
a. Manual Address Correction Service
The model developed to calculate test year cost estimates for manual
Address Correction Service consists of a volume-weighted average of the cost of
processing Forms 3547 (83.75%) and 3579 (16.25%). The average Form 3547
processing cost (47.0 cents) is a weighted average comprised of (1) Photo and
Forward processing (46.04%); (2) Photo and Treat as Waste processing
(10.20%); and (3) On-Piece Correction processing (43.76%) (see USPS LR-I-
160, Section A, page 2). The On-Piece Correction processing cost is assumed
to be zero cents because these pieces would otherwise incur these costs outside
of Address Correction Service. The average Form 3579 processing cost is 92.4
cents (see USPS LR-I-160, Section A, page 2). Both Form 3547 and Form 3579
costs incorporate (1) CFS costs; (2) mailstream costs; (3) accountable mail clerk
costs; and (4) carrier delivery/collection of postage due costs. CFS costs,
accountable mail clerk costs, and carrier delivery/collection of postage due costs
were obtained from a 1999 study entitled “Volumes, Characteristics, and Costs
of Processing Undeliverable-As-Addressed Mail.” The spreadsheets from this
study are found in USPS LR-I-1 10, updated with test year piggyback factors and
wage rates. Mailstream costs were obtained from postal data (see USPS-T-29
23 Campbell Workpaper I).
USPS-T-29, page 5
b. Automated ACS
Estimated test year costs for automated ACS were developed using a
volume-weighted average of regular ACS change-of-address (COA) notification
costs (61.86%) and ACS nixie processing costs (38.14%) (see USPS LR-I-160,
Section A, page 3). The average COA notification cost is a weighted average of
the mechanized terminal unit keying cost (85%) and the non-mechanized
terminal unit keying cost (15%). The average ACS nixie processing cost is the
total unit cost of delivery unit handling and ACS nixie keying (reason for non-
delivery). Any costs that would other-wise be incurred by an undeliverable mail
piece have not been included in the cost methodology. All automated ACS costs
were derived using data from the 1999 study identified above.
4. Address Correction Service Costs
The estimated test year cost for manual Address Correction Service is
54.4 cents per use (see USPS LR-I-160, Section A, page 2). The estimated test
year cost for automated ACS is 13.1 cents per use (see USPS LR-I-160, Section
A page 3).
-. 1
2
3
4
6
7
8
9
10
11
- 12
13
14
15
16
17 B. BUSINESS REPLY MAIL
18 1. Scope of Analysis
19 This section provides the test year volume variable cost estimates of
20 counting, rating, and billing the BRM service, above and beyond the costs
21 already attributed to the class of mail. Test year costs are presented for each of
-. 22 the current BRM fee categories, and for advance deposit account maintenance.

USPS-T-29, page 6
1
2
3
4
5
6
7
8
9
10
11
12
13
14
15
16
17
18
19
20
21
22
These costs serve as a basis for the fees proposed by Postal Service witness
Mayo (USPS-T-39).
2. Background
Business Reply Mail is a special service for First-Class Mail and Priority
Mail. A BRM customer designs and prints the mail piece (usually a postcard or
envelope) to be used by its customers, and pays the postage on any mail pieces
returned to it by those customers. There are currently three fee categories
associated with BRM, as described below.
Qualified Business Reply Mail pieces are those cards and I- and 2-ounce
envelopes which are automation compatible, have both a Facing Identification
Mark (FIM) C and a unique ZIP+4 barcode, and have qualified for BRMAS’
processing. QBRM users pay a per-piece fee in addition to postage.
QBRM customers maintain an advance deposit account, with a balance
sufficient to cover the projected postage due and per-piece fees for a specified
future period, and pay an annual advance deposit account fee.
Non-QBRM advance deposit BRM pieces are not required to qualify for
BRMAS processing, although these pieces are often prebarcoded. Like QBRM,
per-piece fees and postage due are deducted from an advance deposit account.
Non-QBRM advance deposit BRM customers pay a per-piece fee in addition to
postage.*
Non-advance deposit BRM pieces may or may not be automation
compatible or barcoded. Non-advance deposit BRM recipients do not pay the
-_
’ BRMAS refers to the Business Reply Mail Accounting System, which is discussed below.

USPS-T-29, page 7
1 postage due and per-piece fees through an advance deposit account. Instead, I
2 these pieces are delivered to the BRM customer upon payment of postage and
3 fees due, which is either (a) collected by the carrier delivering this mail, (b)
4 collected by box section clerks, or (c) deducted from a Postage Due account.
5 Mailers receiving low volumes of BRM generally use non-advance deposit BRM.
6 Non-advance deposit BRM customers currently pay a 30-cent per-piece fee in
7 addition to postage.
8 3. BRM Mail Flows
9 To determine the counting, rating, and billing costs associated with QBRM
10 and BRM, it is necessary to focus on operations at the destinating facility. Here,
11 BRM letters and cards are generally held out in the Incoming Primary operation
- 12 and sent to either the BRMAS operation or to a manual sortation operation
13 (usually in the Postage Due Unit or Box Section). This flow differs from other
14 non-presort First-Class Mail letters and cards, which, after sortation in the
15 Incoming Primary operation, are processed in an Incoming Secondary operation
16 (either automated or manual), and are then sorted to address either in a Delivery
17 Point Sequence (DPS) operation or in a manual operation (i.e., cased by the
18 carrier).
19 a. Qualified BRM Pieces
20 As shown in Figure 1, QBRM goes through the Incoming Primary
21 operation, and then can be sorted to permit number (corresponding to a unique
22 ZIP+4 Code) in a BRMAS or BCS operation. Because the ZIP+4 Code is unique
C
2 With the exception of certain nonletter-size BRM, which qualifies for lower per-piece fees as a result of Docket Nos. MC99-1 and MC99-2.

USPS-T-29, page 8
1 to a BRM customer, this sort is equivalent to the level of sortation obtained in a
2 DPS operation. These pieces avoid the Incoming Secondary distribution that
3 other First-Class Mail pieces receive.
Figure I: Advance Deposit BRM Mail Flow
I Incoming Primary
I
4
4
5
6
7
8
9
10
11
BRMAS operations vary across facilities. Where utilized, the BRMAS
accounting software is run on either a Delivery Barcode Sorter (DBCS) or a Mail
Processing Barcode Sorter (MPBCS), as determined by the facility. In some
cases, the BRMAS operation includes both “primary” and “secondary” sort
schemes, in order to get all QBRM finalized to permit number. For these
facilities, all QBRM arrives at the BRMAS operation mixed; on a “primary” sort
scheme, some is sorted to permit number (for the highest volume mailers), and
the rest is sorted to the secondary schemes. In the secondaty sort schemes, the

1
2
3
mail is sorted to permit number for the rest of the QBRM. At other facilities, BRM
is sorted to BRMAS scheme on the Incoming Primary operation, so the BRM
receives only one handling in the BRMAS operation.
4
5
6
7
For those pieces finalized in the BRMAS operation, the BRMAS program
also performs counting and rating functions, and can provide a report for the
BRM recipient of postage due (i.e., a bill). BRMAS does not deduct the postage
due from the advance deposit account.
8
9
10
11
12
13
14
Even at facilities that sort BRM in a BRMAS operation, not all QBRM gets
finalized to permit number in the BRMAS operation. This results from
operational limitations (e.g., the number of bins available for sortation), pieces
being rejected (e.g., due to mechanical problems or piece characteristics), or
diversion of some BRM to other mail streams (e.g., mixing with other First-Class
Mail that got distributed in a DPS operation). These residual pieces are usually
sorted, counted and rated manually in the Postage Due Unit.
15
16
17
Even when all QBRM pieces for a mailer can be finalized in the BRMAS
operation, verification and accounting activities associated with these pieces are
performed in the Postage Due Unit.
18
19
20
21
22
Currently, for the reasons given above and because many facilities do not
have BRMAS software, only 14 percent of QBRM is counted and rated in a
BRMAS operation (see Docket No. R97-1, USPS LR-H-179, Table 13). At
facilities without BRMAS operations, QBRM is counted, rated and billed using a
variety of methods, both manual and automated. Manual counting is the most
- 23 common counting method, followed by use of end-of-run (EOR) report counts.
USPS-T-29, page 9

USPS-T-29, page 10
1
2
3
4
5
6
I
8
9
10
11
12
13
14
15
16
17
18
19
20
21
22
23
Rating and billing functions are typically performed manually or through the
PERMIT system or other software. (see Docket No. R97-1, USPS LR-H-179,
Tables 13, 16 and 18).
b. Non-QBRM Advance Deposit BRM Pieces
In general, non-QBRM advance deposit BRM pieces are diverted from the
First-Class Mail stream after the Incoming Primary operation, as shown in Figure
1 above. These pieces avoid the Incoming Secondary distribution that other
First-Class Mail pieces receive. These pieces can receive sortation to the mailer
in the Incoming Primary or BRMAS operations, but are typically sorted manually
in the Postage Due Unit (see Docket No. R97-1, USPS LR-H-179, Table 13). In
addition to manual distribution, the Postage Due Unit operation includes
counting, rating, billing, and accounting functions. These pieces are then picked
up at the Postage Due Unit by carriers or box section clerks for distribution to
customers (see Docket No. R97-1, USPS LR-H-179, Table 4).
In certain instances, non-QBRM advance deposit BRM pieces may
receive a sortation on a BCS before being sent to the Postage Due Unit. An
EOR report is used as a final count for some of these pieces, while others
receive a manual count in the Postage Due Unit. Rating and billing functions are
either performed manually or automatically through PERMIT or other software
packages.
C. Non-Advance Deposit BRM Pieces
The manual or automation Incoming Secondary distribution operation is
avoided for non-advance deposit BRM. Instead, the following mail flow occurs:

USPS-T-29, page 11
-. 1
2
3
4
5
6
7
8
(1) diversion to the Postage Due Unit, (2) manual distribution, (3) counting,
rating, and billing functions (typically manual), (4) pick-up by carriers or box
section clerks, (5) fee collection by carriers or box section clerks, and (6)
accountability relief involving carriers or box section clerks (remitting fees
collected) and postage due unit clerks (for accepting fee collections, or for
deductions from Postage Due accounts). The distribution of collection methods
used is shown in Docket No. R97-1, USPS LR-H-179, Table 5. The mail flow for
non-advance deposit BRM is shown below in Figure 2.
9
10
d. Advance Deposit Accounts and BRM Permits
Other workload volume variable to BRM is associated with the
11
12
13
14
15
16
17
18
administration of the advance deposit accounts set up for BRMAS-qualified and
non-QBRM advance deposit BRM recipients. This workload includes
determining whether adequate funds are on deposit to cover the postage due for
future mail received, notifying the mailer of inadequate funds, deducting daily
postage due from the account, and the initial set up of the advance deposit
account. These activities are generally administered through the Postage Due
Unit or the Business Mail Entry Unit (BMEU). An annual accounting fee is
charged to cover these costs.
19 Each Business Reply Mail customer must obtain a permit to receive BRM.
,, 20 The administration of the BRM permit is similar to that of permits obtained for
21 permit imprint mail of other classes.

USPS-T-29, page 12
Figure 2: Non-Advance Deposit BRM Mail Flow
I Postage Due Unit: rating and billing I
I I
Delivered by carrier or box section clerk
-7 Postage Due Clerk
1 4. Cost Methodology and Results
2 The cost methodology~~presented here was developed using the mail flows
3 described above, as well as productivities developed from prior USPS witness
4 testimony and data from a 1997 BRM Practices Study. In general, the cost
5 methodologies for low-volume QBRM, non-QBRM advance deposit BRM, and

USPS-T-29, page 13
-, I
2
3
4
5
6
7
8
9
10
11
- 12
13
14
15
16
17
18
19
20
21
22
.-
non-advance deposit BRM are similar to those presented by USPS witness
Schenk (see Docket No. R97-1, USPS-T-27), while the high-volume QBRM cost
methodology has been modified to reflect certain fixed costs associated with
large QBRM mailer volume.
a. Qualified BRM
The QBRM per-piece cost methodology presented by witness Schenk in
Docket No. R97-1 incorporated three components: (1) a marginal BRMAS
processing productivity, (2) a marginal BRMAS productivity for postage due
activities, and (3) a marginal manual sottation productivity for postage due
activities. A direct and indirect cost per piece was determined for each of these
components and weighted by volumes processed on BRMAS and by volumes
processed manually. An incoming secondary cost was then subtracted from the
cost per piece to avoid double counting the incoming secondary operation, which
is already included as a basis for QBRM postage.
The QBRM cost methodology presented here differentiates between
those costs associated with large-volume QBRM mailers and those associated
with small-volume QBRM mailers. The methodology isolates fixed costs from
those that are volume variable for high-volume mailers, resulting in a cost
structure similar to witness Schenk’s methodology for nonletter-size BRM (see
Docket No. MC99-2, USPS-T-3). For low-volume QBRM customers, the
methodology remains relatively unchanged from the QBRM methodology
presented in Docket No. R97-1, resulting in per-piece costs only. These
USPS-T-29, page 14
1
2
3
4
5
6
7
8
9
10
11
12
13
14
15
16
17
18
19
20
21
22
methodological revisions set the stage for a QBRM fee structure that allows a
mailer to choose a fee structure based on its QBRM volume.
Further refinements have been incorporated based on data obtained from
the original Business Reply Mail Practices Study (Docket No. R97-1, USPS LR-
H-179) and a 1999 update (see Appendix 1 below).
i. High-Volume QBRM Account Costa
a. Fixed Costs
A number of mailers consistently receive high QBRM volumes nearly
everyday. We can safely assume that some costs incurred by the Postal Service
as a result of high-volume customers are fixed in nature. More specifically, the
costs of rating, preparing meter readings, and completing postage due forms are
incurred each time a QBRM account requires a transaction, regardless of the
QBRM volume or the method used (manual or automated). For example, if a
QBRM account receives 1,000 QBRM pieces, the time required to generate a bill
is the same as if the account receives 10,000 pieces. Similarly, rating 1,000
QBRM pieces (i.e., calculating postage due given a piece-count) requires the
same amount of time as rating 10,000 QBRM pieces.
As a consequence, productivities for rating and billing activities, previously
part of per-piece costs, have been isolated and incorporated into a monthly fixed
cost (see USPS LR-I-160, Section B, page 1) for each high-volume QBRM
account. The cost per transaction for QBRM pieces rated and billed manually is
derived from 1989 survey data3 (see USPS-T-29 Campbell Workpaper II).
’ Field observations confirmed that manual billing and rating productivities have not changed significantly since 1989.

USPS-T-29, page 15
* 1
2
3
4
10
11
12
13
14
15
16
17
18
19
20
These data include times for manually rating QBRM pieces, preparing meter
strips, and completing a postage due form for each QBRM account. Rating and
billing costs for QBRM pieces rated and billed using the PERMIT system or other
software are incorporated using the time for manually completing a postage due
form as a proxy. Any costs incurred by QBRM pieces rated and/or billed using
BRMAS software are not incorporated into the methodology. These costs would
otherwise be subtracted out as duplicative incoming secondary activities.
The last step in calculating a fixed cost per QBRM account requires
weighting the above costs, based on QBRM volume processed using each rating
and billing method. The 1997 BRM Practices Study provides data showing how
bills are generated (see Docket No. R97-1, USPS-LR-H-179, Table 16) and
could be used to weight these costs. However, because there has been an
increase in PERMIT system usage for generating bills since 1997, the Practices
Study Table 16 has been updated with 1999 data (see Appendix 1 below). The
update revealed the following QBRM volumes billed using each method: 45.9
percent using manual or other method, 47.6 percent using PERMIT or other
software, and 6.5 percent using BRMAS.
Based on the above costing methodology and an average 15 account
transactions per accounting period,4 the volume-weighted fixed cost per high-
volume QBRM account is estimated to be $232.13 per month.
a This number is based on those BRMAS accounts showing activity in PERMIT during FY98 (APl through AP9).

USPS-T-29, page 16
1
2
3
4
5
6
7
8
9
10
11
12
13
14
15
16
17
18
19
20
21
22
b. Per-Piece Costs
While QBRM rating and billing costs are fixed with each high-volume
account transaction, distribution costs (i.e., sorting and counting) vary directly
with QBRM volume and should be attributed on a per-piece basis similar to the
methodology presented by witness Schenk in Docket No. R97-1. The QBRM
per-piece cost is based on the direct and indirect distribution cost per piece, less
an incoming secondary cost to avoid double counting (see USPS LR-I-160,
Section B, page 2). The distribution cost for manual counting is derived from
survey data found in Docket No. R90-I, USPS-T-23, Exhibit USPS-23F.5 Sorting
and counting costs for BCSlBRMAS (assumed to occur simultaneously on the
BCS) are not incorporated into the methodology because these costs would
otherwise be subtracted out as duplicative incoming secondary activities, The
only incoming secondary cost subtraction incorporated into the methodology is
for those QBRM pieces that are manually sorted and counted.
I make a number of refinements to witness Schenk’s Docket No. R97-1
testimony (USPS-T-27). For instance, I modify her QBRM cost methodology to
reflect the processing of BRMAS QBRM pieces on “other bar code sorters” in
response to MPA witness Glick’s cost analysis (MPA-T-4) in Docket No. R97-1.
The Commission accepted witness Glick’s adjustment in its recommended
decision (see PRC Op. R97-I, page 31.9). The methodology now incorporates
data from the 1997 BRM Practices Study showing that 19.3% of QBRM pieces
receive final piece counts from a BCS EOR report (see Docket No. R97-1, USPS
5 Field observations confirmed that the manual distribution productivity has not changed significantly since 1989.

USPS-T-29, page 17
1 I
2
3
4
8
9
10 The above refinements to the QBRM cost methodology result in a QBRM
11 per-piece volume variable cost estimate of 2.00 cents for large-volume
.- 12 customers (see Table 1 and USPS LR-I-160, Section B, page 2).
13
14
15
16
17
18
19
20
21
22
LR-H-179, Table 13). Further, the methodology now incorporates data from the
Practices Study specifying the method and finest depth of sortation of BRM (see
Docket No. R97-1, USPS LR-H-179, Table 8) which is reflected in the incoming
secondary cost subtraction.
Other refinements I make to witness Schenk’s methodology include (1)
correcting understated postage due productivities and (2) adjusting volume
variability for Postage Due Unit activities to 100 percent, up from 79.7 percent in
Docket No. R97-I. The productivity correction lowers costs relative to Docket
No. R97-I, while higher volume variability has the opposite effect.
ii. Low-Volume QBRM Account Costs
In contrast to high-volume QBRM accounts, a significant number of
QBRM accounts receive low volumes of QBRM pieces over a period of time.
The costs of activities associated with these mail pieces are driven mostly by
volume. The mailer may go for several days without receiving any QBRM
pieces. When a QBRM piece is ultimately received at the destinating facility,
counting, rating, and billing activities are conducted on an as-needed basis. The
costs of these activities can be estimated using witness Schenk’s Docket No.
R97-1 cost methodology for QBRM on a per-piece basis. Cost estimates for
counting and rating activities are estimated exactly the same as the high-volume

USPS-T-29, page 18
1
2
3
4
6
7
8
9
10
11
12
13
14
15
16
17
18
19
20
21
22
23
accounts, while the cost methodology for billing and rating reflects no fixed costs
as discussed below.
The QBRM per-piece cost is based on direct and indirect distribution,
rating, and billing costs per piece, less an incoming secondary cost to avoid
double counting (see USPS LR-I-160, Section B, page 3). The costs for manual
counting, rating, and billing are derived from productivities found in Docket No.
R90-I, USPS-T-23, Exhibit USPS-23F. These productivities reflect 100 percent
volume variability for Postage Due activities, up from 79.7 percent in Docket No.
R97-I, As indicated above, higher volume variability tends to increase costs
relative to Docket No. R97-1 costs. Sorting and counting costs for BCSlBRMAS
(assumed to occur simultaneously on a BCS) are not incorporated into the
methodology because these costs would otherwise be subtracted out as
incoming secondary activities. The only incoming secondary cost subtraction
incorporated into the methodology is for those BRM pieces that are manually
counted.
As discussed above, I make a number of refinements to witness Schenk’s
Docket No. R97-1 approach. I modify her QBRM cost methodology to reflect the
processing of BRM pieces on “other bar code sorters”, as did the Commission.
See PRC Op. R97-I, page 319. The methodology now incorporates data from
the 1997 BRM Practices Study showing that 19.3% of QBRM pieces receive final
piece counts from a BCS EOR report (see Docket No. R97-1, USPS LR-H-179,
Table 13). The methodology also incorporates data from the Practices Study
specifying the method and finest depth of sortation of BRM (see Docket No.

USPS-T-29, page 19
_- 1
2
3
4
5
6
I
8
9
10
11
,- 12
R97-I, USPS LR-H-179, Table 8) which is reflected in the incoming secondary
cost subtraction. Other refinements made to witness Schenk’s methodology
include correcting understated postage due productivities and incorporating
updated rating and billing data (see Appendix 1).
The above refinements to the QBRM cost methodology result in a QBRM
per-piece volume variable cost estimate of 4.79 cents for low-volume QBRM
accounts (see Table 1 and USPS LR-I-160, Section B, page 3).
b. Non-QBRM Advance Deposit BRM
The cost methodology presented by witness Schenk in Docket No. R97-1
for non-QBRM advance deposit BRM has been refined using data from the 1997
BRM Practices Study and the 1999 update (see Appendix I), as well as
productivities developed from a 1989 BRM cost study6 (see Docket R90-I,
13 USPS-T-23, Exhibit USPS-23F).
14
15
16
17
18
19
20
21
22
Like the low-volume QBRM accounts, the non-QBRM advance deposit
BRM per-piece cost is based on direct and indirect distribution, rating, and billing
costs per piece, less an incoming secondary cost (see USPS LR-I-160, Section
B, page 4). Again, the costs for manual counting, rating, and billing are derived
from productivities found in Docket No. R90-I, USPS-T-23, Exhibit USPS-23F.
These productivities reflect 100 percent volume variability for Postage Due
activities. Distribution costs for BCSlBRMAS are not incorporated into the
methodology because these costs would otherwise be subtracted out as
incoming secondary activities. The only incoming secondary cost subtraction
’ Field observations confirmed that these productivities have not changed significantly since 1989.

USPS-T-29, page 20
1
2
3
4
5
6
7
8
9
10
11
12
13
14
15
16
17
18
19
20
21
22
23
incorporated into the methodology is for those BRM pieces that are manually
counted.
Several refinements have been made to witness Schenk’s Docket No.
R97-1 testimony for non-QBRM advance deposit BRM pieces. The cost
methodology has been modified to reflect the processing of BRM pieces on
“other bar code sorters”, in accordance with PRC Op. R97, page 319. The
methodology now incorporates data from the 1997 BRM Practices Study
showing that 9.1% of non-QBRM advance deposit BRM pieces receive its final
piece count from a BCS EOR report (see Docket No. R97-1, USPS LR-H-179,
Table 13). The methodology also incorporates data from the Practices Study
specifying the method and finest depth of sortation of BRM (see Docket No.
R97-1, USPS LR-H-179, Table 8) which is reflected in the incoming secondary
cost subtraction.
Other refinements made to witness Schenk’s methodology include
correcting understated postage due productivities and incorporating updated
rating and billing data (see Appendix 1).
These refinements to the QBRM cost methodology result in a non-QBRM
advance deposit BRM per-piece volume variable cost estimate of 7.42 cents
(see Table 1 and USPS LR-I-160, Section B, page 4).
C. Non-Advance Deposit BRM
The cost derivation for non-advance deposit BRM is shown in USPS LR-I-
160, Section B, pages 5-9. In addition to the distribution, rating, and billing costs
that other non-QBRM BRM pieces incur, non-advance deposit BRM pieces incur
USPS-T-29, page 21
1 costs associated with postage and fee collection. These fees are either
2 collected by carriers or box section clerks, or are deducted from Postage Due
3 accounts. I rely upon the distribution of fee collection methods determined in the
4 BRM Practices Survey (Docket No. R97-1, USPS LR-H-179, Table 5). I
5 estimate the net volume variable cost of a non-advance deposit BRM piece to be
6 26.7 cents (see Table 1 and USPS LR-I-160, Section B, page 6).
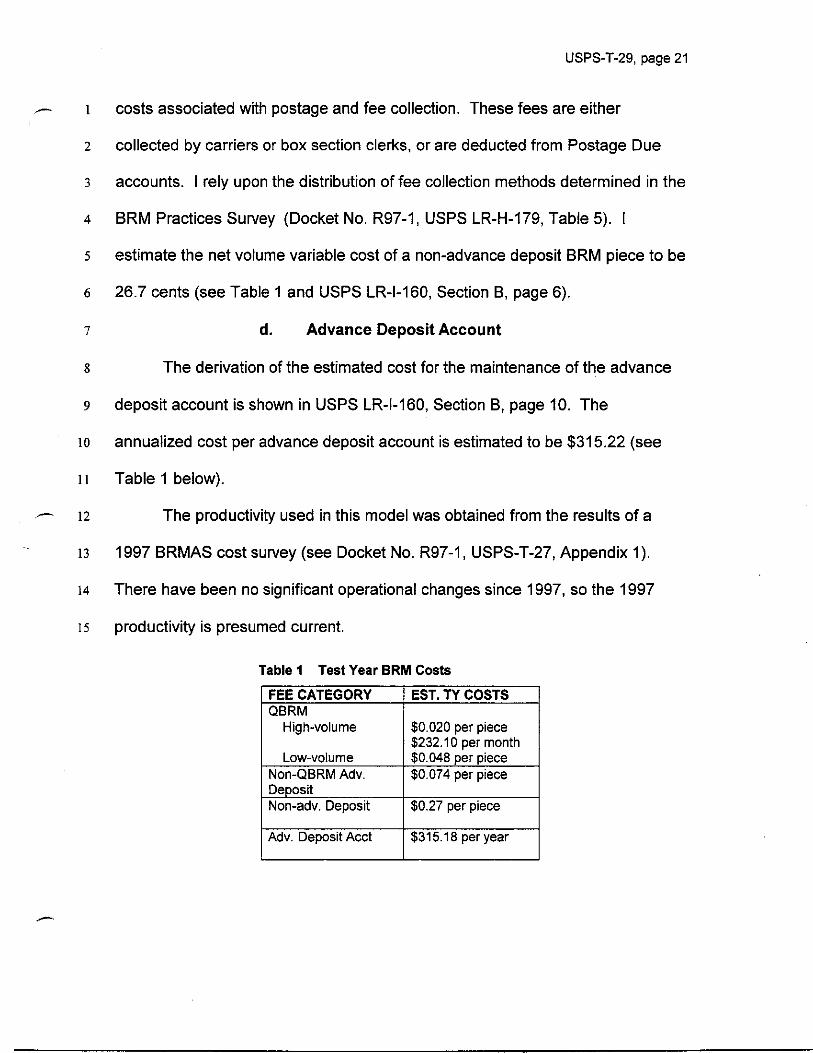
7 d. Advance Deposit Account
8 The derivation of the estimated cost for the maintenance of the advance
9 deposit account is shown in USPS LR-I-160, Section B, page 10. The
10 annualized cost per advance deposit account is estimated to be $315.22 (see
11 Table 1 below).
12 The productivity used in this model was obtained from the results of a
13 1997 BRMAS cost survey (see Docket No. R97-1, USPS-T-27, Appendix 1).
14 There have been no significant operational changes since 1997, so the 1997
15 productivity is presumed current.
Table 1 lest Year BRM Costs
FEE CATEGORY ) EST. TY COSTS QBRM I
High-volume
Low-volume Non-QBRM Adv. Deposit Non-adv. Deposit
$0.020 per piece $232.10 per month $0.048 per piece $0.074 per piece
$0.27 per piece I
Adv. Deposit Acct $315.18 per year
USPS-T-29, page 22
I
2
3
4
5
6
7
8
9
10
11
12
13
14
15
16
17
18
19
20
21
C. CALLER SERVICE
1. Scope of Analysis
This section provides the test year cost estimate of providing Caller
Service to a single caller service separation (i.e., caller number), as well as the
test year cost estimate of providing a reserved caller number. These cost
estimates are derived from a 1999 Caller Service Study (see Appendix 2) and
serve as the basis for the fees proposed by Postal Service witness Mayo (USPS-
T-39).
2. Background
Caller Service allows an individual or firm to pick up its mail one or more
times per day at a caller window or loading dock. Banks, insurance companies,
and other financial institutions are examples of customers that use this premium
service over free carrier mail delivery. The service allows these customers to
receive cash payments and other time-sensitive mail as soon as they become
available without waiting for carrier delivery. Other Caller Service customers
include small businesses and post office box customers whose mail volume
exceeds the largest post office (P.O.) box capacity.
A customer using Caller Service is assigned a “phantom” P.O. box
number that is used for mail sortation purposes (i.e., the box does not physically
exist). The Caller Service customer is currently charged a semi-annual fee for
each P.O. box number or separation. Upon payment of an annual fee, the
22 Postal Service allows customers to reserve caller box numbers for future use,

USPS-T-29, page 23
~. -. 1 I
2
3
4
5
6
7
8
9
10
11
- 12
13
14
15
16
17
18
19
20
21
22
- 23
When a reserved caller box number is activated, the customer is assessed the
semi-annual caller service fee.
3. Caller Service Costs
The test year cost estimate for Caller Service is based on a 1999 cost
study (see Appendix 2) which supersedes the last study conducted in 1980.
The Caller Service study consisted of two phases. The first phase
requested Caller Service customer lists from 132 post offices. About 30 percent
of these sites had no caller service customers and were eliminated from the
study’s second phase of data collection. Phase II sites were then asked to
collect and record various Caller Service data over a one-week period. About 80
percent of the Phase II sites surveyed responded, resulting in 67 data collection
sites.
The Phase II survey contained four parts, each corresponding to specific
Caller Service information. The purpose of Part 1 was to collect basic Caller
Service data, including the total number of Caller Service customers and
separations at each site, as well as the pick-up frequency of Caller Service
customers. Part 2 requested that each site record the total storage space
required for Caller Service mail. Storage areas included tables, pouch racks,
hampers, cases, and floor space (platform and box section). These data were
‘used to calculate an annual cost of storage per caller number (see USPS LR-I-
160, Section C, page 5). Part 3 requested participants to record volume and
time information related to Caller Service billing and rent collection (i.e.,
accounting). These data were used to calculate an annual window accounting

USPS-T-29, page 24
1
2
3
4
5
6
7
8
9
10
11
cost per caller number (see USPS LR-I-160, Section C, page 3). In Pat-t 4, each
site recorded the total time required to retrieve mail for IO Caller Service
customers randomly selected from each site’s Caller Service customer list.
These data were used to calculate the annual retrieval cost per caller number
(see USPS LR-I-160, Section C, page 4).
4. Cost Study Results
The estimated test year costs resulting from the Caller Service Study are
shown in Table 2 below. The estimated test year cost per caller box number is
$596.04 per year (see USPS LR-I-160, Section C, page 2). The estimated test
year cost per reserved caller number is $16.57 (window service accounting costs
are used as a proxy).
Table 2 ,Test Year Caller Service Costs
Activity Annual Cost (direct and indirect)
Window Selvice Accounting $16.57
Window Service Delivery $177.86
Platform Delivery $292.77
Storage $108.65
Total Cost per Caller Number $596.04

USPS-T-29, page 25
1 D. MAILING LIST SERVICES
2 1. Correction of Mailing Lists
3 a. Scope of Analysis
4 This analysis updates the estimated test year cost of correcting a mailing
5 list submitted to the Postal Service by a customer. This cost serves as a basis
6 for the fee proposed by Postal Service witness Mayo (USPS-T-39).
7 b. Background
8 Correction of Mailing Lists is a service used primarily by small businesses
9 to improve the accuracy of their mailing lists. A mailer typically presents a
10 mailing list to the Postal Service via an Address Management System (AMS) unit
11 either on cards or sheets of paper separated by ZIP Code. The AMS unit enters
12 the customer name into a log, corrects any apparent address errors, and then
13 forwards the list to individual post offices for correction. At each post office, the
14 mailing list is circulated among carriers for manual correction and then returned
15 to the AMS unit upon completion. The AMS unit confirms completion and
16 returns the corrected list to the customer. Currently, the Postal Service charges
17 a fee for each name on the mailing list.
18 C. Cost Methodology
19 The cost methodology presented in USPS LR-I-160 is relatively
20 unchanged from the methodology presented in Docket No. R97-1 (USPS-LR-H-
21 107). The cost methodology presented here, however, incorporates AMS
22 handling costs that were not included in the past. The AMS units not only

USPS-T-29, page 26
8
9
10
11
12
13
14
15
16
17
18
19
” 20
21
distribute mailing lists to individual post offices, but also make corrections when
possible.
d. Cost Results
The estimated test year cost per name on a mailing list is 22.6 cents (see
USPS LR-I-160, Section D, page 1).
3. ZIP Coding of Mailing Lists
a. Scope of Analysis
This analysis updates the estimated test year cost of providing ZIP Coding
of Mailing Lists. This cost serves as a basis for the fee proposed by Postal
Service witness Mayo (USPS-T-39).
b. Background
ZIP Coding of Mailing Lists is a service that allows mailers to submit
mailing lists on index cards for ZIP Code sortation. A fee is charged for every
1,000 addresses on the mailing list.
C. Cost Methodology
The cost methodology presented in USPS LR-l-160 is the same as found
in Docket No. R97-1 using updated piggyback factors and wage rates (see
USPS LR-I-160, Section E, page 1).
d. Cost Results
The estimated test year cost for ZIP Coding of Mailing Lists is $69.41 per
1,000 cards.

USPS-T-29, page 27
.- 1 E. PERIODICALS APPLICATION
7
8
9
10
11
- 12
13
14
15
16
17
18
19
20
21
22
-c 23
1. Scope of Analysis
This analysis updates test year costs as they relate to handling
Periodicals applications for original entry, additional entry, re-entry, and
newsagents. These costs serve as a basis for the fees proposed by Postal
Service witness Mayo (USPS-T-39). The last update to the Periodicals
Application study was presented in Docket No. R97-1 (see Docket No. R97-1,
USPS LR-H-107).
2. Background
a. Application for Original Entry
Before a publication will be considered for Periodicals authorization, the
publisher at a post office must file a Periodicals Application for Original Entry
(Form 3501) where the publisher is located. Upon receipt, the Postmaster or
other postal employee visits the publisher’s office to verify information provided
in the application. The post office then sends the application to the district office
for initial review and processing. Following an initial review, the district office
forwards the application to a Regional Customer Service Center (RCSC) for a
detailed review and coordination with the Library of Congress. An RCSC analyst
issues an approval or denial based on the above analyses.
b. Application for Reentry
An Application for Reentry must be filed on Form 3510 at the post office
where the publisher is located whenever the name, frequency of issuance, or
location of the known office of publication or qualification category is changed.

USPS-T-29, page 28
1
2
3
4
5
6
7
8
9
10
11
12
13
14
15
16
17
18
19
20
21
22
23
The application is forwarded by the local post office to the RCSC in Memphis,
where a complete review is conducted. Following review, the application is
returned to the origin post office for publisher notification.
C. Application for Additional Entry
The publisher must file an Application for an Additional Entry at the post
office where the publication received initial authorization. If the request is
submitted in conjunction with an Application for Original Entry, then the review
process follows that of the original entry application. If the request is a stand-
alone document, however, the review is performed at the RCSC.
d. Periodicals Mailing Privileges for Newsagents
Newsagents are persons or concerns selling two or more Periodicals
published by more than one publisher. Newsagents must be authorized by the
Postal Service before mailing at the Periodicals rates. Each newsagent must
furnish postmasters with evidence that the publications offered for mailing are
entitled to Periodicals rates and that they are sent to actual subscribers or other
newsagents for the purpose of sale. A Periodicals permit imprint is sufficient
evidence that a publication is entitled to Periodicals rates.
3. Periodicals Application Model Update
The cost methodology for Periodicals Applications remains largely
unchanged from the Docket No. R97-1 -methodology (see Docket No. R97-1,
USPS LR-H-107) with two exceptions. (2) Headquarters personnel no longer -
review Periodicals Applications unless under appeal (less than 5 percent are
appealed). Instead, the applications are sent to an RCSC for review. (2) Unlike

9
10
11
12
13
14
15,
16
17
USPS-T-29, page 29
Original Entry and Newsagent applications that are reviewed by Postal Service
analysts, contract employees now review Additional Entry and Reentry
applications. The wages paid to contract employees have been incorporated
into the model at $15.14 per hour. See USPS LR-I-160, Section F, page 1 for
the Periodicals Application cost model.
4. Cost Model Results
Estimated test year costs for Periodicals applications are shown in
Table 3 below.
Table 3 Test Year Periodicals Application Costs
Periodicals Total Test Year Cost Application Type per Application
Original Entry $297.69
Reentry $29.76
Additional Entry $40.50
Newsagent $21.88
F. PERMIT IMPRINT
1. Scope of Analysis
This section provides a test year cost estimate for processing a Permit
Imprint Application. This cost serves as a basis for the fee proposed by Postal
Service witness Mayo (USPS-T-39).
2. Background
Mailers of all classes may apply to use a Permit Imprint instead of affixing
postage stamps or meter strips onto mail pieces. The mailer must obtain a
permit at the post office where the mailings will be made by completing Form

1
2
3
4
6
7
8
9
10
11
12
13
14
15
16
17
18
19
20
21
USPS-T-29, page 30
3615, Mailing Permit Application and Customer Profile. A one-time fee is
charged for the permit.
3. Cost Methodology
The cost methodology for estimating Permit Imprint Application costs
remains unchanged from the methodology presented in Docket No. R97-1,
USPS LR-H-107. In general, the total permit application cost is comprised of
three activities: (1) permit issuance, (2) literature and pamphlets, and (3) permit
revocation.
4. Cost Results
The estimated test year cost per permit application is $104.05. See
USPS LR-I-160, Section G, page 1 for the Permit Imprint cost model.
G. STAMPED CARDS
1. Scope of Analysis
This section provides test year cost estimates for Stamped Cards. These
costs serve as a-basis for Stamped Card fees proposed by Postal Service
witness Mayo (USPS-T-39).
2. Background
Stamped Cards allow firms and individuals to purchase cards already
embossed with postage for the First-Class Mail single card rate. Presently, four
types of Stamped Cards are available: (1) single-cut, (2) single-sheet, (3) reply
card, and (4) banded.

USPS-T-29, page 31
.-. 1 I
Stamped Cards may be purchased in bulk or in single units through post
2 offices and the Philatelic Fulfillment Service Center (PFSC) in Kansas City.
3 Postal vending machines sometimes offer stamped cards for purchase in
4 banded packs.
6
7
8
9
10
11
All stamped cards are produced and distributed by the U.S. Government
Printing Office.(GPO) in Washington, D.C. The GPO enters Stamped Card
cartons into the mailstream in quantities of 2000, 5000, and 10,000, depending
upon the card type. The current contracted prices are effective through the end
of fiscal year 2000.
3. Stamped Card Costs
Test year costs for Stamped Cards are based solely on contract prices
12 I
negotiated with the U.S. Government Printing Office. These costs include
13 materials, printing, and distribution. Table 4 below shows a cost per thousand
14 cards (contract price) and a cost per card.
Table 4 Test Year Stamped Card Costs
Stamped Card Style
Single Cut
Single Sheet
Reply Card
Banded
Cost per Cost per Thousand Card
$14.00 $0.014
$14.00 $0.014
$28.00 $0.028
$31.00 $0.031
15 H. STAMPED ENVELOPES
16 1. Scope of Analysis
17 This section provides test year cost estimates for Stamped Envelopes. rc‘
I 18 Test year costs are presented for each Stamped Envelope category, both plain

USPS-T-29, page 32
1
2
3
4
5
6
7
8
9
10
11
12
13
14
15
16
17
18
19
20
and printed (i.e., personalized). These costs serve as a basis for the fees
proposed by Postal Service witness Mayo (USPS-T-39).
2. Background
The Stamped Envelope P,rogram allows firms and individuals to purchase
envelopes already embossed with postage for the basic First-Class Mail rate.
Presently, two types of Stamped Envelopes are available to the public: (1)
envelopes with a printed return address (printed) and (2) envelopes without a
printed return address (plain). Each is available with or without a window in sizes
6-3/4 and 10 inches.
Plain Stamped Envelopes may be purchased in bulk (lots of 500) for a
discount or in single units through post offices and the Philatelic Fulfillment
Service Center (PFSC) in Kansas City. Postal vending machines sometimes
offer plain Stamped Envelopes for purchase in banded packs of five. Printed
envelopes may be ordered in bulk (lots of 50 or 500) through the PFSC. The
order is then fulfilled and shipped directly to the customer by the manufacturer,
Westvaco Inc., located in Williamsburg, Pennsylvania.
The Stamped Envelope contract between the Postal Service and
Westvaco is three years in length, with two one-year extension options. The
current contract ends June 30, 2000. The Postal Service expects to begin
accepting bids for the next three-year contract in early 2000.
USPS-T-29, page 33
I- 1 2
3
4
5
6
7
8
9
10
11
12
13
14
15
16
17
18
19
20
21
3. Stamped Envelope Cost Model
The Stamped Envelope cost model presented in this testimony consists of
three components: (1) manufacturing costs, (2) distribution costs, and (3) selling
costs. Each component is discussed briefly below.
a. Manufacturing Costs
The manufacturing cost of a Stamped Envelope is equivalent to the
negotiated contract price or the amount actually paid by the Postal Service to
Westvaco for each envelope. Manufacturing costs are negotiated on an annual
basis and specified in the contract between the Postal Service and Westvaco by
item number.
Contract prices are not available for the test year because the Postal
Service does not yet have a contract in place for fiscal year 2001. Instead, the
negotiated contract prices for the period July 1, 1999 through June 30, 2000 are
used in this testimony as proxies (see USPS LR-I-160, Section H, pages 1 and 2
for FY 2000 contract prices). As a general rule, the Postal Service is unable to
incorporate exact test year contract prices into the Stamped Envelope cost
model because manufacturing costs are unknown at the time of a rate case
filing. This fact could be problematic, particularly if a new vendor is granted the
Stamped Envelope contract.
Several factors influence manufacturing costs, including the envelope size
(10” or 6 “X”), envelope style (printed or plain, window or regular, banded or
unbanded), and complexity of the “stamp” (single color, multi-colored, or “patch”).

USPS-T-29, page 34
1
2
3
4
5
6
7
s
9
10
11
12
13
14
15
16
17
18
19
20
21
22
23
As can be expected, the more complicated designs require more processing and
are therefore more expensive to manufacture.
b. Distribution Costs
Distribution costs are those costs incurred by the Postal Service between
the time a shipment leaves the manufacturer’s dock until a post office or Postal
Distribution Center receives the shipment. Test year distribution costs are
modeled for those Stamped Envelopes shipped to postal facilities.
Plain envelopes are shipped in cartons of 500, 1000, 1500, 2500, and
5000 (6 %” only) envelopes. The average plain Stamped Envelope order is
shipped in a carton of 2500 envelopes. Thus, distribution costs in the plain
Stamped Envelope model are based on a 2500-count carton.
Distribution costs are made up of three components. (1) A trucking
contractor transports plain Stamped Envelope cartons directly from the
Westvaco manufacturing facility in Williamsburg, Pennsylvania to a Destinating
Bulk Mail Center (DBMC) for deposit into the mailstream. After arriving at the
DBMC, the envelope cartons are (2) processed and (3) transported to a delivery
unit.
Average transportation costs for plain envelopes shipped to a DMBC were
derived from invoices for plain enveloped shipments made over a four-week
period in FY 1998. A test year cost per envelope was obtained by adjusting
base year costs with the test year Consumer Price Index. Mail processing cost
estimates were developed using Postal Service witness Eggleston’s Parcel Post
mail processing model (USPS-T-26) (see USPS-T-29 Campbell Workpaper Ill).

USPS-T-29, page 35
,F~ 1
2
3
4
5
6
7
8
9
10
11
- 12
13
14
15
16
17
18
19
20
21
22
C 23
Witness Eggleston’s Parcel Post transportation model was used to calculate
transportation costs from the DBMC to a delivery unit. See USPS-T-26,
Attachment 0 for a discussion of the model as it relates to Stamped Envelopes.
See USPS LR-I-160, Section H for total distribution costs.
C. Selling Costs
Selling costs are those costs incurred by the Postal Service when a
customer makes a Stamped Envelope purchase either at a post office window
(plain envelopes) or through the Philatelic Fulfillment Service Center (printed
envelopes). Selling costs for plain and printed envelopes are treated separately
below.
Plain Stamped Envelopes are sold individually, in banded sets of five, and
in bulk quantities (500, 1000, 1500, 2500, and 5000 counts). Selling costs vary
according to the number of envelopes sold per transaction. The more envelopes
that are sold in a single transaction, the lower the selling cost per envelope.
Because of this fact, the Postal Service offers a discount for plain Stamped
Envelopes sold in bulk. Thus, two selling costs for the test year are needed -
one for bulk sales and another for single sales.
Test year CRA window costs for Stamped Envelopes were allocated to
plain and printed envelopes based on FY98 IOCS tally data (see USPS-T-29
Campbell Workpaper Ill). Pla~in envelope volumes for single and bulk sales were
then estimated using FY98 volume ratios. Using the average envelope
quantities sold per transaction, the total number of transactions was determined
for both single sales and bulk sales. An average selling cost per transaction was

USPS-T-29,page36
then estimated, followed by the average selling cost per envelope for both single
and bulk sales (see USPS LR-I-160, Section H).
Printed envelopes are sold only in bulk quantities and therefore only
require one selling cost. The test year selling cost per envelope for printed
envelopes was estimated by using the same procedure as for plain envelopes.
4. Modeled Cost Results
Test year costs for plain Stamped Envelopes are shown in Table 5 and in
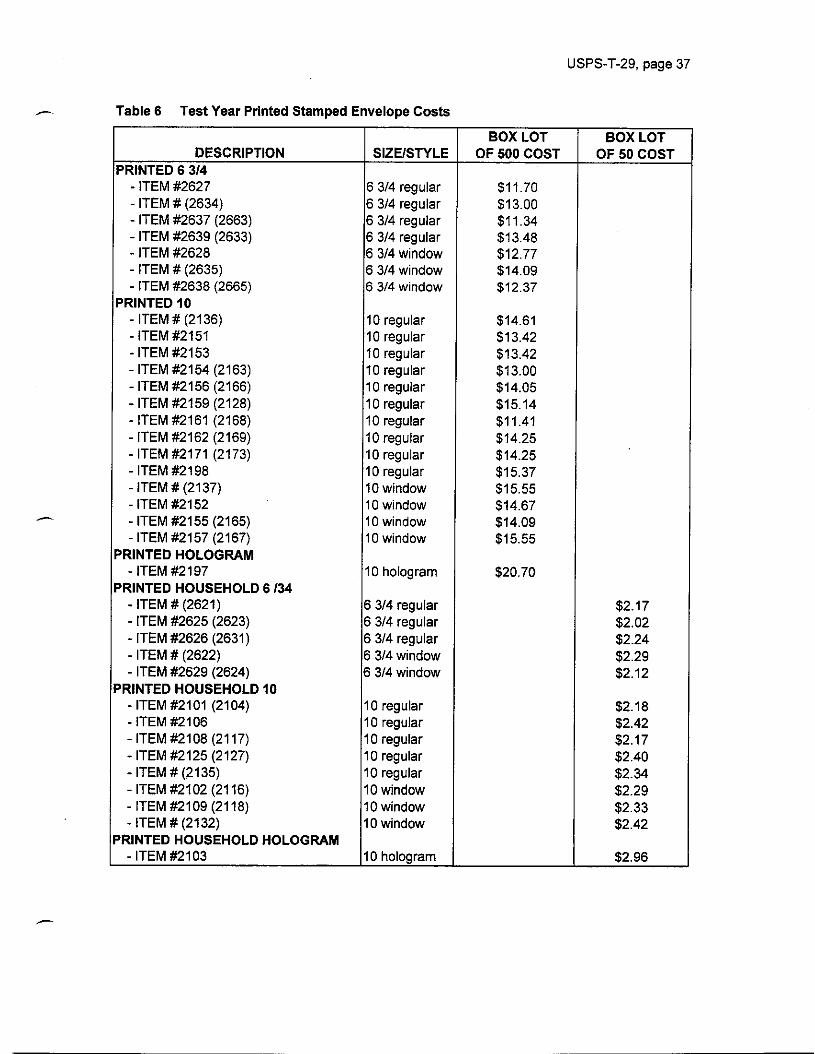
Table 6 for printed Stamped Envelopes.
Table 5 Test Year Plain Stamped Envelope Costs
DESCRIPTION SIZE/STYLE ‘LAIN 6 % I
-ITEM#2627 6 314 regular -ITEM#(2634) 6 3/4 regular -ITEM#2637(2663) 6 3/4 regular -ITEM#2639(2633) 6 3/4 regular -ITEM #(2635) 6 3/4 window -lTEM#2636(2665) 6 314 window -ITEM#2630(2650) 6 3/4 banded -lTEM#2640(2660) 6314banded
‘LAIN 10 -lTEM#(2136) -ITEM#2151 -ITEM#2152 -ITEM#2153 -lTEM#2154(2163) -ITEM#2156(2166) -ITEM#2159(2128) -lTEM#2171(2173) -ITEM#2198 -ITEM#(2137) -ITEM#2155(2165) -ITEM#f2157(2167) -ITEM#2110(2140) -lTEM#2120(2130)
10 regular 10 regular 10 regular 10 regular 10 regular 10 regular 10 regular 10 regular 10 regular lOwindow 10 window lOwindow IObanded lobanded
‘LAIN HOLOGRAM 10 -ITEM#I2197 10 hologram
BOX LOT OF 500 COST
$7.51 $9.08 $7.15 $9.27
$10.32 $8.17
$10.46 $9.39
$10.65 $9.39 $6.98
$10.03
$11.10 $10.22 $11.33 $11.52 $10.06 $11.52
$16.60
SINGLE ENV COST
$0.0615 $0.0647 $0.0608 $0.0651 $0.0672 $0.0629 $0.0679 $0.0637
$0.0675 $0.0653 $0.0678 $0.0653 $0.0645 $0.0666
$0.0687 $0.0670 $0.0692 $0.0696 $0.0666 $0.0696 $0.0673 $0.0716
$0.0797
USPS-T-29, page 37
-. Table 6 Test Year Printed Stamped Envelope Costs
DESCRIPTION ‘RINTED 6 3/4
- ITEM #2627 - ITEM # (2634) - ITEM #2637 (2663) - ITEM #2639 (2633) - ITEM #2628 - ITEM # (2635) - ITEM #2638 (2665)
‘RINTED IO - ITEM # (2136) - ITEM #2151 - ITEM #2153 - ITEM #2154 (2163) - ITEM #2156 (2166) - ITEM #2159 (2128) - ITEM #2161 (2168) - ITEM #2162 (2169) - ITEM #2171 (2173) - ITEM #2198 - ITEM # (2137) - ITEM #2152 - ITEM #2155 (2165) - ITEM #2157 (2167)
RINTED HOLOGRAM - ITEM #2197
RINTED HOUSEHOLD 6 134 - ITEM # (2621) - ITEM #2625 (2623) - ITEM #2626 (2631) - ITEM # (2622) - ITEM #2629 (2624)
RINTED HOUSEHOLD IO - ITEM #2101 (2104) - ITEM #2106 - ITEM#2108 (2117) - ITEM #2125 (2127) - ITEM # (2135) - ITEM #2102 (2116) - ITEM #2109 (2118) - ITEM # (2132)
RINTED HOUSEHOLD HOLOGRAM - ITEM #2103
SIZE/STYLE BOX LOT
OF 500 COST
6 3/4 regular $11.70 6 3/4 regular $13.00 6 3/4 regular $11.34 6 3/4 regular $13.48 6 3/4 window $12.77 6 314 window $14.09 6 314 window $12.37
10 regular 10 regular 10 regular 10 regular 10 regular 10 regular 10 regular 10 regular 10 regular 10 regular 10 window 10 window 10 window 10 window
$14.61 $13.42 $13.42 $13.00 $14.05 $15.14 $11.41 $14.25 $14.25 $15.37 $15.55 $14.67 $14.09 $15.55
10 hologram $20.70
6 3/4 regular 6 3/4 regular 6 3/4 regular 6 314 window 6 314 window
10 regular 10 regular 10 regular 10 regular 10 regular 10 window 10 window 10 window
10 hologram
BOX LOT OF 50 COST
$2.17 $2.02 $2.24 $2.29 $2.12
$2.18 $2.42 $2.17 $2.40 $2.34 $2.29 $2.33 $2.42
$2.96

USPS-T-29, page 38
1 IV. QUALIFIED BUSINESS REPLY MAIL DISCOUNT
2 A. SCOPE OF ANALYSIS
3 This section presents the test year mail processing cost avoidance of a
4 Qualified Business Reply Mail piece compared to a handwritten mail piece. This
5 cost avoidance applies to letters and cards and supports the testimony of Postal
6 Service witness Fronk (USPS-T-33).
I B. BACKGROUND
8
9
10
11
12
13
14
15
16
17
18
19
20
21
As discussed above in Section Ill, QBRM are those BRM letters and cards
which are automation compatible, have both a FIM C and a unique ZIP+4
barcode, and have qualified for BRMAS processing. QBRM users currently pay
a per-piece accounting fee in addition to postage.
The QBRM discount first established as a result of Docket No. R97-1,
reflects cost savings, or a cost avoidance, incurred by the Postal Service as a
result of “clean” barcoded mail pieces provided by QBRM users. The cost
avoidance is defined as the difference in mail processing costs between a
preapproved prebarcoded First-Class Mail piece and a handwritten First-Class
reply mail piece. The cost avoidance for QBRM pieces is driven by the fact that
handwritten reply mail pieces incur additional costs as they are processed
through the Remote Bar Coding System (RBCS). The models initially developed
in Docket No. R97-1 (USPS-T-23) encompass mail processing costs up to the
point where each mail piece receives its first barcoded sortation on a BCS.
--
USPS-T-29, page 39
I C. COST METHODOLOGY I
2 The cost methodology presented in this testimony is relatively unchanged
3 from the one presented in Docket No. R97-1. The cost avoidance is still defined
4 as the difference in mail processing costs between a preapproved prebarcoded
5 First-Class Mail piece and a handwritten First-Class Mail piece. The mail flow
6 models presented here (see USPS LR-I-160, Section L), however, have been
7 expanded to incorporate mail processing costs through the incoming secondary
8 operation and are consistent with the model presented in this docket by Postal
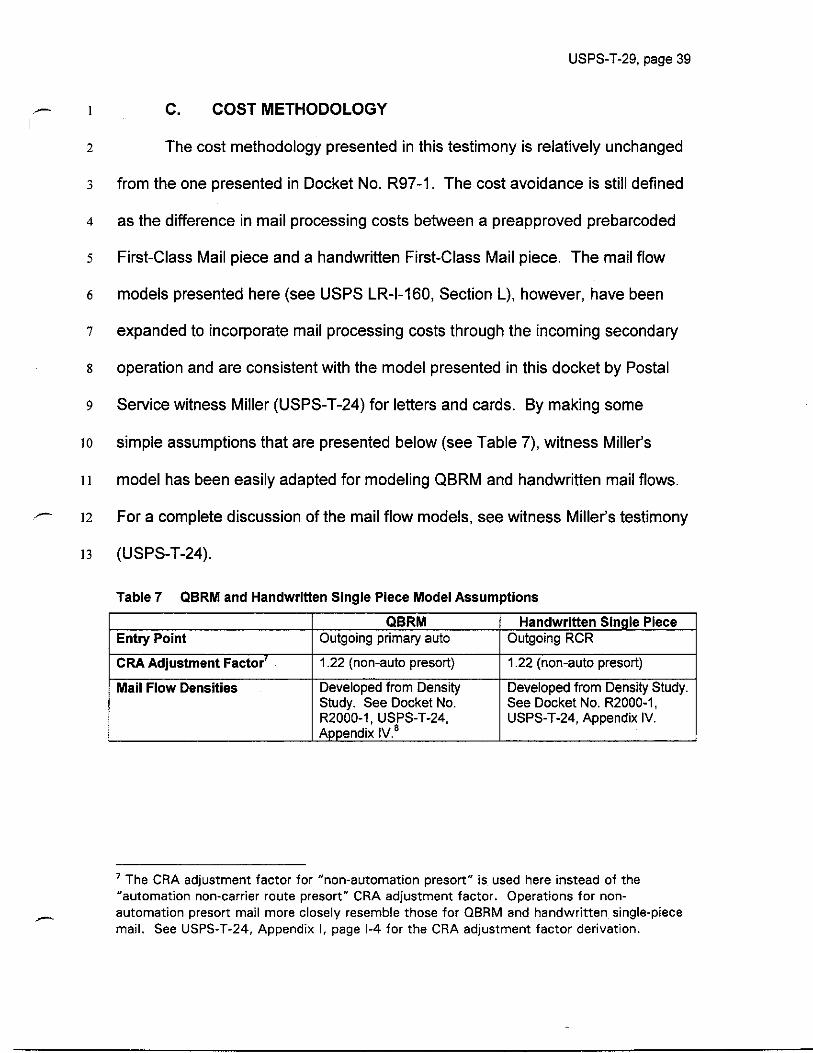
9 Service witness Miller (USPS-T-24) for letters and cards. By making some
10 simple assumptions that are presented below (see Table 7) witness Miller’s
11 model has been easily adapted for modeling QBRM and handwritten mail flows.
- 12 For a complete discussion of the mail flow models, see witness Miller’s testimony
13 (USPS-T-24).
Table 7 QBRM and Handwritten Single Piece Model Assumptions
Entry Point
CRA Adjustment Factor7
Mail Flow Densities
QBRM Outgoing primary auto
1.22 (non-auto presort)
Developed from Density Study. See Docket No. R2000-1, USPS-T-24, Appendix IV.*
Handwritten Single Piece Outgoing RCR
1.22 (non-auto presort)
Developed from Density Study. See Docket No. R2000-1, USPS-T-24, Appendix IV.
’ The CRA adjustment factor for “non-automation presort” is used here instead of the “automation non-carrier route presort” CRA adjustment factor. Operations for non-
F automation presort mail more closely resemble those for QBRM and handwritten single-piece mail. See USPS-T-24, Appendix I, page l-4 for the CRA adjustment factor derivation.

USPS-T-29, page 40
1
2
3
4
5
6
7
8
9
10
11
12
13
14
15
16
17
18
19
20
D. QBRM COST AVOIDANCE
The modeled test year cost avoidance of a QBRM mail piece is 3.38
cents, using a handwritten single-piece letter as a benchmark (see USPS LR-I-
160, Section L). Improvements in RBCS character recognition have lowered the
cost associated with handwritten single-piece processing and, as a result, have
shrunk the cost avoidance incurred by a QBRM mail piece despite an expanded
model.
V. ADDITIONAL COST STUDIES
A. PICKUP SERVICE
1. Scope of Analysis
This section presents the estimated test year costs of providing pickup
service for Express Mail, Priority Mail, and Standard Mail (B) service. These
costs serve as a basis for the fees proposed by Postal Service witness Robinson
(USPS-T-34).
2. Background
For a fee, pickup service is available for Express Mail, Priority Mail, and
Standard (B) service on an on-call or scheduled basis. In Docket No. R97-1,
Postal Service witness Nelson utilized data from carrier/messenger surveys to
support a new approach to calculate costs for on-call and scheduled pick-ups
(Docket No. R97-‘I, USPS-T-19, Exhibit USPS-19E), replacing the previous use
’ Densities for QBRM are assumed the same as the general First-Class Mail flow densities, with one exception. It is assumed that 100 percent of the QBRM from the Incoming MMP operation flows to the SCFllncoming Primary operation.

USPS-T-29, page 41
1
10
11
12
13
14
15
16
17
18
19
20
21
of messenger delivery costs. Witness Nelson’s approach was adopted by the
Commission, and implemented in PRC Op. R97-1, PRC LR-4.
3. Cost Methodology
I have updated witness Nelson’s cost methodology (Docket No. R97-1,
USPS-T-l 9, Exhibit 19E) using test year piggyback factors and wage rates (see
USPS LR-I-160, Section I).
4. Cost Results
The estimated test year costs per pickup are $9.98 for on-call pickup and
$9.20 for scheduled pickup (see USPS LR-I-160, Section I).
B. EXPRESS MAIL RATE CATEGORY COST DIFFERENTIALS
1. Scope of Analysis
This section updates the estimated test year per-piece cost differentials
across Express Mail rate categories. Witness Plunkett (USPS-T-36) considered
these cost differentials when developing rates for Express Mail.
2. Background
Express Mail Service maintains four rate categories, namely (1) Post
Office-to-Post Office, (2) Post Office-to-Addressee, (3) Same Day Airport, and
(4) Custom Designed. In Docket No. R97-1, witness Nelson (Docket No. R97-1,
USPS-T-19) developed a methodology based on differences between rate
categories with respect to delivery-related costs. Nelson utilized data from
carrier/messenger surveys to support the new approach. The Commission

USPS-T-29, page 42
1
2
3
4
5
6
7
8
9
10
11
12
13
14
15
16
adopted witness Nelson’s new cost methodology and implemented the proposal
in PRC Op. R97-1, PRC LR-5.
3. Cost Methodology
I have updated witness Nelson’s cost methodology (Docket No. R97-1,
USPS-T-19, Exhibit 19D) using test year piggyback factors and wage rates (see
USPS LR-I-160, Section J).
4. Cost Results
Estimated test year cost differentials between Express Mail rate
categories are shown in Table 8 below.
Table 8 Cost Differentials Across Express Mail Rate Categories
Rate Category Delivery-Related Cost per Piece Cost per Piece Differential From Mean
PO-to-PO $0.132 ($1.751) / /
PO-to-Addressee $1.906 $0.023
Same Day Airport $0.132 ($1.751) 1 \ , Custom Designed $0.420 I ($1.463)
C. NONLETTER-SIZE BUSINESS REPLY MAIL
1. Scope of Analysis
This section updates the estimated test year costs for weight averaging,
an alternative method currently used by the Postal Service to count, rate, and bill
nonletter-size BRM.
2. Background
Weight averaging is a statistical method used by the Postal Service as an
alternative to the standard piece-by-piece method of counting, rating, and billing

1
2
3
4
5
6
7
8
9
10
11
- 12
13
14
15
16
17
18
19
20
21
22
USPS-T-29, page 43
nonletter-size BRM. The weight averaging daily procedures involve bulk
weighing each customer’s incoming BRM pieces, estimating postage using a
postage-per-pound conversion factor, billing each customer using a special
computer screen in the PERMIT system, and recording each customer’s daily
activity. Each AP, a sample of pieces is taken for use in updating the conversion
factors, which are used until the next sample is taken. See Docket No. MC99-2,
USPS-T-3 for a detailed description of these activities.
BRM recipients who qualify for nonletter-size BRM fees pay a per-piece
fee, plus a monthly fee to cover sampling and accounting costs.
3. Cost Methodology
The cost methodology for weight averaging incorporates both volume
variable and fixed costs based on a two-week data collection period at three
sites (see Docket No. MC99-2, USPS-T-3). The cost model contains three
components based on specific activities. One activity is volume-variable while
the other two activities are fixed. First, daily bulk weighing is dependent on the
volume received and translates into a per-piece cost. Second, daily billing and
accounting activities do not vary by daily volume and translate into a fixed cost.
Lastly, periodic sampling is not dependent on the daily volume received and is
considered a fixed cost incurred each accounting period.
4. Cost Results
Updated costs are shown in Table 9 below using the above methodology
and incorporating test year piggyback factors and wage rates (see USPS LR-I-
- 23 106, Section K).

USPS-T-29, page 44
Table 9 Test Year Nonletter-size BRM Costs
Type of Cost Test Year Cost
Per Piece $0.0057
Monthly Accounting $498.40

USPS-T-29, page 45
APPENDIX 1: BRM RATING AND BILLING STUDY

USPS-T-29, page 46
1
10 In the summer of 1999 the Postal Service sponsored a survey to update the distributions 11 of billing practices used for BRM. Thirty-three offices that responded to the 1996 BRM 12 Practices Survey and recorded BRM transactions in PERMIT in FY98 were randomly 13 selected. Each office was contacted by telephone, and postal personnel familiar with 14 BRM practices were questioned concerning the use of the BRM module at their office, 15 The results of this survey were used to update the original distributions of billing 16 methods reported in the BRM Practices Survey.
17 Survey Methodology
18 The universe of offices for this survey consists of the ofices that had responded to the 19 1996 survey on BRM practices and that were reporting BRM transactions in the BRM 20 module of PERMIT in the first three quarters of FY98. Of the 446 offices that responded 21 to the 1996 survey, 217 recorded BRM transaction in PERMIT in FY98. To increase 22 sampling efficiency, the universe was grouped into three strata: those offices that used 23 the PERMIT system for billing in 1996, those offices that billed using BRMAS in 1996, 24 and all other offices. Each stratum was substratified using the stratification 25 methodology originally used in the 1996 survey. This stratification methodology was 26 designed to group together facilities that are likely,to sort and rate BRM using like 27 methods.g
28 Given time and cost constraints, it was determined that a sample size of thirty offices 29 was feasible. The sample size was allocated across strata so that the majority of 30 sample observations would come from the strata that contained offices using manual 31 billing methods. Within each strata, the sample size was allocated to substrata 32 proportional to FY98 BRM volume (as reported in PERMIT). In order to ensure that at 33 least one sample office was selected in each substrata that had offices using the BRM 34 module of PERMIT in FY98, the sample size was increased to 33.
35
In Docket No. R97-1, BRM costs were based in part on the distributions of billing methods by rate element reported in Table 16 of Docket No. R97-1, USPS LR-H-179. These distributions were based on survey data collected in the fall of 1996. At that time, 20.4 percent of all BRM volume was billed using the PERMIT system. Since that time, the percentage of offices using the BRM module of the PERMIT system has increased substantially. For example, of the 446 offices responding to the BRM Practices Survey in 1996, only 80 offices used PERMIT for billing purposes in FY96. By FY98, 217 of these 446 offices were recording transactions in the BRM module of PERMIT.
information on the survey universe is shown in Table 1 below,
’ Facilities were assigned to strata by the following criteria: Processing and Distribution Center or Facilities, facilities having at least one piece of automation equipment, facilities reporting revenues in the BRM module of PERMIT, facilities reporting BRM revenue in the National Consolidated Trial Balance. Facilities were assigned to substrata based on whether they reported using only manual counting methods in the preliminary survey (see Docket No. R97-1, USPS LR-H-179, section 4a and 4b for details).

USPS-T-29, page 47
8 Results
9 The revised BRM billing practices are reported in Table 2 below. These results were 10 obtained using the inflation process described in the next section.
I 1
Table 1: BRM Billing Practices Survey - Stratification
Number of FY98 BRM Sample Strata Substrata offices y&Q _ Size PERMIT 3 46 27,801,740 2
5 18 36,370,459 2 11 16 149,876,564 2
3RMAS 3 4 129,377 1 5 4,341 11 l 58,254.352 1
3ther 1 2~ 1,810,153 1 2 1 728 1 3 37 34,324,311 9 4 11 4,480,721 1 5 13 5,442.413 1 6 4 52,381 1 7 0 0 0 8 11 2,655,530 1 9 6 706,111 1 10 11 4,104.293 1 11 30 27,474,548 7
rotal 217 353,488,022 33
Each sample office was contacted by telephone, and the person most familiar with BRM billing practices was interviewed. This person was typically the BRM unit supervisor or a BRM clerk familiar with the BRM billing practices used at the sample office. This person was asked to describe how the office is currently using the PERMIT system for recording daily BRM activities. In particular, each office was asked whether they are actually using the PERMIT system to calculate postage due and to prepare bills for the customer. Responses were obtained from all sample offices.
Table 2 Profile of BRM Billing Practices - How Mailer Bills are Generated (Updated 8/99)
Percent of Volume Non-QBRM Non-Advance
BRMAS BRMAS-rated Advance Deoosit &I$! m
6.5% 0.5% 0 3.6% Locally-developed sofhvare Manual’ ADBR software PERMIT Other
5.7% 3.7% 2.3% 4.7%
43.6% 55.5% 72.1% 50.4% 1.0% 1.2% 0.5% 1.0%
40.9% 38.0% 23.9% 38.6% 2.4% 1.1% 0.8% 1.7%
Total 100% 100% *includes IRT sticker on bill, meter strip, and handwritten bills.
100% 100%

USPS-T-29, page 48
1 As these results show, the percent of BRM pieces billed using the BRM module of the 2 PERMIT system is now 38.6 percent, which is substantially higher than in 1996, when 3 only 20.4 percent of BRM pieces were billed using the. PERMIT system.
4 inflation Process
5 The inflation process involved updating the office-specific billing practices distribution 6 from the 1996 survey with updated estimates based on the new survey for the offices in 7 the current survey’s universe, and then inflating the data using the method described 8 below (which is the same method reported in Docket No. R97-1, USPS LR-H-179, 9 section 4e).
10 For each respondent, the percent of BRM volume (by rate element, by billing method 11 used) was determined based on information obtained in the telephone interview. Within 12 each substrata, a weighted average of the distribution of billing methods for the sample 13 offices was obtained. This weighted average was then applied to each of the non- 14 sample offices in the survey universe, by substrata. The billing practices data for the 15 229 offices that responded to the original 1996 survey but were not included in this 16 study (i.e., those offices not reporting BRM transactions in PERMIT in FY98) were not 17 updated. The billing method distributions data were then inflated using the process as 18 described in Docket No. R97-1, USPS LR-H-179, section 4e.
19 Individual responses given in percentages were changed to levels, using facility BRM 20 volume (by rate element). Facility levels were summed to sub-strata totals. Since the 21 sampled sites from all sub-strata were chosen to be representative of their strata, the 22 sub-strata responses were inflated to obtain estimates for the universe. Responses (in 23 levels, by strata) were rolled up to a universe total, using the following inflation factors 24 as weights:
25 For sub -strata 1,2,4,5 : weight, =
26 For sub-strata 6,7,9,10 : weight, =
27 Forsub-strataI+:weight, =(“r”)(,Mi~~Mj,)(~]
28 Fors~b-snaia8:wright,=(IY:~iX)(~M,~~~i~)(~]
USPS-T-29, page 49
-- 1 2 3 4 5 6 7 8 9
10 11 12
13 For sub-strata 11, no previous volume information was available to develop inflation 14 factors since this strata was not included in the preliminary survey and the BRM 15 volumes for these sites were not available from another source. In order to develop 16 an inflation factor, an estimate of BRM volumes for non-responding sample sites 17 was needed. A model of BRM volumes for all plants (i.e., for facilities in strata 5) 18 was estimated through a regression of number of stations and accounting revenue 19 on BRM volumes. This model was estimated over sub-strata 5 and 10 facilities, 20 which responded to the Practices Survey. This model was then used to estimate 21 BRM revenues for the non-respondent sample sites in sub-strata II. Total BRM 22 revenue for sub-strata 11 was then estimated by summing revenues from 23 respondent sites and estimated revenues from the non-respondent sites. The
- 24 inflation factor for sub-strata 11 is therefore:
25 (BRM revenue from respondent sites + estimated BRM revenue for non- 26 respondent sites)/BRM revenue from respondent sites
27 Inflated sub-strata levels were summed to strata totals. National estimates were 28 obtained by taking a weighted average across all strata results, with volumes (total 29 BRM or rate element volumes, depending on the nature of the question) as 30 weights.
31 The distribution of volume of BRM pieces by rate element obtained from the survey 32 (after rolled-up to universe) differed from that reported in the GFY 1996 RPW 33 reports. The difference between these two distributions was that sample sites on 34 average reported a higher percentage of non-advance deposit BRM pieces than 35 was reported in RPW. Of all advance deposit account volume, the percentage of 36 BRMAS-rated mail was about the same in both: 55 percent in RPW, 54 percent in 37 the Practices Survey sample (inflated).
38 Because of this difference in the distribution of BRM volume across rate elements, 39 the sample distribution of BRM volume by rate element was controlled to the 40 corresponding RPW distribution (after inclusion of controlled strata 3 pieces). 41 Strata 3 piece distribution across rate element was controlled separately to the rate 42 element distribution in 1996 PERMIT data.
where:
Ni=number of facilities in BRM universe Wi=number of sites responding to preliminary survey Xi=number of sites responding to preliminary survey after selection of Practices
sample sites Mi=number of “manual” sites NMi=number of “non-manual” sites Pi=total BRM revenues in PERMIT (302 facilities) PRi=BRM revenues in PERMIT for Practices Survey respondents Zi=number of sites responding to Practices Survey i=sub-strata.

USPS-T-29, page 50
1 The average daily volumes in RPW and in the sample, and the control factors 2 determined, are:
facilities BRMAS- 1,692.198 3,088,493 0.5196 221,229 257,694 0.8585 rated (51.9%) (48.4%) (56.4% (56.9%) Non-QBRM 1,368,364 2,614,114 0.4907 165,665 162,887 1.0171 advance (42.0%) (41%) (42.3%) (36.0%) deposit I I I I I I Non- 197,423 677.784 0.2981 5,065 32,439 0.1561 advance (6.1%) (10.6%) (1.3%) (7.2%)
3 As this table indicates, volume levels differed considerably between survey 4 responses (rolled-up to universe) and RPW (BRM volumes in RPW are also based 5 on survey data). Several things could influence this discrepancy. Most sites do not 6 keep records of volumes (only of postage), and so had to estimate” these data. In 7 addition, the survey question asked for average daily volume, and many mailers 8 receive seasonal or periodic mailings, e.g., proxies, magazine subscriptions linked 9 with advertising campaigns (although the survey was conducted at a time not
10 generally believed to be one with high seasonal volumes). Although the levels 11 differed, it should be noted that the distribution across rate element were similar. 12 Given that the information of interest from this survey was the distribution of 13 practices associated with BRM, the difference in volume levels does not, by itself, 14 cast doubt on the results reported here.
15 The final results presented here have been controlled to RPW totals
” It was determined that it would be too onerous on the field to ask them to collect volume data for a statistically-valid sample period at the time of year the survey was conducted.

USPS-T-29, page 51
P
APPENDIX 2~: CALLER SERVICE STUDY METHODOLOGY

USPS-T-29, page 52
CALLER SERVICE COST STUOY METHODOLOGY
1
2 3 4
1.0 Purpose
The purpose of this study is to estimate the costs of providing Caller Service (CS) to each caller box number or caller separation. In addition, the study is used to estimate the cost of providing a reserved caller box number.
5
6
2.0 Sample Design
2.1 Introduction
7 Caller Service allows customers to pickup mail at both delivery units and Processing and 8 Distribution Centers. The universe under study consists of those facilities having at 9 least one CS customer. A 1996 Post Office Box survey identified 5,414 out of 25,592
10 sites having at least one CS customer. See Docket No. MC96-3. LR-SSR-113. These 11 5,414 facilities are the sampling units making up the sampling frame.
12 All calculations in this study were completed using Microsoft Excel.
13
14 15 16 17 18 19
2.2 Stratum Design
The first step in designing strata for this study involved sorting the 5,414 data records in ascending order by number of CS customers. The sort showed that 32 sites have more than 500 CS customers each, nearly 22 percent of the total CS customers in the universe. Because these sites have large numbers of CS customers, it is highly desirable to include them in the study. One stratum (Ss) was devoted entirely to these high volume sites.
20 The remaining 5,382 sites required further stratification to account for variable CS 21 customer numbers throughout the sampling frame. Nearly 75 percent of the sites have 22 10 or fewer CS customers, while the remaining 25 percent have as many as 1000 CS 23 customers. Stratifying the sampling frame establishes sub-populations, each of which is 24 internally homogeneous (Sampling Techniques, Cochran. p. 90, 1977). The desired 25 effect is a gain in precision in the estimates of characteristics of the whole population.
26 It can be shown that little reduction in variance can be realized by using more than six 21 strata (Cochran, p. 133, 1977). Based upon this fact and the deSire to minimize the 28 number of strata, it was decided that a total of five strata would be optimal. Hence, the 29 remaining 5,382 sites were placed into four strata. These four strata were constructed 30 using Neyman allocation (Cochran, pp. 127-133, 1977). This was done by first using 31 the FREQUENCY function in Microsoft Excel to determine where natural breaks occur 32 within the sampling frame, to the extent that group CS customer numbers were on the 33 same order of magnitude. Since the ranges of CS customer numbers are not equal, an 34 adjustment factor was required to account for the range change from group to group. 35 When the first group changes from one of length d to one of length ud, the value of (5)“” 36 for the second group is multiplied by (ujf,‘. The root(f * u) is then summed cumulatively 37 as shown in Table 1.

” 1 root(f*u) 1 cumulative IBreakpoint strata 1 root(fk)
1.0 1 37.23 -- -- 37.23 SI 8.0 145.38 182.61 *** 61
29.0 167.72 350.33 l ** S2
59.0 119.00 469.33 *** S3
199.0 153.89 623.21 S4 199.0 70.53 693.75 l -* S4
1 For optimum strata design, the overall cumulative root (693.75) is divided by the number 2 of desired strata, four in this case. The closest cumulative root to this quotient (173.45) 3 is 182.61, which becomes the breakpoint for the first stratum. The next breakpoint is 4 determined by doubling 173.45 and finding the closest cumulative root (350.33). 5 Tripling 173.45 results in a 469.33 breakpoint, and so on. Thus, groups falling within the 6 breakpoints (denoted by ‘***I in Table 1) define the first four strata, denoted as S,, S2, 7 SJ, and Sq. The fifth stratum (S5) was defined earlier as the 32 high-volume sites.
8
9 10 11 12
,- 13 14
,.. 15
2.3 Sample Size Determination
Neyman allocation was used here to determine the sample size taken within each stratum. This method of allocation is typically used when there is a great difference between stratum sizes and a large variation between stratum variances (Elementary Samp/ing Theory, Yamane, p. 148, 1967). Assuming equal sampling costs among strata, Neyman allocation suggests taking more from the large strata and from strata that are more heterogeneous. The calculation, as detailed by Yamane (pp. 136-l 38, 1967), follows:
nh= Nh.Sh *n 16
17
18 where: 19 “h = the total number of units to be sampled from 20 stratum h 21 n = the total number of units to be sampled across all strata 22 Nh = the population sample size in stratum h 23 Sh = the standard deviation of variable x, in stratum h, where 24 x is CS customer numbers
25 The above calculation was performed for strata I-4 with a total sample size n=lOO. 26 Table 2 presents each parameter and the number to be sampled within each stratum.
USPS-T-29, page53
Table 2: Sample Size Determination Nh Sh h-S nh
Sl 4028 2.52 10,134.09 27
S2 970 8.01 7,774.51 21
S3 240 16.12 3J68.96 10
S4 144 110.41 15,899.12 42
TOTALS 5382 137.06 37.676.68 100

USPS-T-29, page 54
1
2 3
4 5 6
I 8 9
10 11 12 13
14
15 lb 17 18 19 20 21 22
23 24 25 26 27 28 29 30 31 32 33 34 35 36 31 38 39 40 41 42
2.4 Sample Selection
A random sample was taken within each stratum defined above. This procedure is detailed as follows:
1.
2.
3.
The sample frame for each stratum was sorted by 5-digit ZIP Code in an Excel spreadsheet. Each 5-digit ZIP Code corresponds to a postal facility’s Caller Service ZIP.
Another worksheet was established to select random numbers using Excel’s RANDBETWEEN function. Random numbers were chosen for each stratum to correspond with specific line numbers in the sample frame.
Excel’s LOOKUP function was utilized to “lookup” the ZIP Code corresponding to the randomly selected line numbers. The randomly selected ZIP Codes were arranged by stratum in a worksheet for strata 1-4. These ZIP Codes were then matched with specific postal facilities.
3.0 Survey Implementation
The CS survey was conducted in two phases. Phase I consisted of a mailing sent to all 132 sites selected for the study. The Spring 1999 mailing included a brief description of the study and requested that each site forward a complete listing of all 3s CS customers (see Attachment 1) for a Phase I survey). Exactly 122 sites returned the survey, a 92.4 percent response rate. 83 out of 122 respondents reported having one or more CS customers. Ten CS customer names were then selected from each CS customer list for data collection purposes in Phase II. If a particular site had fewer than ten customers, then that site was to collect data for all its customers.
Phase II was conducted over a four-week period in late-Spring 1999. The 83 sites with CS customers were divided into four groups, with each group assigned one of four weeks for data collection. Four consecutive weeks were chosen to capture any cyclical trends occurring over a month’s time. Each site was sent the attached Phase II survey packet (see Attachment 2 for Phase II survey), including survey instructions and forms. The participating sites were instructed to return the forms back to headquarters following data collection. Phase II resulted in an 80.7 percent response rate.
4.0 Data Collection
The Phase II survey (see Attachment 2) contained four parts, each corresponding to specific CS information. The purpose of Part 1 was to collect basic CS data including the total number of CS customers and separations at each site as well as the pick-up frequency of CS customers, Part 2 requested that each site record the total storage space required for CS mail. Storage areas included tables, pouch racks, hampers, cases, and floor space (plafform and box section). These data were used to calculate an annual cost of storage per caller number. Part 3 requested participants to record volume and time information related to CS billing and rent collection (Le., accounting). These data were used to calculate an annual window accounting cost per caller number. In Part 4, each site recorded the total time required to retrieve mail for 10 CS customers

1 I 2
3 4 5 6 7 8 9
10 11 12 13 14 15 lb 17 18 19 20 21 22 23 24
~- 25 26 27 28 29 30 31 32 33 34 35 36 37 38
39 40 41 42 43 44 45 46 47 48 49
USPS-T-29, page 55
pre-selected from each site’s CS customer list. If a site had less than 10 CS customers, then they were asked to record data for all its customers. These data were used to calculate the annual retrieval cost per caller number.
5.0 Data Entry
When each completed survey packet was received at headquarters, the data was reviewed for completeness and logged into a Microsoft Access database. The data was later transferred to an MS Excel file for analysis (see USPS-T-29 Campbell Workpaper IV).
6.0 Data Analysis
6.1 Window Service Accounting Costs
The total window service accounting cost is comprised of four activity costs: (1) Form 1091-related activities, (2) posting notices of rent due (Notice 32), (3) collecting rent payments from customers and preparing receipts (Form 1538) and (4) preparing applications for new CS customers (Form 1093). These activities were specifically addressed in Part 3 of the Phase II survey. Study participants were asked to record times for these activities over a one-week period. The total times for these activities are shown in USPS-T-29 Campbell Workpaper IV. These times were derived by totaling the appropriate columns.
Dividing the total minutes for all accounting activities by the total number of callers in the study results in a weekly accounting time per CS customer, By converting the weekly accounting minutes to hours and multiplying by the average hourly clerk wage, the weekly accounting direct cost per CS customer is derived. After annualizing the accounting cost and dividing by the average number of separations per caller, the annual accounting direct cost is determined. Finally, a total annual accounting cost per caller separation was determined by adding indirect costs to direct costs.
6.2 Window Service Retrieval Costs
Study participants recorded the total mail-retrieval time for 10 (or less) CS customers over a one-week period (see Part 4, Attachment 2). The total time for this activity is shown in USPS-T-29 Campbell Workpaper IV. Window service retrieval costs were obtained by first dividing the total retrieval time by the number of customers in the study picking up at the window, resulting in an average weekly retrieval time per customer. This time per customer was then annualized, resulting in an average retrieval time per customer per year. The annual direct/indirect cost per customer was obtained by multiplying the annual direct cost per customer by the average hourly clerk wage and then adding in indirect costs.
6.3 Platform Retrieval Costs
The annual direct/indirect cost per customer for platform mail retrieval was calculated using the same methodology used for window service mail retrieval. See USPS LR-I-160, Section C for detailed calculations.

USPS-T-29, page 56
1 6.4 Storage Costs
2 The total square footage at each study site dedicated to CS customer mail was recorded 3 in Part 2 of the Phase II survey (see Attachment 2). The total square footage for all 4 study sites was first determined. An average square footage per firm was then 5 determined by dividing the total square footage by the number of firms as shown in 6 USPS LR-I-160, Section C. The average annual storage cost per firm was then 7 determined by multiplying the average square footage per firm by the facility cost per 8 square foot. Finally, the average storage cost per caller separation was calculated by 9 dividing the average annual storage cost per firm by the average separations per
10 customer.
11 7.0 Results
12 The estimated test year cost per separation based on the above data analysis is 13 $596.04. See Table 3 for a cost summary by activity.
Table 3 Test Year Caller Service Costs
Activity Annual Cost
(direct and indirect)
Window Service Accounting $16.57
Window Service Delivery $177.86
Platform Delivery $292.77
Storage $108.85
Total Cost per Caller Number $596.04
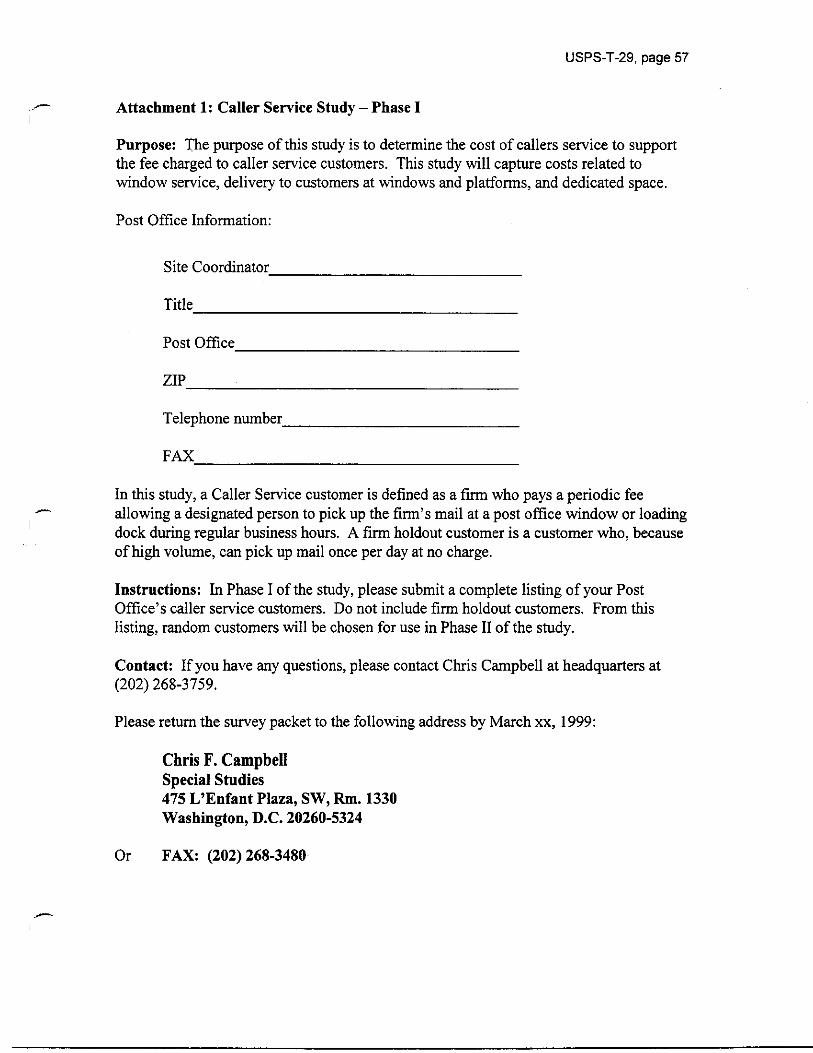
USPS-T-29, page 57
.- I
Attachment 1: Caller Service Study-Phase I
Purpose: The purpose of this study is to determine the cost of callers service to support the fee charged to caller service customers. This study will capture costs related to window service, delivery to customers at windows and platforms, and dedicated space.
Post Office Information:
Site Coordinator
Post Office
Telephone number
FAX
In this study, a Caller Service customer is defined as a firm who pays a periodic fee allowing a designated person to pick up the firm’s mail at a post office window or loading dock during regular business hours. A firm holdout customer is a customer who, because of high volume, can pick up mail once per day at no charge.
Instructions: In Phase I of the study, please submit a complete listing of your Post Office’s caller service customers. Do not include firm holdout customers. From this listing, random customers will be chosen for use in Phase II of the study.
Contact: If you have any questions, please contact Chris Campbell at headquarters at (202) 268-3759.
Please return the survey packet to the following address by March xx, 1999:
Chris F. Campbell Special Studies 475 L’Enfant Plaza, SW, Rm. 1330 Washington, D.C. 20260-5324
Or FAX: (202) 268-3480,

USPS-T-29, page 58
Attachment 2: Caller Service Study - Phase II
Thank you for completing Phase I of the Caller Service Study. From the list of Caller Service customers that you provided in Phase I, we selected specific customers for you to track during Phase II (see the Caller Data Collection Worksheet for these customers).
During Phase II, you will collect a variety of data for use in determining the cost of Caller Service. The data are classified into four parts: (1) Caller Service Customer Information, (2) Dedicated Caller Service Space, (3) Window Services, and (4) Window/Platform Delivery. Please read each Part carefully before beginning the data collection. Parts 1 and 2 will be completed just once during the study period, while Parts 3 and 4 will be completed each day during the study period.
Study Period: You should begin collecting data on Wednesday, May xx, 1999 and stop collecting data on Wednesday, May xx, 1999.
In this study, a Caller Service customer is defined as a firm who pays a periodic fee allowing a designated person to pick up the firm’s mail at a post office window or loading dock during regular business hours. Please do not include firm holdout customers. A Jirm holdout customer is a customer who, because of high volume, can pick up mail once per day at no charge.
Please keep track of the hours required to complete Phase II and record on the Hours Record Sheet. These hours will be released to your Post Offtce at the conclusion of this study.
Please submit your Caller Service Data Forms, Hours Record Sheet, and Caller Data
Collection Worksheet to the following address:
Chris F. Campbell Special Studies 475 L’Enfant Plaza SW, Rm. 1330 Washington, D.C. 20260-5324
Contact: If you have any questions, please contact Chris Campbell at headquarters at (202) 268-3759.
-.
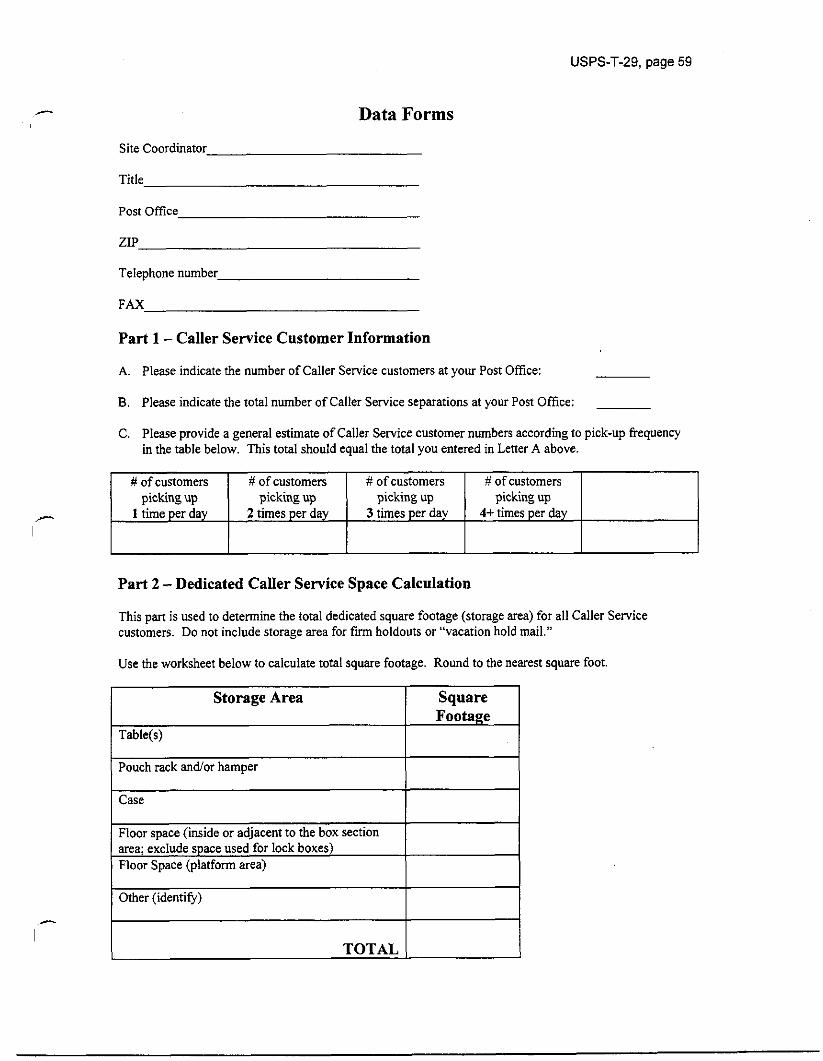
USPS-T-29, page 59
Data Forms
Site Coordinator
Post OffIce
Telephone number
Part 1 - Caller Service Customer Information
I-
A. Please indicate the number of Caller Service customers at your Post Of&x:
B. Please indicate the total number of Caller Service separations at your Post Off&:
C. Please provide a general estimate of Caller Service customer numbers according to pick-up frequency in the table below. This total should equal the total you entered in Letter A above.
# of customers I# of customers # of customers # of customers picking up picking up picking up picking up
1 time per day 2 times per day 3 times per day 4+ times per day
Part 2 -Dedicated Caller Service Space Calculation
This part is used to determine the total dedicated square footage (storage area) for all Caller Service customers. Do not include storage area for firm holdouts or “vacation hold mail.”
Use the worksheet below to calculate total square footage. Round to the nearest square foot
Case I I Floor space (inside or adjacent to the box section area; exclude space used for lock boxes) Floor Space (platform area)
Other (identify)
I- TOTAL

USPS-T-29, page 60
Part 3 -Window Services
This part is used to record volume end time information related to Caller Service billing and collection. Record all times to the nearest minute.
A. Do you use WinBATS to track Caller Boxes?
YES NO
If NO, will you get WinBATS in the future?
YES NO
Estimated date of WinBATS installation
B. Record the number of Form 1093’s (Application for Caller Service) prepared for new Caller Service customers during the test period and record the time to complete the forms. If using WinBATS for this activity, record the number of ‘New Customer-Box Issue’ screens that are completed each day and the times required to complete them.
Volume
Sunday Monday Tuesday Wednesday Thursday Friday Saturday
Time
4, C. Record the number of Form 1091’s (Register for Caller Service) reviewed during the test period for
Caller Service only. If using WinBATS for this activity, record the number of times a ‘Caller Due’ screen is reviewed each day.
Volume
Sunday Monday Tuesday Wednesday Thursday Friday Saturday
D. Record the times required for Form 1091-related activities (Caller Service only).
data for new Caller Service customers
TOTALS

USPS-T-29, page 61
-. E. Record the number of Notice 32’s (Notice of Rent Due) and the time required to hand notices to Caller Service customers during the test period.
Sunday Monday Tuesday Wednesday Thursday Friday Saturday
Volume
Time
F. Record the time required to complete and issue Form 1538 (Receipt for Caller Service Fees) to Caller Service customers during the test period.
Sunday Monday Tuesday Wednesday Thursday Friday Saturday
Volume
G. Do you use POS to issue Receipts for Caller Service Fees?
YES NO
Part 4 - WiqdowlPlatform Delivery
This part is for those clerks responsible for delivering caller mail at either a window or platfolm,
,-- Instructions: Use the attached Caller Data Collection Worksheet to record delivery times for each selected caller during the test period. Delivery time includes the time to deliver the caller’s mail from the storage area to the window or platform and to return to the duty area. Please include any clerk or mail handler time spent loading the customer’s vehicle. Transfer the totals into the table below at the end of each day.
Activity
Time to deliver caller mail at the window Time to deliver caller mail at the platform
TOTAL 1
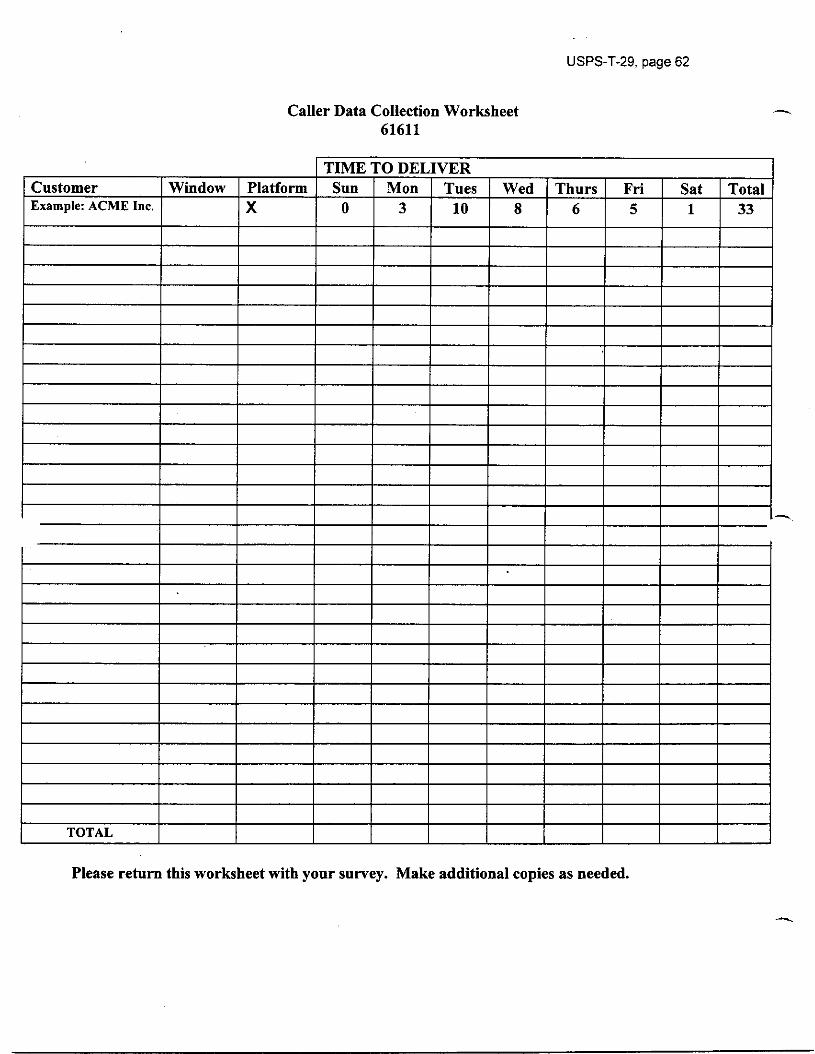
USPS-T-29, page 62
Caller Data Collection Worksheet 61611
TOTAL
Please return this worksheet with your survey. Make additional copies as needed.