usm strategic planning external scan
TRANSCRIPT
huronconsultinggroup.com
USM STRATEGIC PLANNING: EXTERNAL SCANPHASE II: BLUEPRINT THE FUTURE STATE
University System of Maryland
A P R I L 2 2 , 2 0 2 1
HURON I 2
© 2021 Huron Consulting Group Inc. and affiliates.
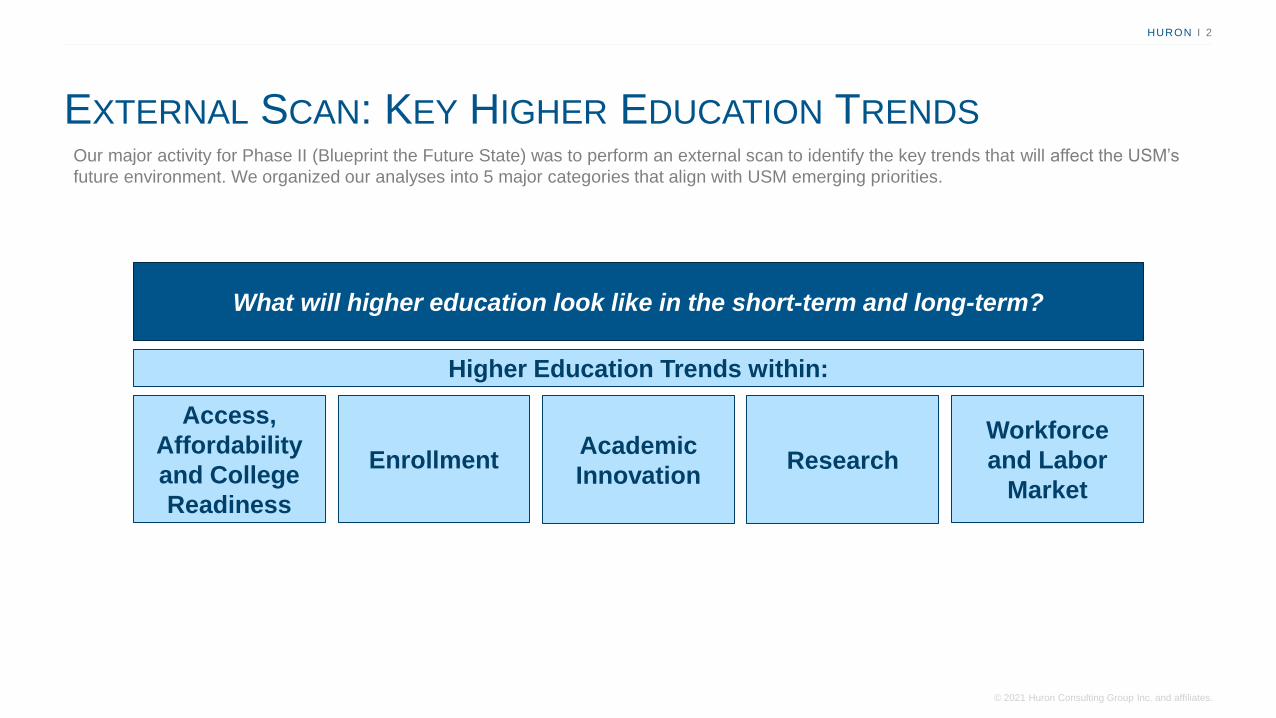
What will higher education look like in the short-term and long-term?
EXTERNAL SCAN: KEY HIGHER EDUCATION TRENDS
Access,
Affordability
and College
Readiness
Workforce
and Labor
Market
Enrollment
Higher Education Trends within:
ResearchAcademic
Innovation
Our major activity for Phase II (Blueprint the Future State) was to perform an external scan to identify the key trends that will affect the USM’s
future environment. We organized our analyses into 5 major categories that align with USM emerging priorities.

HURON I 3
© 2021 Huron Consulting Group Inc. and affiliates.
HURON I 3
© 2021 Huron Consulting Group Inc. and affiliates.
Table of Contents
The following slides contain Huron’s detailed external scan prepared for the
USM. Huron researched and analyzed major trends that will affect the future of
higher education and public university systems. Based on areas of emphasis
discovered in Phase I and feedback from the BOR strategic planning work
group, Huron pursued analysis in a few key areas:
• Section A: Access, Affordability, and College Readiness
• Section B: Enrollment
• Section C: Academic Innovation
• Section D: Research
• Section E: Workforce and Labor Market
• Section F: System Benchmarking Case Studies

HURON I 4
© 2021 Huron Consulting Group Inc. and affiliates.
HURON I 4
© 2021 Huron Consulting Group Inc. and affiliates.
Access, Affordability,
and College
Readiness
Section A:Research Questions:
What are the major trends affecting access and affordability in
higher education?
What trends exist in K-12 education that will likely impact
higher education in the future?
What are the major trends that will impact HBCUs?
How will the theme of diversity and inclusion in higher
education evolve?
What are the key challenges related to partnerships between
community colleges and 4-year institutions?

HURON I 5
© 2021 Huron Consulting Group Inc. and affiliates.
RESEARCH TOPICS
COVID-19 Impact, K-12 Response, and
Higher Ed ImplicationsDiversity & Inclusion
HBCUs Community College Partnerships

HURON I 6
© 2021 Huron Consulting Group Inc. and affiliates.
ACCESS AND AFFORDABILITY
Exasperated by the COVID-19 pandemic, lack of access and affordability in quality higher education has perpetuated inequality for low-income
and minority students.
Sources: 1. Georgetown Center on Education & Workforce 2. Urban Institute 3. Center for American Progress 4. UNCF 5. The Chronicle
The “Degree
Divide”
Minority and low-
income students
continue to fall
behind in regards
to graduation
rates.
Compounding
Crises
COVID-19 has
impacted low-
income students
disproportionately
Workforce
Realities
Over 70% of
future jobs will
require
education
beyond high
school1
Black & Hispanic
students are
14-16%less likely than
Whites to have
a college
degree2
Public institutions
spend an average of
less per student of
color compared to
Whites, and 54% of
young African
Americans carry
student loans 3,4
$1,000
College enrollment
fell by over
26%this fall among
students from
high-minority high
schools 5
Relevance to Emerging Priorities Access and Affordability, Diversity & Inclusion
The most vulnerable students who have the most to gain from a college education are bearing the brunt of the pandemic
effects…[without] intentional ways to support low-income students of color to enroll in and stay in college, we will see these disparities
in college enrollment persist.” – Audrey Dow, SVP (Campaign for College Opportunity)

HURON I 7
© 2021 Huron Consulting Group Inc. and affiliates.
K-12 TRENDS AND IMPACT ON HIGHER EDUCATION
“If you want to glimpse the post-
pandemic future of higher
education, you might want to see
what’s occurring in K-12 schools
today. There you will see a stress
on equity that is likely to shape
college teaching and learning post-
pandemic.”
– “K-12 Trends and the Future of Higher Education,”
Inside Higher Ed
Prioritizing
Equity
Embracing
differentiated
instruction
Skills and
Outcomes
Focus
Life Skills and
Social and
Emotional
Learning
Redesigning
Assessment of
Learning
Addressing Non-academic
Barriers to Student Success
(e.g., food security, Wi-Fi,
quiet places to study)
K-12 trends that will shape higher ed in the short-term and long-
term:
During the pandemic, many K-12 schools across the nation have stressed the theme of equity. Higher education can learn from these emphasis
areas and adapt practices to better support students.
Relevance to Emerging PrioritiesAccess and Affordability, Diversity & Inclusion,
Systemness

HURON I 8
© 2021 Huron Consulting Group Inc. and affiliates.
The Powerful Impact of HBCUs Challenges for HBCUs
HBCUS: IMPACT AND CHALLENGES
Source: US Department of Education; HBCUs Make America Strong, UNCF; The Hechinger Report;
Historically Black Colleges & Universities (HBCUs) can be powerful engines for creating systemic change and opportunity. Despite having a
powerful impact on graduating students, HBCUs face challenges in enrollment, funding, and low graduation rates.
Relevance to Emerging Priorities Access and Affordability, Diversity & Inclusion
Despite HBCU’s only being 3% of four-year colleges in
the U.S., they have graduated:
Although 70% of HBCU
students are low-income and
HBCU endowments are 70%
smaller than non-HBCUs…
of low-income
HBCU
students end
up in the
middle class or
better
80% of black judges of black doctors
of black teachersof black bachelor
degree earners
50%
50% 17%
2/3
Lack of Funding
Endowments of all 101 historically black colleges
total only $3.4 billion, according to the college fund.
That’s less than a single Ivy League school.
Low Graduation Rates
With lower funding levels, HBCUs struggle to
provide necessary financial aid or student support
to critical to student success
Declining Enrollment
Due to COVID-19 the populations typically served
by HBCUs have been impacted disproportionately

HURON I 9
© 2021 Huron Consulting Group Inc. and affiliates.
HBCUS: INVESTMENT IN 2020Over the past year, upwards of $400M has been donated to HBCUs. In addition, MD governor signed legislation in March to settle the USM
Coalition case, which will provide $577M to the four HBCUs in MD.
Relevance to Emerging Priorities Access and Affordability, Diversity & Inclusion
HURON I 10
© 2021 Huron Consulting Group Inc. and affiliates.
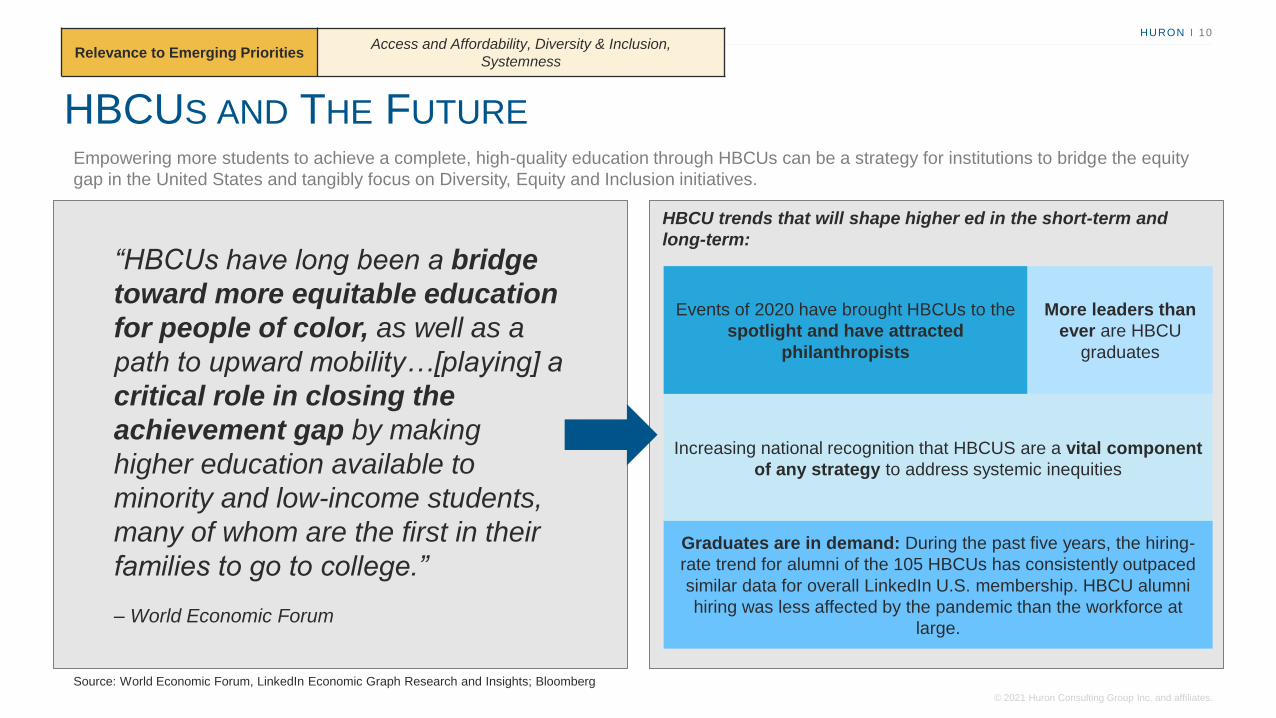
HBCUS AND THE FUTURE
“HBCUs have long been a bridge
toward more equitable education
for people of color, as well as a
path to upward mobility…[playing] a
critical role in closing the
achievement gap by making
higher education available to
minority and low-income students,
many of whom are the first in their
families to go to college.”
– World Economic Forum
HBCU trends that will shape higher ed in the short-term and
long-term:
Empowering more students to achieve a complete, high-quality education through HBCUs can be a strategy for institutions to bridge the equity
gap in the United States and tangibly focus on Diversity, Equity and Inclusion initiatives.
Relevance to Emerging PrioritiesAccess and Affordability, Diversity & Inclusion,
Systemness
Source: World Economic Forum, LinkedIn Economic Graph Research and Insights; Bloomberg
Events of 2020 have brought HBCUs to the
spotlight and have attracted
philanthropists
Increasing national recognition that HBCUS are a vital component
of any strategy to address systemic inequities
More leaders than
ever are HBCU
graduates
Graduates are in demand: During the past five years, the hiring-
rate trend for alumni of the 105 HBCUs has consistently outpaced
similar data for overall LinkedIn U.S. membership. HBCU alumni
hiring was less affected by the pandemic than the workforce at
large.

HURON I 11
© 2021 Huron Consulting Group Inc. and affiliates.
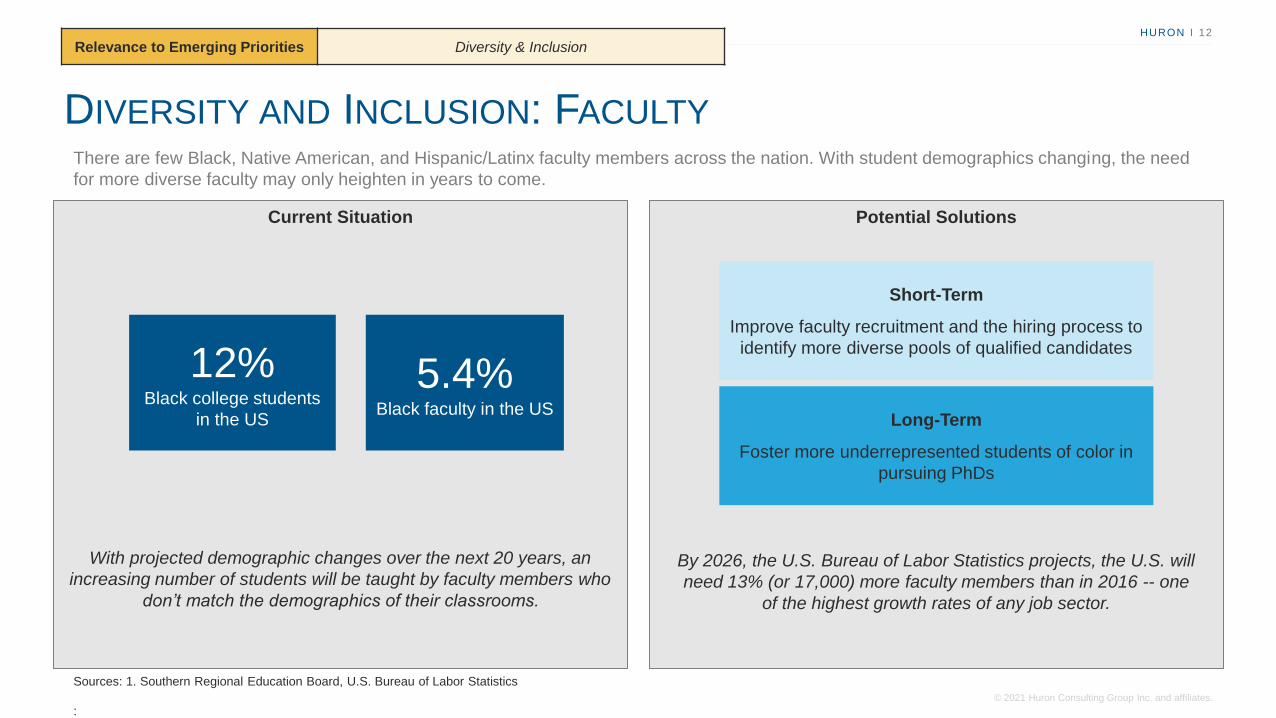
DIVERSITY AND INCLUSION: STUDENTS
While overall high school graduates are expected to decline sharply, the high school population is also projected to become increasingly
diverse.
Sources: 1. Western Interstate Commission for Higher Education (IHE report, December 2020)
:
Relevance to Emerging Priorities Access and Affordability, Diversity & Inclusion
Increasing Student Diversity (WICHE projections, December 2020)1
Over the next 15 years, institutions can expect a sizable increase in the Hispanic college-going
population percentage, a reduction in the white college-going population, and stable trends in
the Black college-going population percentage.
HURON I 12
© 2021 Huron Consulting Group Inc. and affiliates.
With projected demographic changes over the next 20 years, an
increasing number of students will be taught by faculty members who
don’t match the demographics of their classrooms.
DIVERSITY AND INCLUSION: FACULTY
There are few Black, Native American, and Hispanic/Latinx faculty members across the nation. With student demographics changing, the need
for more diverse faculty may only heighten in years to come.
Relevance to Emerging Priorities Diversity & Inclusion
12% Black college students
in the US
5.4% Black faculty in the US
Potential SolutionsCurrent Situation
Long-Term
Foster more underrepresented students of color in
pursuing PhDs
Short-Term
Improve faculty recruitment and the hiring process to
identify more diverse pools of qualified candidates
By 2026, the U.S. Bureau of Labor Statistics projects, the U.S. will
need 13% (or 17,000) more faculty members than in 2016 -- one
of the highest growth rates of any job sector.
Sources: 1. Southern Regional Education Board, U.S. Bureau of Labor Statistics
:

HURON I 13
© 2021 Huron Consulting Group Inc. and affiliates.
COMMUNITY COLLEGE PARTNERSHIPS
While partnerships between community colleges and four-year institutions are prevalent, many partnerships lack student focus that allows
students to seamlessly transfer to four-year institution.
Relevance to Emerging Priorities Community College Partnerships
Salient ExampleCurrent Situation
Key Characteristics
• Single point of entry for admissions, advising, and financial aid.
• Students assigned success coaches who stick with them
through graduation.
• Requirements and corresponding courses are clearly spelled out
on transfer website.
Sources: 1. Federal Government Accountability Office 2. Chronicle
:
The first partnership between community
colleges and four-year institutions was formed in
the state of California, but now are common
throughout the US.
When a community college has a strong partnership
with a four-year college or university, students may
view the community college as a stepping-stone
before transferring.
More than a third of college students transfer at
least once, but 43 percent of the credits they
earn are lost in the process.
In 2018, George Mason University and Northern Virginia
Community College were named one of the “nation’s most
successful partnerships” by the American Association of
Community Colleges
Key Outcomes
• Half of George Mason’s incoming class are community-college
transfers
• Transfer students’ graduation rates are slightly higher than those
who start out at the four-year college.

HURON I 14
© 2021 Huron Consulting Group Inc. and affiliates.
HURON I 14
© 2021 Huron Consulting Group Inc. and affiliates.
Enrollment
Section B: Research Questions:
How will demographic changes across the nation and in
Maryland affect the addressable market of traditional college
students?
What impact might the COVID-19 pandemic have on student
migration patterns?
What are the most recent trends with regard to international
students?
What are non-traditional students’ goals and preferences for
educational offerings?
HURON I 15
© 2021 Huron Consulting Group Inc. and affiliates.
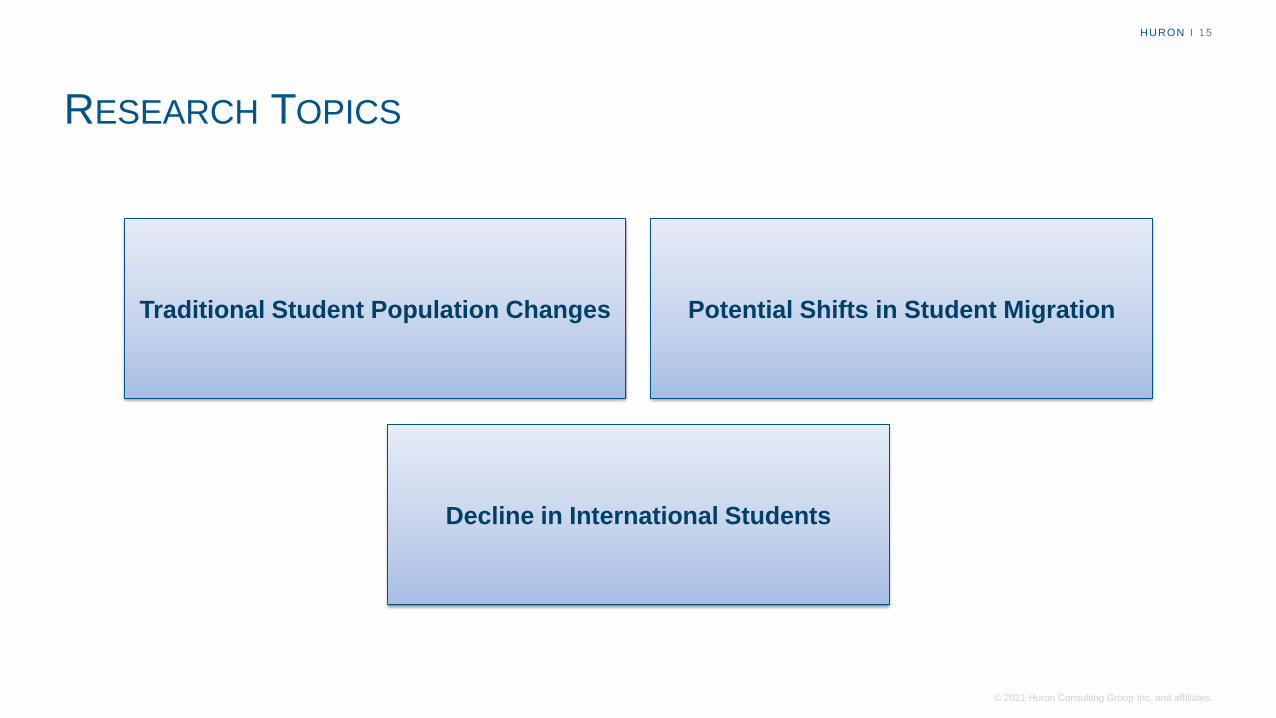
RESEARCH TOPICS
Traditional Student Population Changes Potential Shifts in Student Migration
Decline in International Students

HURON I 16
© 2021 Huron Consulting Group Inc. and affiliates.
THE “DEMOGRAPHIC CLIFF”
Source: Western Interstate Commission for Higher Education, Knocking at the College Door (December 2020)
2021, 107%
2025, 118%
2027, 113%
2028, 115%
2030, 111%
2031, 114%
2035, 110%
90%
95%
100%
105%
110%
115%
120%
Actual and Projected High School Graduates,2015-2035
United States (Actual) United States (Projected) West (Actual) West (Projected) Midwest (Actual) Midwest (Projected)
South (Actual) South (Projected) Northeast (Actual) Northeast (Projected) Maryland (Actual) Maryland (Projected)
Higher education institutions will be challenged by demographic and population trends over the next 10-15 years. The addressable market of
traditional students in the United States is expected to peak in 2025 and eventually fall below 2015 levels by 2035.
Relevance to Emerging Priorities Enrollment Growth
Following a peak in 2025, the number of high school graduates in Maryland is projected to decline from 2025-2035
but will stay above 2015 levels. The USM should be prepared to expand and contract as a result.

HURON I 17
© 2021 Huron Consulting Group Inc. and affiliates.
Historical High School Graduate Migration Trends in Maryland,
2014-2018
UNDERGRADUATE STUDENT MIGRATION
Source: Moody’s Investor Service, “Shifts in student migration would benefit some universities and harm others”; National Center for
Education Statistics, Digest of Education Statistics
The COVID-19 pandemic and students’ and parents’ increased price-sensitivity due to economic uncertainty may affect longstanding
undergraduate student migration patterns and lead students to stay closer to home.
0-10% 10-20% 20-30% 30-40% 40%+
Reliance on Out-of-State Students across the United States
(15,772) (15,769) (15,237) (15,235) (15,154)
7,340 7,347 7,268 7,668 7,839
2014 2015 2016 2017 2018
Residents Leaving Maryland Non-Residents Entering Maryland
Case Study: NJ Come Home Program
In response to the COVID-19 pandemic and concurrent economic
contraction, 10 four-year public New Jersey institutions are
incentivizing residents who are enrolled at out-of-state
institutions to return to New Jersey to finish their degrees by:
• Offering them a streamlined transfer application process.
• Providing them with additional financial aid and scholarship
program opportunities.
Relevance to Emerging Priorities Enrollment Growth
States that rely on a high percentage of out-of-state students
are at an increased risk of reduced enrollment if the COVID-
19 pandemic and economic uncertainty leads students to
decide to stay in or return to their home states.

HURON I 18
© 2021 Huron Consulting Group Inc. and affiliates.
INTERNATIONAL STUDENT MIGRATION
Source: Institute of International Education, Open Doors 2020 Report on International Educational Exchange
Higher education institutions face a variety of risks if international student enrollment continues to decrease, a trend which will likely be
exasperated by the COVID-19 pandemic.
Relevance to Emerging Priorities Enrollment Growth
8.8%
2.4%
-3.3%
-6.6%
-0.9% -0.6%
2014 2015 2016 2017 2018 2019
Year-over-Year % Change in New International
Student Enrollment in the U.S.,
2014-2019
Even before the pandemic, new international student
enrollment at higher education institutions in the
U.S. was on the decline, with attendance falling for
the fourth year in a row in the fall of 2019.
Continued Declines in International Student Enrollment
A variety of factors contribute to continued declines in international
student enrollment, such as:
• Improving educational options at home
• Tougher visa restrictions in the U.S.
• Health concerns due to COVID-19
• The current political environment in the U.S.
Implications of Declines in International Student Enrollment
If international student enrollment continues to decrease, higher
education institutions will be adversely impacted by:
• Declining revenue
• Less social and cultural diversity on campus

HURON I 19
© 2021 Huron Consulting Group Inc. and affiliates.
HURON I 19
© 2021 Huron Consulting Group Inc. and affiliates.
Academic Innovation
Section C:
Research Questions:
How does digital transformation affect teaching and
learning?
How will delivery models evolve to become more flexible?
How is lifelong learning evolving?
HURON I 20
© 2021 Huron Consulting Group Inc. and affiliates.
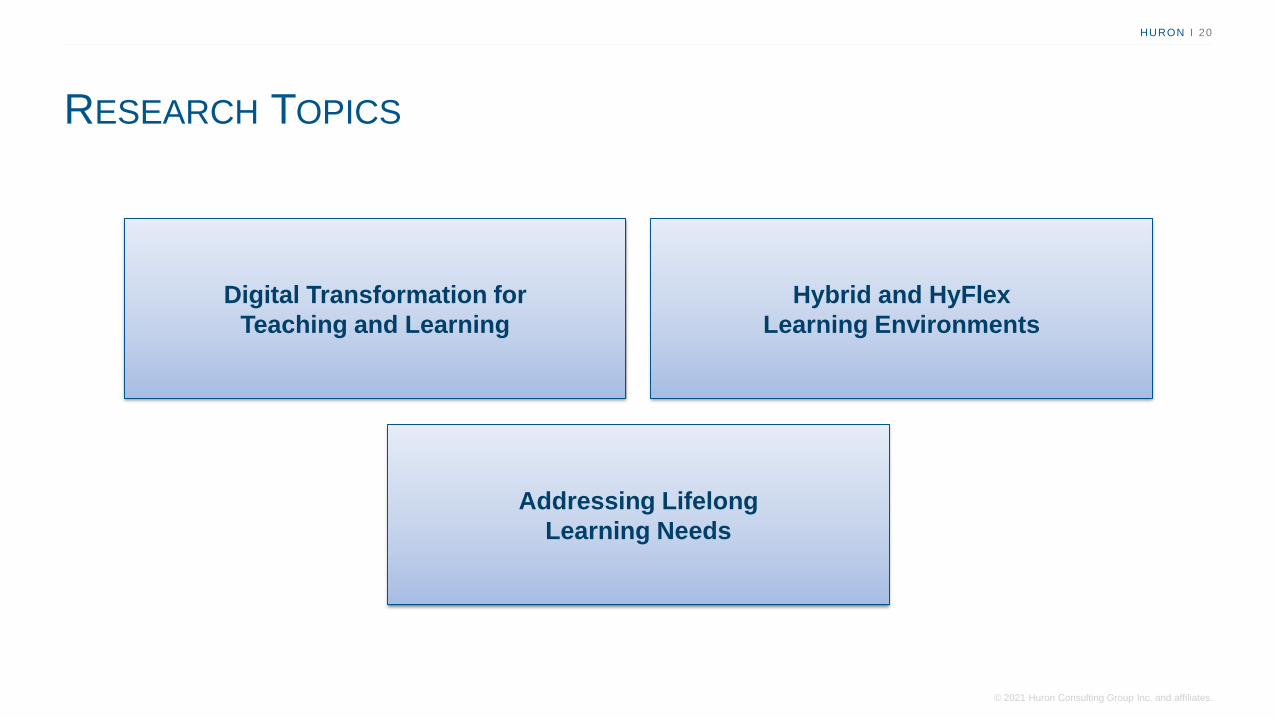
RESEARCH TOPICS
Digital Transformation for
Teaching and Learning
Hybrid and HyFlex
Learning Environments
Addressing Lifelong
Learning Needs
HURON I 21
© 2021 Huron Consulting Group Inc. and affiliates.
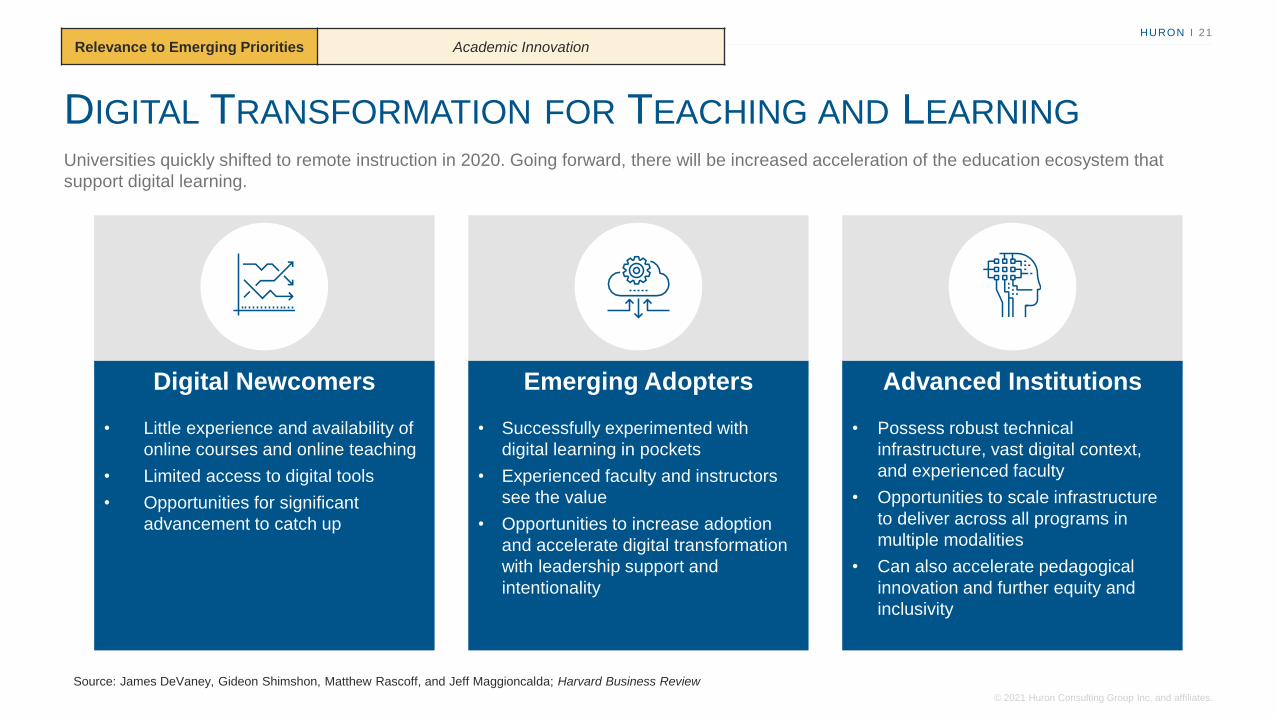
DIGITAL TRANSFORMATION FOR TEACHING AND LEARNING
Universities quickly shifted to remote instruction in 2020. Going forward, there will be increased acceleration of the education ecosystem that
support digital learning.
Emerging Adopters
• Successfully experimented with
digital learning in pockets
• Experienced faculty and instructors
see the value
• Opportunities to increase adoption
and accelerate digital transformation
with leadership support and
intentionality
Digital Newcomers
• Little experience and availability of
online courses and online teaching
• Limited access to digital tools
• Opportunities for significant
advancement to catch up
Advanced Institutions
• Possess robust technical
infrastructure, vast digital context,
and experienced faculty
• Opportunities to scale infrastructure
to deliver across all programs in
multiple modalities
• Can also accelerate pedagogical
innovation and further equity and
inclusivity
Source: James DeVaney, Gideon Shimshon, Matthew Rascoff, and Jeff Maggioncalda; Harvard Business Review
Relevance to Emerging Priorities Academic Innovation

HURON I 22
© 2021 Huron Consulting Group Inc. and affiliates.
EXAMPLE: DATA SCIENCE AND WORKFORCE DEVELOPMENT
Ohio State has applied digital transformation to teaching, learning and workforce development.
Ohio State’s Strategic Priorities
• Real-World Applications: Create unique, interdisciplinary spaces for OSU stakeholders and partners to collaborate on technology
solutions that address global problems
• Workforce Development: Offer opportunities for students and community members to network, share and access tools and
resources, and enhance their career-readiness in technology-driven fields
• Blended Learning: Provide an immersive and engaging collection of shared tools, platforms, and learning experiences for every
incoming freshman
Translational Data Analytics Institute (TDAI)
• Started as an initiative bringing together students, faculty, and
community partners
• Expanded to an institute offering an innovative professional
master’s degree and providing event space and cross-
disciplinary learning opportunities
President’s Digital Flagship Objectives
• Modernize the Student Experience
• Resolve Access Disparities
• Provide Exceptional Workforce Preparation
Source: The Ohio State University
Relevance to Emerging Priorities Academic Innovation; Workforce Development
HURON I 23
© 2021 Huron Consulting Group Inc. and affiliates.
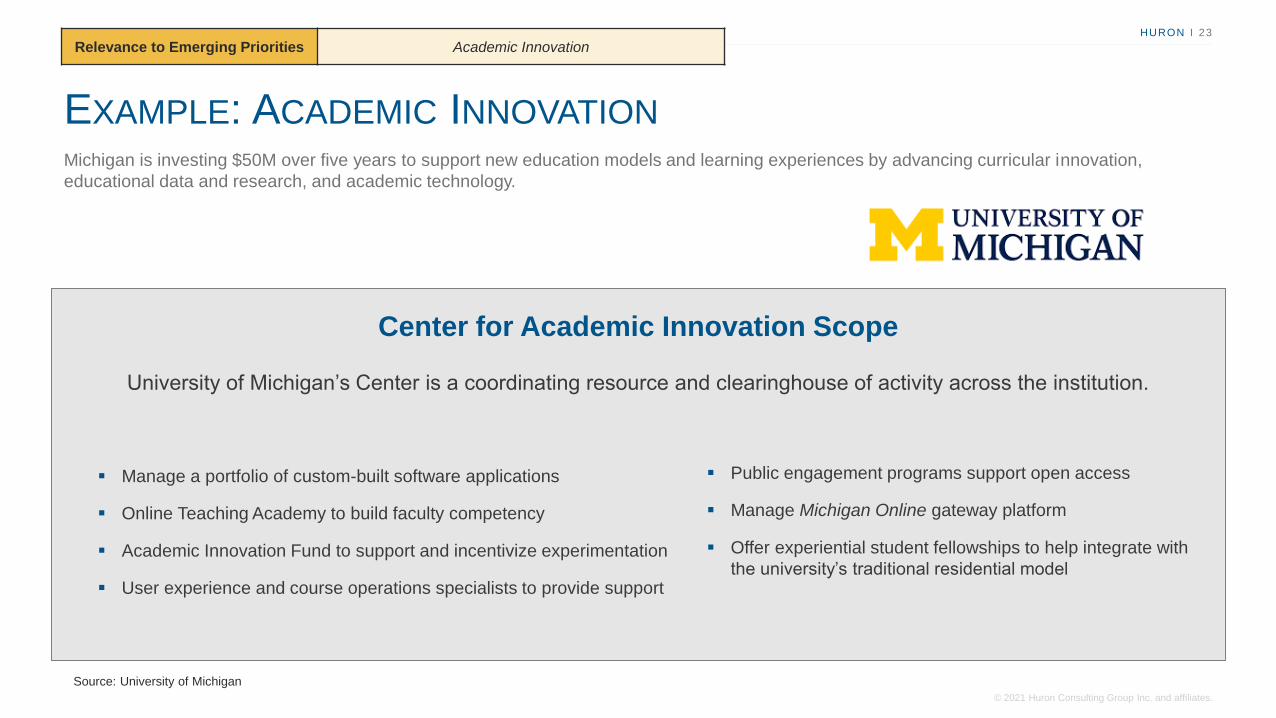
EXAMPLE: ACADEMIC INNOVATION
Michigan is investing $50M over five years to support new education models and learning experiences by advancing curricular innovation,
educational data and research, and academic technology.
Center for Academic Innovation Scope
University of Michigan’s Center is a coordinating resource and clearinghouse of activity across the institution.
▪ Manage a portfolio of custom-built software applications
▪ Online Teaching Academy to build faculty competency
▪ Academic Innovation Fund to support and incentivize experimentation
▪ User experience and course operations specialists to provide support
Source: University of Michigan
▪ Public engagement programs support open access
▪ Manage Michigan Online gateway platform
▪ Offer experiential student fellowships to help integrate with
the university’s traditional residential model
Relevance to Emerging Priorities Academic Innovation

HURON I 24
© 2021 Huron Consulting Group Inc. and affiliates.
HYBRID AND HYFLEX LEARNING MODELS
Definitions
• A hybrid approach to course delivery combines face-to-face classroom instruction with online activities
• HyFlex (or hybrid-flexible) calls for courses to be created in a way that gives students complete control over how and when to
participate, either in-person or online.
Preparation for the Fall term at the onset of the pandemic also reignited the dialogue about hybrid and hyflex delivery.
Principles for HyFlex Course Design
• Learner Choice: Provide meaningful alternative participation modes and enable students to choose between participation
modes daily, weekly, or topically.
• Equivalency: Provide learning activities in all participation modes which lead to equivalent learning outcomes.
• Reusability: Utilize artifacts from learning activities in each participation mode as “learning objects” for all students
• Accessibility: Equip students with technology skills and equitable access to all participation modes.
Source: The Chronicle of Higher Education; Beatty, B. J. (2019). Hybrid-Flexible Course Design (1st ed.). EdTech Books..
Relevance to Emerging Priorities Academic Innovation
HURON I 25
© 2021 Huron Consulting Group Inc. and affiliates.
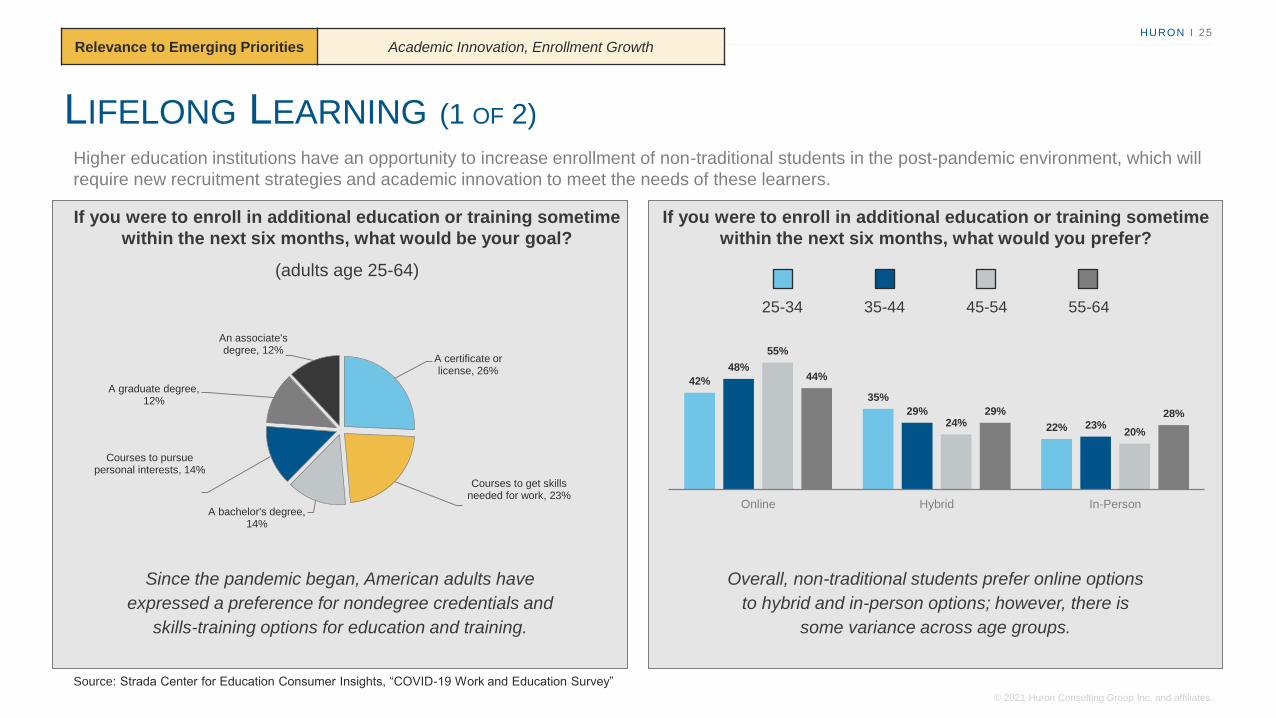
LIFELONG LEARNING (1 OF 2)
Source: Strada Center for Education Consumer Insights, “COVID-19 Work and Education Survey”
Higher education institutions have an opportunity to increase enrollment of non-traditional students in the post-pandemic environment, which will
require new recruitment strategies and academic innovation to meet the needs of these learners.
Relevance to Emerging Priorities Academic Innovation, Enrollment Growth
A certificate or license, 26%
Courses to get skills needed for work, 23%
A bachelor's degree, 14%
Courses to pursue personal interests, 14%
A graduate degree, 12%
An associate's degree, 12%
If you were to enroll in additional education or training sometime
within the next six months, what would be your goal?
(adults age 25-64)
Since the pandemic began, American adults have
expressed a preference for nondegree credentials and
skills-training options for education and training.
42%
35%
22%
48%
29%
23%
55%
24%20%
44%
29% 28%
Online Hybrid In-Person
If you were to enroll in additional education or training sometime
within the next six months, what would you prefer?
Overall, non-traditional students prefer online options
to hybrid and in-person options; however, there is
some variance across age groups.
25-34 35-44 45-54 55-64
HURON I 26
© 2021 Huron Consulting Group Inc. and affiliates.
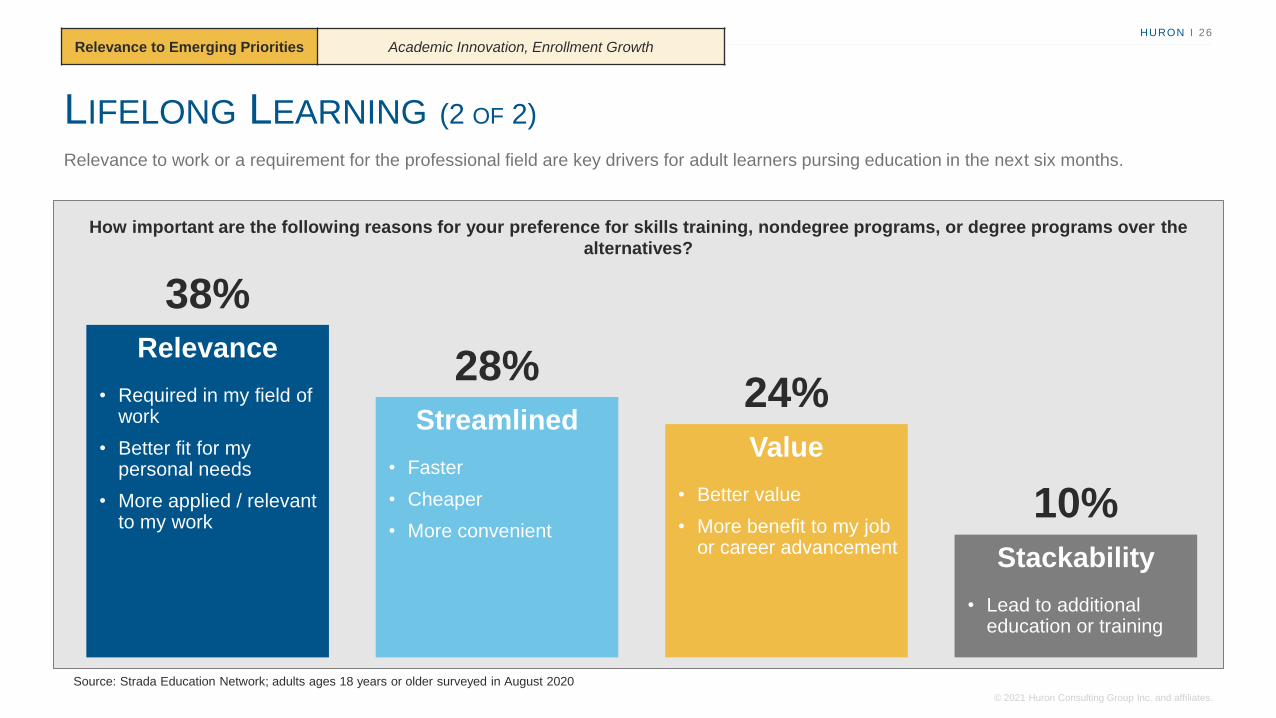
LIFELONG LEARNING (2 OF 2)
How important are the following reasons for your preference for skills training, nondegree programs, or degree programs over the
alternatives?
Relevance
• Required in my field of work
• Better fit for my personal needs
• More applied / relevant to my work
Streamlined
• Faster
• Cheaper
• More convenient
Value
• Better value
• More benefit to my job or career advancement Stackability
• Lead to additional education or training
38%
28%24%
10%
Source: Strada Education Network; adults ages 18 years or older surveyed in August 2020
Relevance to work or a requirement for the professional field are key drivers for adult learners pursing education in the next six months.
Relevance to Emerging Priorities Academic Innovation, Enrollment Growth

HURON I 27
© 2021 Huron Consulting Group Inc. and affiliates.
HURON I 27
© 2021 Huron Consulting Group Inc. and affiliates.
Research
Section D:
Research Questions:
How will research in higher education (e.g., funding sources,
priority research areas, focus on interdisciplinary) evolve in
the future?

HURON I 28
© 2021 Huron Consulting Group Inc. and affiliates.
RESEARCH TOPICS
Funding Trends Trending Research Disciplines

HURON I 29
© 2021 Huron Consulting Group Inc. and affiliates.
R&D OVERVIEW
Source: National Center for Science and Engineering Statistics, National Science Foundation, National Patterns of R&D Resources
The United States remains the world’s top R&D performer, and total of R&D has expanded steadily since 2010, due particularly to sizable
annual increases in business R&D performance. If these trends continue, R&D expenditures could reach $797 billion in 2025.
Actual and Projected R&D Expenditures by Type in the U.S.,
2012-2025 (Current $, in billions)*
$0
$200
$400
$600
$800
$1,000
2012 2013 2014 2015 2016 2017 2018 2019 2020 2021 2022 2023 2024 2025
Basic Research
(Actual)
Applied Research
(Actual)
Development
(Actual)
Basic Research
(Projected)
Applied Research
(Projected)
Development
(Projected)
Relevance to Emerging Priorities Research
* Note: Projections are based on the CAGR from 2012-2017
Definitions:
• In basic research the objective of the sponsoring agency is to gain more complete knowledge or understanding of the fundamental aspects
of phenomena and of observable facts, without specific applications toward processes or products in mind.
• In applied research the objective of the sponsoring agency is to gain knowledge or understanding necessary for determining the means by
which a recognized need may be met.
• Development is systematic use of the knowledge or understanding gained from research, directed toward the production of useful materials,
devices, systems, or methods, including design and development of prototypes, and processes.

HURON I 30
© 2021 Huron Consulting Group Inc. and affiliates.
A Snapshot of U.S. R&D Funding and Performance in 2017 Key Trends in Development
• Higher education has increased investment in technology transfer
offices and incubators for start-ups on campus.
• Health-related industries and the digital economy have an outsized
impact on innovation rates across the economy.
R&D PERFORMANCE, FUNDING, AND TRENDS
Source: National Center for Science and Engineering Statistics, National Science Foundation, National Patterns of R&D Resources
In 2017, the business sector led the U.S. in the funding and performance of development and applied research, while nearly half of U.S. basic
research was performed by higher education institutions (48%) and funded by the federal government (42%).
0% 10% 20% 30% 40% 50% 60% 70% 80% 90% 100%
Basic Research - Performance
Basic Research - Funding
Applied Research - Performance
Applied Research - Funding
Development - Performance
Development - Funding
Business Federal Government Higher Education Other Nonprofits
Relevance to Emerging Priorities Research
Key Trends in Applied Research
• Applied research as a percentage of overall R&D is growing within
higher education, which is a trend that is expected to continue.
• Higher education is increasingly seeking corporate sponsorship of
applied research projects.
Key Trends in Basic Research
• Between 2000 and 2017, the overall share of basic research
funded by the business sector increased from 19% to 29%.
• Basic research is becoming increasingly interdisciplinary.
HURON I 31
© 2021 Huron Consulting Group Inc. and affiliates.
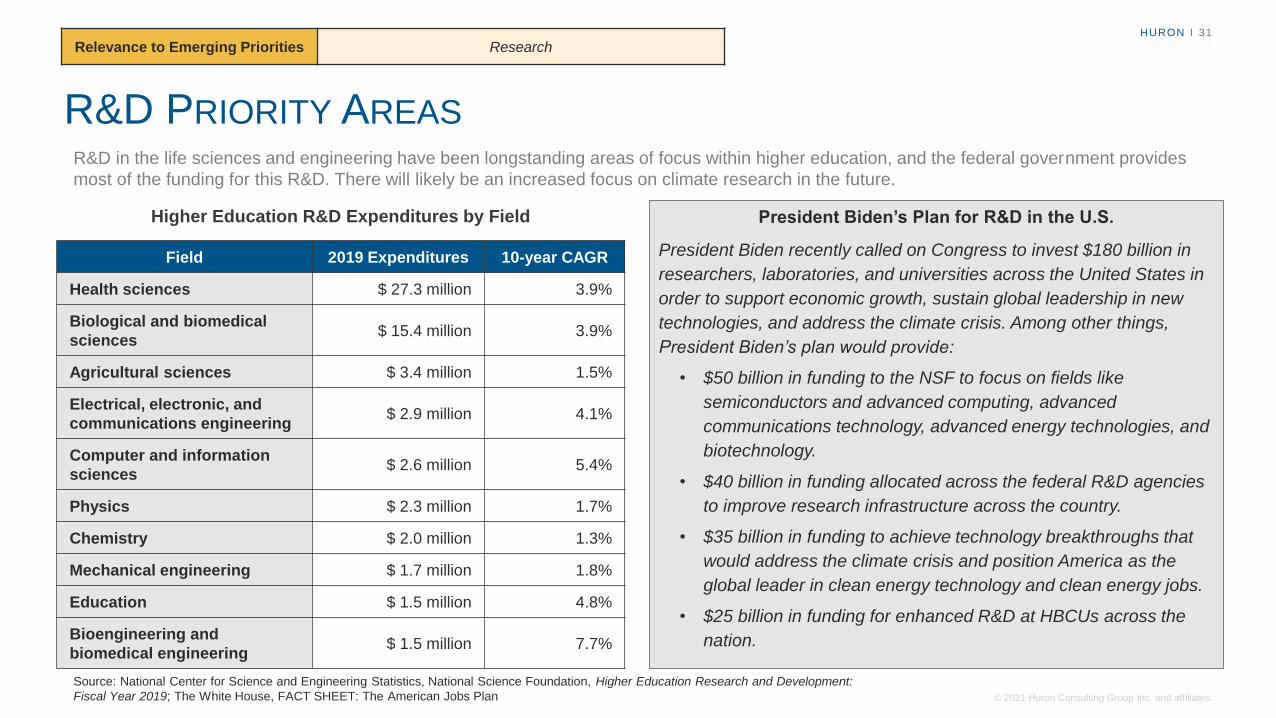
R&D PRIORITY AREAS
Source: National Center for Science and Engineering Statistics, National Science Foundation, Higher Education Research and Development:
Fiscal Year 2019; The White House, FACT SHEET: The American Jobs Plan
R&D in the life sciences and engineering have been longstanding areas of focus within higher education, and the federal government provides
most of the funding for this R&D. There will likely be an increased focus on climate research in the future.
President Biden’s Plan for R&D in the U.S.
President Biden recently called on Congress to invest $180 billion in
researchers, laboratories, and universities across the United States in
order to support economic growth, sustain global leadership in new
technologies, and address the climate crisis. Among other things,
President Biden’s plan would provide:
• $50 billion in funding to the NSF to focus on fields like
semiconductors and advanced computing, advanced
communications technology, advanced energy technologies, and
biotechnology.
• $40 billion in funding allocated across the federal R&D agencies
to improve research infrastructure across the country.
• $35 billion in funding to achieve technology breakthroughs that
would address the climate crisis and position America as the
global leader in clean energy technology and clean energy jobs.
• $25 billion in funding for enhanced R&D at HBCUs across the
nation.
Relevance to Emerging Priorities Research
Field 2019 Expenditures 10-year CAGR
Health sciences $ 27.3 million 3.9%
Biological and biomedical
sciences$ 15.4 million 3.9%
Agricultural sciences $ 3.4 million 1.5%
Electrical, electronic, and
communications engineering$ 2.9 million 4.1%
Computer and information
sciences$ 2.6 million 5.4%
Physics $ 2.3 million 1.7%
Chemistry $ 2.0 million 1.3%
Mechanical engineering $ 1.7 million 1.8%
Education $ 1.5 million 4.8%
Bioengineering and
biomedical engineering$ 1.5 million 7.7%
Higher Education R&D Expenditures by Field

HURON I 32
© 2021 Huron Consulting Group Inc. and affiliates.
HURON I 32
© 2021 Huron Consulting Group Inc. and affiliates.
Workforce and Labor
Market
Section E: Research Questions:
What broad workforce trends have been accelerated by the
COVID-19 pandemic?
What sectors and jobs are demonstrating high / low / no
growth in Maryland, the Mid-Atlantic region, and the United
States?
What is the projected need for postsecondary credentials that
fall outside of traditional degree-based structures?
How can systems leverage corporate partnerships to prepare
students for work?
HURON I 33
© 2021 Huron Consulting Group Inc. and affiliates.
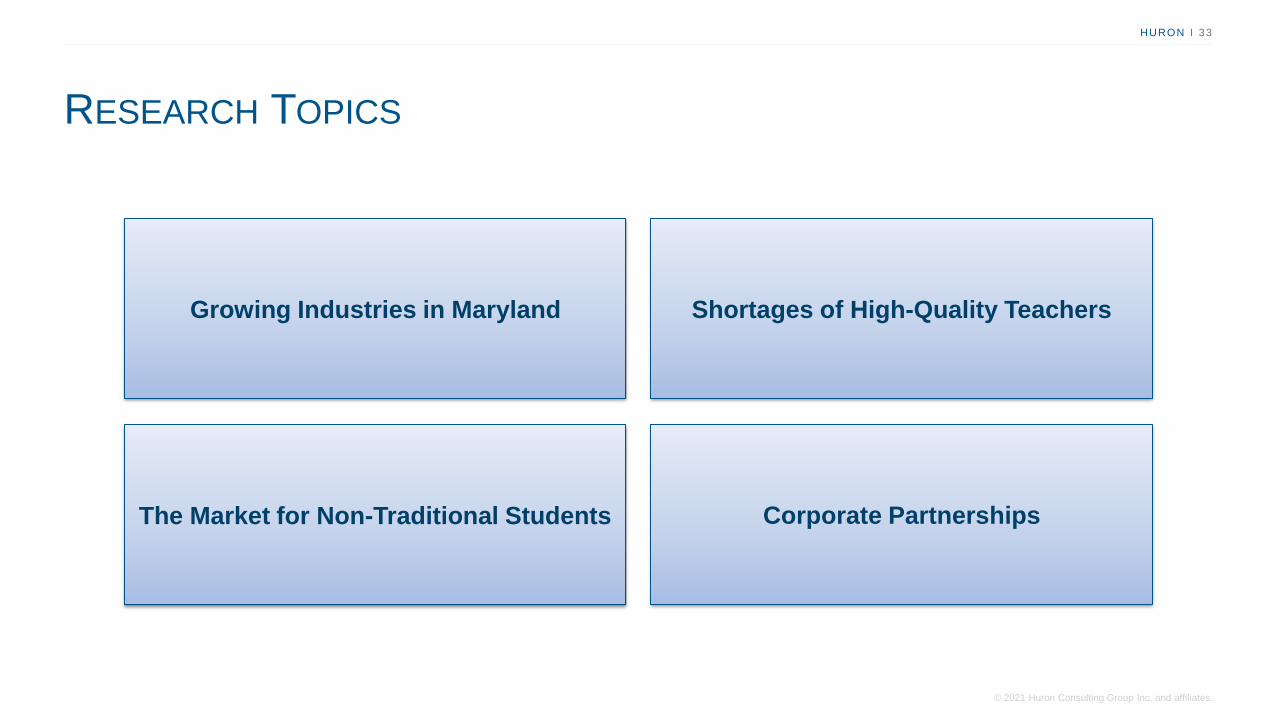
RESEARCH TOPICS
Growing Industries in Maryland Shortages of High-Quality Teachers
The Market for Non-Traditional Students Corporate Partnerships

HURON I 34
© 2021 Huron Consulting Group Inc. and affiliates.
COVID-19: BROAD WORKFORCE TRENDS
COVID-19 has accelerated three trends that will continue to reshape the nature of work after the pandemic. The extent to which these trends
will affect specific jobs depends in part on the physical proximity and frequency of interaction that the job requires.
New users have adopted
digital technology in areas
like e-commerce and
telemedicine. This has
propelled growth in
delivery, transportation, and
warehouse jobs, while
causing declines among in-
store retail jobs.
DIGITALIZATION
In the wake of COVID-19,
companies may increase
investment in automation
and AI to control their cost
base and improve
efficiency. Jobs requiring
high physical proximity and
frequency of interaction are
at an increased risk of
disruption.
AUTOMATION
The sudden shift to remote
work has led companies to
reconsider work models
and balance flexibility with
greater effectiveness of
in-person work. Jobs in
computer-based offices are
most likely to adopt
remote/hybrid models.
REMOTE / HYBRID WORK
Source: MGI, “The Future of Work after COVID-19”
Relevance to Emerging Priorities Workforce Development, Academic Innovation

HURON I 35
© 2021 Huron Consulting Group Inc. and affiliates.
INDUSTRY TRENDS IN THE UNITED STATES (1 OF 2)
Overall employment is projected to grow 2.9% in the United States between 2021-2025 and 6.0% between 2021-2031. The fastest growing
industries are: (1) Health Care and Social Assistance, (2) Professional, Scientific, and Technical Services, (3) Education Services,
(4) Transportation and Warehousing, and (5) Arts, Entertainment, and Recreation..
Relevance to Emerging Priorities Workforce Development, Academic Innovation
Industry 2021 Jobs 2025 Jobs ’21-’25 Change 2031 Jobs ’21-’31 Change
Government 24,690,143 24,992,243 1.2% 25,347,956 2.7%
Health Care and Social Assistance 20,747,728 22,247,130 7.2% 23,952,207 15.4%
Retail Trade 15,165,830 15,144,172 -0.1% 15,203,045 0.2%
Accommodation and Food Services 12,839,720 13,206,559 2.9% 13,801,730 7.5%
Manufacturing 12,564,160 12,617,690 0.4% 12,461,153 -0.8%
Professional, Scientific, and Technical
Services9,856,351 10,458,629 6.1% 11,057,442 12.2%
Administrative and Support and Waste
Management and Remediation Services9,098,077 9,350,804 2.8% 9,616,267 5.7%
Construction 7,657,454 7,908,709 3.3% 8,094,089 5.7%
Other Services (Except Public
Administration)7,027,065 7,212,668 2.6% 7,453,016 6.1%
Finance and Insurance 6,561,658 6,707,733 2.2% 6,785,108 3.4%
Source: EMSI (Note: Industries are in descending order of # of 2021 jobs; shading indicates above average growth relative to overall employment growth
in the U.S. [green] or decline [red].)

HURON I 36
© 2021 Huron Consulting Group Inc. and affiliates.
INDUSTRY TRENDS IN THE UNITED STATES (2 OF 2)
Overall employment is projected to grow 2.9% in the United States between 2021-2025 and 6.0% between 2021-2031. The fastest growing
industries are: (1) Health Care and Social Assistance, (2) Professional, Scientific, and Technical Services, (3) Education Services,
(4) Transportation and Warehousing, and (5) Arts, Entertainment, and Recreation..
Relevance to Emerging Priorities Workforce Development, Academic Innovation
Industry 2021 Jobs 2025 Jobs ’21-’25 Change 2031 Jobs ’21-’31 Change
Transportation and Warehousing 5,942,246 6,235,202 4.9% 6,407,848 7.8%
Wholesale Trade 5,827,390 5,860,051 0.6% 5,863,228 0.6%
Educational Services 3,922,702 4,157,724 6.0% 4,432,542 13.0%
Information 2,834,837 2,875,886 1.4% 2,915,806 2.9%
Management of Companies and
Enterprises2,416,605 2,507,072 3.7% 2,576,886 6.6%
Real Estate and Rental and Leasing 2,349,529 2,391,381 1.8% 2,394,330 1.9%
Arts, Entertainment, and Recreation 2,201,719 2,294,352 4.2% 2,432,089 10.5%
Agriculture, Forestry, Fishing, and
Hunting1,503,870 1,542,166 2.5% 1,581,374 5.2%
Mining, Quarrying, and Oil and Gas
Extraction632,036 664,145 5.1% 715,977 13.3%
Utilities 550,249 547,051 -0.6% 529,702 -3.7%
Source: EMSI (Note: Industries are in descending order of # of 2021 jobs; shading indicates above average growth relative to overall employment growth
in the U.S. [green] or decline [red].)
HURON I 37
© 2021 Huron Consulting Group Inc. and affiliates.
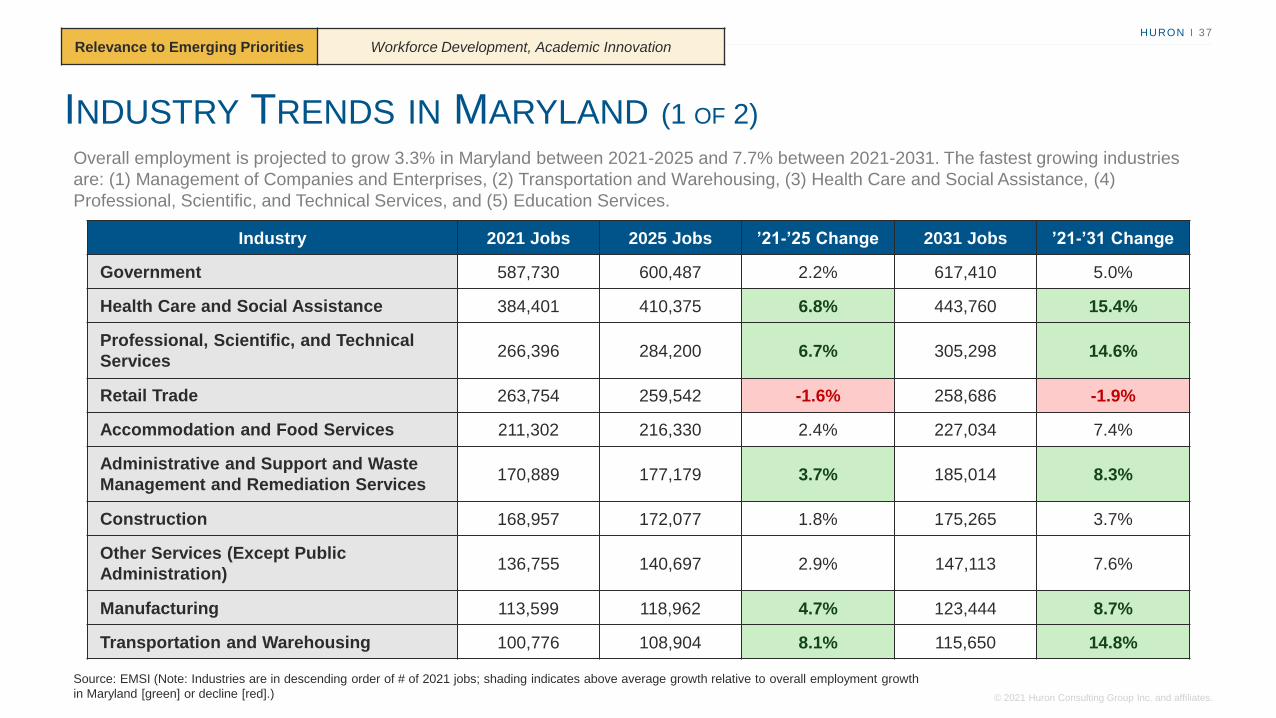
INDUSTRY TRENDS IN MARYLAND (1 OF 2)
Overall employment is projected to grow 3.3% in Maryland between 2021-2025 and 7.7% between 2021-2031. The fastest growing industries
are: (1) Management of Companies and Enterprises, (2) Transportation and Warehousing, (3) Health Care and Social Assistance, (4)
Professional, Scientific, and Technical Services, and (5) Education Services.
Relevance to Emerging Priorities Workforce Development, Academic Innovation
Industry 2021 Jobs 2025 Jobs ’21-’25 Change 2031 Jobs ’21-’31 Change
Government 587,730 600,487 2.2% 617,410 5.0%
Health Care and Social Assistance 384,401 410,375 6.8% 443,760 15.4%
Professional, Scientific, and Technical
Services266,396 284,200 6.7% 305,298 14.6%
Retail Trade 263,754 259,542 -1.6% 258,686 -1.9%
Accommodation and Food Services 211,302 216,330 2.4% 227,034 7.4%
Administrative and Support and Waste
Management and Remediation Services170,889 177,179 3.7% 185,014 8.3%
Construction 168,957 172,077 1.8% 175,265 3.7%
Other Services (Except Public
Administration)136,755 140,697 2.9% 147,113 7.6%
Manufacturing 113,599 118,962 4.7% 123,444 8.7%
Transportation and Warehousing 100,776 108,904 8.1% 115,650 14.8%
Source: EMSI (Note: Industries are in descending order of # of 2021 jobs; shading indicates above average growth relative to overall employment growth
in Maryland [green] or decline [red].)

HURON I 38
© 2021 Huron Consulting Group Inc. and affiliates.
INDUSTRY TRENDS IN MARYLAND (2 OF 2)
Overall employment is projected to grow 3.3% in Maryland between 2021-2025 and 7.7% between 2021-2031. The fastest growing industries
are: (1) Management of Companies and Enterprises, (2) Transportation and Warehousing, (3) Health Care and Social Assistance, (4)
Professional, Scientific, and Technical Services, and (5) Education Services.
Relevance to Emerging Priorities Workforce Development, Academic Innovation
Industry 2021 Jobs 2025 Jobs ’21-’25 Change 2031 Jobs ’21-’31 Change
Finance and Insurance 95,579 96,429 0.9% 97,694 2.2%
Educational Services 88,361 93,463 5.8% 100,418 13.6%
Wholesale Trade 85,460 87,066 1.9% 89,241 4.4%
Real Estate and Rental and Leasing 46,326 46,471 0.3% 46,301 -0.1%
Arts, Entertainment, and Recreation 38,489 38,865 1.0% 40,381 4.9%
Information 34,401 33,597 -2.3% 33,312 -3.2%
Management of Companies and
Enterprises28,607 30,942 8.2% 33,372 16.7%
Utilities 9,789 9,779 -0.1% 9,533 -2.6%
Agriculture, Forestry, Fishing, and
Hunting8,571 9,056 5.7% 9,748 13.7%
Mining, Quarrying, and Oil and Gas
Extraction1,195 1,345 12.5% 1,519 27.1%
Source: EMSI (Note: Industries are in descending order of # of 2021 jobs; shading indicates above average growth relative to overall employment growth
in Maryland [green] or decline [red].)

HURON I 39
© 2021 Huron Consulting Group Inc. and affiliates.
HIGH-GROWTH INDUSTRIES: REGIONAL SPECIALIZATION
Maryland, Virginia, and Washington D.C. have above average per capita employment in Professional, Scientific, and Technical Services,
Government (not pictured), and Education Services. Neighboring states have above average per capita employment Health Care and Social
Assistance and Education Services.
Relevance to Emerging Priorities Workforce Development, Academic Innovation
Management of
Companies and
Enterprises
Transportation and
Warehousing
Education Services
Professional,
Scientific, and
Technical Services
Health Care and
Social Assistance
Source: EMSI

HURON I 40
© 2021 Huron Consulting Group Inc. and affiliates.
* Note: Occupations requiring a Bachelor’s degree and < 5 years of experience
5 Largest Occupations in Maryland,
# of Jobs Projected in 2025*
OCCUPATIONS IN MARYLAND: BACHELOR’S DEGREES
10 Fastest Growing Occupations in Maryland,
% Employment Change Projected from 2021 – 2025*
Source: EMSI; O*NET Online
59,581
36,852 34,99528,701 28,377
Registered Nurses Software Developersand Quality
Assurance Analysts
Project Managementand BusinessOperationsSpecialists
Elementary SchoolTeachers
Accountants andAuditors
Overall, employment is projected to grow 4.7% from 2021-2025 for occupations requiring a Bachelor’s degree and less than five years of
experience in Maryland. Software Developers and Quality Assurance Analysts make up one of the largest and fastest growing occupations.
8.2%
9.1%
9.5%
9.9%
10.0%
11.5%
11.7%
12.0%
12.5%
13.0%
Film and Video Editors
Operations Research Analysts
Fundraisers
Market Research Analysts and Marketing Specialists
Industrial Engineers
Medical and Health Services Managers
Information Security Analysts
Software Developers and Quality Assurance Analysts
Data Scientists and Mathematical Science Occupations,All Other
Substance Abuse, Behavioral Disorder, and MentalHealth Counselors
* Note: Occupations requiring a Bachelor’s degree and < 5 years of experience
Occupation Relevant Skills
Registered Nurses Active Listening, Social Perceptiveness
Software Developers and... Critical Thinking, Programming
Project Management and... Decision Making, Systems Thinking
Elementary School Teachers Instructing, Speaking, Learning Strategies
Accountants and Auditors Active Listening, Reading Comprehension
Relevance to Emerging Priorities Workforce Development, Academic Innovation
HURON I 41
© 2021 Huron Consulting Group Inc. and affiliates.
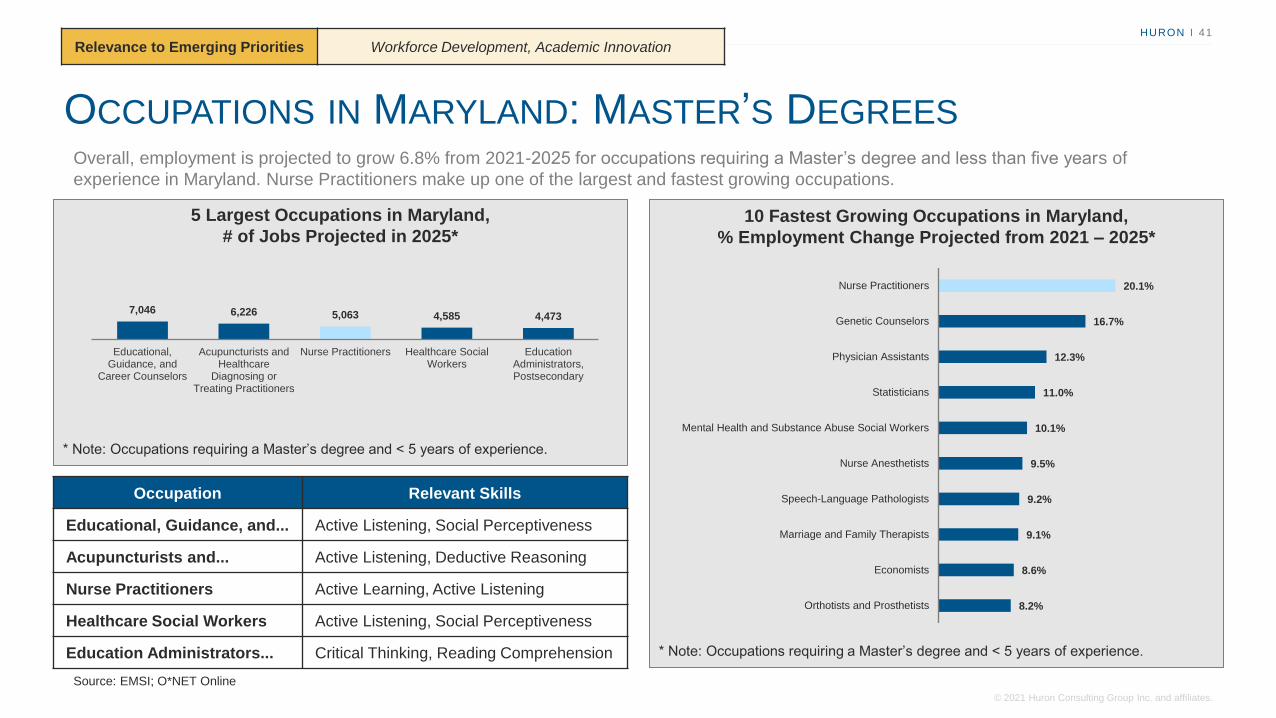
* Note: Occupations requiring a Master’s degree and < 5 years of experience.
5 Largest Occupations in Maryland,
# of Jobs Projected in 2025*
OCCUPATIONS IN MARYLAND: MASTER’S DEGREES
10 Fastest Growing Occupations in Maryland,
% Employment Change Projected from 2021 – 2025*
Overall, employment is projected to grow 6.8% from 2021-2025 for occupations requiring a Master’s degree and less than five years of
experience in Maryland. Nurse Practitioners make up one of the largest and fastest growing occupations.
8.2%
8.6%
9.1%
9.2%
9.5%
10.1%
11.0%
12.3%
16.7%
20.1%
Orthotists and Prosthetists
Economists
Marriage and Family Therapists
Speech-Language Pathologists
Nurse Anesthetists
Mental Health and Substance Abuse Social Workers
Statisticians
Physician Assistants
Genetic Counselors
Nurse Practitioners
* Note: Occupations requiring a Master’s degree and < 5 years of experience.
7,046 6,226 5,063 4,585 4,473
Educational,Guidance, and
Career Counselors
Acupuncturists andHealthcare
Diagnosing orTreating Practitioners
Nurse Practitioners Healthcare SocialWorkers
EducationAdministrators,Postsecondary
Occupation Relevant Skills
Educational, Guidance, and... Active Listening, Social Perceptiveness
Acupuncturists and... Active Listening, Deductive Reasoning
Nurse Practitioners Active Learning, Active Listening
Healthcare Social Workers Active Listening, Social Perceptiveness
Education Administrators... Critical Thinking, Reading Comprehension
Source: EMSI; O*NET Online
Relevance to Emerging Priorities Workforce Development, Academic Innovation

HURON I 42
© 2021 Huron Consulting Group Inc. and affiliates.
* Note: Occupations requiring a postsecondary non-degree award.
5 Largest Occupations in Maryland,
# of Jobs Projected in 2025*
OCCUPATIONS IN MARYLAND: POSTSECONDARY NON-DEGREES
10 Fastest Growing Occupations in Maryland,
% Employment Change Projected from 2021 – 2025*
Overall, employment is projected to grow 3.5% from 2021-2025 for occupations requiring a postsecondary non-degree award in Maryland.
Medical Assistants make up one of the largest and fastest growing occupations.
6.4%
6.4%
6.5%
6.9%
7.3%
9.2%
10.0%
10.0%
13.6%
15.5%
Ophthalmic Medical Technicians
Licensed Practical and Licensed Vocational Nurses
Tool and Die Makers
Captains, Mates, and Pilots of Water Vessels
Ship Engineers
Medical Assistants
Phlebotomists
Psychiatric Technicians
Computer Numerically Controlled Tool Programmers
Wind Turbine Service Technicians
* Note: Occupations requiring a postsecondary non-degree award.
30,994 28,889
15,152 13,471 11,489
Nursing Assistants Heavy and Tractor-Trailer Truck Drivers
Medical Assistants Automotive ServiceTechnicians and
Mechanics
Hairdressers,Hairstylists, andCosmetologists
Occupation Relevant Skills
Nursing Assistants Service Orientation, Active Listening
Heavy and Tractor-Trailer... Operation Monitoring, Time Management
Medical Assistants Speaking, Active Listening
Automotive Service Tech... Repairing, Troubleshooting
Hairdressers, Hairstylists... Active Listening, Service Orientation
Source: EMSI; O*NET Online
Relevance to Emerging Priorities Workforce Development, Academic Innovation

HURON I 43
© 2021 Huron Consulting Group Inc. and affiliates.
CORPORATE PARTNERS & WORKFORCE DEVELOPMENT
The USM has an opportunity to distinguish itself from other public systems of higher education by forging and maintaining corporate
partnerships at the system level. These partnerships could take a variety of different forms, which are outlined below.
ADVISORY BOARDS
Establish corporate advisory boards to
understand workforce needs and inform
decisions about curricular and pedagogical
innovation.
TIERED PARTNERSHIP PROGRAMS
Offer partnership programs with differential
pricing and benefits for various tiers of
membership.
CENTRAL RECRUITMENT PLATFORM
Support a central recruitment platform that
all students in the System can leverage to
connect with employers, apply for
internships, and to locate experiential
learning opportunities.
CUSTOM PROGRAMS
Provide employers with the opportunity to
invest in their employees’ professional
development with customized programs.
CORPORATE
PARTNERS
Relevance to Emerging Priorities Workforce Development, Anchor Institutions

HURON I 44
© 2021 Huron Consulting Group Inc. and affiliates.
HURON I 44
© 2021 Huron Consulting Group Inc. and affiliates.
System
Benchmarking
Section F:
Research Questions:
How do comparable system offices message the role of the
system vs. the role of individual campuses?
What are some examples of innovation in peer systems?
What are examples of non-degree academic innovation?

HURON I 45
© 2021 Huron Consulting Group Inc. and affiliates.
HIGHER EDUCATION SYSTEM CASE STUDIES
University of California SUNY
University of Wisconsin

HURON I 46
© 2021 Huron Consulting Group Inc. and affiliates.
The UC System’s current strategic plan, UC 2030: Advancing the
California Dream, lays out three system-wide goals:
• Produce 200,000 more undergrad and grad degrees by 2030
• Ensure the California Dream is for everyone
• Invest in the next generation of faculty and research
In December 2019, the UC System’s Office of the President (UCOP)
published a separate strategic framework “to guide all divisions [of the
UCOP] in focusing their energy and resources on actions that will best
position the University of California to achieve its academic, research
and public service missions.” The strategic framework also includes
the mission, vision, and values of the UCOP.
HIGHER EDUCATION SYSTEMS: THE UC SYSTEM
Institutions: 10 campuses
2020-21 In-State Tuition: $11,442
Undergraduate Students: 226,449
Graduate Students: 59,267
2019-20 Bachelor’s Degrees: 62,747
2019-20 Master’s Degrees: 13,836
The UC System’s Office of the President (UCOP) funds and guides system-wide programs, coordinates student support, manages the UC
Systems business operations and finances, and supports the well-being of the UC System’s workforce.
In 2012, the UCOP launched the UC-
HBCU Initiative to diversify and
strengthen UC graduate programs. As
part of the initiative, the UCOP offers a
variety of grants designed to encourage
UC faculty to actively engage in
collaboration and cooperation with
faculty and students at HBCUs.
The UC System recently announced an
open-access deal with publisher
Elsevier. Under the deal, all UC lead
authors will be able to publish articles in
Elsevier journals openly so that anyone
can read them without paying. This deal
advances the UC System’s goal to have
its research be openly disseminated.
Innovation within the UC SystemOverview of the UC System
Relevance to Emerging PrioritiesSystemness, Diversity & Inclusion, Access and
Affordability

HURON I 47
© 2021 Huron Consulting Group Inc. and affiliates.
The SUNY System’s current strategic plan, The Power of SUNY, lays
out six “Big Ideas”:
• SUNY and the Entrepreneurial Century
• SUNY and the Seamless Education Pipeline
• SUNY and a Healthier New York
• SUNY and an Energy-Smart New York
• SUNY and the Vibrant Community
• SUNY and the World
To support these six “Big Ideas,” the Office of Strategic Planning and
Accountability coordinates implementation, produces report cards, and
leads SUNY’s branding and marketing efforts.
HIGHER EDUCATION SYSTEMS: THE SUNY SYSTEM
Institutions: 64 campuses
2020-21 In-State Tuition: $7,070
Undergraduate Students: 350,889
Graduate Students: 43,331
2019-20 Bachelor’s Degrees: 43,172
2019-20 Master’s Degrees: 11,301
The SUNY System is the nation’s largest public system of higher education, containing 64 campuses comprised of Doctoral Granting
Institutions, University Colleges, Technology Colleges, and Community Colleges. The exact role of the SUNY System Office is unclear.
The SUNY System contains 30
community colleges with enrollment at
each community college ranging from
700 to over 10,000. These colleges
provide industry credentials or
certificates, guaranteed transfer
pathways to a 4-year SUNY institution,
or direct placement into a career.
53 of SUNY’s 64 campuses use one
application – applySUNY – to simplify
the process of applying for admission.
Prospective students designate which
campuses they would like to apply to,
and applications are received in a
central location before being distributed
to admissions officers on each campus.
Innovation within the SUNY SystemOverview of the SUNY System
Relevance to Emerging PrioritiesSystemness, Diversity & Inclusion, Access and
Affordability

HURON I 48
© 2021 Huron Consulting Group Inc. and affiliates.
The U. of Wisconsin System’s current strategic plan, 2020FWD:
Moving Wisconsin and the World Forward, lays out four overarching
areas of focus:
• Educational pipeline
• University experience
• Business and community mobilization
• Operational excellence
Each area of focus contains system-wide priorities and specific actions
to be taken at the institutional-level. The UW System Administration
office supports this strategic plan by developing an operational plan
and delivering regular progress updates.
HIGHER EDUCATION SYSTEMS: THE U. OF WISCONSIN SYSTEM
Institutions: 26 campuses*
2020-21 In-State Tuition: Differential
Undergraduate Students: 139,539
Graduate Students: 25,227
2019-20 Bachelor’s Degrees: 28,444
2019-20 Master’s Degrees: 7,837
Under the direction of the UW System President, the UW System Administration helps to develop, and then implements, monitors, and
evaluates policies enacted by the Board of Regents, aligning university programs with the current and future needs of the state and the nation.
To address teacher shortages in
Wisconsin, UW-Madison’s School of
Education initiated the Teacher Pledge
Program, which enables students to
receive financial assistance equal to
the cost of in-state tuition and fees, plus
testing and certification costs if they
pledge to work at a Wisconsin preK-12
school for 3-4 years after graduation.
The U. of Wisconsin System has made
coordinating online education a key focus
of its 2021-23 budget proposal. Project
Distance Education+ includes enhanced
research and marketing, expanded
program/curriculum development, and
improved responsiveness to trends in the
marketplace. Investment will likely flow
through UW Extended Campus.
Innovation within the U. of Wisconsin SystemOverview of the U. of Wisconsin System
Relevance to Emerging PrioritiesSystemness, Diversity & Inclusion, Access and
Affordability
* Note: The U. of Wisconsin System has 13 universities spread across 26 campuses.