using worked examples for training nutrition …
TRANSCRIPT

University of New MexicoUNM Digital RepositoryIndividual, Family, and Community EducationETDs Education ETDs
1-28-2015
USING WORKED EXAMPLES FORTRAINING NUTRITION PROFESSIONALSTO DIAGNOSE NUTRITION PROBLEMSAND USE INTERNATIONAL DIETETICSAND NUTRITION TERMINOLOGYKirsten Bennett
Follow this and additional works at: https://digitalrepository.unm.edu/educ_ifce_etds
Part of the Education Commons
This Dissertation is brought to you for free and open access by the Education ETDs at UNM Digital Repository. It has been accepted for inclusion inIndividual, Family, and Community Education ETDs by an authorized administrator of UNM Digital Repository. For more information, please [email protected].
Recommended CitationBennett, Kirsten. "USING WORKED EXAMPLES FOR TRAINING NUTRITION PROFESSIONALS TO DIAGNOSENUTRITION PROBLEMS AND USE INTERNATIONAL DIETETICS AND NUTRITION TERMINOLOGY." (2015).https://digitalrepository.unm.edu/educ_ifce_etds/19

i
APPROVAL PAGE
Kirsten D. Bennett Candidate Individual Family and Community Education, Department of the College of Education Department
This dissertation is approved, and it is acceptable in quality and form for publication:
Approved by the Dissertation Committee:
Jay Parkes, PhD , Chairperson
Terri Flowerday, PhD
Deborah Cohen, DCN, RD
James Selig, PhD

ii
USING WORKED EXAMPLES FOR TRAINING NUTRITION PROFESSIONALS TO DIAGNOSE NUTRITION PROBLEMS AND USE
INTERNATIONAL DIETETICS AND NUTRITION TERMINOLOGY
BY
KIRSTEN D. BENNETT
B.S., Home Economics, University of Missouri, 1987 M.S., Nutrition, University of New Mexico, 2007
DISSERTATION
Submitted in Partial Fulfillment of the Requirements for the Degree of
Doctor of Philosophy
Educational Psychology
The University of New Mexico Albuquerque, New Mexico
December, 2014

iii
DEDICATION
I dedicate this work to my family: past, present and future. My grandparents and
parents instilled a love of life-long learning and emphasized the importance of being an
educated person, something I want to say I have done for my own children. My husband
Phil and my children Trevor, Tristan, and Laurel not only participated in this work by
supporting my personal growth, but also by infusing their own personalities into the
interpretation of the concepts I was exploring.
ACKNOWLEDGEMENTS
I wish to acknowledge the support provided by my colleagues in the Department
of Pediatrics and those in the Nutrition and Dietetics program.
I wish to thank the chair of my committee, Dr. Jay Parkes, for his guidance and
stepping in when my previous chair was unable to serve. I appreciate the input and
support of dissertation committee members Dr. Cohen, Dr. Flowerday, and Dr. Selig.
I wish to thank the graduate students who aided in data collection and data entry
for the pilot and main study; Renee Conklin, Catherine McQueen, Amanda Hurford, and
Erin Lamers.
I wish to express my sincere gratitude to Lisa Gurule, Mary Martinez, Dr. Tabers,
Dr. Steibler, and Sara Perovich, faculty at Central New Mexico Community College, for
allowing me to use class time to work with the participants for the main study.
iv
USING WORKED EXAMPLES FOR TRAINING NUTRITION PROFESSIONALS TO DIAGNOSE NUTRITION PROBLEMS AND USE
INTERNATIONAL DIETETICS AND NUTRITION TERMINOLOGY
By
Kirsten D. Bennett
B.S., Home Economics M.S., Nutrition
PhD Educational Psychology
ABSTRACT.
This study investigated two types of modular worked examples; process-oriented
(PSWE) and product-oriented (PDWE), for performance, cognitive load, and efficiency
for nutrition diagnosis.
One hundred and four students (104) from a 200-level course in human nutrition
participated in the main study. Participants studied the worked examples and completed
the practice phase during one regularly scheduled class period. Two weeks later the
participants completed the maintenance phase during half a regularly scheduled class
period. Both the practice and maintenance phases involved making nutrition diagnoses,
using the correct International Dietetics and Nutrition Terminology (IDNT) and writing a
diagnostic statement for two cases.
Participants in both conditions were able to make nutrition diagnoses after
studying the two worked examples in the learning phase for an average of 22 minutes.
More than forty percent of participants in the practice and maintenance phases who
attempted to make a diagnosis scored greater than or equal to 67.5% correct on the

v
diagnostic tasks with the mean higher at 87.5% correct. There were no statistically
significant differences in time on task or scores on the diagnostic tasks between worked
example conditions. Statistically significant differences in the subscales of perceived
cognitive load were observed by worked example type in the learning phase. There is a
statistically significant difference in calculated efficiency scores for the maintenance
phase cases. The PDWE condition was more efficient F(1,4)=8.7, p=.042, ω2=.344,
indicating that worked example condition accounts for 34.4% of the variance in
calculated efficiency for the maintenance phase, an advantage for PDWE.
Results suggest an application of worked examples for training nutrition
professionals.

vi
TABLE OF CONTENTS
APPROVAL PAGE ............................................................................................................................... i
DEDICATION .................................................................................................................................... iii
ACKNOWLEDGEMENTS ................................................................................................................... iii
ABSTRACT. ....................................................................................................................................... iv
TABLE OF CONTENTS....................................................................................................................... vi
LIST OF FIGURES ............................................................................................................................. xii
LIST OF TABLES ...............................................................................................................................xiii
Chapter 1 .......................................................................................................................................... 1
INTRODUCTION ............................................................................................................................ 1
Training Nutrition Professionals to Diagnose Nutrition Problems .......................................... 1
Worked Examples as an Approach to Training Nutrition Professionals .................................. 2
Purpose of the Study ................................................................................................................ 5
Significance of the Study .......................................................................................................... 6
Research Questions and Hypotheses....................................................................................... 6
Performance on Diagnostic Tasks ........................................................................................ 6
Question 1: ....................................................................................................................... 6
Hypothesis 1: .................................................................................................................... 7
Question 2: ....................................................................................................................... 7
Hypothesis 2: .................................................................................................................... 7
Efficiency .............................................................................................................................. 7
Question 3: ....................................................................................................................... 7
Hypothesis 3: .................................................................................................................... 7
Cognitive Load ...................................................................................................................... 7
Question 4: ....................................................................................................................... 7
Hypothesis 4‐1: ................................................................................................................ 7
Hypothesis 4‐2: ................................................................................................................ 8
Hypothesis 4‐3: ................................................................................................................ 8
Definition of Terms .................................................................................................................. 8
Registered Dietitian (RD) ................................................................................................. 8
International Dietetics and Nutrition Terminology (IDNT) .............................................. 8
Problem, Etiology, and Signs and Symptoms (PES) statement ........................................ 8

vii
Worked examples ............................................................................................................ 8
Worked example effect.................................................................................................... 9
Cognitive load .................................................................................................................. 9
Intrinsic cognitive load ..................................................................................................... 9
Extraneous cognitive load ................................................................................................ 9
Germane cognitive load ................................................................................................... 9
Molar worked examples .................................................................................................. 9
Modular worked examples ............................................................................................ 10
Process‐oriented worked example (PSWE) ................................................................... 10
Product‐oriented worked example (PDWE) .................................................................. 10
Chapter 2 ........................................................................................................................................ 11
LITERATURE REVIEW .................................................................................................................. 11
Worked Examples and the Worked Example Effect .............................................................. 11
Cognitive Load Theory ........................................................................................................... 14
Cognitive architecture and learning: working and long term memory ............................. 15
Schema construction and schema automation. ................................................................ 16
Cognitive load. ................................................................................................................... 17
Cognitive Load and Worked Example Design ........................................................................ 18
Intrinsic cognitive load. ...................................................................................................... 18
Extraneous cognitive load. ................................................................................................. 20
Germane cognitive load. .................................................................................................... 20
Example Format and Addition of Principle or Process Information to Worked Examples .... 21
Design Elements of Process‐Oriented and Product‐Oriented Worked Examples ................. 24
Measures of Perceived Cognitive Load and Mental Effort .................................................... 27
Summary and Implications for the Current Study ................................................................. 30
Chapter 3 ........................................................................................................................................ 32
METHODS ................................................................................................................................... 32
Introduction ........................................................................................................................... 32
The Pilot Study ....................................................................................................................... 32
Participants ........................................................................................................................ 32
Measures ............................................................................................................................ 33
Demographic questionnaire .......................................................................................... 33

viii
Prior knowledge. ............................................................................................................ 33
Measure of perceived cognitive load. ............................................................................ 33
Problem, Etiology, and Signs and Symptoms statement (PES) score. ........................... 34
Materials ............................................................................................................................ 34
International Dietetics and Nutrition Terminology (IDNT) guide .................................. 34
Learning phase cases. .................................................................................................... 35
Practice and maintenance phase cases. ........................................................................ 35
Design ................................................................................................................................. 36
Human Subjects Protections .............................................................................................. 38
Procedures ......................................................................................................................... 39
Data Analyses ..................................................................................................................... 41
The Main Study ...................................................................................................................... 43
Participants ........................................................................................................................ 43
Measures ............................................................................................................................ 44
Demographic questionnaire .......................................................................................... 44
Prior knowledge. ............................................................................................................ 44
Measure of perceived cognitive load. ............................................................................ 44
Problem, Etiology, and Signs and Symptoms statement (PES) score. ........................... 45
Materials ............................................................................................................................ 45
International Dietetics and Nutrition Terminology (IDNT) guide. ................................. 45
Learning phase cases. .................................................................................................... 45
Practice and maintenance phase cases. ........................................................................ 46
Design ............................................................................................................................. 47
Human Subjects Protections .............................................................................................. 48
Procedures ......................................................................................................................... 48
Data Analyses ..................................................................................................................... 50
Secondary analysis. ........................................................................................................ 51
Chapter 4 ........................................................................................................................................ 52
RESULTS ..................................................................................................................................... 52
Introduction ........................................................................................................................... 52
Pilot Study .............................................................................................................................. 52
Performance on Diagnostic Tasks ...................................................................................... 55
Practice Phase‐Pilot ........................................................................................................... 55

ix
Maintenance Phase‐Pilot ................................................................................................... 56
Interrater Reliability for PES Diagnostic Statement Scores ............................................... 57
Cognitive Load .................................................................................................................... 57
Learning Phase‐Pilot .......................................................................................................... 59
Practice Phase‐Pilot ........................................................................................................... 60
Maintenance Phase‐Pilot ................................................................................................... 61
Themes from Comments from Write in Questions on NASA‐TLX ..................................... 62
Learning Phase ................................................................................................................... 63
Practice Phase .................................................................................................................... 63
Maintenance Phase ........................................................................................................ 63
Calculated Efficiency .......................................................................................................... 64
Main Study ............................................................................................................................. 66
Performance on Diagnostic Tasks ...................................................................................... 69
Secondary Analysis of Practice Phase Cases ...................................................................... 71
Case One Diagnosis One ................................................................................................ 71
Case One Diagnosis Two ................................................................................................ 72
Case Two Practice Phase ................................................................................................ 72
Maintenance Phase‐ Main Study ....................................................................................... 73
Secondary Analysis of Maintenance Phase Cases.......................................................... 75
Case One Diagnosis One ................................................................................................ 76
Case Two Diagnosis One ................................................................................................ 76
Case Two Diagnosis Two ................................................................................................ 77
Cognitive Load .................................................................................................................... 77
Learning Phase ............................................................................................................... 78
Practice Phase ................................................................................................................ 80
Maintenance Phase Cognitive Load ............................................................................... 83
Themes from Comments from Write In Questions on NASA‐TLX ..................................... 86
Learning Phase ............................................................................................................... 87
Practice Phase ................................................................................................................ 87
Maintenance Phase ........................................................................................................ 87
Calculated Efficiency .......................................................................................................... 88
Summary of Results ............................................................................................................... 90
Research Question 1 .......................................................................................................... 90

x
Research Question 2. ......................................................................................................... 90
Research Question 3. ......................................................................................................... 91
Research Question 4. ......................................................................................................... 91
Chapter 5 ........................................................................................................................................ 93
DISCUSSION ................................................................................................................................ 93
Performance on Diagnostic Tasks .......................................................................................... 93
Efficiency ................................................................................................................................ 96
Cognitive Load ........................................................................................................................ 98
Discussion ............................................................................................................................ 100
Effect of modular worked examples on the complex skill of diagnostic problem solving
......................................................................................................................................... 100
Implications for training nutrition professionals ............................................................. 101
Implications for Intervention Design of Worked Examples ............................................. 102
Implications for Assessment of Diagnostic Performance ................................................ 102
Strengths and Limitations of the Study ............................................................................... 103
Implications and Recommendations for Future Research .................................................. 104
Conclusions .......................................................................................................................... 105
List of Appendices ........................................................................................................................ 106
Appendix A – Demographics ................................................................................................ 107
Appendix B – General Nutrition Knowledge Test ................................................................ 108
Appendix C – Task Load Index ‐ Learning Phase .................................................................. 110
Appendix D – Task Load Index – Practice Phase .................................................................. 111
Appendix E – Task Load Index – Maintenance Practice Phase ............................................ 112
Appendix F – Directions and Practice Case #1 Scoring PES ................................................ 113
Appendix G – Practice Case #2 Scoring Rubric PES .............................................................. 115
Appendix H – Maintenance Case #1 Scoring PES ................................................................. 116
Appendix I – Maintenance Case #2 Scoring PES .................................................................. 117
Appendix J – Nutrition Diagnostic Terminology * ................................................................ 119
Appendix K – Product Oriented Worked Examples (PDWE)‐Learning Phase ...................... 120
Appendix L – Process Oriented Worked Example (PSWE)‐Learning Phase ......................... 130
Appendix M – Practice Cases ............................................................................................... 144
Appendix N – Maintenance Cases ....................................................................................... 151

xi
Appendix O – UNM IRB Consent .......................................................................................... 157
Appendix P – CNM Student Dissertation Consent ............................................................... 162
Appendix Q – CNM Faculty Dissertation Consent................................................................ 167
List of References ......................................................................................................................... 172

xii
LIST OF FIGURES
Figure 1. Schematic of Study ........................................................................................... 38
Figure 2 Pilot Study: Practice Phase Efficiency ............................................................... 65
Figure 3 Pilot Study: Maintenance Phase Efficiency ....................................................... 66
Figure 4. Main Study Practice Phase Efficiency ............................................................. 88
Figure 5. Main Study Maintenance Phase Efficiency ...................................................... 89

xiii
LIST OF TABLES
Table 1. Pilot Study Participants Characteristics ............................................................. 54
Table 2. Pilot study practice phase performance dependent variables (M; SD)-ANOVA ................................................................................................................................... 56
Table 3 Pilot study maintenance phase performance dependent variables (M; SD)-ANOVA ..................................................................................................................... 57
Table 4. Pilot study learning phase cognitive load dependent variables (M; SD) ANOVA ................................................................................................................................... 60
Table 5 Pilot study practice phase cognitive load dependent variables (M; SD)-ANOVA ................................................................................................................................... 61
Table 6. Pilot study maintenance phase cognitive load dependent variables (M; SD)-ANOVA ..................................................................................................................... 62
Table 7. Dissertation study participant characteristics .................................................... 68
Table 8. Main Study Practice Phase Performance- Correlations Case One .................... 69
Table 9. Diagnosis Attempted-Main Study-Practice Phase ............................................. 70
Table 10. Main study practice phase performance dependent variables (M; SD) ........... 70
Table 11. Main Study Practice Phase Performance- Correlations Case Two .................. 71
Table 12. Scores > 8 Main study practice phase performance dependent variables (M; SD) ............................................................................................................................. 71
Table 13 Main Study Diagnosis Attempted ...................................................................... 73
Table 14. Main Study Maintenance Phase Performance- Correlations Case One ........... 74
Table 15. Main Study Maintenance Phase Performance- Correlations Case Two .......... 75
Table 16. Main Study Maintenance Phase Dependent Variables (M; SD) ...................... 75
Table 17. Scores > 8 Main study maintenance phase performance dependent variables (M; SD) ...................................................................................................................... 76
Table 18. Main Study Learning Phase Cognitive Load Correlations .............................. 78
Table 19. Main study learning phase cognitive load dependent variables (M; SD) ........ 79
Table 20. Main Study Practice Phase Cognitive Load Case One- Correlations .............. 81
Table 21. Correlations Main Study Practice Phase Cognitive Load Case Two- ............. 82
Table 22. Main study practice phase cognitive load - case two (M; SD) ........................ 82
Table 23. Correlations Maintenance Phase Cognitive Load Case One ........................... 83
Table 24. Main study maintenance phase cognitive load - case one (M; SD) ................. 84
Table 25. Correlations Main Study Maintenance Phase Cognitive Load Case Two- ..... 85
Table 26. Main study maintenance phase cognitive load - case two (M; SD) ................. 86
Table 27. Summary of Results ......................................................................................... 90

1
Chapter 1
INTRODUCTION
Training Nutrition Professionals to Diagnose Nutrition Problems
Healthcare practice presents unique and contextually rich clinical situations that
require healthcare providers to make connections between somewhat disparate
knowledge domains and training experiences to determine the causes, mediators, and
potential solutions to managing diseases in humans. The complex nature of healthcare
requires that educators offer learning environments and learning processes that enable
individuals to develop sustainable, transferable knowledge and skills (Fraser &
Greenhalgh, 2001). Learning to diagnose health problems in humans, apply standardized
diagnostic terminology, and simultaneously use standardized documentation, exemplifies
this educational challenge.
Complexity lies in the process of training new healthcare providers to sift through
the elements of a clinical case, recognize and correctly diagnosis a problem, and
effectively communicate findings. Diagnosing and formulating a plan for nutritional
therapy is a primary role of registered dietitians in the multi- and inter-disciplinary
environment of healthcare and is one part of the four-part Nutrition Care Process
(International Dietetics and Nutrition Terminology, 2011). International Dietetics and
Nutrition Terminology (IDNT) is unique to registered dietitians and the standardized
language of IDNT is meant to capture nutrition issues that can be treated independently
by the nutrition provider (Hakel-Smith, Lewis, & Eskridge, 2005; Simon, Faut, &
Wooley, 2009). Nutrition diagnosis is a complex cognitive skill to perform, and equally
complex to learn, requiring simultaneous attention to numerous interacting elements
2
presented in each individual case. Nutrition diagnosis requires general and overall
knowledge of concurrent elements related to human nutrition; food science, human
growth and development, anatomy and physiology, life course considerations, and
pathophysiology. The task exerts a high cognitive load during training, especially for
novices. Registered dietitians need to be able to determine how to trouble shoot
(diagnose) when observed biochemical or clinical features are associated with a nutrition
problem, comparing observations or measurements made in the nutrition assessment
phase to measures of optimal functioning or health. Nutrition diagnoses are captured in
the medical record by using a Problem, Etiology, and Signs and Symptoms (PES)
diagnostic statement. Writing a correct and meaningful diagnostic statement using
IDNT, follows a fairly structured format and affords an opportunity for educators to
streamline approaches to teaching nutrition providers to document nutrition diagnoses
using this method. Designing educational strategies that acknowledge the complex
nature of nutrition diagnosis and the potential for cognitive overload in the novice is
required. Currently, no literature in the domain of nutrition and nutrition education
outlines evidence for specific strategies for effectively teaching this complex skill (Simon
et al., 2009). With these challenges in mind, there is a need to refine the way registered
dietitians and nutrition professionals are trained to diagnose nutrition problems and use
IDNT (Lacey, 2006; Pressely et al., 1990; Zelig, Byham-Gray, Touger-Decker, Parrot, &
Rigassio-Radler, 2011).
Worked Examples as an Approach to Training Nutrition Professionals
Programs that train nutrition professionals for clinical practice use case examples
to illustrate medical and nutritional problems. Most are presented as conventional

3
problems, cases that tell the story or medical history of an individual and ask the learner
to make a determination as to what nutrition issues need to be treated. These
conventional cases consist of a question to answer (goal) and some specific information
(the givens in a problem) to manipulate to obtain the answer. Novices especially are
quickly overwhelmed by possible paths to a solution with conventional problems (Rourke
& Sweller, 2009).
Worked examples are an educational tool used to teach problem solving skills.
Worked examples model problem solving by labeling the steps and operators experts take
to arrive at a solution and, by example, teach the moves required (Atkinson, Derry,
Renkl, & Worthham, 2000; Sweller, 1994). Learners are freed from having to discover
the moves or operators, a cognitively taxing activity. Expert modeling provided by
worked examples helps organize domain knowledge around core concepts, recognize
meaningful patterns, efficiently search through the givens in a problem, and outline the
procedural knowledge necessary to make a diagnostic determination (Gobet, 2005;
Meier, Reinhard, Carter, & Brooks, 2008; Paas & Van Gog, 2006). Improvement in
initial learning in the training phase is accomplished by designing education
environments that focus on helping students to see relationships and interactions between
elements of problems and to discern underlying structure (Chi and VanLehn, 2012;
Gobet, 2005). Chi and VanLehn (2012) concluded from their observations that students
need to be told to notice these relationships and conclude that transfer (of problem
solving skills) is based on the ability to interpret these relationships. Having novices
study an expert’s approach to problem solving indicates to learners what successful
learning and successful problem solving looks like and that it can be replicated.

4
Using worked examples does not guarantee that students will perform well on all
learning outcomes (Grosse & Renkl, 2007). Learning outcomes depend on how worked
examples are constructed for specific types of learners and with differing levels of prior
knowledge. Specifically for novice nutrition professionals, this early stage of skill
development is where worked examples are most likely to prove superior (Kalyuga,
Ayres, Chandler, & Sweller, 2003).
Framing the worked examples for level of prior knowledge and engagement
includes describing the role of the student as part of a team of individuals where their
input and ideas are critical (Engle, Lam, Meyer, & Nix, 2012). In the context of training
nutrition professionals, this can be used to situate the student as the member of the
healthcare team with expert specific nutrition diagnostic and treatment information to be
incorporated into overall care for an individual. Labeling structure and drawing attention
in a learning phase, as in a worked example, may make recognition, and therefore the
solution, more achievable (Catrambone & Holyoak, 1989; Gobet, 2005). Perkins and
Salomon (2012) suggest that this skill of detection can be developed by a variety of
educational experiences. The discrepancies noted might be the most powerful in
motivating a student to take the next step or elect to explore the relationship of the
discrepancies (Wigfield & Eccles, 2000). An example is a clinical case study where the
relationships between the discrepancies in assessment parameters and interaction of
elements from the individual’s history are features of complex tasks. The worked
example formats proposed in this research offer example problems that explicitly label
features to detect discrepancies and connect information in the example to prior
knowledge leading to a nutrition diagnosis.

5
Purpose of the Study
The present study addressed the need for strategies that effectively teach nutrition
diagnosis and the use of IDNT and diagnostic statements, contribute to competent use of
IDNT, and facilitate transfer of entry level nutrition diagnosis skills and documentation
knowledge for novice nutrition providers. Research methodology compared performance
outcomes on isomorphic (similar) and novel clinical cases, training efficiency, and
perceived cognitive load between two groups of novice nutrition students randomized to
two different types of modular worked examples. International Dietetics and Nutrition
Terminology and the use of diagnostic statements have inherent well-defined structures
that lend themselves to experimentation on the application of worked example (Chen,
Hsu, Liu, & Yang, 2012). Modular worked examples offer an approach to teach students
to focus on interaction in the case and to derive schema that that support use of IDNT and
writing diagnostic statements not only in the formal learning environment of healthcare
education, but also when providing nutrition care to individuals and populations.
Process-oriented worked examples provide an avenue for supplying the principles behind
each step of the diagnostic process, a typical strategy in healthcare provider education.
Worked examples have the potential to decrease cognitive load since more direct
instruction reduces searching for meaning, especially for novice nutrition providers. This
may in turn improve transfer in subsequent clinical situations, the goal of teaching in this
domain.

6
Significance of the Study
Using worked examples for nutrition provider education extends the worked
example literature about the effectiveness of this strategy in different domains and with
different types of students (van Gog, Paas, & van Merriënboer, 2004). This study
explored the extent to which the worked example conditions tested affected cognitive
load during three phases of an educational process for nutrition diagnosis; learning,
practice, and maintenance. A particular strength in this research design was the
maintenance phase two weeks later that demonstrated students retained an ability to make
nutrition diagnoses.
One aspect of this study that has immediate implications to nutrition provider
education is that the research was conducted in an authentic classroom environment
without the need for a digital or online environment. A set of learning materials to teach
nutrition diagnosis based on worked examples could be developed as a supplement to a
course as a text or adapted to an online continuing education program for currently
practicing registered dietitians.
Research Questions and Hypotheses
Performance on Diagnostic Tasks
Question 1: Do both product-oriented worked example and process-oriented
worked example conditions result in an ability to use International Dietetics and Nutrition
Terminology and Problem, Etiology, and Signs and Symptoms diagnostic statements by
novices as evidenced by performance on diagnostic tasks?
7
Hypothesis 1: Participants in either worked example condition, product-oriented
or process-oriented, will demonstrate an ability to use International Dietetics and
Nutrition Terminology and construct a Problem, Etiology, and Signs and Symptoms
diagnostic statement.
Question 2: Does the process-oriented worked example condition result in better
performance when compared to the product-oriented worked example condition for
novices learning to use IDNT and write diagnostic statements?
Hypothesis 2: The process-oriented worked example condition will result in
higher performance scores compared to the product-oriented worked example condition.
Efficiency
Question 3: What is the difference between the process-oriented worked example
condition and the product-oriented worked example condition on efficiency when
calculated from self-report of perceived mental effort and performance on diagnostic
tasks?
Hypothesis 3: Calculated efficiency scores will be better for the process-oriented
worked example condition compared to the product-oriented worked example condition.
Cognitive Load
Question 4: What is the difference in perceived cognitive load between the
product-oriented worked example condition and the process-oriented worked example
conditions?
Hypothesis 4-1: The process-oriented worked example condition will result in
higher perceived cognitive load scores during the training phase.

8
Hypothesis 4-2: Perceived success should be higher for the process-oriented
worked example condition when compared to the product-oriented worked example
condition during the practice and maintenance phases.
Hypothesis 4-3: Perceived stress should be lower for the process-oriented worked
example condition when compared to the product-oriented worked example condition
during the practice and maintenance phases.
Definition of Terms
Registered Dietitian (RD) is an expert in human nutrition and a member of the
healthcare team trained to diagnosis and treat nutrition problems in humans. RDs must
complete a nationally approved course of study at a credentialed university. RD
designation is only granted after completing the prescribed course of study and passing a
national board exam.
International Dietetics and Nutrition Terminology (IDNT) is unique to Registered
Dietitians (RD) and the standardized language of IDNT is meant to capture nutrition
issues that can be treated independently by the nutrition provider.
Problem, Etiology, and Signs and Symptoms (PES) statement is a diagnostic
statement and the way in which nutrition diagnoses are captured in the medical record
following a structured format.
Worked examples are an educational tool used to teach problem solving skills. Worked
examples model problem solving by labeling the steps and operators experts take to
arrive at a solution and by example, teach the moves required.

9
Worked example effect defines the benefit to learners of presentation of new material
related to problem solving in varying domains as completely worked out problems, rather
than as conventional problems (Sweller, 1994).
Cognitive load describes the impact on cognitive resources associated with completing a
task or learning something new. Cognitive load is reflected in this study as self-reported
perceived cognitive load which involves rating perceived task demand, time demand,
success, effort, and stress. Cognitive load has three components; intrinsic cognitive load,
extraneous cognitive load, and germane cognitive load.
Intrinsic cognitive load is one category of cognitive load. Material to be learned or
tasks that are intellectually complex contribute specifically to intrinsic cognitive load.
Sweller (1994) states, “the primary determinant of intrinsic cognitive load is element
interactivity” (pg. 307).
Extraneous cognitive load includes instructional materials and environments that
require students to spend working memory searching for procedures or pieces of
information that are not relevant to schema construction; however, must be addressed to
complete a task (Van Gog, Paas, & van Merriënboer, 2008).
Germane cognitive load enhances learning and, like extraneous cognitive load, may be
more readily manipulated in the learning environment. Design elements of instruction to
increase germane cognitive load may support the use of working memory resources
towards construction of schema.
Molar worked examples are designed to help learners identify structures and main
components that help classify a problem. After learners classify a problem, they then use
the learned steps to solve the problem as a whole. Simultaneous examples are similar to

10
molar worked examples, where all the solution components are displayed at one time, so
that each step is related to the others and not considered on its own (Atkinson & Derry,
2000).
Modular worked examples define sub goals and limit the solution search space to the
sub goal and not the overall goal. Modular worked examples provide clues to relevance,
order of operations, and associated labels. Within the format of modular examples,
structural features that are highlighted also have associated an explicit purpose for
performing that step and can stand alone.
Process-oriented worked example (PSWE) is one type of modular worked example
where principles and rationale for the process are provided in addition to each step that
demonstrates the sub-goal.
Product-oriented worked example (PDWE) is one type of modular worked example
that includes only the steps that demonstrate each sub-goal.

11
Chapter 2
LITERATURE REVIEW
Worked Examples and the Worked Example Effect
Worked examples are an educational tool used to teach problem solving skills.
Worked examples model problem solving by labeling the steps and operators experts take
to arrive at a solution and by example, teach the moves required (Atkinson, Derry, Renkl,
& Worthham, 2000; Sweller, 1994). Learners are freed from having to discover the
moves or operators, a cognitively taxing activity. The worked example effect defines the
benefit of presentation of new material related to problem solving in varying domains as
completely worked out problems, rather than as conventional problems (Sweller, 1994).
Conventional problems consist of a question to answer (goal) and some specific
information (the givens in a problem) to manipulate to obtain the answer. Conventional
problem solving can be an effective learning strategy for students who have some
domain-specific knowledge; however, for those with limited prior knowledge, this may
become a frustrating experience that does not produce the desired learning outcomes.
Novices especially, are quickly overwhelmed by possible paths to a solution with
conventional problems (Rourke & Sweller, 2009). Worked example approaches to
instruction impact distribution of cognitive resources to greatest effect by minimizing the
amount of cognitive capacity necessary for a given task and directing the attention of the
learner toward the meaningful aspects of the problem solution (Paas, 1992; Sweller,
1988). Worked examples offer a means of increasing performance on subsequent
problems while decreasing cognitive load during training (Grosse & Renkl, 2007; Meier,
Reinhard, Carter, & Brooks, 2008; Moreno, 2006; ; Paas & van Gog, 2006; van Gog,

12
Paas, & van Merriënboer, 2008; van Gog, Paas, & van Merriënboer, 2006; van Gog,
Paas, & van Merriënboer, 2004).
Using expert modeling in worked examples helps organize domain knowledge
around core concepts, recognize meaningful patterns, efficiently search through the
givens in a problem, and outline the procedural knowledge necessary in a domain (Gobet,
2005; Meier, et al., 2008; Paas & Van Gog, 2006). Chi and VanLehn (2012) make a
point that supports the worked example approach for training arguing that the issue is not
the failure to transfer what was learned when attempting to solve a different problem, but
the failure to learn initially. Improvement in initial learning in the training phase is
accomplished by designing education environments that focus on helping students to see
relationships and interactions between elements of problems and to discern underlying
structure (Chi & VanLehn, 2012; Gobet, 2005). Chi and VanLehn concluded from their
observations that students need to be told to notice these relationships and conclude that
transfer (of problem solving skills) is based on the ability to interpret these relationships.
Having novices study an expert’s approach to problem solving indicates to learners what
successful learning and successful problem solving looks like and that it can be
replicated.
A successful application of this approach outside of the more frequently studied
domains of math and engineering was applied to novice students (first year) studying
furniture design (Rourke & Sweller, 2009). Comparisons were made between those
studying worked examples and those solving equivalent problems on a post test of
furniture designer styles. In the first experiment, designer recognition and matching of
designers to the examples, a statistically significant main effect was found for worked

13
examples compared to conventional problems (Rourke & Sweller, 2009). The authors
noted that test scores for both conditions were low indicating that the material was
challenging for novices and speculated that all were at the early stages of skill
acquisition. This early stage of skill development is where worked examples are most
likely to prove superior (Kalyuga, et al., 2003).
Worked example designs are divided into two main categories. Intra-example
(design), one category, is concerned with the features of each individual example (Grosse
& Renkl, 2007; Paas & van Gog, 2006). Within the category of intra-example design is
the concept of structure-emphasizing examples. These examples help learners determine
or detect common underlying structures in problems when presented with different cover
stories, surface features, and emphasize the recurrent aspects of operations in a domain
(Grosse & Renkl, 2007). The skill of discerning structural aspects so that procedural
skills and conceptual understanding are appropriately applied is critical for success with
future problems. Schwonke et al. (2009) compared a computer-based cognitive tutor for
geometry with the same material presented as worked examples in a group of eighth and
ninth grade German students to see if students could acquire and apply geometry
principles. Though there were no significant differences in post-test (transfer) scores
between the groups; the worked-example group was much more efficient (less time was
required to learn the same material when compared to the problem-solving condition) d=-
1.17 (large effect) (Schwonke et al., 2009). This indicates an advantage, especially to
novices, when learning new material. If the same material can be learned in a more
efficient way, there is potential that worked examples could prove less frustrating and
have a positive effect on student’s motivation to continue with a learning task. The

14
investment of additional mental effort with improved motivation may positively impact
learning outcomes over time for those receiving worked example based instruction (Paas,
Tuovinen, van Merriënboer, & Darabi, 2005).
For students to derive the most benefit from worked examples, carefully designed
learning materials are required (Gerjets, Scheiter, & Catrambone, 2004). The
instructional design framework provided by cognitive load theory differentiates between
environments and activities that support learning and those that detract from learning. In
addition, cognitive load theory includes perceived cognitive load, sometimes measured as
only mental effort, in the metrics used to compare different instructional interventions.
To fully appreciate differences in learning outcomes when comparing worked example to
other types of instructional design, an overview of the tenets of cognitive load theory is
necessary.
Cognitive Load Theory
Cognitive load theory is concerned with how meaningful learning can occur when
human cognitive architecture constrains processing in complex tasks (Sweller, 1998).
Constraints are related to Miller’s (1956) proposed functional limit on what can be
attended to and manipulated consciously at one time. Design of instructional approaches
within cognitive load theory takes into account prior knowledge and characteristics of
learners, characteristics of the learning material and learning environment, along with the
interaction between all of these (Renkl, Atkinson, & Grosse, 2004). Critical to
implementing cognitive load theory in educational interventions is a clear understanding
of the key cognitive structures directly involved in information processing.

15
Cognitive architecture and learning: working and long term memory
Current models of cognitive processing describe structures that mediate what is
noticed in the world and what, if anything, is done with that information. The
predominant model is based on depicting information processing in much the same way
as a computer functions. Processing input involves binding to other relevant and
concurrent information so that it can be manipulated. Central to defining cognitive
architecture and its role in designing and testing educational interventions within the
framework of cognitive load theory, is the function and organization of one cognitive
structure, working memory and its relationship to another cognitive structure, long-term
memory (Paas, Renkl, & Sweller, 2004). Working memory is the multi-component
cognitive structure responsible for processing, via elaboration and encoding, information
presented for learning. Information is filtered to some extent based on self-regulatory
mechanisms, allowing entry into working memory (Yuan, Steedle, Shavelson, Alonzo, &
Oppezzo, 2006). Further, executive function refines the filters through which input must
navigate before entering working memory, and may involve emerging or highly
developed metacognitive processes on the part of the learner (Baddeley, 2010; Baddeley,
2000; Baddeley & Hitch, 1994). Once information has entered working memory,
preservation of that information in long-term memory occurs via encoding. Manipulation
of material in working memory may involve very conscious attention (mental effort) or
occur automatically. Efficient management of new information in working memory
involves, in part, more automation in retrieval and elaboration of existing material from
long-term memory. This allows a greater portion of what is left of the limited capacity of
working memory, at a particular moment, free to consciously attend to novel information

16
(Baddeley, 2012). Once information has been stored in long-term memory, learning has
taken place.
Long-term memory, contrary to working memory, is believed to have no known
capacity limit. Richer encoding in working memory allows retrieval to be triggered by
multiple cues. This increases the likelihood that information stored in long-term memory
can be accessed for subsequent use and elaboration (Nadolski, Kirschner, & van
Merriënboer, 2006). The balance is to provide information to be learned in sufficiently
rich formats without having these same formats distract the learner (Moreno, 2004). The
learner may have to decide (consciously) what to do with sound, graphics, words, and
experiential learning all at the same time, taxing the capacity of working memory and
thereby limiting what information is captured and what form makes it to long-term
memory (split-attention effect). This exchange and manipulation of to-be-learned
material between the limited capacity of working memory and the unlimited capacity of
long-term memory illustrates the role of educators in facilitating construction of
knowledge in configurations to maximize storage and enhance retrieval. These
configurations, or groupings, become the basis of successful learning.
Schema construction and schema automation. Chunking or grouping of
related information specific to a particular problem solution, schema, define learning
(Sweller, 1994). As learning progresses in a particular domain, schema become more
complex as new information from repeated practice and problem solving is incorporated
into an existing framework. Most powerful though, is the ability to fully complete a set
of schema and use them on such a regular basis that conscious attention to recall is not
needed. Conscious attention and awareness of that attention is one of the hallmarks of

17
cognitive load. This developed ability to use sets of schema without conscious attention
is critical in the continued development of expert skills. The automaton of schema occurs
over time with repeated practice and use of the schema stored in long-term memory.
Automation can be enhanced when lower level schemas are incorporated into more
complex schemas as learning deepens and experience develops (schema elaboration).
Cognitive load. Cognitive load describes the impact on cognitive resources
associated with completing a task or learning something new. Awareness of cognitive
load is reflected in perceived mental effort as either a single scale or a set of sub-scales.
When a task requires acute attention and is perceived by the learner to be difficult, taxing,
or frustrating, it may be that the individual has reached a point in which the immediate
resources of working memory required to complete the task are overloaded. Meaningful
learning or the ability to complete a task diminishes at this point (Pass, Tuovinen,
Tabbers, & van Gerven, 2003; Paas & van Merriënboer, 1994; van Gog, Kester, & Paas,
2011). Awareness of effort may also be a positive signal of engagement or interest in the
material. Cognitive load theory differentiates load as either supporting schema
construction/automation, germane cognitive load, or detracting from schema
construction/automation, extraneous cognitive load. The latter can be related to the
material itself, intrinsic cognitive load, or the way in which the material is presented.
Intrinsic cognitive load, if it fosters engagement and attention relevant to schema
construction, then contributes to germane cognitive load. Extraneous cognitive load,
intrinsic cognitive load, and germane cognitive load are additive, so if they are not
adapted for different types of learners and materials schema construction and acquisition
of new information is quickly impeded as working memory is taxed and cognitive

18
overload occurs (Paas, Renkl, & Sweller, 2003; van Merriënboer & Sweller, 2005).
When considered together, each of these types of load offer opportunities for educators to
positively impact learning outcomes through careful construction of learning materials
and environments. This is essential, since cognitive load is part of the learning process
and manipulation changes outcomes (Pass, et al., 2003).
Cognitive Load and Worked Example Design
Intrinsic cognitive load. Materials to be learned or tasks that are intellectually
complex contribute specifically to one category of cognitive load, intrinsic cognitive load
(Pollack, Chandler, & Sweller, 2002). Sweller (1994) states, “the primary determinant of
intrinsic cognitive load is element interactivity” (pg. 307). Element interactivity
describes a task that requires the learner to attend to multiple pieces of material
(elements) that cannot be easily separated from one another. These elements interact and
the task cannot be completed, nor schema constructed, without considering all of the
elements together. Complex cognitive skills have high intrinsic cognitive load because
they have a high level of element interactivity. In domains where greater numbers of
interacting elements are common, learners are frequently overwhelmed (Ayers 2006;
Pass, et al., 2003; Paas, Renkl, & Sweller, 2004). Intrinsic cognitive load also involves
the expertise (experience) of the learner in the domain, so learners with lower prior
knowledge may find a task difficult compared to an expert (Pass, Tuovinen, Tabbers, &
van Gerven, 2003; Renkl, Atkinson, & Grosse, 2004). Arguments have been made that
intrinsic cognitive load cannot be directly influenced by instructional design; however,
intrinsic cognitive load reduction can be accomplished by simplifying tasks to reduce
interactivity (Paas, Renkl, & Sweller, 2003; Pass, Tuovinen, Tabbers, & van Gerven,

19
2003; van Merriënboer, Kirschner, & Kester, 2003; van Merriënboer & Sweller, 2005).
Though this may alter learning at a particular stage, it may be necessary with complex,
high-element interactivity tasks.
Pollack, Chandler, & Sweller (2002) conducted a series of four experiments to
test whether isolating elements of a problem while potentially sacrificing some
understanding would prove more effective in actually accomplishing a task when
compared to an interacting elements condition. First year industrial trade students were
randomly assigned to a condition that eliminated the “what” and the “why” of conducting
an insulation resistance test used by electrical engineers (isolated element condition) or a
condition that included this information for the steps in the resistance test (interacting
elements condition). Instructions were provided in each condition via a diagram with
numbered steps in much the same way as a worked example in other domains. The
interacting elements condition provided the “why” information associated with each step.
Results indicated an advantage for those receiving the isolated elements version of the
instructions in the test phase. In addition, mental load ratings were lower in the isolated
elements condition and the relative efficiency of instruction, defined as a relationship
between mental load and performance, was higher (Pollack, et al., 2002). These
observations support modification of learning materials (decreasing intrinsic cognitive
load) in initial stages of learning (for novices). This approach recognizes the paradox of
not having sufficient prior knowledge (schemas) for learning complex material and the
need to provide a learning environment where these schemas can be constructed in the
first place. Elements can be added back in later as the experience of the learner increases
(Paas, et al., 2003; van Merriënboer & Sweller, 2005; van Merriënboer, et al., 2003).

20
Extraneous cognitive load. Extraneous cognitive load includes instructional
materials and environments that require students to spend working memory searching for
procedures or pieces of information that are not relevant to schema construction however
must be addressed to complete a task (Van Gog, Paas, & van Merriënboer, 2008).
Extraneous cognitive load can also be a result of a task environment, for example one that
is perceived as being high stakes. Extraneous cognitive load has frequently been where
cognitive load theory is applied, changing the way material is presented to learners and
where it is presented. Worked examples are particularly effective in reducing extraneous
cognitive load by focusing attention of the learner on the relevant features of a problem
(Gerjets, et al., 2004). Focusing attention is facilitated by worked examples when
educational approaches limit extraneous cognitive load through structuring the impact of
intrinsic cognitive load and encouraging students to invest the remaining cognitive
resources toward schema construction, elaboration, and automation, all parts of germane
cognitive load.
Germane cognitive load. Germane cognitive load enhances learning and, like
extraneous cognitive load, may be more readily manipulated in the learning environment.
Design elements of instruction to increase germane cognitive load support the use of
working memory resources towards construction of schema. Current research in worked
examples is now more focused on how to enhance germane cognitive load (Renkl, et al.,
2004). One way of increasing germane cognitive load is by providing training conditions
where learners are required to practice different versions of a task (context) where
slightly different information is required to complete the task. This contextual inference
effect is a result of increased cognitive load, measured as increased perceived mental

21
effort. It is germane cognitive load and directly contributes to relevant schema
construction (van Merriënboer, Schuurman, Crook, & Paas, 2002). van Merriënboer, et
al. (2002) demonstrated improved training efficiency when comparing high contextual
inference to low contextual inference in a group of engineering students. As predicted,
the high contextual inference group took more time and reported higher mental effort.
More important is that in this experiment students were diagnosing new problems in the
testing environment of dynamic chemical systems, not ones they had seen or practiced
before. This holds promise for performance on novel tasks (van Merriënboer, et al.,
2002).
Example Format and Addition of Principle or Process Information to Worked
Examples
Within the worked example literature, most are molar examples; worked
examples designed to help learners identify structures and main components that help
classify a problem. After learners classify a problem, they then use the learned steps to
solve the problem as a whole. Because of the need to classify problems with this
approach, these examples might encourage students toward a more recipe-like approach
to problem solving which may be a detriment to learning. Molar worked examples direct
the student from one step to the next, requiring that what was encountered in the previous
step be held in working memory to understand the next step. Approaches using this type
of worked example may also give students the illusion of understanding, that they have in
fact also learned the rationale or principles behind the solution steps. This may inhibit
novel problem solving. Simultaneous examples are similar to molar worked examples,
where all the solution components are displayed at one time, so that each step is related to

22
the others and not considered on its own (Atkinson & Derry, 2000). Having to consider
the problem and its solution all at once may defeat one goal of worked examples,
reducing cognitive load, especially intrinsic cognitive load. Molar examples may not
decrease cognitive load in an appreciable way compared to alternative worked example
designs (Gerjets, et al., 2004).
An alternative is a modular worked example. Modular worked examples may
decrease intrinsic cognitive load more effectively by defining sub goals and limiting the
solution search space to the sub goal and not the overall goal. Modular worked examples
provide clues to relevance, order of operations, and associated labels that allow grouping
of steps, potentially improving sub-goal learning. Within the format of modular
examples, structural features that are highlighted also have associated an explicit purpose
for performing that step and can stand alone. This may improve the possibility of
recognizing steps that can be used or adapted in novel problem solving situations. An
experiment designed by Atkinson and Derry, 2000 comparing sequential examples
(modular) with simultaneous examples (molar), reported improved understanding of
examples and improved performance on post-test problems for subjects in the sequential
examples condition. The sequential examples of Atkinson and Derry (2000) are similar
to modular examples in that the learner is presented an unsolved example or case with
each step successively added with the final page representing the entire solution.
Gerjets, Scheiter, & Catrambone (2004) were able to demonstrate improved
performance on isomorphic as well as novel problems when the modular example
condition was compared to those studying molar examples. In addition, they replicated
the experiment and introduced an alternative tool to measure perceived cognitive load,

23
the NASA-Task Load Index (NASA- TLX) questionnaire (Hart, 2008; Hart and
Staveland, 1988). In study five by Gerjets, et al., (2004), modular examples were
changed to include or exclude instructional elaborations (principled or process
information). Elaborations improved performance measures in the modular group
compared to the molar group with elaborations. Most promising was that when modular
examples included elaborations, performance improved when compared to the molar
group. The NASA-TLX revealed decreased perceived task demands, stress, and effort
for those in the modular examples, including elaborations compared to modular examples
without elaborations (Gerjets, et al., 2004).
In an extension of their previous work with modular examples, Gerjets, Scheiter,
& Catrambone (2006) compared modular examples at three levels of instructional
elaboration (low, medium, high). Subjects were German undergraduate students of
differing majors. Students were considered novices when it came to calculating
complex-event probabilities. Subjects were told that they had to acquire knowledge in
four different categories explained by a series of worked examples. In addition to
performance measures and time on task, the NASA-TLX was used again with an added
category of perceived success in understanding the examples. Results indicated more
time was spent studying the medium and high elaborated examples. Elaborations did not
improve performance on isomorphic problems within the modular examples; however,
the medium to high elaborated examples rated perceived success higher while
simultaneously reporting less study effort (lower cognitive load). An additional finding
indicated that providing more instructional explanations concerning rationale behind the
solution steps provided no clear benefit on problem-solving performance, negatively

24
impacting efficiency because the examples took longer to study (Gerjets, Scheiter, &
Catrambone, 2006).
One way to examine the use of modular worked examples is to further delineate
between modular examples that list each sub goal, product-oriented worked examples
(PDWE) and those that list each sub goal in addition to providing instructional
elaborations, process-oriented worked examples (PSWE). Ultimately, the schemas for
problems within a domain could become more elaborate using the PSWE approach and
may deepen learning and promote understanding providing learners with an advantage
when solving novel problems. On the other hand, some empirical evidence seems to
support sub goal oriented worked example without elaborations. The advantage to
adding process information for PSWE is not clear. There is space for research in the area
comparing PDWE to PSWE for novices to determine if modular worked examples
support learning and transfer and if PSWE are superior to PDWE on isomorphic and
novel tasks.
Design Elements of Process-Oriented and Product-Oriented Worked Examples
Process-oriented and product-oriented worked examples meet the definition of
modular examples. PDWE depict independent solution steps for a problem after it has
been presented. There is no rationale provided for taking certain steps in PDWE (van
Gog, Paas, & van Merriënboer, 2006). The steps are numbered with the step labeled and
the associated answer for that step in the solution. PSWE adds domain-principled
explanations to each solution step, the “how” and “why”. Providing students with the
purpose of the solution steps in a procedure has the potential to effectively increase
germane cognitive load. This occurs not only through identification of recurrent

25
elements highlighted in the process steps; but also for non-recurrent skills, potentially
enhancing transfer performance especially for transfer tasks (novel) that may have
slightly different features where following a memorized procedure or set of steps will not
work (van Gog, et al, 2004; van Gog, et al, 2006).
Criticism of worked example approaches exists, especially when considering the
level of prior knowledge or experience of students in a domain (Leslie, Low, Jin, &
Sweller, 2012). For learners with lower prior knowledge, the worked examples may
increase germane cognitive load to the point where learning is impeded by increasing
overall cognitive load (van Gog, Paas, & van Merriënboer, 2008). To discern whether
one type of worked example is more effective than another, an evaluation should address:
(1) reducing extraneous cognitive load and intrinsic cognitive load as suggested by
cognitive load theory, (2) engaging the students such that students will actually devote
the attention needed in the learning phase to benefit from the worked example approach
providing germane cognitive load, and (3) clearly identifying the population of students
worked examples are being designed for, so content is structured for the level of prior
knowledge (van Gog, et al., 2004; van Gog, e al., 2006; van Gog, et al., 2008).
Framing the worked example experiment for level of prior knowledge and
engagement include describing the role of the student as part of a team of individuals
where their input and ideas are critical (Engle, et al., 2012). In the context of training
nutrition professionals, this can be used to situate the student as a member of the
healthcare team as the expert with specific nutrition diagnostic and treatment information
to be incorporated into overall care for an individual. Likewise, there is evidence to
suggest that providing cues to direct student attention to relevant features of a problem
26
will aid the student in developing an explicit problem schema that will trigger a particular
solution path when a new problem is presented (Gick & Holyoak, 1983; Gobet, 2005).
These schemas then may improve transfer to the novel problem by adding some
protection from contextual changes, surface features that occur between learning the
material and later application (Catrambone & Holyoak, 1989). Therefore, expansive
framing for context and the inclusion of cues to notice problem features creates an
expectation for transfer (novel problem solving). This may increase student engagement
and support the notion of utility value for the new material potentially improving
performance when faced with a novel problem (Engle, et al., 2012). This approach aligns
with the worked example approach, specifically PSWE.
The intent in complex learning environments is identification of deep structural
similarities and relationships between elements of the problem so that prior learning and
the new context can be connected, leading to newly constructed schemas and advanced
knowledge, all elements of emerging expertise in a particular domain (Gobet, 2005). At
issue is the reality that new problems that could be approached using previously learned
information or strategies do not always have similar surface structures and it is the deeper
structure that may be a clue to a solution (Day & Goldstone, 2012). Labeling structure
and drawing attention in a learning phase, such as worked examples, may make
recognition, and therefore the solution, more achievable (Catrambone & Holyoak, 1989;
Gobet, 2005). Perkins and Salomon (2012) suggest that this skill of detection can be
developed by a variety of educational experiences. The discrepancies noted might be the
most powerful in motivating a student to take the next step, or elect to explore the
relationship of the discrepancies (Wigfield & Eccles, 2000). An example is a clinical

27
case study example where the relationships between the discrepancies and interaction of
elements are features of complex tasks. The modular worked example formats proposed
in this research offer example problems that explicitly label features to detect
discrepancies and connect information in the example to prior knowledge.
Measures of Perceived Cognitive Load and Mental Effort
Paas and van Merriënboer (1993) suggest cognitive load assessment should
include the elements of mental effort, mental load, and performance; however, in practice
there are differing approaches depending on the investigator and what the measures are
intended to contribute to evaluation of a particular educational intervention or design
(Pass, et al, 2003). If changes or approaches to instructional design are situated within
cognitive load theory, by definition one of the goals is to decrease cognitive load while
achieving acceptable learning outcomes. Physiologic and subjective measures of mental
load have been used by investigators to estimate cognitive load. In most educational
settings, the specialized equipment required to document physiologic changes related to
cognitive load are usually impractical. Subjective measures assume that learners can
reflect on the learning task and rank the amount of mental effort spent on a particular task
(Paas, van Merriënboer, & Adam, 1994). Frequently, a nine- point scale from very, very
low mental effort (1) to very, very high mental effort (9), suggested by Paas and van
Merriënboer, is used, sometimes adapting the language of difficulty to the age of subjects
(Paas & van Merriënboer, 1993; Paas, van Merriënboer, & Adam, 1994). This subjective
measure, a task based indicator, can be used in the learning phase and in the performance
phase of an investigation of educational approaches. Evidence suggests that student
report of intensity of effort is the essence of cognitive load and the measurement of effort,

28
using this scale, can be used reliably as an index of cognitive load (Ayres, 2006; Paas, et
al., 1994).
Performance, correct answers or proficiency, is used frequently as an outcome for
many educational approaches. If tied to mental effort or mental load, it is possible to
ascertain at what cost performance occurred. For example, students in two different
learning conditions may have the same score on a performance measure; however,
students in one condition perceived their mental effort or cognitive load, the amount of
resources allocated, to be much higher than those in the other condition. In this example,
the condition that resulted in better or equal performance with a lower score of mental
effort might in fact leave room for additional material and richer schema construction,
with a presumed increase in germane cognitive load, than the condition where load was
perceived higher (Ayers, 2006; Pass, et al., 1994; Pass, Tuovinen, Tabbers, & van
Gerven, 2003). Additionally, this efficiency rating, acceptable performance with lower
mental effort/perceived cognitive load, could be used to evaluate differences between
learning conditions. The computational approach for efficiency involves calculating z scores for
mental effort and performance measures to compute an instructional condition efficiency
score (E) via the following formula (Pass, et al., 2003):
E=
√
Results are graphed on a Cartesian axis with performance on the vertical and mental
effort on the horizontal with group or individual efficiency scores plotted as a distance
from the E=0 line, passing from the lower left to the upper right of the grid. The upper
left of the grid represents the highest efficiency and the lower right the lowest efficiency
29
(Pass, et al., 2003). Results can be computed and reported for students or groups by
instructional condition. Two interpretations of efficiency exist in the literature, one using
mental effort (perceived cognitive load) in the learning phase paired with performance
scores in the transfer phase (adapted version) and the other considers mental effort and
performance scores in the transfer phase (van Gog, et al., 2006; van Gog, et al., 2008).
Criticisms of a single scale of mental effort, as proposed by Paas & van
Merriënboer (1993), for perceived cognitive load, a multi-dimensional construct, stem
from the lack of individual measures of intrinsic cognitive load, extraneous cognitive
load, and germane cognitive load (Ayers, 2006; Moreno, 2006). Ayers (2006); however,
reported results of two experiments that demonstrate a relationship between changes in
element interactivity that are reflected in subjective rankings of task difficulty and
provide evidence of intrinsic cognitive load. In both experiments, eighth and ninth grade
students were given a series of bracket expansion tasks (multiplication). Students had all
been exposed to this material in the course of their school curriculum. Ayers used a
modified seven-point scale for mental effort after each problem. Interestingly, in both
experiments, which grouped students by levels of math skill for analysis, mental effort
was highly correlated with error rates, indicating that those with higher reported mental
effort made more errors (r=0.85; r=0.74 respectively) (Ayers, 2006).
The NASA-TLX offers an alternative to the criticism of the one item Paas scale
(Hart & Staveland, 1988). It has been used in two experimental designs relevant to this
proposed research (Gerjets, et al., 2004; Gerjets, et al., 2006). The NASA-TLX has six
subscales that can be considered as a total score or separate subscale scores. Gerjets, et
al., (2004 &2006) combined the six subscales into five: task demands, time demand,

30
success, effort, and stress. There is evidence for the validity of use in a number of
environments (Hart, 2008; Rubio, Diaz, Martin, & Puente, 2004). In this application, the
NASA-TLX with five subscales has the potential to be more sensitive than the one item
Paas scale to the subjective assessment of subjects and contribute more information for
interpretation of results.
Summary and Implications for the Current Study
Based on the literature review, teaching nutrition diagnosis skills using worked
examples offers a structured format that could be incorporated into all levels of nutrition
education. According to cognitive load theory, worked example types need to be chosen
based on the prior knowledge of the targeted learners and the content of the worked
examples tailored to the stage of skill acquisition. The instructional design approach in
this study specifically focuses on two variations of modular worked examples for the
primary reason that learning stand-alone steps offers students a chance at incremental
knowledge and skill acquisition since each part of the diagnostic process could be
considered a separate skill. The difference between the two conditions of worked
examples addresses the tendency of healthcare educators to provide background
information related to problem solving that may or may not make it easier for the student
to learn the relevant concepts. The advantage to adding process information
(background) is not clear. There is a gap in the research comparing PDWE to PSWE for
novices. The design of this worked example research, with a specific focus on PSWE,
identifies how cognitive load theory and the measurement of perceived cognitive load aid
in determining the benefit of worked examples in teaching nutrition diagnosis and how

31
perceived cognitive load might be used to elucidate differences and potential advantages
to certain categories of worked example instructional formats.
32
Chapter 3
METHODS
Introduction
The following sections describe the detailed methods that were used to compare
two types of modular worked examples; process-oriented (PSWE) and product-oriented
(PDWE), for performance, cognitive load, and efficiency for nutrition diagnosis.
The sections describe the participants, all study material and procedures for data
collection and analyses. The pilot study, conducted to test and modify the procedures and
instruments, is followed by the description of the main study.
The Pilot Study
Participants
Participants in the pilot study were nineteen undergraduate students attending a
large southwestern university in the United States. Participants in the pilot study
responded to recruitment flyers and to a short presentation requesting participation given
by the investigator. At the time of the pilot, students were enrolled in an undergraduate
nutrition course. To be eligible, students had to have taken NUTR 244, a broad
introductory course in human nutrition typically taken by those pursuing a career in
healthcare or the biological sciences. Participants were novices in nutrition, having just
begun the study of human nutrition and the associated biology and chemistry courses that
accompany course work in an undergraduate program (Ayers, Greer-Carney, Fatzinger
McShane, Miller, & Turner, 2012). Students completed the pilot study in March 2014.
33
Participation was independent of any course requirement. All participants completed all
portions of the study.
Measures
Demographic questionnaire. Demographics for the undergraduate students
included age, gender, ethnicity, intention to pursue a career as a nutrition provider
(motivation), nutrition course taken when participating in the study, and expected grade
in the course, and the number of college nutrition courses taken (Appendix A) (Gross &
Renkl, 2007; van Gog, et al., 2006).
Prior knowledge. Scores on a 12-item test of general human nutrition concepts
that are typically covered in NUTR 244, the course taken by the target population, were
used to assess prior knowledge (Appendix B). This set of questions was constructed
specifically for this research. Prior knowledge is an integral part of determining potential
benefits of worked example research and structuring worked examples to meet the needs
of the intended group of students.
Measure of perceived cognitive load. Perceived cognitive load was assessed by
having participants complete the NASA Task Load Index (NASA-TLX) at each phase;
learning, practice, and maintenance (Hart & Staveland, 1988). It contains subscales of
mental effort, success, stress, time demand, and task demand (Appendices C, D, & E).
Perceived cognitive load is integral to the interpretation of results of research situated in
cognitive load theory. The NASA-TLX in this study is used as an alternative to the
single scale of mental effort, as proposed by Paas & van Merriënboer (1993), for
perceived cognitive load, a multi-dimensional construct. The subscales of time demand
and stress can be linked to extraneous cognitive load, the subscale of success to germane

34
cognitive load, the subscales of task demand and time demand to intrinsic cognitive load
and the effort rating to overall cognitive load.
Problem, Etiology, and Signs and Symptoms statement (PES) score. Scores
for performance on diagnostic tasks in the practice and maintenance phases were
obtained by scoring the diagnostic task recorded by the participants in the PES statement
grid (same grid presented in the learning phase) for use of the correct diagnosis term
(IDNT), correct placement of required elements, and etiology and signs and symptoms
that corresponded with the diagnostic term. (Appendices F, G, H, & I) The PES format is
the required structure for communicating nutrition diagnoses based on International
Dietetics and Nutrition Terminology in the medical record. The PES scoring rubric is
divided into three sections for the diagnosis; (Problem-P) eight points, etiology (Etiology-
E) two points, and signs and symptoms (Signs and Symptoms-S) two points for a total of
12 possible points. A score of eight or better (>67.5%) was considered good
performance.
Materials
International Dietetics and Nutrition Terminology (IDNT) guide. A one page,
abridged guide with only IDNT for the intake domain was provided to students to use in
the learning, practice and maintenance phases. IDNT used for this study was limited to
the intake domain in an abridged version to narrow the focus for these novice students to
a smaller subset of possible diagnostic terms. The intake domain of IDNT is the primary
area of expertise for nutrition providers. The intake domain is a focus of all educational
approaches to teaching emerging nutrition professionals in the use of IDNT and in this
context simplifies the number of interaction elements in a whole task representation and

35
should decrease intrinsic cognitive load for these novice students (Simon, Faut, &
Wooley, 2009) (Appendix J).
Learning phase cases. Two cases with the same clinical content were presented
to students either in a PDWE or PSWE format. Each line of text in the cases and clinical
information was numbered. Both conditions of worked example cited the numbered lines
in the cases when items were identified as part of the diagnosis and transcribed into the
PES diagnostic format. The cases were presented in a written narrative in much the same
way one would hear or review a case in a healthcare setting. This case format is familiar
to students as it is the most common way to present this type of problem in nutrition
courses. The worked example format followed, outlining the solution steps in either a
PDWE (Appendix K) or PSWE (Appendix L) condition. One case had one possible
diagnosis and the other, two possible diagnoses. The last part of the worked example
showed a completed PES diagnostic statement (in a grid format similar to fields on a
standardized chart note (paper) or electronic medical record field. Cases presented
assessment results such that no calculations were required to interpret the cases.
Participants reported perceived cognitive load using the NASA-TLX after studying the
learning phase examples.
Practice and maintenance phase cases. Participants were asked to diagnose two
cases, one that was similar to the learning phase (isomorphic), case number one and one
that was dissimilar (novel), case number two. Cases in each phase were identical for both
conditions. The cases were presented in a written narrative in much the same way one
would hear or review a case in a healthcare setting. This case format is familiar to
students as it is the most common way to present this type of problem in nutrition

36
courses. Cases presented assessment results such that no calculations were required to
interpret the cases. Participants reported perceived cognitive load (mental effort) after
completing the practice and maintenance phase cases. Students completed the PES
diagnostic statement (in a grid format similar to fields on a standardized chart note
(paper) or electronic medical record field. Students wrote the IDNT chosen from the
provided guide and either rewrote or included the numbered lines from the case
corresponding to the elements they wished to include in the correct portions of the PES
diagnostic grid. (Appendix M & N)
Design
The study was conducted as a comparison by worked example condition, process-
oriented (PSWE) or product-oriented (PDWE), with a priori covariates of intention to
pursue a career as a nutrition provider (motivation) and scores on a 12-item test of
general human nutrition concepts that are typically covered in NUTR 244 to determine
prior knowledge. Session one consisted of a learning phase and practice phase.
Participants were randomized to either PDWE or PSWE. The learning phase consisted of
two worked examples, one with a single diagnosis and the other with two diagnoses,
within the intake domain of IDNT. Limiting diagnoses to the intake domain will
decrease intrinsic cognitive load as well as reinforce the intake domain as the primary
area where registered dietitians intervene to provide nutrition care. Cases were the same
for both conditions and varied only in whether the worked examples were PSWE or
PDWE. In the practice phase, participants were asked to diagnose two cases, one that
was similar to the learning phase (isomorphic), case number one, and one that is
dissimilar (novel), case number two, after studying the worked examples in the learning

37
phase. Cases in the practice phase were identical for both conditions. Participants
reported perceived cognitive load for the learning phase examples and the practice phase
cases using the NASA-TLX. Participants were allotted up to one hour and fifteen
minutes, a typical class period, combined, for both the learning and practice phases in
session one.
Two weeks later, a follow-up maintenance phase, session two, was conducted to
assess maintenance of learning. Cases in the maintenance phase were identical for both
conditions. Participants had up to 45 minutes, one-half a typical class period, to complete
the maintenance phase tasks. Participants reported perceived cognitive load for the
maintenance phase cases using the NASA-TLX.
The goal of the pilot study was to ascertain the clarity of instruction, structure of
the case studies, timing, refinement of the scoring rubric for the diagnostic tasks in the
practice and maintenance phases, and use of the cognitive load measure.
The schematic represented in Figure 1 outlines the study processes.

38
Figure 1. Schematic of Study
Schematic of Study
Human Subjects Protections
Participants were asked to give informed, signed consent to allow the investigator
to use the results of their participation in the worked example experiment. Informed,
signed consent consistent with the University Of New Mexico main campus Internal
Review Board (Parkes/Bennett 13-874), for the pilot study was obtained after students
arrived at the location for pilot study participation. (Appendix O)

39
Procedures
Participants in the pilot study responded to recruitment flyers and a short
presentation requesting participation given by the investigator in an undergraduate
nutrition course. This convenience sample was chosen to meet the requirement of novice
nutrition provider. Participants must have taken the prerequisite NUTR 244 course that
contains the same course objectives as the courses that comprise the targeted sample at
the community college for the dissertation study.
Participants had one hour and fifteen minutes, to complete the learning and
practice phase. The maintenance phase was conducted the same way two weeks later
with one-half of a class period, about 45 minutes, allowed for completion. The study
took place in a classroom setting on the campus of a large southwestern university
outside of regularly scheduled class time. All participants in the pilot study completed
the portions of the study at two separate times that accommodated the schedule of
interested participants. Students in the pilot study were compensated with a gift card to a
local restaurant for completing both portions of the pilot study, the initial session
(learning and practice phases) and the follow-up maintenance phase.
Participants were randomly assigned to one of two worked example conditions
when they arrived at the first session; product oriented worked examples (PDWE) or
process-oriented worked examples (PSWE). Experimental materials were distributed to
students in large envelopes of the same color, with a small sticker on the back that
identified the condition as PSWE or PDWE. After the session, all materials were
returned to the investigator inside the large envelope. Students completed all tasks using
40
a pencil or pen and the provided materials. Study materials were designed to be used
without a calculator.
The large envelope for session one contained two additional different colored
envelopes. Colors corresponded to learning or practice tasks. Before beginning the
learning phase, participants signed the consent form, completed the demographic
information page, and completed the prior knowledge test. Participants completed the
learning tasks first and returned all the learning materials to that envelope before
proceeding with the practice tasks. Participants had the entire period to complete both
learning and transfer tasks. Students wrote the time on each envelope (read from a large
digital clock supplied by the investigator) after completion of each phase. A graduate
student intern assisting with data collection kept time so that an average could be
determined for that section of the study if the recorded time was missing from the
participant envelopes.
The learning phase envelope contained all the materials needed for this phase: an
introduction to participants describing (framing) their role as nutrition providers in this
setting and a brief overview of the role of IDNT and the PES diagnostic format for
communicating nutrition diagnosis in the medical record, worked example cases with
completed PES diagnostic statement answer grid, perceived cognitive load questions
(NASA-TLX); and the IDNT guide for the intake domain. The investigator was present
to answer process questions and clarify study requirements and informed consent during
each session.
For session two, two weeks later, the maintenance phase envelope contained all
materials needed for this phase: an explanation of the task in the maintenance phase;

41
cases; PES diagnostic answer grid; perceived cognitive load questions (NASA-TLX); and
IDNT guide for the intake domain.
Data Analyses
A series of one way ANOVAs were conducted, for between-subjects, with the
dependent variables scores on the diagnostic tasks (PES statements), perceived cognitive
load scores in learning, practice and maintenance phases, and calculated efficiency; with
the independent variable worked example condition of either PDWE or PSWE. The
alpha for statistical significance testing was set at α=0.05. Prior nutrition knowledge and
intention to pursue a career as a nutrition provider (motivation) were identified a priori as
covariates with the plan of using one way ANCOVA. Initial inspection of the pilot study
data revealed that since this convenience sample was so homogeneous, 89.5% intended to
pursue a career as nutrition professional, using this as a covariate was not helpful in
interpreting results. Similarly, the scores on the prior knowledge test were uniformly
high (PSWE M=9.8/12, SD=1.5; PDWE M=10.2/12, SD= 1.3), did not differ between
groups, (F (1, 17) = .408, p=.531), and did not correlate highly with the dependent
variables. ANCOVA with these covariates was not used with the pilot study sample.
The computational approach for efficiency involved calculating z scores for
mental effort and performance measures and computing an instructional condition
efficiency score (E) via the following formula (Pass, et al., 2003):
E=
√
Efficiency scores (E) were calculated for each diagnostic task for each worked example
condition. A one way ANOVA was conducted on the practice phase cases and the
maintenance phase cases by worked example condition.

42
Time stamps from the pilot study were reviewed to determine if sufficient time
was allotted to the learning and transfer tasks. This data was used in securing
Institutional Review Board approval at the community college as there were concerns
that students would not be able to complete the study within a regularly scheduled class
period. Additionally, any comments students wrote on their study materials were
reviewed to determine the need for modifications in the materials provided to participants
prior to the main dissertation study.
All of the diagnostic tasks (PES diagnostic statements) were scored by the
investigator using a rubric designed by the investigator for the cases in the experiment.
To check the scoring rubric, a random sample of the PES diagnostic statements was
scored by a University of New Mexico nutrition faculty volunteer using the investigator’s
rubric. Scores and score agreement were examined to determine if any modifications in
the scoring rubric needed to occur.
The PES scoring rubric was divided into three sections for the diagnosis;
(Problem-P) eight points, etiology (Etiology-E) two points, and signs and symptoms
(Signs and Symptoms-S) two points for a total of 12 possible points. A score of eight or
better (>67.5%) was considered good performance as it is close to the requirement of
70% on most licensing or proficiency exams in healthcare. Each PES section was scored
separately since each represents a slightly different aspect of diagnostic skill. Each
diagnostic task, three in the practice phase and three in the maintenance phase, had
specific diagnostic codes and assessment elements that resulted in a score (Appendices F,
G, H, & I).
43
For the diagnosis code (Problem-P), a score of eight was given if the diagnosis
name and number matched the rubric. Four was scored if not as precise a diagnosis, two
if it was related but broader and less specific than the diagnosis that would have scored
four, and zero if it did not match anything on the rubric or was not present. For the
etiology (Etiology-E), two points were given for a match on the scoring rubric, one point
for a related etiology outlined on the rubric, but not the root cause, and zero if it was not
an etiology, related, or blank. For the signs and symptoms section (Signs and Symptoms-
S) two points were given for a match on the scoring rubric, one point for related, but
missing objective measurable signs (quantitative data from the case study such as
anthropometrics or laboratory studies) and zero if not a symptom or sign, or blank
(Appendices F, G, H, & I).
The Main Study
Participants
Participants were 104 undergraduate students in eight separate class sessions at a
community college with ties to a large southwestern university and the undergraduate
nutrition bachelors program. To be eligible, participants had to be currently enrolled in
one of two introductory nutrition courses, NUTR 2110 or NUTR 1015, both broad
introductory courses in human nutrition typically taken by those pursuing a career in
healthcare or the biological sciences. These participants were novices in nutrition, having
just begun the study of human nutrition and the associated biology and chemistry courses
that accompany course work in the first two years of an undergraduate nutrition program
(Ayers, et al., 2012).

44
Measures
Demographic questionnaire. Demographics for the undergraduate students
included age, gender, ethnicity, intention to pursue a career as a nutrition provider
(motivation), nutrition course taken when participating in the study, and expected grade
in the course (motivation), and the number of college nutrition courses taken (Appendix
A) (Gross & Renkl, 2007; van Gog, et al., 2006).
Prior knowledge. Scores on a 12-item test of general human nutrition concepts
that are typically covered in NUTR 244, the course taken by the target population, was
used to assess prior knowledge (Appendix B). This set of questions was constructed
specifically for this research. Prior knowledge is an integral part of determining potential
benefits of worked example research and structuring worked examples to meet the needs
of the intended group of students.
Measure of perceived cognitive load. Perceived cognitive load was assessed by
having participants complete the NASA Task Load Index (NASA-TLX) at each phase;
learning, practice, and maintenance (Hart & Staveland, 1988). It contains subscales of
mental effort, success, stress, time demand, and task demand (Appendices C, D, & E).
Perceived cognitive load is integral to the interpretation of results of research situated in
cognitive load theory. The NASA-TLX in this study is used as an alternative to the
single scale of mental effort, as proposed by Paas & van Merriënboer (1993), for
perceived cognitive load, a multi-dimensional construct. The subscales of time demand
and stress can be linked to extraneous cognitive load, the subscale of success to germane
cognitive load, the subscales of task demand and time demand to intrinsic cognitive load,
and the effort rating to overall cognitive load.

45
Problem, Etiology, and Signs and Symptoms statement (PES) score. Scores
for performance on diagnostic tasks in the practice and maintenance phases were
obtained by scoring the diagnostic task recorded by the participants in the PES statement
grid (the same grid presented in the learning phase) for use of the correct diagnosis term
(IDNT), correct placement of required elements, and etiology and signs and symptoms
that corresponded with the diagnostic term (Appendices F, G, H, & I). The PES format is
the required structure for communicating nutrition diagnoses based on International
Dietetics and Nutrition Terminology in the medical record. The PES scores were
obtained using the rubric tested in the pilot study.
Materials
International Dietetics and Nutrition Terminology (IDNT) guide. A one page,
abridged guide with IDNT only for the intake domain, was provided to students to use in
the learning, practice and maintenance phases. IDNT used for this study was limited to
the intake domain in an abridged version to narrow the focus for these novice students to
a smaller subset of possible diagnostic terms. The intake domain of IDNT is the primary
area of expertise for nutrition providers. The intake domain is a focus of all educational
approaches to teaching emerging nutrition professionals in the use of IDNT and, in this
context, simplifies the number of interaction elements in a whole task representation and
decreases intrinsic cognitive load for these novice students (Simon, et al., 2009)
(Appendix J).
Learning phase cases. Two cases with the same clinical content were presented
to students either in a PDWE or PSWE format. Each line of text in the cases and clinical
information was numbered. Both conditions of worked example cited the numbered lines
46
in the cases when items were identified as part of the diagnosis and transcribed into the
PES diagnostic format. The cases were presented in a written narrative in much the same
way one would hear or review a case in a healthcare setting. This case format is familiar
to students as it is the most common way to present this type of problem in nutrition
courses. The worked example format followed, outlining the solution steps in either a
PDWE (Appendix K) or PSWE (Appendix L) condition. One case had one possible
diagnosis and the other, two possible diagnoses. The last part of the worked example
showed a completed PES diagnostic statement (in a grid format similar to fields on a
standardized chart note (paper) or electronic medical record field. Cases presented
assessment results such that no calculations were required to interpret the cases.
Participants reported perceived cognitive load using the NASA-TLX after studying the
learning phase examples.
Practice and maintenance phase cases. Participants were asked to diagnose two
cases, one that was similar to the learning phase (isomorphic), case number one, and one
that was dissimilar (novel), case number two. Cases in each phase were identical for both
conditions. The cases were presented in a written narrative in much the same way one
would hear or review a case in a healthcare setting. This case format is familiar to
students as it is the most common way to present this type of problem in nutrition
courses. Cases presented assessment results such that no calculations were required to
interpret the cases. Participants reported perceived cognitive load (NASA-TLX) after
completing the practice and maintenance phase cases. Students completed the PES
diagnostic statement in a grid format similar to fields on a standardized chart note (paper)
or electronic medical record field. Students wrote the IDNT chosen from the provided

47
guide and either rewrote or included the numbered lines from the case corresponding to
the elements they wished to include in the correct portions of the PES diagnostic grid.
(Appendices M & N)
Design
The study was conducted as a comparison by worked example condition, process-
oriented (PSWE) or product-oriented (PDWE), with a priori covariates of intention to
pursue a career as a nutrition provider (motivation) and scores on a 12-item test of
general human nutrition concepts that are typically covered in introductory nutrition
courses such as NUTR 2110 or NUTR 1015 to determine prior knowledge.
Session one consisted of a learning phase and practice phase. Participants were
randomized to either PDWE or PSWE. The learning phase consisted of two worked
examples, one with a single diagnosis and the other with two diagnoses within the intake
domain of IDNT. Limiting diagnoses to the intake domain decreases intrinsic cognitive
load as well as reinforces the intake domain as the primary area where registered
dietitians intervene to provide nutrition care. Cases were the same for both conditions
and varied only in whether the worked examples were PSWE or PDWE.
In the first transfer phase (practice phase), participants were asked to diagnose
two cases, one that was similar to the learning phase (isomorphic), case number one, and
one that was dissimilar (novel), case number two, after studying the worked examples in
the learning phase. Cases in the practice phase were identical for both conditions.
Participants reported perceived cognitive load for the learning phase examples
and the practice phase cases. Participants were allotted up to one hour and fifteen
minutes, one whole class period, combined, for both the learning and practice phases in
session one.

48
Two weeks later, a follow-up maintenance phase, session two, was conducted to
assess maintenance of learning. Cases in the maintenance phase were identical for both
conditions. Participants had up to 45 minutes, approximately one-half a class period, to
complete the maintenance phase tasks. Participants reported perceived cognitive load
(NASA-TLX) for the maintenance phase cases.
Human Subjects Protections
Participants were asked to give informed, signed consent to allow the investigator
to use the results of their participation in the worked example experiment in their
nutrition class sessions consistent with the Central New Mexico Community College
Institutional Review Board (Bennett 011314) (Appendix P). Consent allowed the
investigator to use the results of their participation in the worked example experiment to
evaluate worked examples for teaching nutrition diagnosis. Faculty consent, consistent
with the Central New Mexico Community College Institutional Review Board (Bennett
011314) (Appendix Q) was required before the investigator was allowed to engage the
students in the worked example experiment. Participation fulfilled a course requirement
within the structure of the class for students in classes that faculty consent was obtained.
Students who did not consent to have the results of their work used by the investigator
worked with the study materials in both sessions; however, data from their work was not
included and study materials were shredded at the completion of the experiment.
Procedures
In class sessions where faculty consent was obtained, participants were asked o
give informed, signed consent to allow the investigator to use the results of their
participation in the worked example experiment.
49
Participants had one hour and fifteen minutes to complete the learning and first
transfer (practice) phase. The maintenance transfer phase was conducted the same way
two weeks later with one-half of a class period, about 45 minutes, allowed for
completion. Both sessions of the study took place during a regularly scheduled class
session on the campus of a community college with ties to a large southwestern
university.
Participants were randomly assigned to one of two worked example conditions,
product oriented worked examples (PDWE) or process-oriented worked examples
(PSWE), when they arrived at the first session. Experimental materials were distributed
to students in large envelopes of the same color, with a small sticker on the back that
identified the condition as PSWE or PDWE. After the session, all materials were
returned to the investigator inside the large envelope. Students completed all tasks using
a pencil or pen and the provided materials. Study materials were designed to be used
without a calculator.
The large envelope for session one contained two additional different colored
envelopes. Colors corresponded to learning or practice tasks. Before beginning the
learning phase, participants signed the consent form, completed the demographic
information page, and completed the prior knowledge test. Participants completed the
learning tasks first and returned all the learning materials to that envelope before
proceeding with the practice tasks. Participants had the entire period to complete both
learning and transfer tasks. Students wrote the time on each envelope (read from a large
digital clock supplied by the investigator) after completion of each phase. A graduate
student intern assisting with data collection kept time so that an average could be

50
determined for that section of the study if the recorded time was missing from the
participant envelopes.
The learning phase envelope contained all the materials needed for this phase: an
introduction to participants describing (framing) their role as nutrition providers in this
setting, a brief overview of the role of IDNT, the PES diagnostic format for
communicating nutrition diagnosis in the medical record, worked example cases with
completed PES diagnostic statement answer grid, perceived cognitive load questions
(NASA-TLX); and IDNT guide for the intake domain. The investigator was present to
answer process questions and clarify study requirements and informed consent during
each session.
For session two, two weeks later, the maintenance phase envelope contained all
materials needed for this phase: an explanation of the task in the practice phase; cases;
PES answer grid; perceived cognitive load questions (NASA-TLX); and IDNT guide for
the intake domain.
Data Analyses
A series of one way ANCOVAs were conducted for between-subjects, with the
dependent variables scores on the diagnostic tasks (PES statements), perceived cognitive
load scores in learning, practice and maintenance phases, and calculated efficiency with
the independent variable worked example condition of either PDWE or PSWE. The
alpha for statistical significance testing was set at α=0.05. Prior nutrition knowledge and
intention to pursue a career as a nutrition provider (motivation) were identified a priori as
covariates. Initial inspection of the study data revealed this sample was homogeneous
with regard to pursuing a career as a nutrition professional, 85.6% did not intend to
51
pursue a nutrition career, so using this as a covariate was not helpful in interpreting
results. The scores on the prior knowledge test did correlate highly with the dependent
variable, so ANCOVA with the covariate of prior knowledge was used with the main
dissertation study sample.
The computational approach for efficiency involved calculating z scores for
mental effort and performance measures to compute an instructional condition efficiency
score (E) via the following formula (Pass, et al., 2003):
E=
√
Efficiency scores (E) were calculated for each diagnostic task for each worked example
condition. A one way ANOVA was conducted on the practice phase cases and the
maintenance phase cases by worked example condition.
All of the diagnostic tasks (PES statements) were scored by the investigator using
a rubric designed for the cases in the experiment in the same manner as for the pilot
study. Comments written by participants on their study materials were reviewed to
identify themes associated with any difficulty with the study materials and if any of the
study materials were familiar to participants.
Secondary analysis. High scores on the PES diagnostic statements (> 8 of 12)
were explored to determine if any relationships existed between student demographics
and prior knowledge.

52
Chapter 4
RESULTS
Introduction
This study investigated two types of modular worked examples; process-oriented
(PSWE) and product-oriented (PDWE), for performance, cognitive load, and efficiency
for nutrition diagnosis. This chapter reports the results of statistical analyses to answer
the research questions proposed in Chapter One. Results of the pilot study are followed
by results of the main study and an overall summary.
Pilot Study
Data for the pilot study was analyzed using a one-way ANOVA. An α= 0.05 was
chosen for determining statistical significance. This was deemed a reasonable
compromise between Type I and Type II error. Effect sizes for relationships that reached
a level of statistical significance are the most important for interpretation of group
differences. Correlations were interpreted at an α= 0.05 to identify any variables that
were identified as a priori covariates that should in fact be further investigated before
including them in the model. Statistically significant correlations were not identified as
dependent variables in the study and no hypotheses were structured around interpretation
of the correlations. For those variables analyzed using one-way ANOVA, tests for
assumptions (normality, homogeneity of group variances) were evaluated prior to the
analysis.
The a priori covariates of motivation (intent to pursue a career in human
nutrition) and level of prior knowledge (scores on a general test of nutrition knowledge)

53
were not included; therefore, analysis using a one-way ANCOVA was not conducted.
The a priori covariate of motivation (intent to pursue a career in human nutrition) was
not included because 89.5% of all participants intend to pursue a career in human
nutrition. The level of motivation in this sample as assessed by this question was high.
There was no statistically significant difference between groups on the test of nutrition
prior knowledge (PSWE M=9.8/12, SD=1.5; PDWE M=10.2/12, SD= 1.3), F (1, 17) =
.408, p=.531) and the scores were relatively high (81.6-85% correct answers). Internal
consistency using Cronbach’s alpha was calculated on the 12 items of the prior
knowledge test (α =-.041). This low value indicates the almost non-existent correlations
between items and the nature of the prior knowledge exam measuring a wide array of
concepts. In addition there was very little variability in the scores. There was no
statistically significant correlation of prior knowledge with any of the dependent variable
scores on the diagnostic tasks (performance). There was a statistically significant
correlation between prior knowledge and minutes working the practice cases r(19) =
.553, p < .05, indicating that the higher the score on the test of prior knowledge more
time was spent working with the maintenance cases.
The pilot study sample is biased in that the participants were highly motivated to
participate in the pilot study based on their career choice and very different from students
in the target population of the main study who were taking an introductory nutrition
course. All but two participants indicated that they were pursuing a career in human
nutrition and, as a result, most had taken two or more college nutrition courses (M=6.05,
SD=2.4), with at least one of them NUTR 244. Participant characteristics are outlined in
(Table 1).

54
Table 1. Pilot Study Participants Characteristics
Worked Example Condition PSWE PDWE Number of participants (total = 19) 10 9
Gender 3 male; 7 female 1 male; 8 female
Age M=28.1 M=28.67
Number of college nutrition courses taken > 2 (range 2-10) > 4 (range 4-10)
Score on general nutrition prior knowledge test M=9.8/12 (SD= 1.5) M=10.2/12 (SD=1.3)
Intent to pursue career in human nutrition 8 yes, 80% 9 yes, 100%
Ethnic Group
Native American/Alaska Native 0 1
Hispanic 5 1
Non-Hispanic White 4 5
Other 1 2
The stated purpose of the pilot study was to evaluate the study materials and the
design of the experiment. This involved assessing the time it took for all the phases of
the experiment so that this could be included in the IRB submission at Central New
Mexico Community College for the main study; assessing inter-rater reliability for the
scoring rubric, and noting any errors or confusing directions identified by the pilot study
participants. All these were accomplished with this pilot study sample. Results follow
for time on task at each phase of the study and the Interclass Correlation Coefficient for
the scoring rubric. A minor typographical error was found on the one-page IDNT guide
and two within the text of the case studies. These were corrected before the main study.
Participants uniformly used the line scale on the NASA-TLX as a 20 point rather than a
21 point scale; therefore subscale scores were interpreted on a 20 point scale for both the
pilot and main study.

55
Performance on Diagnostic Tasks
To address the first two research questions and the associated hypothesis of (1)
whether both product-oriented worked example and process-oriented worked example
conditions result in an ability to use International Dietetics and Nutrition Terminology
(IDNT) and Problem, Etiology, and Signs and Symptoms (PES) diagnostic statements by
novices as evidenced by performance on diagnostic tasks and (2) whether the process-
oriented worked example condition results in better performance on diagnostic tasks
when compared to product-oriented worked example condition for novices learning to
use IDNT and PES diagnostic charting, scores on the diagnostic tasks were examined by
worked example type. Results for the practice phase and maintenance phase are
presented sequentially.
Practice Phase-Pilot
Practice phase data was analyzed using a one-way ANOVA for (1) the time spent
studying the worked examples, and (2) total scores on the diagnosis tasks for each case
(PES score). Levene’s test of homogeneity of variance revealed no violations of the
assumption of homogeneity of variance with p values >.10. Shapiro-Wilk tests of
normality indicate p values less than 0.10 which leads to the rejection of the null
hypothesis that the dependent variables are normally distributed thereby violating the
assumption of normality for all variables except for minutes working with the practice
cases. Histograms for the PES scores are negatively skewed and leptokurtic consistent
with the high scores on the tasks. ANOVA is robust to the violation of the assumption of
normality, so these analyses were conducted despite the non-normality. There were no
statistically significant differences between worked example conditions for any of the -

56
variables for performance during the practice phase (Table 2). Participants did very well
on the diagnostic tasks with both groups scoring at or better than 74% correct for each of
the three diagnostic tasks (8.9/12).
Table 2. Pilot study practice phase performance dependent variables (M; SD)-ANOVA Worked Example Condition PSWE PDWE p value F (1, 17)
Time spent working with the clinical cases (minutes)
34. (6.7) 35.6 (6.2) 0.715 0.138
PES score Case 1 Diagnosis 1* 10. (3.1) 11.4 (0.7) 0.339 0.969
PES score Case 1 Diagnosis 2* 9.9 (2.9) 9.6 (3.7) 0.824 0.051
PES score Case 2 Diagnosis 1* 9.7 (3.5) 8.9 (4.5) 0.666 0.193
* of possible 12 points
Maintenance Phase-Pilot
For the maintenance phase, data was analyzed using a one-way ANOVA for (1)
the time spent studying the worked examples, and (2) total scores on the diagnosis tasks
for each case (PES score). Levene’s test of homogeneity of variance revealed a violation
of the assumption of homogeneity of variance for the first case, diagnosis one, with p
values >.10. Brown-Forsythe test was used to interpret results for this case. Shapiro-
Wilk tests of normality indicate p values less than 0.10 which leads to the rejection of the
null hypothesis that the dependent variables are normally distributed thereby violating the
assumption of normality for all variables except for minutes working with the practice
cases. Histograms for the PES scores are negatively skewed and leptokurtic consistent
with the high scores on the tasks. ANOVA is robust to the violation of the assumption of
normality, so these analyses were conducted despite the non-normality. There were no
statistically significant differences between worked example conditions for any of the

57
variables for performance during the maintenance phase (Table 3). Participants did very
well on the diagnostic tasks with both groups scoring at or better than 67.5% for each of
the three diagnostic tasks (8.1 of 12) correct.
Table 3 Pilot study maintenance phase performance dependent variables (M; SD)-ANOVA Worked Example Condition PSWE PDWE p value F (1,17 )
Time spent working with the clinical cases (minutes)
24.6 (4.9) 23.7 (6.9) 0.738 0.686
PES score Case 1 Diagnosis 1* 8.1 (4.2) 10.7 (.087) 0.089 3.6^
PES score Case 2 Diagnosis 1* 9.0 (3.3) 10.1 (1.7) 0.381 0.809
PES score Case 2 Diagnosis 2* 9.5 (2.4) 9.1 (3.4) 0.776 0.116
^ Brown-Forsythe * of possible 12 points
Interrater Reliability for PES Diagnostic Statement Scores
Interrater reliability was assessed for scores on diagnostic tasks by taking a
random sample of five participants from the pilot study and calculating an intraclass
correlation coefficient between the investigator using the scoring rubric designed for the
study and a nutrition faculty volunteer using the same rubric on each of the six diagnostic
tasks. Intraclass correlation coefficient was calculated on 30 scores for each of two
raters. Results of a two-way mixed consistency intraclass correlation coefficient
calculation for average measures was ICC (3, 2) = .942, F(29, 29) = 17.38, p = .000.
Excellent inter-rater reliability was observed using the rubric for scoring diagnostic tasks.
Cognitive Load
To address research question four and the associated hypotheses, four, whether
there is a difference in perceived cognitive load between the PDWE and the PSWE
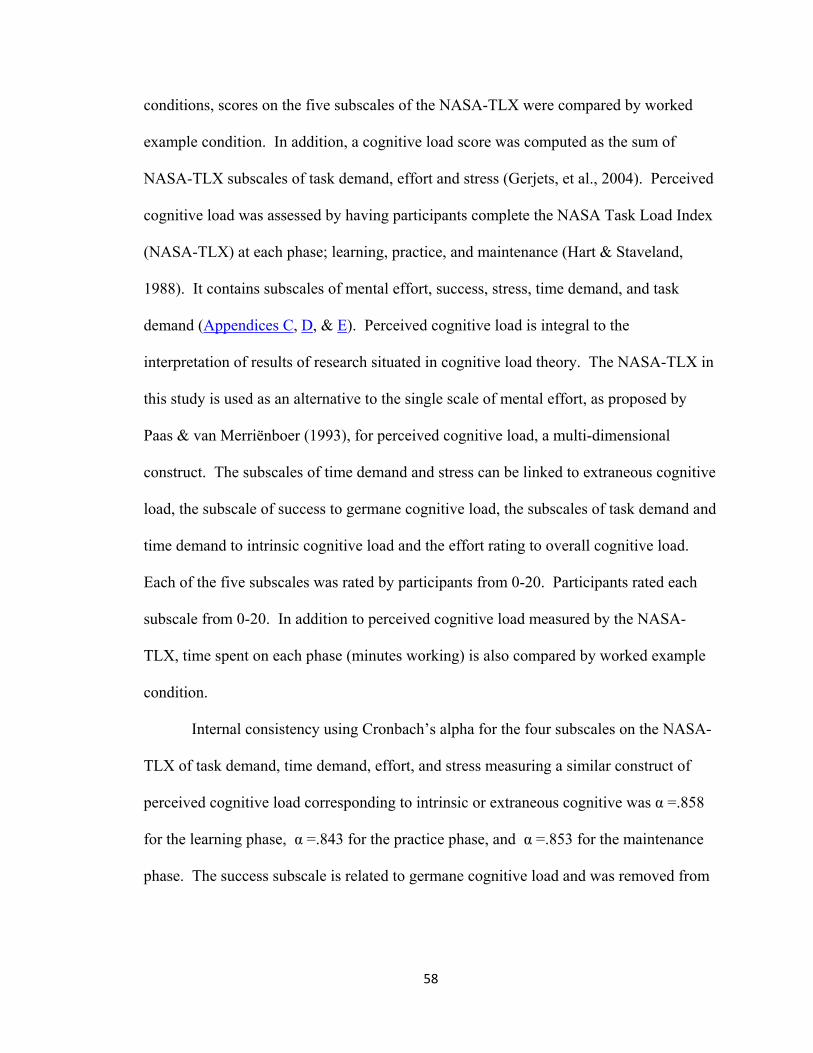
58
conditions, scores on the five subscales of the NASA-TLX were compared by worked
example condition. In addition, a cognitive load score was computed as the sum of
NASA-TLX subscales of task demand, effort and stress (Gerjets, et al., 2004). Perceived
cognitive load was assessed by having participants complete the NASA Task Load Index
(NASA-TLX) at each phase; learning, practice, and maintenance (Hart & Staveland,
1988). It contains subscales of mental effort, success, stress, time demand, and task
demand (Appendices C, D, & E). Perceived cognitive load is integral to the
interpretation of results of research situated in cognitive load theory. The NASA-TLX in
this study is used as an alternative to the single scale of mental effort, as proposed by
Paas & van Merriënboer (1993), for perceived cognitive load, a multi-dimensional
construct. The subscales of time demand and stress can be linked to extraneous cognitive
load, the subscale of success to germane cognitive load, the subscales of task demand and
time demand to intrinsic cognitive load and the effort rating to overall cognitive load.
Each of the five subscales was rated by participants from 0-20. Participants rated each
subscale from 0-20. In addition to perceived cognitive load measured by the NASA-
TLX, time spent on each phase (minutes working) is also compared by worked example
condition.
Internal consistency using Cronbach’s alpha for the four subscales on the NASA-
TLX of task demand, time demand, effort, and stress measuring a similar construct of
perceived cognitive load corresponding to intrinsic or extraneous cognitive was α =.858
for the learning phase, α =.843 for the practice phase, and α =.853 for the maintenance
phase. The success subscale is related to germane cognitive load and was removed from

59
the analysis. The four subscales of the NASA-TLX in this application were found to be
highly reliable.
Learning Phase-Pilot
Data for the learning phase was analyzed using a one-way ANOVA. Levene’s
test of homogeneity of variance revealed some of the variables (minutes studying the
examples, success, and stress) violate the assumption of homogeneity of variance with p
values that are lower than α= 0.10. The Brown-Forsythe method, for those variables that
violate the assumption of homogeneity of variance, was used to interpret results.
Shapiro-Wilk tests of normality indicate p values less than 0.10 which leads to the
rejection of the null hypothesis that the dependent variables are normally distributed
thereby violating the assumption of normality. Histograms for the prior knowledge test
and success on the NASA-TLX are negatively skewed and those for the variables of
effort, stress, task demand, time demand and minutes studying worked examples are
positively skewed indicating non normal distribution. ANOVA is robust to the violation
of the assumption of normality, so these analyses were conducted despite the non-
normality.
There were no statistically significant differences between worked example
conditions for any of the variables in the learning phase (Table 4). For both groups,
perceived success was high (PSWE M=17.4, SD=2.9; PDWE M=15.3, SD=5.7 on a 0-20
scale) and cognitive load as measured by the NASA-TLX subscales as a computed
variable combining task demand, effort and stress, was relatively low when the possible
score for the cognitive load variable is a 60 point scale (PSWE M=18.2, SD=13.7; PDWE
M=13.3, SD=9.4).

60
Table 4. Pilot study learning phase cognitive load dependent variables (M; SD) ANOVA Worked Example Condition PSWE PDWE p value F (1, 17)
Time spent studying the worked examples (minutes)
18.1 (4.5) 16.4 (1.5) 0.287 1.2
Perceived Cognitive Load-NASA TLX (0-20 scale for each item)
PSWE PDWE p value F (1, 17)
Task demand 6.1 (4.7) 4.9 (3.3) 0.527 0.416
Time demand 5.2 ( 4.6) 3.0 (2.0) 0.2 1.8
Success 17.4 (2.9) 15.3 (5.7) 0.33 1
Effort 6.3 (4.9) 5.1 (5.2) 0.615 0.263
Stress 5.8 (5.4) 3.0 (1.7) 0.16 2.1
Cognitive load -learning 18.2 (13.7) 13 (9.4) 0.355 0.904
Practice Phase-Pilot
Data for the practice phase was analyzed using a one-way ANOVA. Levene’s
test of homogeneity of variance revealed some of the variables (time demand and stress)
violate the assumption of homogeneity of variance with p values that are lower than
α=0.10. The Brown-Forsythe method, for those variables that violate the assumption of
homogeneity of variance, was used to interpret results. Shapiro-Wilk tests of normality
indicate p values less than 0.10 for the time demand variable only which leads to the
rejection of the null hypothesis that the dependent variable are normally distributed
thereby violating the assumption of normality. ANOVA is robust to the violation of the
assumption of normality, so these analyses were conducted despite the non-normality.
There was no statistically significant difference between worked example types
on any of the cognitive load variables during the practice phase for the pilot study (Table
5).

61
Table 5 Pilot study practice phase cognitive load dependent variables (M; SD)-ANOVA Worked example Condition PSWE PDWE p value F (1, 17)
Perceived Cognitive load-NASA TLX (0-20 scale for each item)
Task demand 8.1 (5.1) 7.9 (4.7) 0.936 0.007
Time demand 5.8 (5.9) 3.4 (3.1) 0.291 1.2^
Success 12.5 (5.6) 14.4 (5.0) 0.385 0.797
Effort 8.1 (5.3) 9.9 (5.5) 0.508 0.459
Stress 7.2 (5.9) 5.1 (3.1) 0.348 .944^
Cognitive load- practice 23.4 (15.2) 22.9 (12.1) 0.937 0.006
^ Brown-Forsythe
Maintenance Phase-Pilot
Data for the maintenance phase was analyzed using a one-way ANOVA.
Levene’s test of homogeneity of variance revealed one variable (task demand) violated
the assumption of homogeneity of variance with p value that was lower than α= 0.10.
The Brown-Forsythe method was used to interpret results for task demand. Shapiro-Wilk
tests of normality indicate p values less than 0.10 for the time demand, minutes working
with the cases, stress, and effort variables leading to the rejection of the null hypothesis
that the dependent variables are normally distributed thereby violating the assumption of
normality. ANOVA is robust to the violation of the assumption of normality, so these
analyses were conducted despite the non-normality (Table 6).

62
Table 6. Pilot study maintenance phase cognitive load dependent variables (M; SD)-ANOVA Worked example Condition PSWE PDWE p value F (1,17 )
Perceived Cognitive load-NASA TLX (0-20 scale for each item)
Task demand 7.5 (4.7) 5.1 (2.8) 0.19 1.9^
Time demand 4.9 (4.2) 3.3 (4.2) 0.427 0.661
Success 15.2 (3.3) 11.4 (5.1) 0.069 3.8
Effort 10.5 (3.1) 6.9 (4.5) 0.055 4.2
Stress 6.0 (3.9) 5.9 (4.9) 0.957 0.003
Cognitive load -maintenance 24 (9.2) 17.9 (11.5) 0.218 1.6
^ Brown-Forsythe
There were no statistically significant differences between worked example types
for any of the cognitive load measures; however, for success (PSWE M=15.2, SD=3.3;
PDWE M=11.4, SD= 5.1), F(1,17) =3.8, p=.069 and effort (PSWE M=10.5, SD=5.1;
PDWE M=6.9, SD= 4.5), F(1,17) =4.2, p=.055, the difference was noticeable even in
this small sample. ω2=.127 for success indicates that worked example condition
accounted for 12.7% of the variance in the success rating and ω2=.146 for effort indicates
that worked example condition accounted for 14.6% of the variance in effort rating in the
maintenance phase.
Themes from Comments from Write in Questions on NASA-TLX
Participants had an opportunity to write answers to two questions on the NASA-
TLX for each phase; learning, practice and maintenance. Question one was: “What was
the hardest part about working with or studying the clinical case worked examples”?
Question two was “Were the situations depicted in the clinical cases and worked
examples familiar to you and why”?

63
Learning Phase
Question one. Themes that emerged were related to reading about new
terminology and comparing the worked examples; to how this information was presented
differently than in their course work; reading through a lot of material; and trying to
decide what was important as they were studying the examples in a new format.
Question two. Most participants found the cases and themes of the cases similar
to course work from their own or family experiences.
Practice Phase
Question one. The most common themes that emerged were remembering where
things go in the PES format, deciding what was the most important nutrition problem in
the case, and trying to decide which IDNT codes to use.
Question two. Most participants reported they were familiar with using case
examples from their course work. Most commented on case two (novel case) being
difficult and not being sure how to make a diagnosis when they thought they did not have
enough information.
Maintenance Phase
Question one. The most common themes that emerged were remembering where
things go in the PES format, deciding what was the most important nutrition problem in
the case, and trying to decide which IDNT codes to use. Participants commented most
frequently on having trouble with what was an etiology and what was a sign and
symptom as part of the PES diagnostic statement. Participants also commented on trying
to remember what they had learned from session one of the experiment and not being
confident they were doing the work correctly.

64
Question two. Most participants reported they were familiar with similar types
of case examples from their course work.
Calculated Efficiency
To address research question three whether there is a difference between the
PSWE condition and the PDWE condition on training efficiency when calculated from
self-report of mental effort from the NASA-TLX subscale of effort and performance on
diagnostic tasks, a one way ANOVA was conducted on the practice phase cases and the
maintenance phase cases by worked example condition.
The computational approach for efficiency involved calculating z scores for
mental effort and performance measures, by worked example condition, to compute an
instructional condition efficiency score (E) via the following formula (Pass, et al., 2003):
E=
√.
Efficiency scores (E) were calculated for each diagnostic task for each worked example
condition on each of the three diagnostic tasks in the practice and maintenance phase
(Table 6). Efficiency in this study was calculated and interpreted as mental effort and
performance scores in each transfer phase (practice or maintenance) (van Gog, et al.,
2008; van Gog, et al., 2006). Results were graphed on a Cartesian axis with performance
on the vertical and mental effort on the horizontal with worked example condition
efficiency scores plotted as a distance from the E=0 line, passing from the lower left to
the upper right of the grid. The upper left of the grid (positive E) represents the highest
efficiency and the lower right the lowest efficiency (negative E) (Pass, et al., 2003).

65
There is no statistically significant difference between worked example conditions
for calculated efficiency in the practice phase of the pilot study F(1, 4) =4.0, p=.115.
(Figure 2.)
Figure 2 Pilot Study: Practice Phase Efficiency
There is a statistically significant difference in calculated efficiency scores for the
maintenance phase cases. The PDWE condition was more efficient F(1, 4) =43.8, p=.003
ω2=.867. This indicates that worked example conditions accounts for 86.7 % of the
variance in calculated efficiency for the maintenance phase. (Figure 3.)
Efficiency = 0
‐0.6
‐0.4
‐0.2
‐1E‐15
0.2
0.4
0.6
‐0.6 ‐0.4 ‐0.2 ‐1E‐15 0.2 0.4 0.6Ze
ZpPilot Study: Practice Phase Efficiency
C1D1Pd: E = 0.04
C1D2Pd: E = ‐0.16
C2D1Pd: E = ‐0.20
C1D1Ps: E = ‐0.04
C1D2Ps: E = 0.15
C2D1Ps: E = 0.18
Efficiency = 0

66
Figure 3 Pilot Study: Maintenance Phase Efficiency
Since there were no significant differences in performance between worked
example conditions, the difference can be interpreted as those in the PDWE condition
performed as well as those in the PSWE condition with less mental effort, therefore the
PDWE condition was more efficient.
Main Study
Data for the main study were analyzed using one-way ANCOVA with prior
knowledge (scores on a general test of nutrition knowledge) included as a covariate in
Efficiency = 0
‐0.6
‐0.4
‐0.2
‐1E‐15
0.2
0.4
0.6
‐0.6 ‐0.4 ‐0.2 ‐1E‐15 0.2 0.4 0.6Ze
Zp
Pilot Study: Maintenance Phase Efficiency
C1D1Md: E = 0.62
C2D1Md: E = 0.49
C2D2Md: E = 0.28
C1D1Ms: E = ‐0.55
C2D1Ms: E = ‐0.43
C2D2Ms: E = ‐0.25
Efficiency = 0

67
most instances. An α= 0.05 was chosen for interpretation of statistical significance. This
was deemed a reasonable compromise between Type I and Type II error. Effect sizes for
relationships that reached a level of statistical significance are the most important for
interpretation of group differences. Correlations were interpreted at an α= 0.05 to
identify any variables that were identified as a priori covariates that should in fact be
further investigated before including them in the model. Statistically significant
correlations were not identified as dependent variables in the study and no hypotheses
were structured around interpretation of the correlations. The a priori covariate of
motivation (intent to pursue a career in human nutrition) was not used since 85.6 % of the
participants indicated they were not pursuing a career as a nutrition professional and
including it does not aid in interpretation of results. Expected course grade was explored
as an indicator of motivation to engage in the experiment. Though it was highly
correlated with prior knowledge, there were instances when it was correlated with other
dependent variables in a way that with prior knowledge was not. There was no
statistically significant difference between worked example conditions on the test of
nutrition prior knowledge (PSWE, M=6.8/12, SD=2.2; PDWE M=6.35/12, SD= 2.1) F (1,
102) = 1.2, p=.281) (52.9 - 56.7% correct answers). Participants were predominantly
female (78 of 104) and had a mean age of 25.7 years (SD=8.4). Table 7 outlines the
characteristics of the participants in the main study.

68
Table 7. Dissertation study participant characteristics
Worked example Condition PSWE PDWE
Number of participants (total= 104) 52 52
Gender 12 male; 40 female 14 male; 38 female
Age M=27.2 (SD=10.2) M=24.2 (SD=5.8)
Number of college nutrition courses taken 84.6% with 1 course (range 1-3)
78.8% with 1 course (range 1-4)
Score on general nutrition prior knowledge test
M=6.8/12 (SD= 2.2) M=6.35/12 (SD=2.1)
Intent to pursue career in human nutrition 7 yes, 13.5% 8 yes, 15.4%
Ethic group
Native American/Alaska Native 6 (11.5%) 7 (13.5%)
Hispanic 21 (40.4%) 24 (46.2%)
Non-Hispanic White 16 (30.8%) 16 (30.8%)
African American/Black 4 (7.7%) 1 (1.9%)
Asian 1 (1.9%) 1 (1.9%)
Other 4 (7.7%) 3 (5.8%)
Only data for participants who attempted making a diagnosis were included in the
analysis of performance scores on the diagnostic tasks in the practice and maintenance
phases and the cognitive load scores in the practice and maintenance phases. The number
of included cases is identified in the results tables for each of the measures in each phase
of the study. Average time for the section of the class the student was engaged in the
experiment was used when time data was not recorded by participants on the envelopes.
Average time was used for 44 participants during the learning phase (42.3%), 31
participants in the first practice (32.3%) case and 28 participants for the second practice
case (34.1%). Missing data for perceived cognitive load as recorded on the NASA-TLX
was treated as missing and those cases were excluded from the analysis. There was a
9.6 % attrition rate between session one of the study and session two (n=10).

69
Tests of the assumptions for one-way ANCOVA (correlation with the dependent
variable, normality, homogeneity of regression slopes, linearity, and homogeneity of
group variances) were evaluated prior to using any variable as a covariate. For those
variables analyzed using one-way ANOVA tests for assumptions (normality,
homogeneity of group variances) were evaluated prior to the analysis.
Performance on Diagnostic Tasks
Based on the above correlations, a statistically significant correlation exists
between prior knowledge and the scores on case one, diagnosis one r(96) = .420, p < .01,
and case one, diagnosis two r(96) = .464, p < .01, indicating that the higher the score on
the prior knowledge test, the higher the score on the diagnostic tasks for case one in the
practice phase (Table 8).
Table 8. Main Study Practice Phase Performance- Correlations Case One
Expected course grade
Total score prior
knowledge
Total score PES case 1
1st ND practice phase
Total score PES case 1
2nd ND practice phase
Minutes working practice
cases
Expected course grade 1 .323** .090 .214* .080
Total score prior knowledge test
1 .420** .464** .078
Total score PES case 1 1st ND practice phase
1 .666** .156
Total score PES case 1 2nd ND practice phase
1 .048
Minutes working practice cases
1
**. P< 0.01
*. P< 0.05
Data for the main study were analyzed using one-way ANCOVA with prior
knowledge (scores on a general test of nutrition knowledge) included as a covariate for
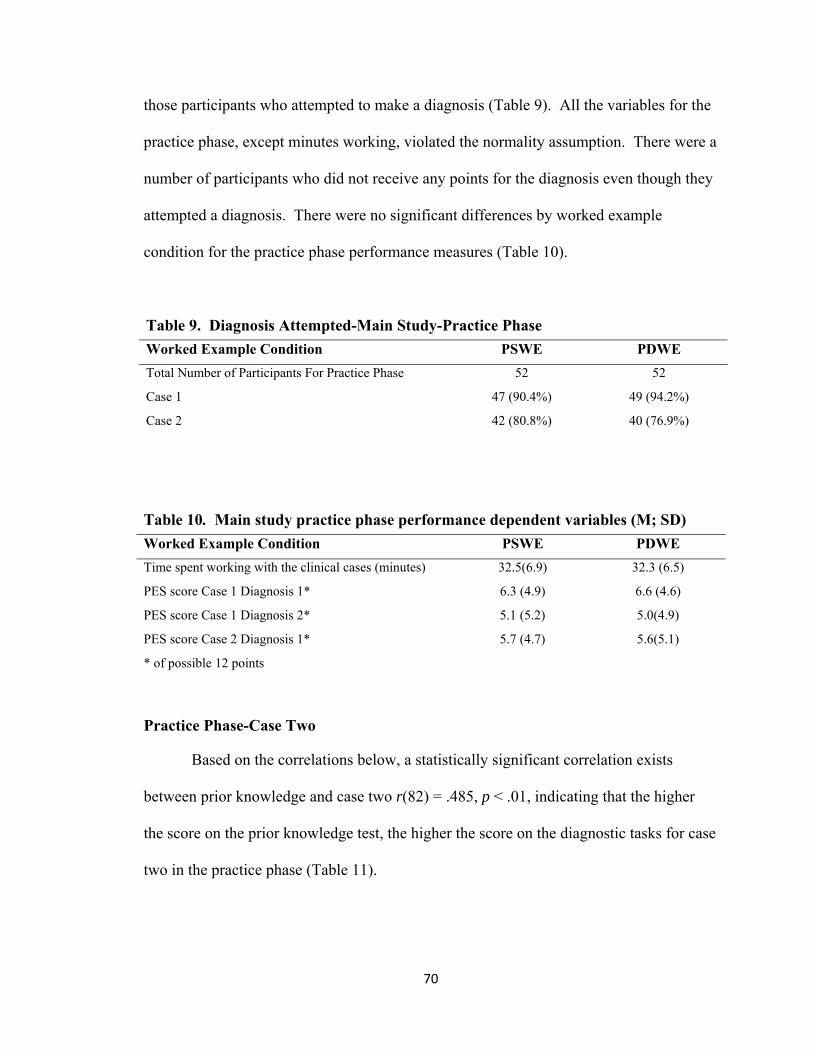
70
those participants who attempted to make a diagnosis (Table 9). All the variables for the
practice phase, except minutes working, violated the normality assumption. There were a
number of participants who did not receive any points for the diagnosis even though they
attempted a diagnosis. There were no significant differences by worked example
condition for the practice phase performance measures (Table 10).
Table 9. Diagnosis Attempted-Main Study-Practice Phase
Worked Example Condition PSWE PDWE
Total Number of Participants For Practice Phase 52 52
Case 1 47 (90.4%) 49 (94.2%)
Case 2 42 (80.8%) 40 (76.9%)
Table 10. Main study practice phase performance dependent variables (M; SD)
Worked Example Condition PSWE PDWE
Time spent working with the clinical cases (minutes) 32.5(6.9) 32.3 (6.5)
PES score Case 1 Diagnosis 1* 6.3 (4.9) 6.6 (4.6)
PES score Case 1 Diagnosis 2* 5.1 (5.2) 5.0(4.9)
PES score Case 2 Diagnosis 1* 5.7 (4.7) 5.6(5.1)
* of possible 12 points
Practice Phase-Case Two
Based on the correlations below, a statistically significant correlation exists
between prior knowledge and case two r(82) = .485, p < .01, indicating that the higher
the score on the prior knowledge test, the higher the score on the diagnostic tasks for case
two in the practice phase (Table 11).

71
Table 11. Main Study Practice Phase Performance- Correlations Case Two
Total score prior knowledge test
Total score PES case 2 practice
Minutes working practice cases
Total score prior knowledge test 1 .485** .136
Total score PES case 2 practice 1 .096
Minutes working practice cases 1
**. , p < .01
Secondary Analysis of Practice Phase Cases
Data for those scoring >8 was explored for both practice cases. Correlations and
assumption tests were conducted and reported where relevant to the analysis performed.
Case One Diagnosis One
There is no statistically significant correlation with a score on the first case and
first diagnosis and either course grade and score on the test of prior knowledge for
participants whom scored >8/12 on the diagnostic task (Table 12). The distribution is not
normal and negatively skewed consistent with the high scores on the task.
Table 12. Scores > 8 Main study practice phase performance dependent variables (M; SD) Worked Example Condition PSWE PDWE
Number scoring >8 of those that attempted 21/47 (44.7%) 26 /49 (53.1%)
PES score Case 1 Diagnosis 1* 11.4 (0.81) 10.6 (1.5)
Number scoring >8 of those that attempted 19/42 (45.2%) 14/40 (35%)
PES score Case 1 Diagnosis 2* 10.9 (1.2) 10.9 (1.2)
Number scoring >8 of those that attempted 20/42 (47.6%) 19/40 (47.5%)
PES score Case 2 Diagnosis 1* 10.4 (1.2) 10.7 (1.1)
* of possible 12 points
Data for case one diagnosis one in the practice phase was analyzed using a one-
way ANOVA. Levene’s test of homogeneity of variance revealed scores violated the

72
assumption of homogeneity of variance with p value that was lower than α= 0.10. The
Brown-Forsythe method was used to interpret results for task demand. Shapiro-Wilk
tests of normality indicate p values less than 0.10 for scores leading to the rejection of the
null hypothesis that the dependent variables are normally distributed thereby violating the
assumption of normality. ANOVA is robust to the violation of the assumption of
normality, so these analyses were conducted despite the non-normality.
There was a statistically significant difference by worked example condition for
participants scoring >8 on the first diagnostic task (PSWE M = 11.4, SD =0.81 and
PDWE M = 10.6, SD = 1.5) in the practice phase, F(1, 39.1) = 5.8, p = .02, ω2 =.081, thus
8.1% of the variance in scores is due to worked example condition. Those in the PSWE
scored higher with an average of 95% correct and those in the PDWE an average of
88.8% correct.
Case One Diagnosis Two
There is no statistically significant correlation with a score on the first case and
second diagnosis and either course grade and score on the test of prior knowledge for
participants who scored >8 of 12 on the diagnostic task. The distribution is not normal
and negatively skewed consistent with the high scores on the task. Analysis using one-
way ANOVA showed no significant difference in scores on the first case, second
diagnosis by worked example condition.
Case Two Practice Phase
There is no statistically significant correlation with a score on the second case and
first diagnosis and either course grade and score on the test of prior knowledge for
participants who scored >8 of 12 on the diagnostic task. The distribution is not normal

73
and negatively skewed consistent with the high scores on the task. Analysis using one-
way ANOVA showed no significant difference in scores on second case and first
diagnosis by worked example type.
Maintenance Phase- Main Study
Data was analyzed using one-way ANCOVA with prior knowledge (scores on a
general test of nutrition knowledge) included as a covariate for those participants who
attempted to make a diagnosis (Table 13). All the variables for the maintenance phase
except minutes working violated the normality assumption. Histograms indicated that
there were a number of participants who did not receive any points for the diagnosis even
though they attempted a diagnosis. For those who scored, a negative skew existed.
Table 13 Main Study Diagnosis Attempted Worked Example Condition PSWE PDWE
Number of Participants for Maintenance Phase 49 (5.8% attrition) 45 (13.5% attrition)
Case 1 46 (88.5%) 42 (80.8%)
Case 2 46 (88.5%) 45 (100%)
Based on the correlations below, a statistically significant correlation exists
between prior knowledge and case one r(88) = .436, p < .01, indicating that the higher
the score on the prior knowledge test, the higher the score on the diagnostic tasks for
case one in the maintenance phase. A statistically significant correlation exists between
minutes working and expected course grade r(88) = -.216, p < .05, indicating that the
higher expected course grade, less time was spent on diagnostic tasks in the maintenance
phase. A statistically significant correlation exists between scores on case one and

74
expected course grade r(88) = .315, p < .01, indicating that the higher expected course
grade, the higher the score for case one in the maintenance phase (Table 14).
Table 14. Main Study Maintenance Phase Performance- Correlations Case One Expected Course
Grade Total Score
Prior Knowledge Test
Total Score PES Case 1
Maintenance
Minutes Working
Maintenance Cases
Expected Course Grade 1 .398** .315** -.216*
Total Score Prior Knowledge Test 1 .436** -.130
Total Score PES Case 1 Maintenance
1 .029
Minutes Working Maintenance Cases
1
**. p < .01
*. p < .0.05
Based on the above correlations, a statistically significant correlation exists
between prior knowledge and case two, diagnosis one r(91) = .425, p < .01, case two,
diagnosis two r(91) = .411, p < .01, indicating that the higher the score on the prior
knowledge test, the higher the score on the diagnostic tasks for case two in the
maintenance phase. A statistically significant correlation exists between expected course
grade and minutes working r(91) = -.222, p < .05, indicating that the higher expected
course grade, less time was spent on diagnostic tasks in the maintenance phase. A
statistically significant correlation exists between expected course grade and case two,
diagnosis two r(91) = .292, p < .01, indicating that the higher expected course grade, the
higher the score for case two diagnosis two in the maintenance phase. There were no
statistically significant differences between worked example condition and performance
measures for case two of the maintenance phase (Table 15).
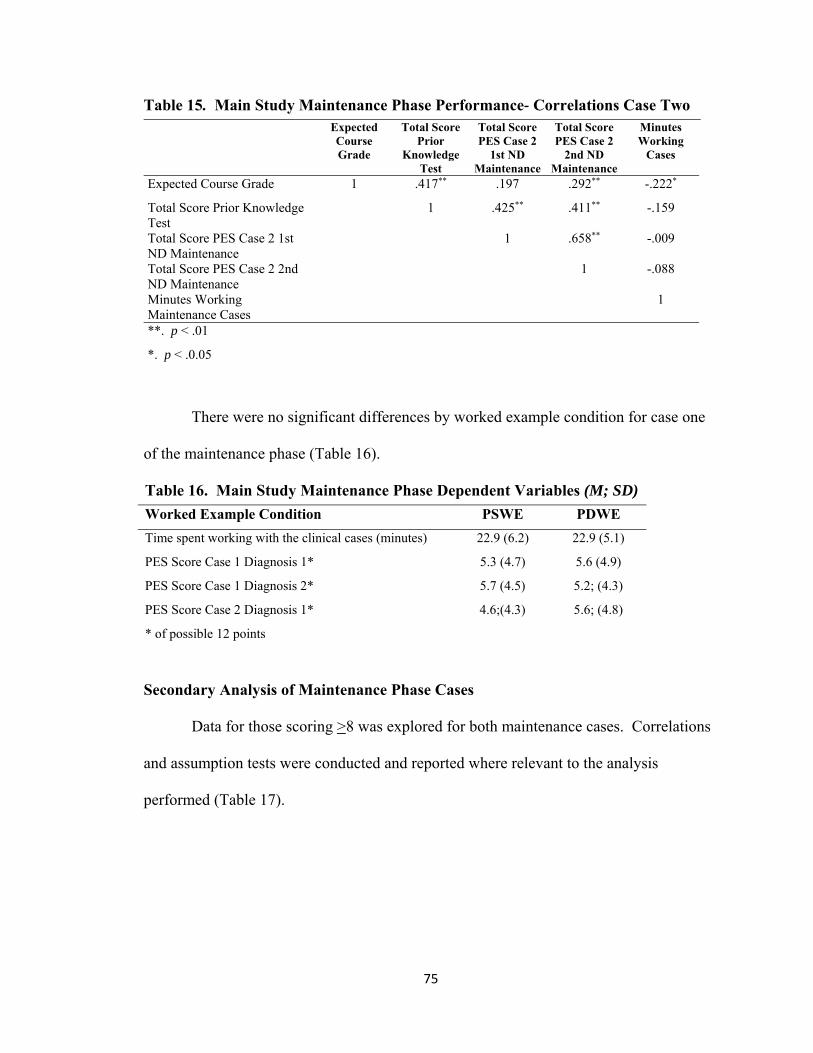
75
Table 15. Main Study Maintenance Phase Performance- Correlations Case Two Expected
Course Grade
Total Score Prior
Knowledge Test
Total Score PES Case 2
1st ND Maintenance
Total Score PES Case 2
2nd ND Maintenance
Minutes Working
Cases
Expected Course Grade 1 .417** .197 .292** -.222*
Total Score Prior Knowledge Test
1 .425** .411** -.159
Total Score PES Case 2 1st ND Maintenance
1 .658** -.009
Total Score PES Case 2 2nd ND Maintenance
1 -.088
Minutes Working Maintenance Cases
1
**. p < .01
*. p < .0.05
There were no significant differences by worked example condition for case one
of the maintenance phase (Table 16).
Table 16. Main Study Maintenance Phase Dependent Variables (M; SD)
Worked Example Condition PSWE PDWE
Time spent working with the clinical cases (minutes) 22.9 (6.2) 22.9 (5.1)
PES Score Case 1 Diagnosis 1* 5.3 (4.7) 5.6 (4.9)
PES Score Case 1 Diagnosis 2* 5.7 (4.5) 5.2; (4.3)
PES Score Case 2 Diagnosis 1* 4.6;(4.3) 5.6; (4.8)
* of possible 12 points
Secondary Analysis of Maintenance Phase Cases
Data for those scoring >8 was explored for both maintenance cases. Correlations
and assumption tests were conducted and reported where relevant to the analysis
performed (Table 17).
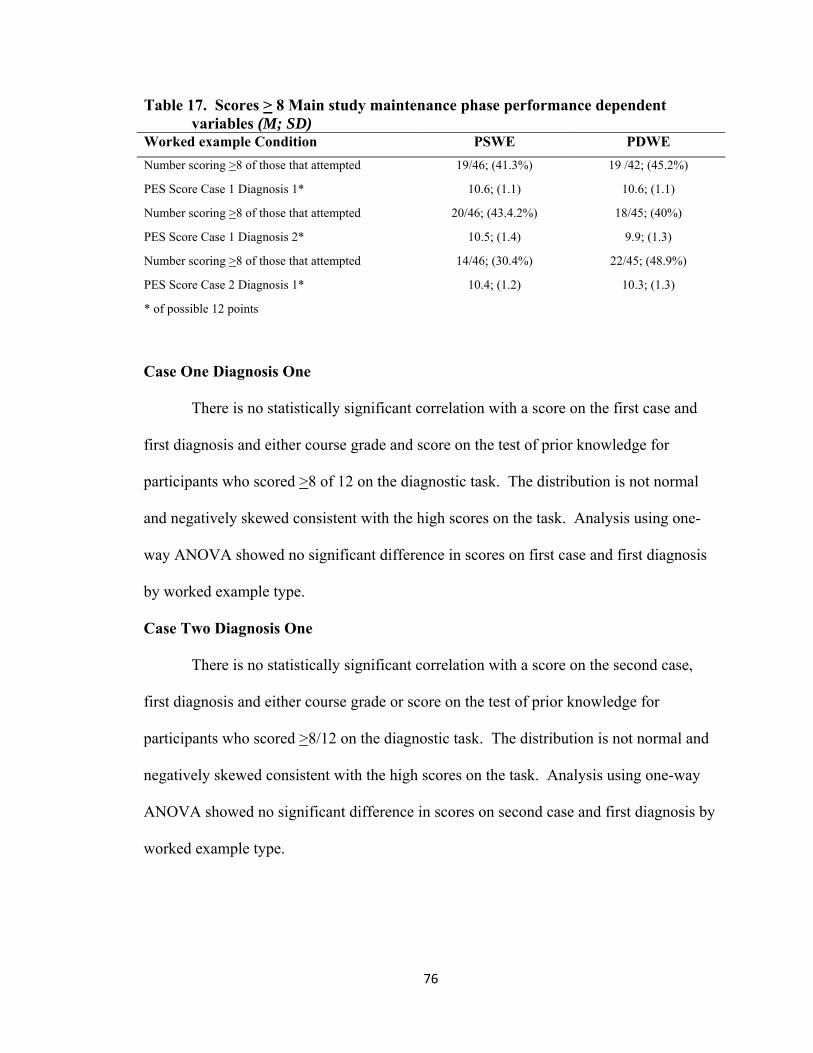
76
Table 17. Scores > 8 Main study maintenance phase performance dependent variables (M; SD)
Worked example Condition PSWE PDWE
Number scoring >8 of those that attempted 19/46; (41.3%) 19 /42; (45.2%)
PES Score Case 1 Diagnosis 1* 10.6; (1.1) 10.6; (1.1)
Number scoring >8 of those that attempted 20/46; (43.4.2%) 18/45; (40%)
PES Score Case 1 Diagnosis 2* 10.5; (1.4) 9.9; (1.3)
Number scoring >8 of those that attempted 14/46; (30.4%) 22/45; (48.9%)
PES Score Case 2 Diagnosis 1* 10.4; (1.2) 10.3; (1.3)
* of possible 12 points
Case One Diagnosis One
There is no statistically significant correlation with a score on the first case and
first diagnosis and either course grade and score on the test of prior knowledge for
participants who scored >8 of 12 on the diagnostic task. The distribution is not normal
and negatively skewed consistent with the high scores on the task. Analysis using one-
way ANOVA showed no significant difference in scores on first case and first diagnosis
by worked example type.
Case Two Diagnosis One
There is no statistically significant correlation with a score on the second case,
first diagnosis and either course grade or score on the test of prior knowledge for
participants who scored >8/12 on the diagnostic task. The distribution is not normal and
negatively skewed consistent with the high scores on the task. Analysis using one-way
ANOVA showed no significant difference in scores on second case and first diagnosis by
worked example type.

77
Case Two Diagnosis Two
There is no statistically significant correlation with a score on the second case and
second diagnosis and either course grade and score on the test of prior knowledge for
participants who scored >8/12 on the diagnostic task. The distribution is not normal and
negatively skewed consistent with the high scores on the task. Analysis using one-way
ANOVA showed no significant difference in scores on second case and second diagnosis
by worked example type.
Cognitive Load
To address research question four and the associated hypotheses, four, whether
there is a difference in perceived cognitive load between the PDWE and the PSWE
conditions, scores on the five subscales of the NASA-TLX were compared by worked
example condition. In addition, a cognitive load score was computed as the sum of
NASA-TLX subscales of task demand, effort and stress (Gerjets, et al., 2004). Perceived
cognitive load was assessed by having participants complete the NASA Task Load Index
(NASA-TLX) at each phase; learning, practice, and maintenance (Hart & Staveland,
1988). It contains subscales of mental effort, success, stress, time demand, and task
demand (Appendices C, D, & E). Perceived cognitive load is integral to the
interpretation of results of research situated in cognitive load theory. The NASA-TLX in
this study is used as an alternative to the single scale of mental effort, as proposed by
Paas & van Merriënboer (1993), for perceived cognitive load, a multi-dimensional
construct. The subscales of time demand and stress can be linked to extraneous cognitive
load, the subscale of success to germane cognitive load, the subscales of task demand and
time demand to intrinsic cognitive load and the effort rating to overall cognitive load.
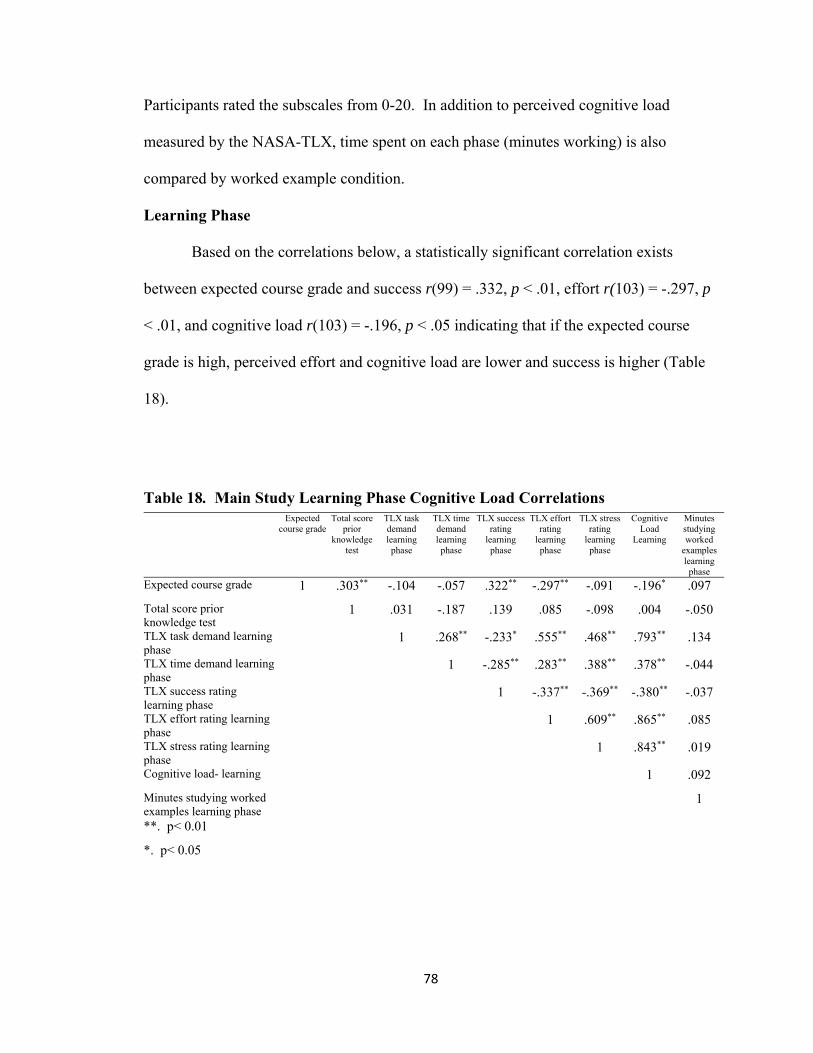
78
Participants rated the subscales from 0-20. In addition to perceived cognitive load
measured by the NASA-TLX, time spent on each phase (minutes working) is also
compared by worked example condition.
Learning Phase
Based on the correlations below, a statistically significant correlation exists
between expected course grade and success r(99) = .332, p < .01, effort r(103) = -.297, p
< .01, and cognitive load r(103) = -.196, p < .05 indicating that if the expected course
grade is high, perceived effort and cognitive load are lower and success is higher (Table
18).
Table 18. Main Study Learning Phase Cognitive Load Correlations
Expected course grade
Total score prior
knowledge test
TLX task demand learning phase
TLX time demand learning
phase
TLX success rating
learning phase
TLX effort rating
learning phase
TLX stress rating
learning phase
Cognitive Load
Learning
Minutes studying worked
examples learning
phase
Expected course grade 1 .303** -.104 -.057 .322** -.297** -.091 -.196* .097
Total score prior knowledge test
1 .031 -.187 .139 .085 -.098 .004 -.050
TLX task demand learning phase
1 .268** -.233* .555** .468** .793** .134
TLX time demand learning phase
1 -.285** .283** .388** .378** -.044
TLX success rating learning phase
1 -.337** -.369** -.380** -.037
TLX effort rating learning phase
1 .609** .865** .085
TLX stress rating learning phase
1 .843** .019
Cognitive load- learning 1 .092
Minutes studying worked examples learning phase
1
**. p< 0.01
*. p< 0.05
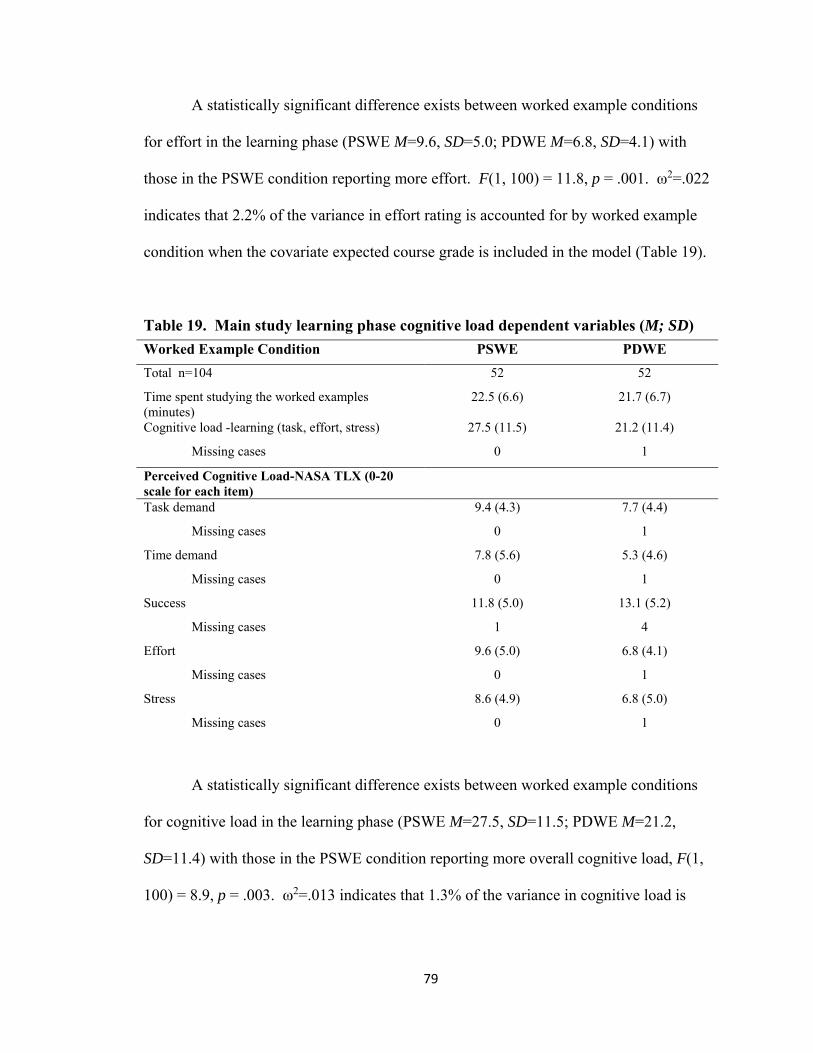
79
A statistically significant difference exists between worked example conditions
for effort in the learning phase (PSWE M=9.6, SD=5.0; PDWE M=6.8, SD=4.1) with
those in the PSWE condition reporting more effort. F(1, 100) = 11.8, p = .001. ω2=.022
indicates that 2.2% of the variance in effort rating is accounted for by worked example
condition when the covariate expected course grade is included in the model (Table 19).
Table 19. Main study learning phase cognitive load dependent variables (M; SD)
Worked Example Condition PSWE PDWE
Total n=104 52 52
Time spent studying the worked examples (minutes)
22.5 (6.6) 21.7 (6.7)
Cognitive load -learning (task, effort, stress) 27.5 (11.5) 21.2 (11.4)
Missing cases 0 1
Perceived Cognitive Load-NASA TLX (0-20 scale for each item)
Task demand 9.4 (4.3) 7.7 (4.4)
Missing cases 0 1
Time demand 7.8 (5.6) 5.3 (4.6)
Missing cases 0 1
Success 11.8 (5.0) 13.1 (5.2)
Missing cases 1 4
Effort 9.6 (5.0) 6.8 (4.1)
Missing cases 0 1
Stress 8.6 (4.9) 6.8 (5.0)
Missing cases 0 1
A statistically significant difference exists between worked example conditions
for cognitive load in the learning phase (PSWE M=27.5, SD=11.5; PDWE M=21.2,
SD=11.4) with those in the PSWE condition reporting more overall cognitive load, F(1,
100) = 8.9, p = .003. ω2=.013 indicates that 1.3% of the variance in cognitive load is

80
accounted for by worked example condition when the covariate expected course grade is
included in the model.
The remaining variables were analyzed using one-way ANOVA. A statistically
significant difference exists between worked example conditions for task demand in the
learning phase (PSWE M=9.4, SD=4.3; PDWE M=7.7, SD=4.4) with those in the PSWE
condition reporting more task demand, F(1, 101) = 4.0, p = .047. ω2=.029 indicates that
2.9% of the variance in task demand is accounted for by worked example condition.
A statistically significant difference exists between worked example conditions
for time demand in the learning phase (PSWE M=7.8, SD=5.6; PDWE M=5.3, SD=4.6)
with those in the PSWE condition reporting more time demand, F(1, 101) = 6.8, p = .011.
ω2=.053 indicates that 5.3% of the variance in time demand is accounted for by worked
example condition.
Practice Phase
Based on the correlations below, a statistically significant correlation exists
between expected course grade, task demand r(91) = -.290, p < .01, time demand r(91) =
-.243, p < .05 and cognitive load r(91) = -.264, p < .05, indicating that if the expected
course grade is high, perceived task demand and cognitive load are lower and perceived
time demand is higher for the first practice phase case (Table 20).

81
Table 20. Main Study Practice Phase Cognitive Load Case One- Correlations
Expected course grade
Total score prior know-ledge test
TLX task demand practice phase
TLX time demand practice phase
TLX success rating practice phase
TLX effort rating practice phase
TLX stress rating practice phase
Minutes working practice cases
Cog load practice phase
Expected course grade 1 .323** -.290** -.243* .117 -.185 -.200 .080 -.264* Total score prior knowledge test 1 -.020 -.143 .123 -.098 -.185 .078 -.123
TLX task demand practice phase 1 .272** -.321** .586** .468** .000 .801**
TLX time demand practice phase 1 -.227* .288** .358** .109 .364**
TLX success rating practice phase 1 -.264* -.304** -.047 -.350**
TLX effort rating practice phase 1 .642** -.045 .886**
TLX stress rating practice phase 1 -.040 .842**
Minutes working practice cases 1 -.035
Cog load practice phase 1 **. Correlation is significant at the 0.01 level (2-tailed).
*. Correlation is significant at the 0.05 level (2-tailed).
Based on the correlations below, a statistically significant correlation exists
between expected course grade, task demand r(79) = -.256, p < .05, and cognitive load
r(79) = -.243, p < .05, indicating that if the expected course grade is high, perceived task
demand and cognitive load are lower for the second practice phase case (Table 21).

82
Table 21. Correlations Main Study Practice Phase Cognitive Load Case Two- expected
course grade
total score prior knowledge test
TLX task demand practice phase
TLX time demand practice phase
TLX success rating practice phase
TLX effort rating practice phase
TLX stress rating practice phase
minutes working practice cases
Cog load practice phase e
Expected course grade 1 .361** -.256* -.216 .081 -.188 -.181 .148 -.243*
Total score prior knowledge test
1 -.052 -.157 .144 -.114 -.212 .116 -.152
TLX task demand practice phase
1 .275* -.347** .617** .509** .001 .821**
TLX time demand practice phase
1 -.221 .374** .470** .019 .444**
TLX success rating practice phase
1 -.380** -.387** -.021 -.438**
TLX effort rating practice phase
1 .618** -.018 .881**
TLX stress rating practice phase
1 -.001 .843**
Minutes working practice cases
1 -.007
Cog load practice phase 1**. Correlation is significant at the 0.01 level (2-tailed). *. Correlation is significant at the 0.05 level (2-tailed).
Analysis was conducted using one-way ANOVA. There were no statistically
significant differences between worked example conditions in perceived cognitive load in
the practice phase (Table 22).
Table 22. Main study practice phase cognitive load - case two (M; SD) Worked example Condition PSWE PDWE Total n= 83 43 40
time spent working the practice cases (minutes) 32.1 (7.1) 31.1 (6.4)
cognitive load- learning (task, effort, stress) 32.5(12.7) 30.9 (12.6)
missing cases 3 1
Perceived Cognitive load-NASA TLX (0-20 scale for each item)
Task Demand 11.2 (4.6) 10.1 (4.5)
Missing Cases 3 1
Time Demand 7.6 (5.5) 6.5 (4.7)
Missing Cases 3 1
Success 9.8 (5.0) 9.8 (4.5)
Missing Cases 3 1
Effort 10.9 (5.2) 11.0 (5.1)
Missing Cases 3 1
Stress 10.4 (5.1) 9.8 (5.2)
Missing Cases 3 1
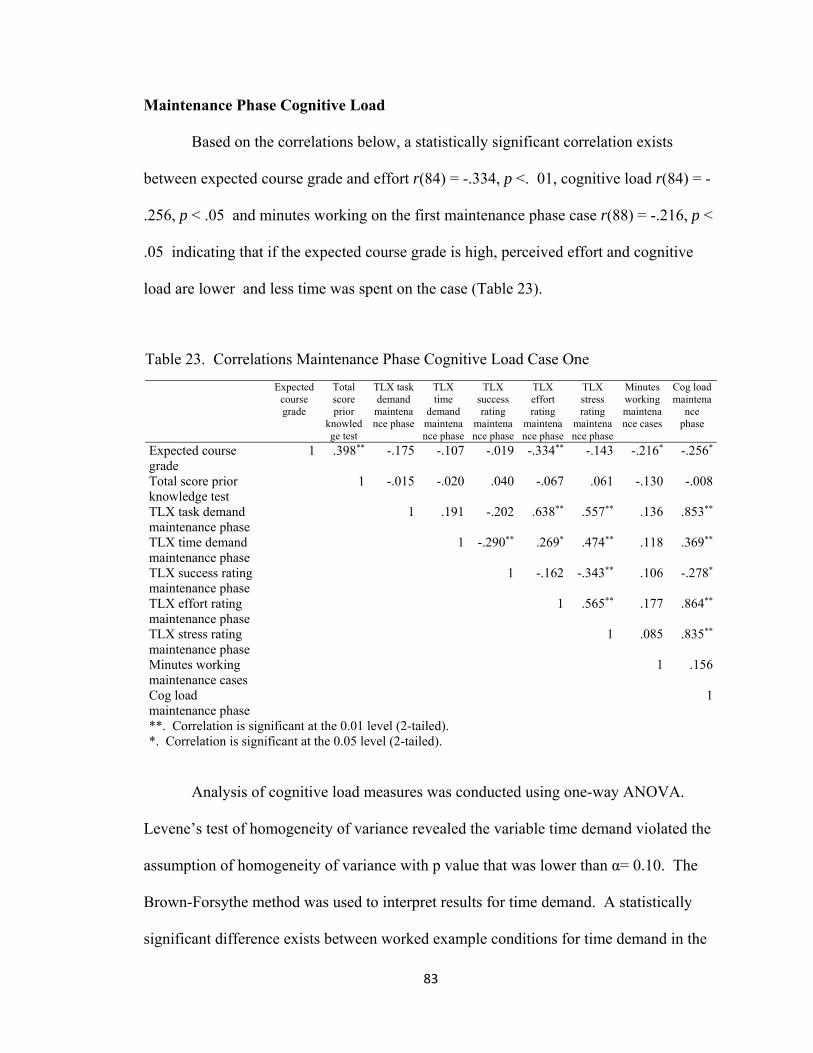
83
Maintenance Phase Cognitive Load
Based on the correlations below, a statistically significant correlation exists
between expected course grade and effort r(84) = -.334, p <. 01, cognitive load r(84) = -
.256, p < .05 and minutes working on the first maintenance phase case r(88) = -.216, p <
.05 indicating that if the expected course grade is high, perceived effort and cognitive
load are lower and less time was spent on the case (Table 23).
Table 23. Correlations Maintenance Phase Cognitive Load Case One
Expected course grade
Total score prior
knowledge test
TLX task demand maintenance phase
TLX time
demand maintenance phase
TLX success rating
maintenance phase
TLX effort rating
maintenance phase
TLX stress rating
maintenance phase
Minutes working maintenance cases
Cog load maintena
nce phase
Expected course grade
1 .398** -.175 -.107 -.019 -.334** -.143 -.216* -.256*
Total score prior knowledge test
1 -.015 -.020 .040 -.067 .061 -.130 -.008
TLX task demand maintenance phase
1 .191 -.202 .638** .557** .136 .853**
TLX time demand maintenance phase
1 -.290** .269* .474** .118 .369**
TLX success rating maintenance phase
1 -.162 -.343** .106 -.278*
TLX effort rating maintenance phase
1 .565** .177 .864**
TLX stress rating maintenance phase
1 .085 .835**
Minutes working maintenance cases
1 .156
Cog load maintenance phase
1
**. Correlation is significant at the 0.01 level (2-tailed). *. Correlation is significant at the 0.05 level (2-tailed).
Analysis of cognitive load measures was conducted using one-way ANOVA.
Levene’s test of homogeneity of variance revealed the variable time demand violated the
assumption of homogeneity of variance with p value that was lower than α= 0.10. The
Brown-Forsythe method was used to interpret results for time demand. A statistically
significant difference exists between worked example conditions for time demand in the

84
maintenance phase for case one (PSWE M=6.2, SD=4.7; PDWE M=4.2, SD=3.8), with
those in the PSWE condition reporting more time demand, Brown-Forsythe F(1, 86.02) =
4.5, p = .036. ω2=.039 indicates that 3.9% of the variance in time demand is accounted
for by worked example condition. There was no statistically significant difference
between worked example conditions for effort; however, the difference is noticeable, F
(1,82) =3.3, p =.073, ω2=.027 indicates that 2.7% of the variance in effort is accounted
for by worked example condition.
Table 24 outlines the results of the cognitive load measures for case one of the
maintenance phase.
Table 24. Main study maintenance phase cognitive load - case one (M; SD)
Worked example condition PSWE PDWE
Total n=88 46 42
Time spent working the practice cases (minutes) 22.9 (6.1) 22.6 (5.0)
Cognitive load learning (task, effort, stress) 27.8 (13.5) 23.4 (11.1)
Missing cases 3 1
Perceived Cognitive load-NASA TLX (0-20 scale for each item)
Task demand 9.5(5.1) 8.3 (4.3)
Missing cases 3 1
Time demand 6.2(4.7) 4.2 (3.8)
Missing cases 3 1
Success 11.6 (4.5) 11.9 (4.2)
Missing cases 3 1
Effort 10.6 (5.1) 6.6 (4.7)
Missing cases 3 1
Stress 7.7 (5.4) 6.6 (4.6)
Missing cases 3 1
Based on the correlations below, a statistically significant correlation exists
between expected course grade and effort r(87) = -.337, p <. 01, cognitive load r(87) = -

85
.258, p < .05 and minutes working on the second maintenance phase case r(91) = -.222, p
< .05 indicating that if the expected course grade is high, perceived effort and cognitive
load are lower and less time was spent on the case (Table 25).
Table 25. Correlations Main Study Maintenance Phase Cognitive Load Case Two- TLX
task demand maintenance phase
TLX time demand maintenance phase
TLX success rating maintenance phase
TLX effort rating maintenance phase
TLX stress rating maintenance phase
minutes working maintenance cases
Cog load maintenance phase
expected course grade
total score prior knowledge test
TLX task demand maintenance phase
.215* 1 -.207 .639** .539** .175 .852** -.158 -.039
TLX time demand maintenance phase
1 -.285** .275** .462** .134 .376** -.087 -.023
TLX success rating maintenance phase
1 -.186 -.340** .067 -.288** .011 .068
TLX effort rating maintenance phase
1 .561** .203 .866** -.337** -.091
TLX stress rating maintenance phase
1 .090 .828** -.159 .043
minutes working maintenance cases
1 .183 -.222* -.159
Cog load maintenance phase 1 -.258* -.034 expected course grade 1 .417** total score prior knowledge test
1
*. Correlation is significant at the 0.05 level (2-tailed). **. Correlation is significant at the 0.01 level (2-tailed).
Table 26 outlines the results of the cognitive load measures for case two of the
maintenance phase. Analysis was conducted using one-way ANOVA. Levene’s test of
homogeneity of variance revealed the variable time demand violated the assumption of
homogeneity of variance with p value that was lower than α= 0.10. The Brown-Forsythe
method was used to interpret results for time demand. A statistically significant
difference exists between worked example conditions for time demand in the
maintenance phase case two (PSWE M=6.2, SD=4.6; PDWE M=4.3, SD=3.8), with those
in the PSWE condition reporting more time demand, Brown-Forsythe F(1, 80.6) = 4.4, p

86
= .038. ω2=.038 indicates that 3.8% of the variance in time demand is accounted for by
worked example condition.
There was no statistically significant difference between worked example
conditions for effort; however, the difference is noticeable, F (1.88) =2.9, p =.091,
ω2=.021.
Table 26. Main study maintenance phase cognitive load - case two (M; SD)
Worked example Condition PSWE PDWE
Total n=91 46 45
Time spent working the practice cases (minutes) 22.9 (6.1) 23.0 (5.1)
Cognitive load learning (task, effort, stress) 27.8 (13.5) 24.0 (11.1)
Missing cases 3 1
Perceived Cognitive load-NASA TLX (0-20 scale for each item)
Task demand 9.5 (5.1) 8.4 (4.5)
Missing cases 3 1
Time demand 6.2 (4.7) 4.3 (3.8)
Missing cases 3 1
Success 11.6 (4.3) 11.6 (4.3)
Missing cases 3 1
Effort 10.6 (5.1) 8.9 (4.8)
Missing cases 3 1
Stress 7.7 (5.4) 6.7 (4.5)
Missing cases 3 1
Themes from Comments from Write In Questions on NASA-TLX
Participants had an opportunity to answer two questions on the NASA-TLX for
each phase; learning, practice and maintenance. Question one was: “What was the
hardest part about working with or studying the clinical case worked examples”?

87
Question two was “Were the situations depicted in the clinical cases and worked
examples familiar to you and why”?
Learning Phase
Question one. Themes that emerged were related to reading about new
terminology and new information, reading through a lot of material, and trying to decide
what was important as they were studying the examples in a new format.
Question two. Most participants found the cases and themes of the cases similar
to course work from their own or family experiences.
Practice Phase
Question one. The most common themes that emerged were remembering where
things go in the PES format, deciding on the most important nutrition problem in the
case, and trying to decide which IDNT codes to use.
Question two. Participants reported they were familiar with similar types of case
examples from family or their own experience and that they had covered some of the
topics in the clinical cases in the nutrition class. A noticeable number of participants also
noted that the cases were not at all familiar. Participants noted the similarity between the
worked example cases and the cases they were asked to work with on their own.
Maintenance Phase
Question one. The most common themes that emerged were remembering where
things go in the PES format, deciding on the most important nutrition problem in the
case, and trying to decide which IDNT codes to use. Participants commented most
frequently on having trouble with what was an etiology and what was a sign and
symptom as part of the PES diagnostic statement.

88
Question two. Most participants reported they were familiar with similar types
of case examples from their course work or personal experience.
Calculated Efficiency
Efficiency was calculated and interpreted in the main study in the same way as for
the pilot study. There was no statistically significant difference between worked example
conditions for calculated efficiency in the practice phase of the main dissertation study
F(1,4) = 1.7 p=.264 (Figure 4)
Figure 4. Main Study Practice Phase Efficiency
Efficiency = 0
‐0.6
‐0.4
‐0.2
‐1E‐15
0.2
0.4
0.6
‐0.6 ‐0.4 ‐0.2 ‐1E‐15 0.2 0.4 0.6Ze
Zp
Main Study: Practice Phase Efficiency
C1D1Pd: E = 0.01
C1D2Pd: E = ‐0.02
C2D1Pd: E = ‐0.05
C1D1Ps: E = ‐0.02
C1D2Ps: E = 0.02
C2D1Ps: E = 0.03
Efficiency = 0

89
There is a statistically significant difference in calculated efficiency scores for the
maintenance phase cases (Figure 5). The PDWE condition was more efficient
F(1,4)=8.7, p=.042 ω2=.344. This indicates that worked example condition accounts for
34.4 % of the variance in calculated efficiency for the maintenance phase.
Figure 5. Main Study Maintenance Phase Efficiency
Efficiency = 0
‐0.6
‐0.4
‐0.2
‐1E‐15
0.2
0.4
0.6
‐0.6 ‐0.4 ‐0.2 ‐1E‐15 0.2 0.4 0.6Ze
Zp
Main Study: Maintenance Phase Efficiency
C1D1Md: E = 0.41
C2D1Md: E = 0.08
C2D2Md: E = 0.12
C1D1Ms: E = ‐0.14
C2D1Ms: E = ‐0.05
C2D2Ms: E = ‐0.21
Efficiency = 0

90
Summary of Results
Results are summarized by research question
Table 27. Summary of Results
Research Question 1. Do both product-oriented worked example and process-oriented
worked example conditions result in an ability to use International Dietetics and
Nutrition Terminology (IDNT) and Problem, Etiology, and Signs and Symptoms (PES)
statements by novices as evidenced by performance on diagnostic tasks?
Learning Phase
Practice Phase
There were no statistically significant differences between worked example
conditions for any of the variables for performance during the practice phase.
Participants in the pilot study did very well on the diagnostic tasks with both
groups scoring at or better than 74% correct for each of the three diagnostic
tasks (8.9/12).
Maintenance Phase
There were no statistically significant differences between worked example
conditions for any of the variables for performance during the maintenance
phase. Participants in the pilot study did very well on the diagnostic tasks with
both groups scoring at or better than 67.5% for each of the three diagnostic
tasks (8.1/12) correct.
Research Question 2. Does the process-oriented worked example condition result in
better performance on diagnostic tasks when compared to product-oriented worked
example condition for novices learning to use IDNT and PES charting?

91
Learning Phase
Practice Phase There were no significant differences by worked example
condition for the practice phase performance measures.
Maintenance Phase. There were no significant differences by worked
example condition for the maintenance phase performance measures.
Research Question 3. What is the difference between the process-oriented worked
example condition and the product-oriented worked example condition on training
efficiency when calculated from self-report of perceived mental effort and performance
on diagnostic tasks?
Learning Phase.
Practice Phase. There were no significant differences in calculated efficiency
by worked example condition for each of the three cases in the practice phase
for the pilot study or main study.
Maintenance Phase. There was a statistically significant difference in
calculated efficiency in the maintenance phase of the pilot and the main study;
the PDWE condition was more efficient.
Research Question 4. What is the difference in perceived cognitive load between the
product-oriented worked example condition and the process-oriented worked example
condition?
Learning Phase. There were no statistically significant differences between
worked example conditions for any of the cognitive load variables in the
learning phase of the pilot study. For both groups perceived success was high
and cognitive load as measured by the NASA-TLX subscales as a computed
92
variable combining task demand, effort and stress, was relatively low.
For the main study, a statistically significant difference exists between worked
example conditions for effort, task demand, time demand, and overall cognitive
load (computed variable) in the learning phase with those in the PSWE
condition reporting more effort for task demand, time demand, and overall
cognitive load.
Practice Phase. There was no statistically significant difference between
worked example types on any of the cognitive load variables during the practice
phase for the pilot study or the main study.
Maintenance Phase. There were no statistically significant differences
between worked example types for any of the cognitive load measures in the
pilot study.
In the main study a statistically significant difference exists between worked
example conditions for time demand in the maintenance phase with those in the
PSWE condition reporting more time demand.

93
Chapter 5
DISCUSSION
This study investigated two types of modular worked examples; process-oriented
(PSWE) and product-oriented (PDWE), for performance, cognitive load, and efficiency
for nutrition diagnosis.
One hundred and four students from a 200-level course in human nutrition
participated in the main study. Student participants completed the learning phase
studying the worked examples and the practice phase during one regularly scheduled
class period. Two weeks later the students completed the maintenance phase during half
a regularly scheduled class period. Both the practice and maintenance phases involved
making nutrition diagnoses, using the correct International Nutrition and Diagnostic
Terminology, and writing a diagnostic statement for two cases.
Discussion in this chapter will be structured around the research questions and
associated hypotheses.
Performance on Diagnostic Tasks
Question 1: Do both product-oriented worked example and process-oriented
worked example conditions result in an ability to use International Dietetics and Nutrition
Terminology (IDNT) and Problem, Etiology, and Signs and Symptoms (PES) statements
by novices as evidenced by performance on diagnostic tasks?
Hypothesis 1: Participants in either worked example condition, product-oriented
or process-oriented, will demonstrate an ability to use International Dietetics and
Nutrition Terminology (IDNT) and construct a Problem, Etiology, and Signs and
Symptoms (PES) statement.

94
Students in both conditions in the main study were able to make a nutrition
diagnoses in the practice phase and the maintenance phase after studying the two worked
examples in the learning phase for an average of 22 minutes. These participants were
able to construct a meaningful diagnostic statement using IDNT and the PES format
scored on a rubric that is consistent with expectations for nutrition professionals finishing
a dietetic internship and sitting for a national licensing exam for cases of similar
complexity.
What is particularly noteworthy is that 45.2% of participants in the practice phase
of the main study who attempted to make a diagnosis scored greater than or equal to eight
of twelve possible points (67.5% correct) on the diagnostic task with the mean higher at
87.5% correct. In the maintenance phase, 41.5% of participants in the maintenance phase
of the main study who attempted to make a diagnosis scored greater than or equal to eight
of twelve possible (67.5% correct) points on the diagnostic task with the mean higher at
87.5% correct.
The main study participants were enrolled in their first college nutrition course
when they took part in the experiment and would not have been exposed to nor expected
to have been exposed to IDNT and the PES format for constructing a diagnostic
statement as part of the introductory course. When scores for all main study participants
are taken as a whole, scores in both conditions were low (41.5% correct) indicating the
material was challenging and that, as expected, participants in this sample of
undergraduate students were truly novices in the early stages of learning about human
nutrition and the diagnostic process. Participants in the pilot study had higher levels of
prior knowledge and had been exposed to the idea of IDNT and the PES format for

95
constructing diagnostic statements compared to those in the main study. Some students
in the main study did as well as students in the pilot study (those scoring >8). Results
provide support for hypothesis one, (1) participants in either worked example condition,
product-oriented or process-oriented, will demonstrate an ability to use International
Dietetics and Nutrition Terminology (IDNT) and construct a Problem, Etiology, and
Signs and Symptoms (PES) statement.
Question 2: Does the process-oriented worked example condition result in better
performance on diagnostic tasks when compared to product-oriented worked example
condition for novices learning to use IDNT and PES charting?
Hypothesis 2: The process-oriented worked example condition will result in
higher performance scores on diagnostic tasks compared to the product-oriented worked
example condition.
There were no statistically significant differences in time on task or scores on the
diagnostic tasks between worked example conditions in the pilot study or the main study.
This is similar to results reported by Richey & Nokes-Malach (2013) when comparing
performance on problem solving tasks between students in worked examples that either
contained or withheld instructional explanations. In experiment one and two, worked
example groups for withholding or containing did not differ on problem solving
performance (Richey & Nokes-Malach, 2013). Students in both conditions in the main
study were able to make a nutrition diagnoses in the practice phase and the maintenance
phase and construct a meaningful diagnostic statements suggesting that there may not
have been a great enough difference in the worked example conditions in this study to
detect an advantage for one condition over another. The type of process information

96
provided in this study might not have been effective. Since students in the main study
had not been exposed to the diagnostic process, the added background information in the
PSWE condition may have become extraneous cognitive load that participants had to deal
with without impacting overall learning and diagnostic performance when the new cases
were encountered, negating any hypothesized advantage of the PSWE condition. There
is some support for this observation in this study when effort ratings from the NASA-
TLX in the maintenance phase are considered. Differences in perceived effort during the
maintenance phase did not reach a level of statistical significance; however; higher
perceived effort for the PSWE condition was present in both the pilot and main study. It
may be that participants in the PSWE condition, even two weeks after the initial training
phase, still experienced this extraneous cognitive load as they tried to recall the more
detailed aspects of the PSWE condition when working with the maintenance cases with
the results showing no advantage in the more detailed process information when working
with the new cases.
Efficiency
Question 3: What is the difference between the process-oriented worked
example condition and the product-oriented worked example condition on efficiency
when calculated from self-report of perceived mental effort and performance on
diagnostic tasks?
Hypothesis 3: Calculated efficiency scores will be better for the process-oriented
worked example condition compared to the product-oriented worked example condition.
There is a statistically significant difference in calculated efficiency scores for the
maintenance phase cases of the pilot study. The PDWE condition was more efficient

97
F(1,4)=43.8, p=.003, ω2=.867, indicating that worked example condition accounts for
86.7% of the variance in calculated efficiency for the maintenance phase.
There is a statistically significant difference in calculated efficiency scores for the
maintenance phase cases of the main study. The PDWE condition was more efficient
F(1,4)=8.7, p=.042, ω2=.344, indicating that worked example condition accounts for
34.4% of the variance in calculated efficiency for the maintenance phase.
It appears that the additional information provided to the participants in the
PSWE condition during training increased, rather than decreased, the effort they
expended in completing the diagnostic tasks at a time separated from the initial learning
and practice. Comparison of the pilot study to the main study shows the same large
effect for both samples, an advantage in efficiency for PDWE. Though differences in
effort ratings in the maintenance phase for PSWE reporting more effort than PDWE did
not reach a level of statistical significance, they were large enough to impact calculated
efficiency. Since performance did not differ, this observation may indicate surplus
cognitive capacity available for additional learning for those in the PDWE condition.
This is similar to the finding by Gerjets, et al., (2006) that the elaborations or process
information added to the modular worked examples did not improve performance and
appears to have negatively impacted efficiency. Results suggest students spent more
effort searching for and trying to recall more complicated aspects of diagnostic problem
solving presented in the PSWE condition. One explanation is since the PDWE condition
had only the steps and results for each step, remembering how to accomplish each sub
goal was easier when there was a two-week time interval between the initial learning and
the maintenance phase.
98
Results of this study do not support hypothesis three (3), calculated efficiency
scores between training and transfer will be higher for the process-oriented worked
example condition compared to the product-oriented worked example condition. There
was no difference in the practice phase and a significant difference in the maintenance
phase with the PDWE being more efficient.
Cognitive Load
Question 4: What is the difference in perceived cognitive load between the
product-oriented worked example condition and the process-oriented worked example
conditions?
Hypothesis 4-1: The process-oriented worked example condition will result in
higher perceived cognitive load scores during the training phase.
Hypothesis 4-2: Perceived success should be higher for the process-oriented
worked example condition when compared to the product-oriented worked example
condition during the practice and maintenance phases.
As hypothesized, the PSWE condition in the main study resulted in statistically
significant higher perceived cognitive load during the learning phase. This finding was
reflected in the NASA-TLX subscales of effort, time demand, task demand, and
calculated overall cognitive load score. Effect sizes were small from 1.3-5.3 % of
variance attributed to worked example condition. This differed from the decreased task
demand, stress, and effort observed on the NASA-TLX reported by Gerjets, et al. (2004)
for modular worked example with elaborations (like PSWE in this study), to those
without. In the context of the present study, the PSWE condition added three more pages
to the learning phase examples when compared to the PDWE. Comments from some of

99
the students in the write-in portion of the NASA-TLX are consistent as students reported
there was a lot to read. This might impact perceptions of time demand and task demand
especially in a classroom setting where participants might be monitoring the progress of
others and when others switched from one task to another in the experiment.
These differences did not persist in the practice phase. During the maintenance
phase, the only cognitive load sub-scale score in the main study that was significantly
different was time demand, with those in the PSWE condition reporting more time
demand than those in the PDWE. This time demand could be a result of trying to recall,
after two weeks, the more detailed elements of the process information supplied during
the learning phase for the PSWE condition when working with the new cases. Of note
are the differences in perceived effort during the maintenance phase between worked
example types with PSWE reporting higher scores for effort. This difference did not
reach a level of statistical significance; however, it was present in both the pilot and main
study and did impact calculated efficiency for the maintenance phase.
Hypothesis 4-2: Perceived success should be higher for the process-oriented
worked example condition when compared to the product-oriented worked example
condition during the practice and maintenance phases.
There was no statistically significant difference for perceived success by worked
example condition for any portion of the study. Success in the main study was basically
10 out of 20 for both practice and maintenance phases in both conditions, indicating all
participants felt moderately successful in working with the cases. There is no support
demonstrated in this study for hypothesis (4-2): perceived success should be higher for

100
the process-oriented worked example condition when compared to the product-oriented
worked example condition during the practice and maintenance phases.
Hypothesis 4-3: Perceived stress should be lower for the process-oriented
worked example condition when compared to the product-oriented worked example
condition during the practice and maintenance phases.
There was no statistically significant difference for perceived stress by worked
example condition for any portion of the study; therefore, there is no support for
hypothesis (4-3): perceived stress should be lower for the process-oriented worked
example condition when compared to the product-oriented worked example condition
during the practice and maintenance phases.
Discussion
Effect of modular worked examples on the complex skill of diagnostic problem
solving
This study adds to the evidence that supports the use of worked examples to teach
complex skills and problem solving to novices. In this study students were able to
accomplish the diagnostic tasks with some participants performing extremely well.
Modular worked examples used in this study appear well suited to the skill of the
diagnostic reasoning specific to nutrition professionals since this complex skill can be
broken down into sub-goals of (1) noting discrepancies in clinical and medical history
data, (2) naming the primary nutrition diagnosis (describing using IDNT) related to the
discrepancy, (3) connecting it to a root cause or etiology and (4) clearly indicating
objective measures from a clinical assessment that provide evidence for the diagnosis.

101
Implications for training nutrition professionals
Pass and Merriënboer (1994) state that worked examples offer an approach to
make the tacit knowledge of experts explicit by clearly demonstrating the use of general
principles when problems are well constructed. “Therefore, worked out problems can be
used as a kind of concrete schemata to map new solutions and at the same time foster
schema acquisition (pg. 365).” This observation coincides nicely with the concept of the
culture of expert practice and apprenticeship. Current nutrition provider education starts
with a bachelor degree in human nutrition and then progresses to graduate work (based
on an apprenticeship model) that prepares individuals to sit for national board
examination and licensing. The graduate portion of the process in some cases is only 10
months, limiting the time educators have to support the development of expertise. The
Nutrition Care Process, including the diagnostic portion investigated in this study, is
introduced inconsistently in undergraduate studies and is highly dependent on the
program and instructor. Use of a structured approach, such as worked examples,
developed for the prior knowledge and experience of the learner, could be introduced
early in the undergraduate process with success, as demonstrated here. Students may be
more likely to incorporate all portions of the Nutrition Care Process if, at each stage of
their education; subsequent parts are added and elaborated so that adequate schema for
the assessment, diagnostic, intervention, and monitoring portions of the Nutrition Care
Process are ready when students enter the portion of graduate school portion of their
training program. Universities that are credentialed to train nutrition professional are
required to offer the same undergraduate content; therefore, the materials to be covered in
each level of the undergraduate program are well known. In this study, diagnostic tasks

102
were introduced with worked examples to students at the 200 level; this could further be
investigated by using worked examples for the intervention and monitoring stages at the
300 and 400 level.
Implications for Intervention Design of Worked Examples
In the application of worked example in this study, students were able to work
independently with no coaching by the investigator. Well written materials such as the
ones used in this study could be used as homework or as an augment to class work even
for instructors less familiar with teaching nutrition diagnosis and use of IDNT. This
study also demonstrated it was very feasible to use the worked example strategy within
an authentic classroom setting without the need for digital or online materials and within
the time frame allotted for weekly instruction.
PSWE did not result in better diagnostic performance than PDWE in this study.
PDWE are easier to construct since there is no need within the example to explain the
steps. Complexity could be added to the PDWE cases as students add to their knowledge
and experience increasing germane cognitive load. In addition, more experienced
students can be asked to consider a larger array of diagnostic categories and terms.
Process information, typically covered by the instructor in the discussion and lecture
portion of a class, might be all that is needed for novices at this stage of their education.
Implications for Assessment of Diagnostic Performance
Using a rubric designed along with the cases, as for this study, makes scoring PES
statements more meaningful and the rubric itself can be used as a tool for instruction after
the diagnostic tasks are completed and scored. The nutrition faculty member who

103
volunteered to score a random sample from the pilot study commented that it was great to
have something to follow when evaluating PES diagnostic statements.
Strengths and Limitations of the Study
The domain of human nutrition is large and this study limited, by design, the
complexity of the material presented to the students and the diagnostic terms students
were asked to consider. This was appropriate for the population of interest and this
sample; however, it limits how broadly results can be interpreted. Interpretation is
appropriate for undergraduate nutrition students in credentialed programs meeting
requirements for students entering graduate programs in human nutrition. The prior
knowledge test constructed for this research covered a large array of nutrition concepts
resulting in poor internal consistency; however, the score on this test differed predictably
between the pilot study (81.6-85% correct answers) and the main study (52.9 - 56.7%
correct answers).
Cognitive load is a complicated construct and that makes measuring it difficult.
The goal of this research was not to address the question of cognitive load measurement,
instead to use an instrument that has been applied to this area of research to add
information for interpretation of experimental results. This study extended the work of
others in an alternative to the one item Paas & Merriënboer (1993) scale by using the
NASA-TLX for assessing cognitive load in worked example research (Hart & Staveland,
1988; Gerjets et al., 2004; Gerjets et al., 2006). Using calculated efficiency to describe
differences in worked example research adds to evidence for this approach and was a
strength in the present study. The difference noted in the maintenance phase indicate that
worked example research needs not only to look at the immediate performance measures

104
when evaluating worked example approaches, but also the effect of those approaches that
occur after the initial training phase as these might be the most important when deciding
which worked example approach to use with a specific student population.
In this experiment there was no alternative to learning the material except by
worked example condition for the students in the main study. They would not have been
exposed to IDNT or expected to use it or the format for constructing diagnostic
statements. Since there is strong support for worked example strategies for teaching
novices over conventional problem solving, this was not investigated in the present study.
This study has potential for high ecological validity as discrepancies in training
and adoption of IDNT have been noted in the nutrition literature. The sample of
undergraduate novices was appropriate for this preliminary work and for generalizability;
application would be for undergraduate students taking nutrition courses.
Implications and Recommendations for Future Research
Questions that arise regarding this research center primarily on how this approach
to teaching nutrition diagnosis compares to other education strategies. Since there are no
specific strategies suggested or supported in the nutrition literature for teaching this skill,
suggestions for future research include: (1) testing the worked example format for
teaching nutrition diagnosis against a classroom approach where students were expected
to learn this skill and that the material was covered in lecture and homework. In other
words, what is the alternative to worked example for this teaching this skill and can it be
replicated? (2) Would a worked example approach to teaching IDNT improve diagnostic
skills and use of IDNT in already licensed and practicing nutrition professionals? (3)

105
Does this approach also work as students move to 300-400 level courses and complexity
of diagnosis and intervention increase?
Conclusions
In this study students were able to accomplish the diagnostic tasks with some
participants performing extremely well. Modular worked examples used in this study
appear well suited to the skill of the diagnostic reasoning specific to nutrition
professionals. Further research is necessary to determine if modular worked examples
offer an advantage over other educational approaches to teach nutrition diagnosis.
Results suggest an application of worked examples for training nutrition professionals.

106
List of Appendices
Appendix A – Demographics
Appendix B – General Nutrition Knowledge Test
Appendix C – Task Load Index - Learning Phase
Appendix D – Task Load Index – Practice Phase
Appendix E – Task Load Index – Maintenance Practice Phase
Appendix F – Directions and Practice Case #1 Scoring PES
Appendix G – Practice Case #2 Scoring Rubric PES
Appendix H – Maintenance Case #1 Scoring PES
Appendix I – Maintenance Case #2 Scoring PES
Appendix J – Nutrition Diagnostic Terminology
Appendix K – Product Oriented Worked Examples (PDWE)-Learning Phase
Appendix L – Process Oriented Worked Example (PSWE)-Learning Phase
Appendix M – Practice Cases
Appendix N – Maintenance Cases
Appendix O – UNM IRB Consent
Appendix P – CNM Student Dissertation Consent
Appendix Q – CNM Faculty Dissertation Consent

107
Appendix A – Demographics
Please answer the following questions related to demographics.
1. What is your age _____ (years)?
2. In which ethnic group would you categorize yourself? a. White (non-Hispanic) b. Black c. Asian d. Native American/Alaska Native e. Pacific Islander f. Hispanic g. Other
3. What is your gender?
a. Female b. Male
4. Do you intend to pursue a career as a nutrition professional (Registered Dietitian,
Dietetic Technician, Food Service Manager, or Public Health Nutritionist)? a. Yes b. No
5. Which nutrition course made you eligible for participating in this study?
a. Nutrition 2110 (CNM) b. Nutrition 1015 (CNM) c. Nutrition 244 (UNM)
6. What grade do you expect to earn in the nutrition course indicated above?
a. A b. B c. C d. D e. F
7. How many college level nutrition courses have you taken? _____(number of
courses)

108
Appendix B – General Nutrition Knowledge Test
For the following questions related to general clinical nutrition knowledge, please circle the best answer.
1. Which of the following are the correct six categories of nutrients needed for human consumption?
a. Fat, alcohol, carbohydrate, protein, vitamins, minerals b. Fat, carbohydrate, fiber, protein, vitamins, minerals c. Fat, carbohydrate, protein, water, vitamins, minerals d. Fat, carbohydrate, protein, fiber, water, vitamins e. Fat, carbohydrate, protein, fiber, water, alcohol
2. The four leading nutrition-related causes of death of late adulthood include:
a. heart disease, pneumonia, cancer, and obesity b. heart disease, cancer, obesity, and inadequate exercise c. heart disease, cancer, stroke and diabetes mellitus d. unintentional injury, cancer, stroke and diabetes mellitus
3. How many kilocalories are there in one gram of protein, fat, and carbohydrate,
respectively? a. 5, 9, 7 b. 9, 4, 4 c. 7, 9, 5 d. 4, 9, 4 e. 5, 7, 9
4. The term that describes recommended intake levels of nutrients (reference standards)
for planning and assessing diets in all healthy persons is known as: a. Adequate Intake Levels. b. Tolerable Upper Limits. c. Essential Nutrients. d. Dietary Reference Intakes.
5. A food label ingredient list reads: wheat flour, vegetable shortening, sugar, salt, and
cornstarch. What item would be found in the HIGHEST amount in that food? a. Salt b. Sugar c. Wheat flour d. Cornstarch e. Vegetable shortening
6. What food serving below does NOT provide significant amounts of iron?
a. Round steak, 3 oz b. Pork and beans, ½ cup c. Peaches, ½ cup d. Iron-fortified breakfast cereal, 1 cup

109
7. What is the acceptable/normal range of BMI in adults (kg/m2)? a. 4-10 b. 19-25 c. 24-30 d. 29-35 e. 9-15
8. The Estimated Average Requirement (EAR) means:
a. intake level meets the nutrient needs of 98% of healthy people. b. intake value meets the nutrient needs of half the healthy individuals in a
group. c. upper limits of a nutrient compatible with health. d. nutrient intake standards for healthy people. e. this is a “tentative” RDA.
9. Which vitamins act as antioxidants?
a. Vitamin B12 b. Vitamin C c. Vitamin E d. a and b e. b and c
10. What is the daily caloric intake level that the daily values on the food nutrition label
are based on? a. 1000 calories b. 1200 calories c. 1800 calories d. 2000 calories
11. A practical guideline to help identify a meat serving (cooked) according to the
Choose my Plate model is a portion that equals the size of a deck of cards. How many ounces of meat would this be?
a. 1 ounce b. 2 ounces c. 2 ½ - 3 ounces. d. 4-5 ounces
12. The Food and Nutrition board recommends ______ of water per Calorie of food
ingested. a. 1 milliliter b. 1 ounce c. 1 liter d. 1 cup
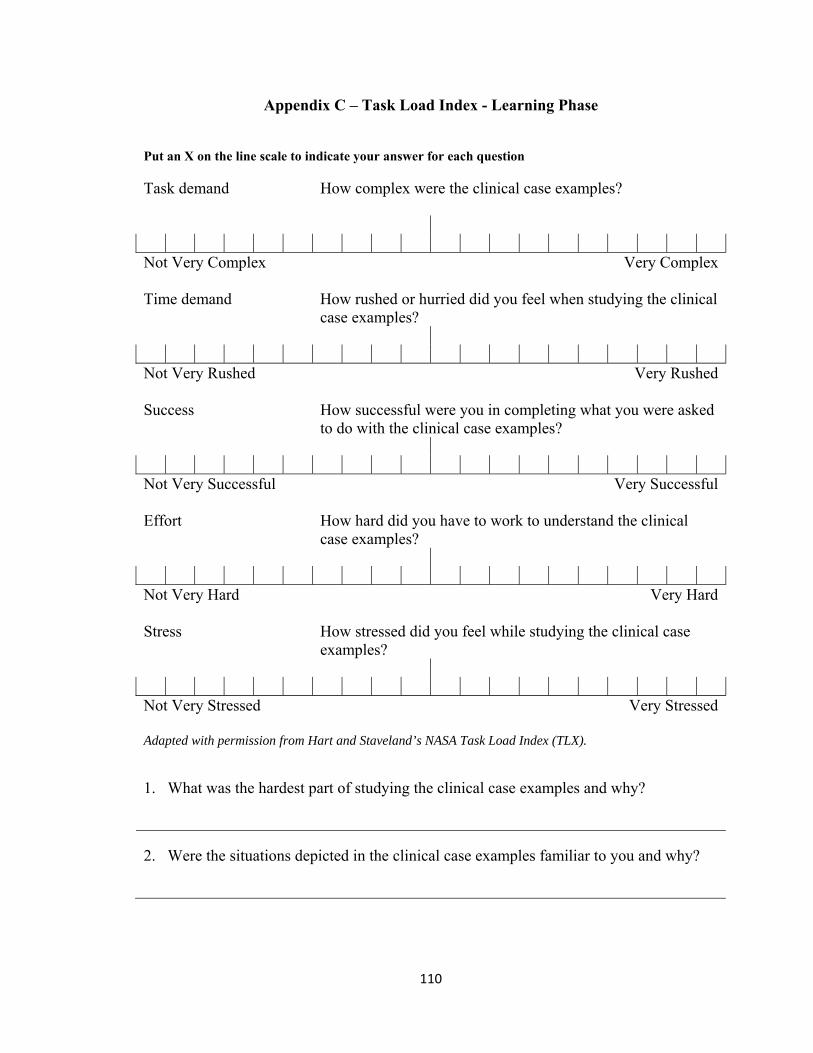
110
Appendix C – Task Load Index - Learning Phase
Put an X on the line scale to indicate your answer for each question
Task demand How complex were the clinical case examples?
Not Very Complex Very Complex
Time demand How rushed or hurried did you feel when studying the clinical case examples?
Not Very Rushed Very Rushed
Success How successful were you in completing what you were asked to do with the clinical case examples?
Not Very Successful Very Successful
Effort How hard did you have to work to understand the clinical case examples?
Not Very Hard Very Hard
Stress How stressed did you feel while studying the clinical case examples?
Not Very Stressed Very Stressed
Adapted with permission from Hart and Staveland’s NASA Task Load Index (TLX).
1. What was the hardest part of studying the clinical case examples and why?
2. Were the situations depicted in the clinical case examples familiar to you and why?
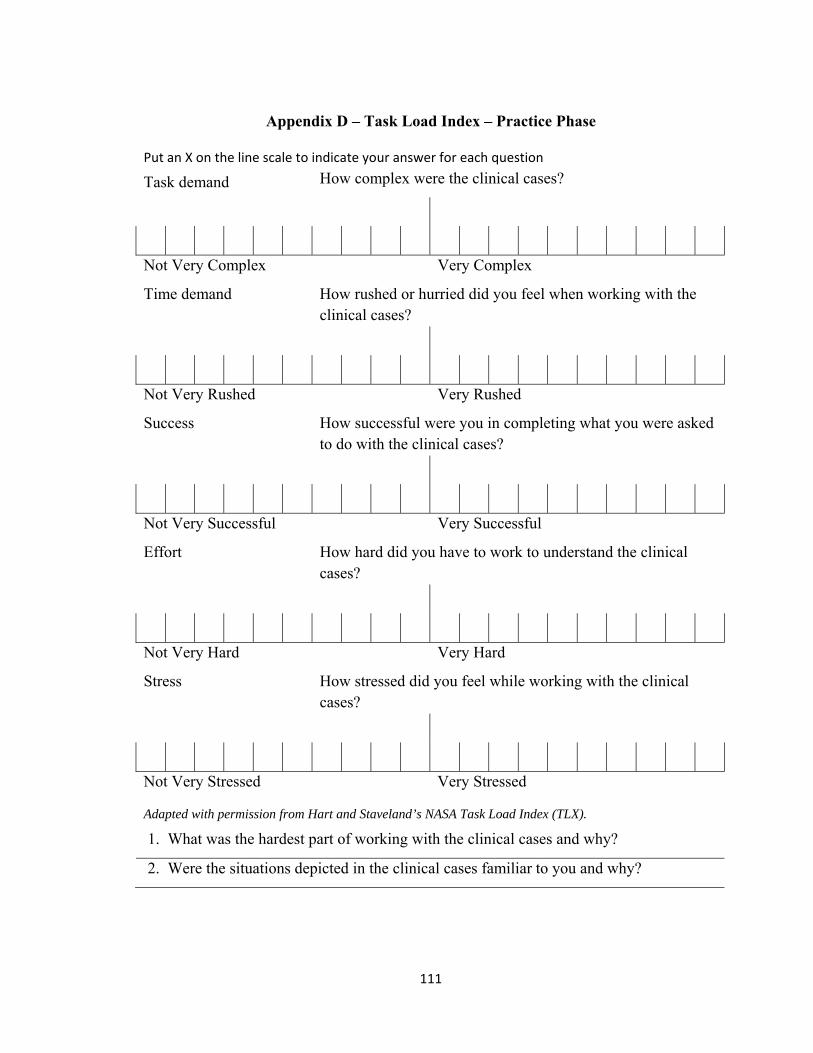
111
Appendix D – Task Load Index – Practice Phase
Put an X on the line scale to indicate your answer for each question
Task demand How complex were the clinical cases?
Not Very Complex Very Complex
Time demand How rushed or hurried did you feel when working with the clinical cases?
Not Very Rushed Very Rushed
Success How successful were you in completing what you were asked to do with the clinical cases?
Not Very Successful Very Successful
Effort How hard did you have to work to understand the clinical cases?
Not Very Hard Very Hard
Stress How stressed did you feel while working with the clinical cases?
Not Very Stressed Very Stressed
Adapted with permission from Hart and Staveland’s NASA Task Load Index (TLX).
.1. What was the hardest part of working with the clinical cases and why?
.2. Were the situations depicted in the clinical cases familiar to you and why?

112
Appendix E – Task Load Index – Maintenance Practice Phase
Put an X on the line scale to indicate your answer for each question
Task demand How complex were the clinical cases?
Not Very Complex Very Complex
Time demand How rushed or hurried did you feel when working with the clinical cases?
Not Very Rushed Very Rushed
Success How successful were you in completing what you were asked to do with the clinical cases?
Not Very Successful Very Successful
Effort How hard did you have to work to understand the clinical cases?
Not Very Hard Very Hard
Stress How stressed did you feel while working with the clinical cases?
Not Very Stressed Very Stressed
Adapted with permission from Hart and Staveland’s NASA Task Load Index (TLX).
.1. What was the hardest part of working with the clinical cases and why?
.2. Were the situations depicted in the clinical cases familiar to you and why?

113
Appendix F – Directions and Practice Case #1 Scoring PES
Directions for Using Scoring Charts for PES
P=Diagnosis E=Related To (Etiology) S=As evidenced by (signs
and symptoms)
There are 8 possible points in
this section for assigning a
diagnosis code. Use the
points listed in front of each
diagnosis to score the
diagnosis.
The number of the diagnosis
is sufficient (e.g. 1.1 or
5.11.2) instead of writing out
the diagnosis.
There are 2 possible points in
this section for identifying an
etiology. 2 points for a
match on the scoring rubric,
1 point for related, but not
the root cause, and 0 if not
an etiology, related, or blank.
There are 2 possible points in
this section. 2 points for a
match on the scoring rubric,
1 point for related, but
missing objective measurable
signs (BMI% etc., and 0 if not
a symptom or sign, or blank.
If there are 2 PES statements
for a case, each is scored
separately.
If there are 2 PES statements
as part of the case, each is
scored separately.
Line numbers from the case
instead of written out
answers are acceptable.
If there are 2 PES statements
as part of the case, each is
scored separately.
Line numbers from the case
instead of written out
answers are acceptable.
Example:
8 if diagnosis name and
number is the highest
possible if the diagnosis
matches the rubric. 4 is
scored if not as precise a
diagnosis, 2 if related but
more broad and less specific
than the diagnosis that would
have scored 4, and 0 if it does
not match anything on the
rubric or is not present.
If diagnosis not present or
incorrect can still score
etiology since being able to
distinguish issues in the case
is a different skill than using
the diagnosis codes.
If diagnosis not present or
incorrect can still score signs
and symptoms since being
able to distinguish issues in
the case is a different skill
than using the diagnosis
code.
Score recorded in this section
should be written on the
student’s work as each
section will be entered into
analysis for errors separately.
Score recorded in this
section should be written on
the student’s work as each
section will be entered into
analysis for errors separately.
Score recorded in this section
should be written on the
student’s work as each
section will be entered into
analysis for errors separately.

114
Practice Case #1 Scoring PES
P=Diagnosis E=Related To (Etiology) E=Related To (Etiology)
Practice Case #1 (isomorphic) Protein 8 Inadequate protein intake 5.7.1
↑ needs leg fracture (L1)↓ motivation to cook meals (L11) Avoids milk and eggs (L28)
↓prealbumin, 11 (range 16‐40) (L8) Protein intake 47g (L30) estimated needs 64‐95 g (L34)
Energy Balance 8 Inadequate Energy Intake 1.2 8 Predicted suboptimal energy intake 1.4
Ill‐fitting dentures and dry mouth (L10) Estimated energy needs 1746.5 kcal/d (L33) and current intake 1313 kcal/d (L30)
Weight 87% usual (L3) Weight 140# was 160# 6 months ago (L2‐3)
Oral or Nutrition Support Intake 4 Inadequate oral intake 2.1
Ill‐fitting dentures and dry mouth (L10)
Estimated energy needs 1746.5 kcal/d (L33) and current intake 1313 kcal/d (L30) Weight 140# was 160# 6 months ago (L2‐3)
Nutrient 8 Inadequate protein‐energy intake 5.3 4 Increased nutrient needs 5.1 2 malnutrition 5.2
Avoids milk and eggs (L28) ↑ needs leg fracture (L1) ↓ motivation to cook meals (L11) Estimated energy needs 1746.5 kcal/d (L33) and current intake 1313 kcal/d (L30) Protein intake 47g (L30) estimated needs 64‐95 g (L34)
Protein intake 47g (L30) estimated needs 64‐95 g (L34) Estimated energy needs 1746.5 kcal/d (L33) and current intake 1313 kcal/d (L30) Protein intake 47g (L30) estimated needs 64‐95 g (L34)
Multi‐nutrient 8 Predicted suboptimal nutrient intake 5.11.1 Energy and protein
↑ needs leg fracture (L1) ↓ motivation to cook meals (L11) Estimated energy needs 1746.5 kcal/d (L33) and current intake 1313 kcal/d (L30) Protein intake 47g (L30) estimated needs 64‐95 g (L34 ↑ needs leg fracture (L1)
Protein intake 47g (L30) estimated needs 64‐95 g (L34 Estimated energy needs 1746.5 kcal/d (L33) and current intake 1313 kcal/d (L30)

115
Appendix G – Practice Case #2 Scoring Rubric PES
P=Diagnosis E=Related To (Etiology) S=As evidenced by (signs and symptoms)
Practice Case #2 (novel)
Oral or Nutrition Support Intake 8 excessive oral intake 2.2
Taking Twin Lab Supplement (L 14, 15) 4 caps/d in addition to eating regular meals and snacks (L2, 3)
Multiple (can list) vitamins/minerals >100% DV on label
Vitamin 8 Excess vitamin intake 5.9.2
Taking Twin Lab Supplement (L 14, 15) 4 caps/d
Bioactive substance 8 excessive bioactive substance intake 4.2
Taking Twin Lab Supplement (L 14, 15) 4 caps/d
Vitamin A, C, E, B1, B2, Niacin (B3),B6, B12, > 100% DV on label
Mineral 8 Excessive Mineral intake 5.10.2
Taking Twin Lab Supplement (L 14, 15) 4 caps/d
Multiple (can list) vitamins/minerals >100% DV on label
Multi nutrient 8 Predicted excessive nutrient intake 5.11.2
Taking Twin Lab Supplement (L 14, 15) 4 caps/d in addition to eating regular meals and snacks (L2, 3)
Selenium, Manganese, Chromium >100% DV Multiple (can list) vitamins/minerals >100% DV on label

116
Appendix H – Maintenance Case #1 Scoring PES
P=Diagnosis E=Related To (Etiology) S=As evidenced by (signs and
symptoms)
Maintenance Case #1 (isomorphic) Energy Balance 8 excessive energy intake 1.3 8 predicted excessive energy intake 1.5
Intake of 2955 kcal/d (L26,27)
> estimated needs of 2411
kcal/d (L 29)
Cafeteria meals (L3) and/or
↑ calorie bo led pasta sauce
meal at home (L22)
BMI at 26.2 (L7) target 18.5‐
24.9
Intake of 2955 kcal/d (L26,27)
> estimated needs of 2411
kcal/d (L 29)
Oral or Nutrition Support Intake 8 excessive oral intake 2.2
Limited physical activity with
long commute (L1) and golf
w/cart as exercise (L 5,6)
Cafeteria meals (L3) and/or
↑ calorie bo led pasta sauce
meal at home (L22)
Intake of 2955 kcal/d (L26,27)
> estimated needs of 2411
kcal/d (L 29)

117
Appendix I – Maintenance Case #2 Scoring PES
P=Diagnosis E=Related To (Etiology) S=As evidenced by (signs and
symptoms)
Maintenance Case #2 (Novel)
Energy Balance 8 Inadequate energy intake 1.2 8 predicted suboptimal energy intake 1.4
↓ea ng (L4,5) and/or↓
eating because of fatigue (L6)
↓ea ng (L4,5) and/or↓
eating because of fatigue (L6)
and continued training (L4)
Wt loss of 4 # (L4) in 3 weeks
95.4% of usual body weight
(L8)
BMI % is 2% (range 5‐85%)
(L9)
Oral or Nutrition Support Intake 8 inadequate oral intake 2.1
↓ea ng (L4,5) and/or↓
eating because of fatigue (L6)
Limited iron rich foods in diet
Iron intake 8 mg/d <
estimated needs of 15‐18
mg/d (L25, 30)
Estimated energy needs of
2600 kcal/d > current intake
of 1970 kcal (L22, 26)
Estimated needs of 2600
kcal/d > current intake of
1970 kcal (L22, 26)
Hct 33%<acceptable 37‐47%
(10)
Nutrient 8 increased nutrient needs 5.1 Energy and/or iron 2 malnutrition 5.2 4 Imbalance of nutrients 5.5
Estimated needs of 2600
kcal/d > current intake of
1970 kcal (L22, 26)
↓ea ng (L4,5) and/or↓
eating because of fatigue (L6)
and/or limited iron rich foods
in diet ↓
limited iron rich foods in diet
Iron intake 8 mg/d <
estimated needs of 15‐18
mg/d (L25, 30)
Wt loss of 4 # (L4) in 3 weeks
BMI % is 2% (range 5‐85%)
(L9)
Estimated needs of 2600
kcal/d > current intake of
1970 kcal (L22, 26)
Hct 33%<acceptable 37‐47%
(10)
Protein 4 Excessive Protein intake
diet ↑ protein rich foods
Iron intake 8 mg/d <
estimated needs of 15‐18
mg/d (L25, 30)
Bioactive Substance 8 Inadequate bioactive
↓ea ng (L4,5) and/or↓
Estimated protein needs 47‐
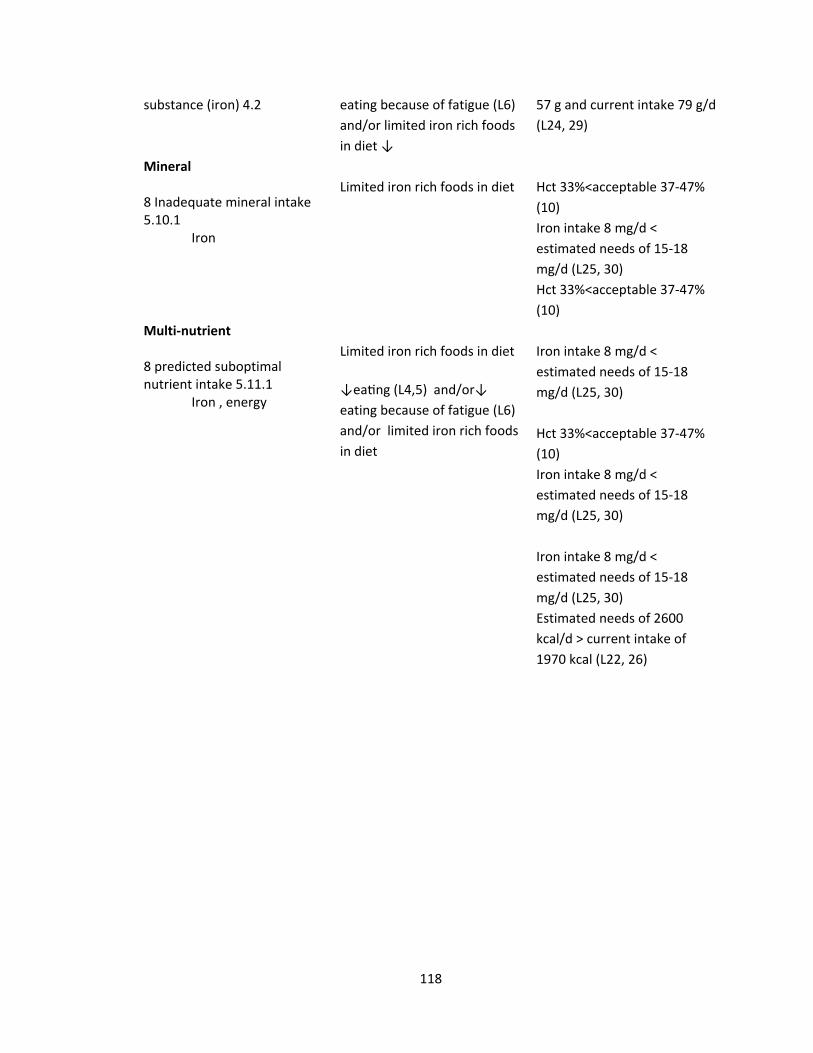
118
substance (iron) 4.2 eating because of fatigue (L6)
and/or limited iron rich foods
in diet ↓
57 g and current intake 79 g/d
(L24, 29)
Mineral 8 Inadequate mineral intake 5.10.1 Iron
Limited iron rich foods in diet
Hct 33%<acceptable 37‐47%
(10)
Iron intake 8 mg/d <
estimated needs of 15‐18
mg/d (L25, 30)
Hct 33%<acceptable 37‐47%
(10)
Multi‐nutrient 8 predicted suboptimal nutrient intake 5.11.1 Iron , energy
Limited iron rich foods in diet
↓ea ng (L4,5) and/or↓
eating because of fatigue (L6)
and/or limited iron rich foods
in diet
Iron intake 8 mg/d <
estimated needs of 15‐18
mg/d (L25, 30)
Hct 33%<acceptable 37‐47%
(10)
Iron intake 8 mg/d <
estimated needs of 15‐18
mg/d (L25, 30)
Iron intake 8 mg/d <
estimated needs of 15‐18
mg/d (L25, 30)
Estimated needs of 2600
kcal/d > current intake of
1970 kcal (L22, 26)

119
Appendix J – Nutrition Diagnostic Terminology *
Each term has an alpha-numeric IDNT code. Include the alpha-numeric IDNT code in this exercise.1 INTAKE Defined as “actual problems related to intake of energy, nutrients, fluids, bioactive substances through oral diet or nutrition support” 1
Energy Balance (1) Defined as “actual or estimated changes in energy
(calorie/kcal/kJ) balance Fat and Cholesterol (5.6)
Increased energy expenditure NI‐1.1 Inadequate fat intake NI‐5.6.1
Inadequate energy intake NI‐1.2 Excessive fat intake NI‐5.6.2
Excessive energy intake NI‐1.3 Less than optimal intake of types of fats (specify) __________________________________________
NI‐5.6.3
Predicted suboptimal energy intake NI‐1.4 Protein (5.7)
Predicted excessive energy intake NI‐1.5 Inadequate protein intake NI‐5.7.1
Oral or Nutrition Support Intake (2) Defined as “actual or estimated
food and beverage intake from oral diet or nutrition support compared with
patient goal”
Excessive protein intake NI‐5.7.2
Inadequate oral intake NI‐2.1 Less than optimal intake of types of proteins or amino acids (specify) _________________________
NI‐5.7.3
Excessive oral intake NI‐2.2 Carbohydrate and Fiber (5.8)
Limited food acceptance NI‐2.9 Inadequate carbohydrate intake NI‐5.8.1
Fluid Intake (3) Defined as “actual or estimated fluid intake compared with patient goal”
Excessive carbohydrate intake NI‐5.8.2
Inadequate fluid intake NI‐3.1 Less than optimal intake of types of carbohydrate (specify) ___________________________________
NI‐5.8.3
Excessive fluid intake NI‐3.2 Inconsistent carbohydrate intake NI‐5.8.4
Bioactive Substances (4) Defined as “actual or observed intake of bioactive substances, including single or multiple functional food components, ingredients, dietary supplements, alcohol”
Inadequate fiber intake NI‐5.8.5
Inadequate bioactive substance intake (specify) _________________________________________
NI‐4.1 Excessive fiber intake NI‐5.8.6
Excessive bioactive substance intake (specify) _________________________________________
NI‐4.2 Vitamin (5.9)
Excessive alcohol intake NI‐4.3 Inadequate vitamin intake (specify) __________________________________________
NI‐5.9.1
Nutrient (5) Defined as “actual or estimated intake of specific nutrient
groups or single nutrients as compared with desired levels” Excessive vitamin intake (specify)
__________________________________________ NI‐5.9.2
Increased nutrient needs (specify) _______________________________________
NI‐5.1 Mineral (5.10)
Malnutrition NI‐5.2 Inadequate mineral intake (specify) __________________________________________
NI‐5.10.1
Inadequate protein‐energy intake NI‐5.3 Excessive mineral intake (specify) __________________________________________
NI‐5.10.2
Decreased nutrient needs (specify) NI‐5.4 Multi‐Nutrient ( 5.11)
Imbalance of nutrients NI‐5.5 Predicted suboptimal nutrient intake (specify) __________________________________________
NI‐5.11.1
Predicted excessive nutrient intake (specify) __________________________________________
NI‐5.11.2
This list has omitted some IDNT codes for the purposes of this exercise.
1 International Dietetics and Nutrition Terminology (IDNT) Reference Manual (2013) Fourth Edition, American Dietetic Association, Chicago, IL.

120
Appendix K – Product Oriented Worked Examples (PDWE)-Learning Phase
You are a student enrolled in a program to train you to be a nutrition professional
in the United States health care system. Nutrition professionals design nutrition care
plans for prevention, treatment, and management of nutrition problems in humans. They
function as part of a healthcare team that typically includes doctors, nurses, and other
health professionals. Nutrition professionals are the nutrition experts and are integral to
successful medical care of individuals.
The following worked examples outline the steps taken when establishing a
nutrition diagnosis and labeling that diagnosis using International Dietetics and Nutrition
Terminology (IDNT) and writing a Problem, Etiology, and Signs/Symptoms (PES)
statement consistent with that diagnosis. The PES statement is the format required to
document the nutrition diagnosis in the patient’s medical record. The purpose of using
standardized language such as IDNT is to describe nutrition problems consistently so that
they are clear to all who care for a particular individual patient. Enhanced
communication and documentation leads to improved patient care.
A nutrition diagnosis identifies a specific nutrition problem that can be treated or
managed by a nutrition professional using a nutrition intervention. Nutrition
professionals write a PES statement to describe the problem, its root cause, and the
assessment data that provide evidence for the diagnosis. The format for the PES
statement is “___________ (nutrition problem (P) using IDNT) related to _________
(Evidence (E)) as evidenced by _________ (Signs and Symptoms (S))”.
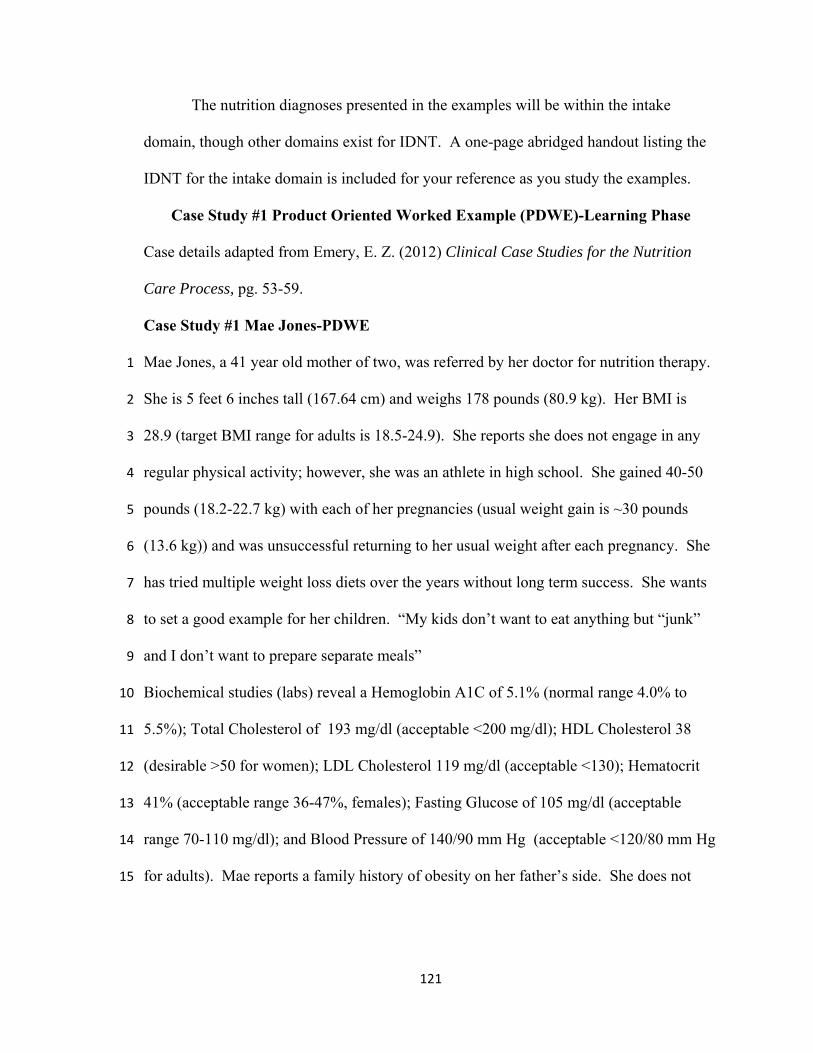
121
The nutrition diagnoses presented in the examples will be within the intake
domain, though other domains exist for IDNT. A one-page abridged handout listing the
IDNT for the intake domain is included for your reference as you study the examples.
Case Study #1 Product Oriented Worked Example (PDWE)-Learning Phase
Case details adapted from Emery, E. Z. (2012) Clinical Case Studies for the Nutrition
Care Process, pg. 53-59.
Case Study #1 Mae Jones-PDWE
Mae Jones, a 41 year old mother of two, was referred by her doctor for nutrition therapy. 1
She is 5 feet 6 inches tall (167.64 cm) and weighs 178 pounds (80.9 kg). Her BMI is 2
28.9 (target BMI range for adults is 18.5-24.9). She reports she does not engage in any 3
regular physical activity; however, she was an athlete in high school. She gained 40-50 4
pounds (18.2-22.7 kg) with each of her pregnancies (usual weight gain is ~30 pounds 5
(13.6 kg)) and was unsuccessful returning to her usual weight after each pregnancy. She 6
has tried multiple weight loss diets over the years without long term success. She wants 7
to set a good example for her children. “My kids don’t want to eat anything but “junk” 8
and I don’t want to prepare separate meals” 9
Biochemical studies (labs) reveal a Hemoglobin A1C of 5.1% (normal range 4.0% to 10
5.5%); Total Cholesterol of 193 mg/dl (acceptable <200 mg/dl); HDL Cholesterol 38 11
(desirable >50 for women); LDL Cholesterol 119 mg/dl (acceptable <130); Hematocrit 12
41% (acceptable range 36-47%, females); Fasting Glucose of 105 mg/dl (acceptable 13
range 70-110 mg/dl); and Blood Pressure of 140/90 mm Hg (acceptable <120/80 mm Hg 14
for adults). Mae reports a family history of obesity on her father’s side. She does not 15
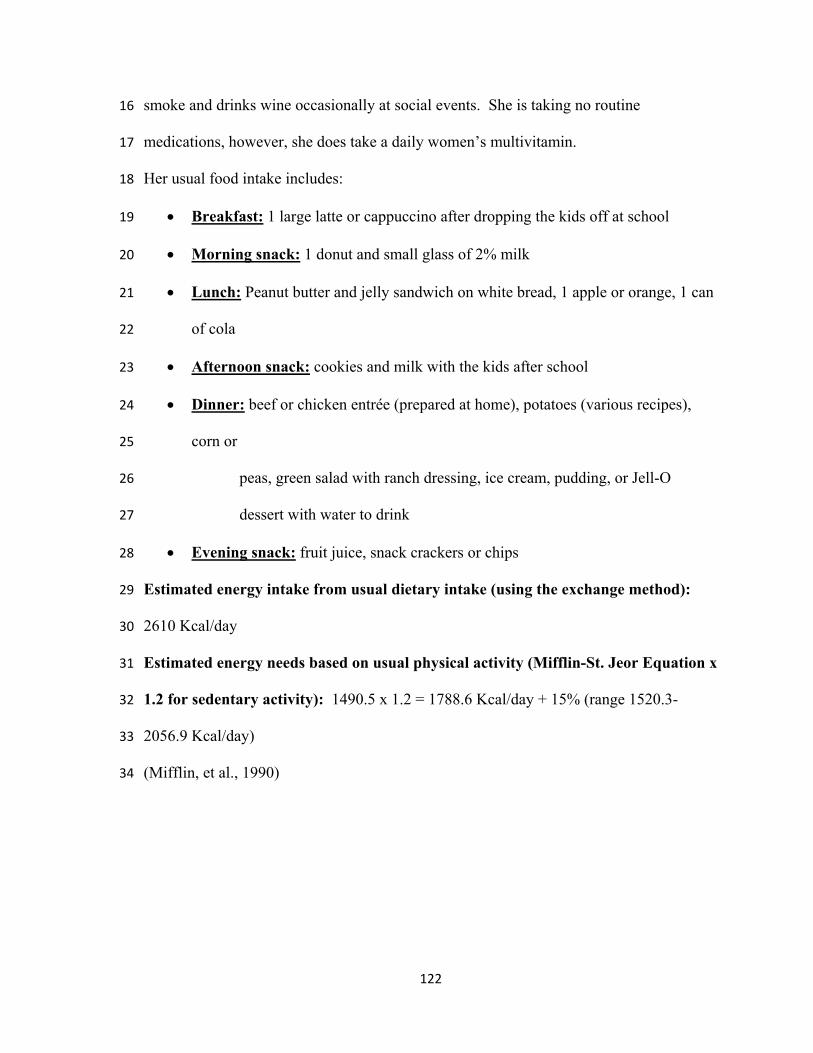
122
smoke and drinks wine occasionally at social events. She is taking no routine 16
medications, however, she does take a daily women’s multivitamin. 17
Her usual food intake includes: 18
Breakfast: 1 large latte or cappuccino after dropping the kids off at school 19
Morning snack: 1 donut and small glass of 2% milk 20
Lunch: Peanut butter and jelly sandwich on white bread, 1 apple or orange, 1 can 21
of cola 22
Afternoon snack: cookies and milk with the kids after school 23
Dinner: beef or chicken entrée (prepared at home), potatoes (various recipes), 24
corn or 25
peas, green salad with ranch dressing, ice cream, pudding, or Jell-O 26
dessert with water to drink 27
Evening snack: fruit juice, snack crackers or chips 28
Estimated energy intake from usual dietary intake (using the exchange method): 29
2610 Kcal/day 30
Estimated energy needs based on usual physical activity (Mifflin-St. Jeor Equation x 31
1.2 for sedentary activity): 1490.5 x 1.2 = 1788.6 Kcal/day + 15% (range 1520.3-32
2056.9 Kcal/day) 33
(Mifflin, et al., 1990)34

123
Step 1: Determine the portions of the case study that correspond to each of these
components of a nutrition assessment: Anthropometric (A), Biochemical (labs) (B),
Clinical (C), Dietary (D), Environmental (E), and Functional (F).
NUTRITION ASSESSMENT
Anthropometric (A) Height: 5 feet 6 inches tall (167.64 cm):
weight 178 pounds (80.9 kg)
BMI: 28.9 (target BMI range for adults is 18.5-24.9)
(Lines 3, 4)
Biochemical (labs) (B) Hemoglobin A1C of 5.1% (normal range 4.0% to
5.5%);
Total Cholesterol of 193 mg/dl (acceptable <200 mg/dl); HDL Cholesterol 38 (desirable >50 for women);
LDL Cholesterol 119 mg/dl (acceptable <130);
Hematocrit 41% (acceptable range 36-47%, females);
Fasting Glucose of 105 mg/dl (acceptable range 70-
110 mg/dl); (Lines 10-13) Clinical (C) Blood Pressure of 140/90 mm Hg (acceptable
<120/80 mm Hg for adults).(Line 14) gained 40-50 pounds (18.2-22.7 kg) with each of her
pregnancies (usual weight gain is ~30 pounds (13.6 kg)) and was unsuccessful returning to her usual
weight after each pregnancy (Line 5-7) family history of obesity (Line 15)
Dietary (D)
Has tried multiple weight loss diets without success
(Line 7) takes a daily women’s multivitamin (Line 16) Estimated energy intake from usual dietary intake
(using the exchange method): 2610 Kcal/day (Line 28)
Estimated energy needs based on usual physical activity (Mifflin-St. Jeor Equation x 1.2 for sedentary activity): 1490.5 x 1.2 = 1788.6 Kcal/day + 15%
(range 1520.3-2056.9 Kcal/day) (Lines 29-30) Environmental (E)
No regular physical activity (Line 4) She wants to set a good example for her children.
“My kids don’t want to eat anything but “junk” and I
don’t want to prepare separate meals” (Lines 8-9) No smoking (Line 15) Wine at social events occasionally (Line 15)
Functional (F)

124
Step 2: There are elements that fall outside normal values and acceptable ranges.
NUTRITION ASSESSMENT
Anthropometric (A) Height: 5 feet 6 inches tall (167.64 cm):
weight 178 pounds (80.9 kg)
BMI: 28.9 (target BMI range for adults is 18.5-24.9) (Lines 3, 4)
Biochemical (labs) (B) Hemoglobin A1C of 5.1% (normal range 4.0% to 5.5%);
Total Cholesterol of 193 mg/dl (acceptable <200 mg/dl);
HDL Cholesterol 38 (desirable >50 for women);
LDL Cholesterol 119 mg/dl (acceptable <130);
Hematocrit 41% (acceptable range 36-47%, females);
Fasting Glucose of 105 mg/dl (acceptable range 70-110 mg/dl); Lines 10-13)
Clinical (C) Blood Pressure of 140/90 mm Hg (acceptable <120/80
mm Hg for adults)(Line 14)
gained 40-50 pounds (18.2-22.7 kg) with each of her pregnancies (usual weight gain is ~30 pounds (13.6 kg)) and was unsuccessful returning to her usual weight after each pregnancy(Line 5-7)
family history of obesity(Line 15)
Dietary (D) Has tried multiple weight loss diets without success
(Line 7)
takes a daily women’s multivitamin (Line 16)
Estimated energy intake from usual dietary intake (using the exchange method): 2610 Kcal/day (line 28)
Estimated energy needs based on usual physical activity (Mifflin-St. Jeor Equation x 1.2 for sedentary activity): 1490.5 x 1.2 = 1788.6 Kcal/day + 15% (range 1520.3-2056.9 Kcal/day)(Lines 29-30)
Environmental (E) No regular physical activity( Line 4)
She wants to set a good example for her children. “My kids don’t want to eat anything but “junk” and I don’t want to prepare separate meals” (Lines 8-9)
No smoking (Line 15)
Wine at social events occasionally (Line 15)
Functional (F)
Step 3: HDL is low, BP is elevated, and BMI is high. Mae does no regular
physical activity. She has tried multiple weight loss diets without success. She gained a
lot of weight with each pregnancy. She has a family history of obesity. Her energy
intake from her usual food intake is greater than her estimated needs for energy.
Nutrition Diagnosis in the Intake domain: Excessive Energy Intake (NI-1.3).
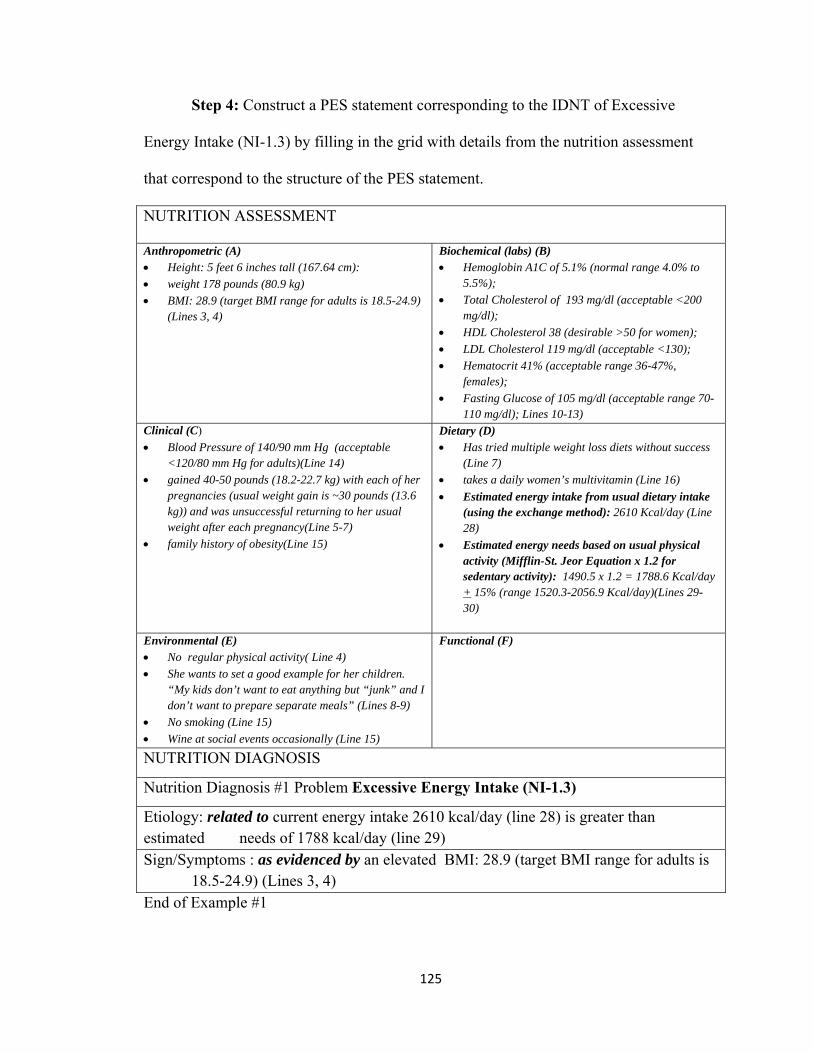
125
Step 4: Construct a PES statement corresponding to the IDNT of Excessive
Energy Intake (NI-1.3) by filling in the grid with details from the nutrition assessment
that correspond to the structure of the PES statement.
NUTRITION ASSESSMENT
Anthropometric (A) Height: 5 feet 6 inches tall (167.64 cm):
weight 178 pounds (80.9 kg)
BMI: 28.9 (target BMI range for adults is 18.5-24.9) (Lines 3, 4)
Biochemical (labs) (B) Hemoglobin A1C of 5.1% (normal range 4.0% to
5.5%);
Total Cholesterol of 193 mg/dl (acceptable <200 mg/dl);
HDL Cholesterol 38 (desirable >50 for women);
LDL Cholesterol 119 mg/dl (acceptable <130);
Hematocrit 41% (acceptable range 36-47%, females);
Fasting Glucose of 105 mg/dl (acceptable range 70-110 mg/dl); Lines 10-13)
Clinical (C)
Blood Pressure of 140/90 mm Hg (acceptable <120/80 mm Hg for adults)(Line 14)
gained 40-50 pounds (18.2-22.7 kg) with each of her pregnancies (usual weight gain is ~30 pounds (13.6 kg)) and was unsuccessful returning to her usual weight after each pregnancy(Line 5-7)
family history of obesity(Line 15)
Dietary (D) Has tried multiple weight loss diets without success
(Line 7)
takes a daily women’s multivitamin (Line 16)
Estimated energy intake from usual dietary intake (using the exchange method): 2610 Kcal/day (Line 28)
Estimated energy needs based on usual physical activity (Mifflin-St. Jeor Equation x 1.2 for sedentary activity): 1490.5 x 1.2 = 1788.6 Kcal/day + 15% (range 1520.3-2056.9 Kcal/day)(Lines 29-30)
Environmental (E) No regular physical activity( Line 4)
She wants to set a good example for her children. “My kids don’t want to eat anything but “junk” and I don’t want to prepare separate meals” (Lines 8-9)
No smoking (Line 15)
Wine at social events occasionally (Line 15)
Functional (F)
NUTRITION DIAGNOSIS
Nutrition Diagnosis #1 Problem Excessive Energy Intake (NI-1.3)
Etiology: related to current energy intake 2610 kcal/day (line 28) is greater than estimated needs of 1788 kcal/day (line 29) Sign/Symptoms : as evidenced by an elevated BMI: 28.9 (target BMI range for adults is 18.5-24.9) (Lines 3, 4) End of Example #1

126
Case Study #2 Product Oriented Worked Example (PDWE)-Learning Phase
Case details adapted from Brown, J. E. (ed.) (2005) Nutrition through the
lifecycle 2nd Ed. Thomson and Wadsworth, Belmont, CA.
Case Study #2. Kate Goode -PDWE
Kate Goode is 25 years old and is training for her first marathon with some college 1
friends. She is a graduate student and has been referred to you by the staff at the 2
university clinic because she has questions about staying healthy and strong as she trains. 3
Kate was active in high school sports and has maintained a high level of physical activity 4
in college by participating in recreational sports. The new training schedule for the 5
marathon has increased her regularly planned physical activity from about one hour (1) 6
six days per week to two hours (2) six days per week. Kate is 5 feet 8 inches tall (174.1 7
cm) and weighs 135 pounds (61.4 kg). Her Body Mass Index (BMI) is 20.3 (target BMI 8
for adults is 18.5-24.9). Her immediate family has no history of chronic illness. Kate 9
does not use any tobacco products. She drinks beer or wine socially one or two times a 10
month. She likes most foods though she avoids fried foods and desserts except 11
occasional ice cream. She has been eating a lot of meat and fish lately to increase her 12
protein intake. 13
Current calorie and protein intake based on her 24 hour dietary recall: 2090 14
kcal/day and 120 g/day of protein 15
Estimated Energy Needs (Mifflin-St. Jeor x 2.0 for high physical activity): 1417 x 16
2.0= 2835 kcal/day + 15% (range 2409.8-3260.3 kcal/day) 17
Estimated Protein Needs (0.8-1.2 g/kg): 49-73.7g/day 18

127
Step 1: Determine the portions of the case study that correspond to each of these
components of a nutrition assessment: Anthropometric (A), Biochemical (labs) (B),
Clinical (C), Dietary (D), Environmental (E), and Functional (F).
NUTRITION ASSESSMENT
Anthropometric (A) Kate is 5 feet 8 inches tall (174.1 cm) and weighs
135 pounds (61.4 kg). (line 7) Her Body Mass Index (BMI) is 20.3 (target BMI for
adults is 18.5-24.9). (line 8)
Biochemical (labs) (B)
Clinical (C) Her immediate family has no history of chronic
illness.(line 8-9)
Dietary (D) She likes most foods though she avoids fried foods and
desserts except occasional ice cream.
She has been eating a lot of meat and fish lately to increase her protein intake.
Current calorie and protein intake based on her 24 hour dietary recall: 2090 kcal/day and 120 g/day of protein
Estimated Energy Intake (Mifflin-St. Jeor x 2.0 for high physical activity): 1417 x 2.0= 2835 + 15% (range 2409.8-3260.3 kcal/day)
Estimated Protein Needs (0.8-1.2 g/kg): 49-73.7g/day
(line 12-16)
Environmental (E) Kate does not use any tobacco products. (line 9)
She drinks beer or wine socially one or two times a
month. (line 10) The new training schedule for the marathon has
increased her regularly planned physical activity from about one hour six days per week to two hours
six days per week. (line 5-6)
Functional (F)

128
Step 2: There are elements that fall outside normal values and acceptable ranges.
NUTRITION ASSESSMENT
Anthropometric (A) Kate is 5 feet 8 inches tall (174.1 cm) and weighs
135 pounds (61.4 kg). (line 7)
Her Body Mass Index (BMI) is 20.3 (target BMI for adults is 18.5-24.9). (line 8)
Biochemical (labs) (B)
Clinical (C) Her immediate family has no history of chronic
illness.(line 8-9)
Dietary (D) She likes most foods though she avoids fried foods and
desserts except occasional ice cream.
She has been eating a lot of meat and fish lately to increase her protein intake.
Current calorie and protein intake based on her 24 hour dietary recall: 2090 kcal/day and 120 g/day of protein
Estimated Energy Intake (Mifflin-St. Jeor x 2.0 for high physical activity): 1417 x 2.0= 2835 + 15% (range 2409.8-3260.3 kcal/day)
Estimated Protein Needs (0.8-1.2 g/kg): 49-73.7g/day (line 12-16)
Environmental (E) Kate does not use any tobacco products. (line 9)
She drinks beer or wine socially one or two times a month. (line 10)
The new training schedule for the marathon has increased her regularly planned physical activity from about one hour six days per week to two hours six days per week. (line 5-6)
Functional (F)
Step 3: Calorie intake is below what estimated needs will be for training and
weight maintenance and protein intake is greater than estimated needs.
Nutrition Diagnoses in the Intake domain: Predicted suboptimal energy intake
(NI 1.4) and Excessive protein intake (NI 5.7.2)

129
Step 4: Construct a PES statement corresponding to the IDNT of Predicted
suboptimal energy intake (NI 1.4) and Excessive protein intake (NI 5.7.2) by filling in the
grid with details from the nutrition assessment that correspond to the structure of the PES
statement.
NUTRITION ASSESSMENT
Anthropometric (A) Kate is 5 feet 8 inches tall (174.1 cm) and weighs
135 pounds (61.4 kg). (line 7)
Her Body Mass Index (BMI) is 20.3 (target BMI for adults is 18.5-24.9). (line 8)
Biochemical (labs) (B)
Clinical (C) Her immediate family has no history of chronic
illness.(line 8-9)
Dietary (D) She likes most foods though she avoids fried foods and
desserts except occasional ice cream.
She has been eating a lot of meat and fish lately to increase her protein intake.
Current calorie and protein intake based on her 24 hour dietary recall: 2090 kcal/day and 120 g/day of protein
Estimated Energy Intake (Mifflin-St. Jeor x 2.0 for high physical activity): 1417 x 2.0= 2835 + 15% (range 2409.8-3260.3 kcal/day)
Estimated Protein Needs (0.8-1.2 g/kg): 49-73.7g/day (line 12-16)
Environmental (E) Kate does not use any tobacco products. (line 9)
She drinks beer or wine socially one or two times a month. (line 10)
The new training schedule for the marathon has increased her regularly planned physical activity from about one hour six days per week to two hours six days per week. (line 5-6)
Functional (F)
NUTRITION DIAGNOSIS
Nutrition Diagnosis #1 Problem Predicted suboptimal energy intake (NI 1.4)
Etiology: related to increased training for a marathon (lines 5-6)
Sign/Symptoms: as evidenced by usual intake of energy of 2090 kcal/day compared to estimated needs of 2835 kcal for day for training and weight maintenance. (lines 12-15)
NUTRITION DIAGNOSIS
Nutrition Diagnosis #2 Problem Excessive protein intake (NI 5.7.2 )
Etiology: related to eating a lot of meat and fish lately to increase her protein intake (line

130
11)
Sign/Symptoms: as evidenced by estimated protein needs between 49-73.7 g/day (line 16) compared to current dietary protein of intake at 120g/day (line 13)
End of Example #2
Appendix L – Process Oriented Worked Example (PSWE)-Learning Phase
You are a student enrolled in a program to train you to be a nutrition professional
in the United States health care system. Nutrition professionals design nutrition care
plans for prevention, treatment, and management of nutrition problems in humans. They
function as part of a healthcare team that typically includes doctors, nurses, and other
health professionals. Nutrition professionals are the nutrition experts and are integral to
successful medical care of individuals.
The following worked examples outline the steps taken when establishing a
nutrition diagnosis and labeling that diagnosis using International Dietetics and Nutrition
Terminology (IDNT) and writing a Problem, Etiology, and Signs/Symptoms (PES)
statement consistent with that diagnosis. The PES statement is the format required to
document the nutrition diagnosis in the patient’s medical record. The purpose of using
standardized language such as IDNT is to describe nutrition problems consistently so that
they are clear to all who care for a particular individual patient. Enhanced
communication and documentation leads to improved patient care.
A nutrition diagnosis identifies a specific nutrition problem that can be treated or
managed by a nutrition professional using a nutrition intervention. Nutrition
professionals write a PES statement to describe the problem, its root cause, and the
assessment data that provide evidence for the diagnosis. The format for the PES
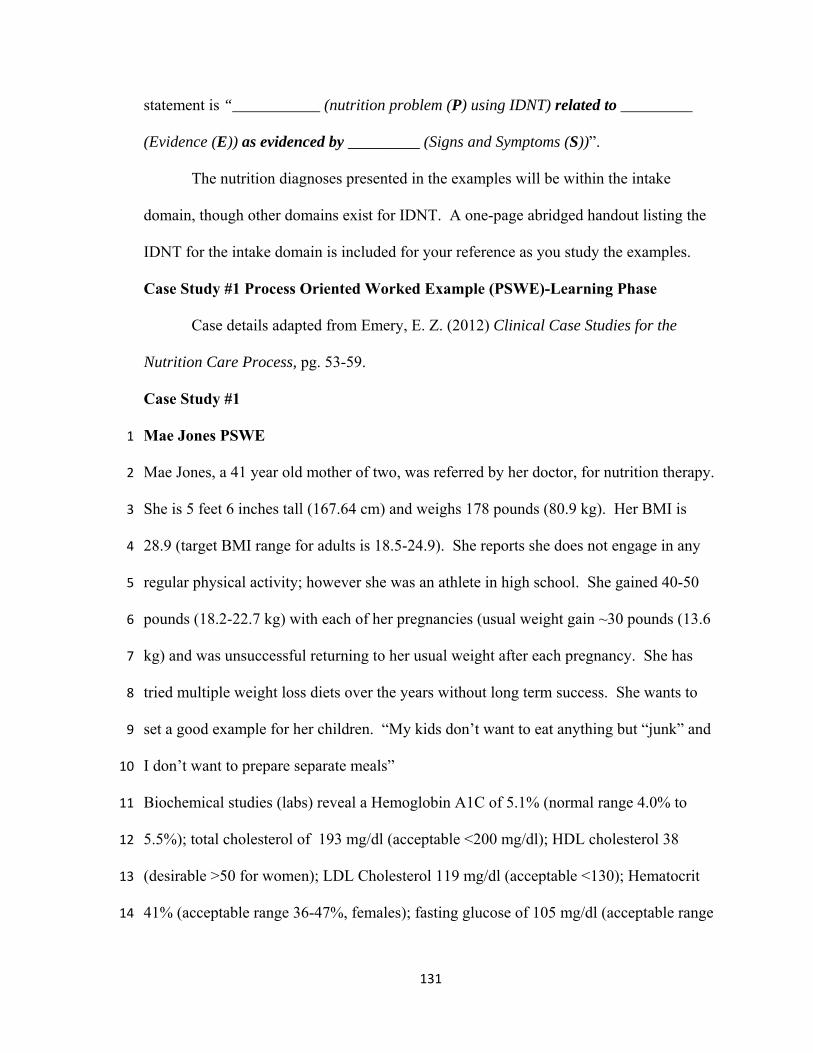
131
statement is “___________ (nutrition problem (P) using IDNT) related to _________
(Evidence (E)) as evidenced by _________ (Signs and Symptoms (S))”.
The nutrition diagnoses presented in the examples will be within the intake
domain, though other domains exist for IDNT. A one-page abridged handout listing the
IDNT for the intake domain is included for your reference as you study the examples.
Case Study #1 Process Oriented Worked Example (PSWE)-Learning Phase
Case details adapted from Emery, E. Z. (2012) Clinical Case Studies for the
Nutrition Care Process, pg. 53-59.
Case Study #1
Mae Jones PSWE 1
Mae Jones, a 41 year old mother of two, was referred by her doctor, for nutrition therapy. 2
She is 5 feet 6 inches tall (167.64 cm) and weighs 178 pounds (80.9 kg). Her BMI is 3
28.9 (target BMI range for adults is 18.5-24.9). She reports she does not engage in any 4
regular physical activity; however she was an athlete in high school. She gained 40-50 5
pounds (18.2-22.7 kg) with each of her pregnancies (usual weight gain ~30 pounds (13.6 6
kg) and was unsuccessful returning to her usual weight after each pregnancy. She has 7
tried multiple weight loss diets over the years without long term success. She wants to 8
set a good example for her children. “My kids don’t want to eat anything but “junk” and 9
I don’t want to prepare separate meals” 10
Biochemical studies (labs) reveal a Hemoglobin A1C of 5.1% (normal range 4.0% to 11
5.5%); total cholesterol of 193 mg/dl (acceptable <200 mg/dl); HDL cholesterol 38 12
(desirable >50 for women); LDL Cholesterol 119 mg/dl (acceptable <130); Hematocrit 13
41% (acceptable range 36-47%, females); fasting glucose of 105 mg/dl (acceptable range 14

132
70-110 mg/dl); and blood pressure of 140/90 mm Hg (acceptable <120/80 mm Hg for 15
adults). Mae reports a family history of obesity on her father’s side. She does not smoke 16
and drinks wine occasionally at social events. She is taking no routine medications, 17
however she does take a daily women’s multivitamin. 18
Her usual food intake includes: 19
Breakfast: 1 large latte or cappuccino after dropping the kids off at school 20
Morning snack: 1 donut and small glass of 2% milk 21
Lunch: Peanut butter and jelly sandwich on white bread, 1 apple or orange, 1 can 22
of cola 23
Afternoon snack: cookies and milk with the kids after school 24
Dinner: beef or chicken entrée (prepared at home), potatoes (various recipes), 25
corn or 26
peas, green salad with ranch dressing, ice cream, pudding, or Jell-O 27
dessert with water to drink 28
Evening snack: fruit juice, snack crackers or chips 29
Estimated energy intake from usual dietary intake (using the exchange method): 30
2610 Kcal/day 31
Estimated energy needs based on usual physical activity (Mifflin-St. Jeor Equation x 32
1.2 for sedentary activity): 1490.5 x 1.2 = 1788.6 Kcal/day + 15% (range 1520.3-33
2056.9 Kcal/day) 34
(Mifflin, St Jeor, Hill, Scott, Daugherty, & Koh, 1990)35

133
Step 1: Determine the portions of the case study that correspond to each of these
components of a nutrition assessment: Anthropometric (A), Biochemical (labs) (B),
Clinical (C), Dietary (D), Environmental (E), and Functional (F).
Assessment data can come from patients directly through interview, observations,
and measurement or from the medical record or referring healthcare provider.
Anthropometric data is height, weight, weight history and any calculations made with
that data such as BMI. It can also include other data focused on body composition such
as measuring body fat or lean body mass. Biochemical data comes from laboratory tests
or other metabolic studies. Clinical data comes from your own observations or by other
healthcare providers and includes other tests that are communicated in the medical
record or in direct conversation with other members of the healthcare team. Clinical
data may also include any past medical or family history. Dietary data includes food and
fluid intake, supplement use, and any food beliefs or behaviors. Environmental data
outlines daily living and working conditions that may impact nutrition related problems.
Functional data relates to any difficulties an individual might have with oral food
consumption such as limited motor skills for preparing and eating meals. The personal
history in a case may provide information that enhances or clarifies the information in
the other portions of the assessment.
NUTRITION ASSESSMENT
Anthropometric (A) Height: 5 feet 6 inches tall (167.64 cm):
weight 178 pounds (80.9 kg)
BMI: 28.9 (target BMI range for adults is 18.5-24.9)
(Lines 3, 4)
Biochemical (labs) (B) Hemoglobin A1C of 5.1% (normal range 4.0% to
5.5%);
Total Cholesterol of 193 mg/dl (acceptable <200 mg/dl);
HDL Cholesterol 38 (desirable >50 for women);
LDL Cholesterol 119 mg/dl (acceptable <130);
Hematocrit 41% (acceptable range 36-47%, females);
Fasting Glucose of 105 mg/dl (acceptable range 70-
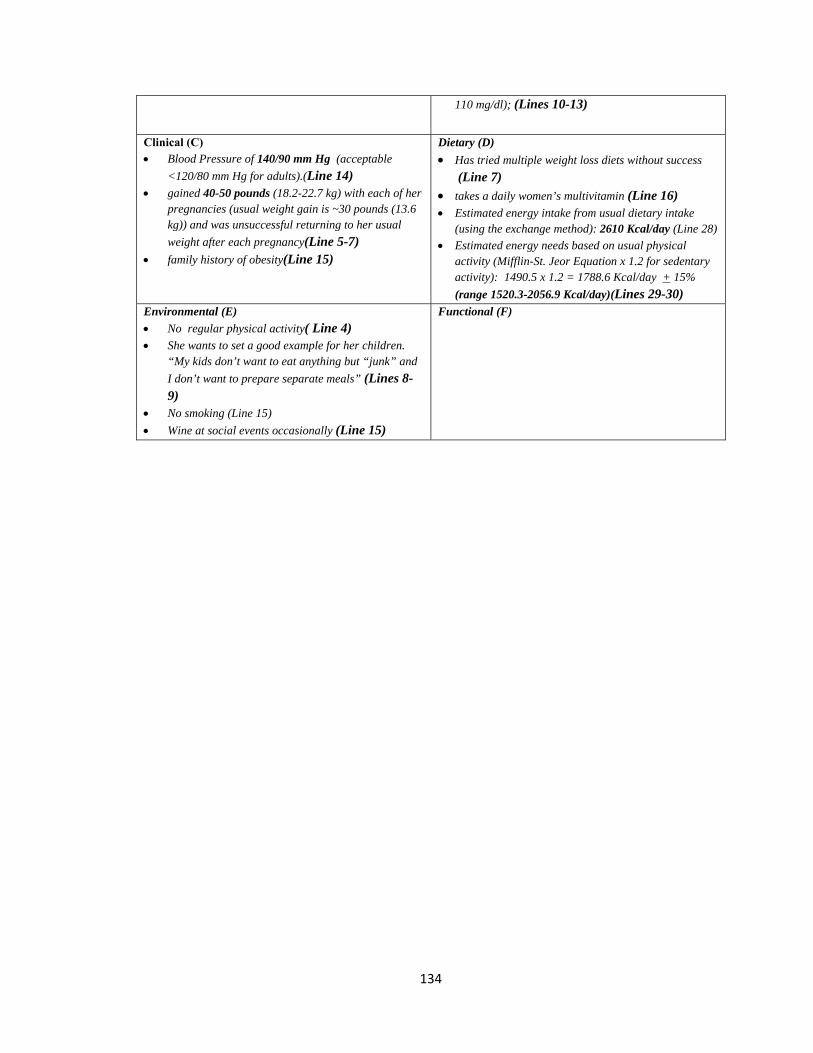
134
110 mg/dl); (Lines 10-13)
Clinical (C) Blood Pressure of 140/90 mm Hg (acceptable
<120/80 mm Hg for adults).(Line 14) gained 40-50 pounds (18.2-22.7 kg) with each of her
pregnancies (usual weight gain is ~30 pounds (13.6 kg)) and was unsuccessful returning to her usual
weight after each pregnancy(Line 5-7) family history of obesity(Line 15)
Dietary (D)
Has tried multiple weight loss diets without success (Line 7)
takes a daily women’s multivitamin (Line 16) Estimated energy intake from usual dietary intake
(using the exchange method): 2610 Kcal/day (Line 28)
Estimated energy needs based on usual physical activity (Mifflin-St. Jeor Equation x 1.2 for sedentary activity): 1490.5 x 1.2 = 1788.6 Kcal/day + 15%
(range 1520.3-2056.9 Kcal/day)(Lines 29-30) Environmental (E)
No regular physical activity( Line 4) She wants to set a good example for her children.
“My kids don’t want to eat anything but “junk” and
I don’t want to prepare separate meals” (Lines 8-9)
No smoking (Line 15)
Wine at social events occasionally (Line 15)
Functional (F)
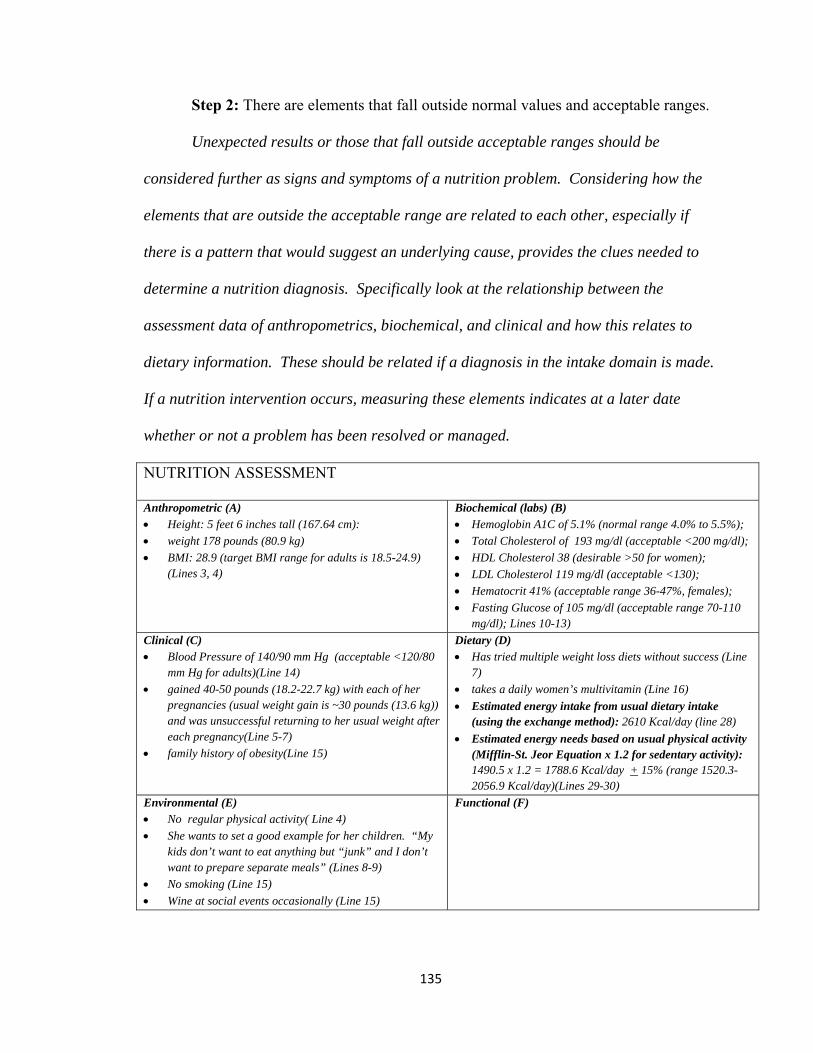
135
Step 2: There are elements that fall outside normal values and acceptable ranges.
Unexpected results or those that fall outside acceptable ranges should be
considered further as signs and symptoms of a nutrition problem. Considering how the
elements that are outside the acceptable range are related to each other, especially if
there is a pattern that would suggest an underlying cause, provides the clues needed to
determine a nutrition diagnosis. Specifically look at the relationship between the
assessment data of anthropometrics, biochemical, and clinical and how this relates to
dietary information. These should be related if a diagnosis in the intake domain is made.
If a nutrition intervention occurs, measuring these elements indicates at a later date
whether or not a problem has been resolved or managed.
NUTRITION ASSESSMENT
Anthropometric (A) Height: 5 feet 6 inches tall (167.64 cm):
weight 178 pounds (80.9 kg)
BMI: 28.9 (target BMI range for adults is 18.5-24.9) (Lines 3, 4)
Biochemical (labs) (B) Hemoglobin A1C of 5.1% (normal range 4.0% to 5.5%);
Total Cholesterol of 193 mg/dl (acceptable <200 mg/dl);
HDL Cholesterol 38 (desirable >50 for women);
LDL Cholesterol 119 mg/dl (acceptable <130);
Hematocrit 41% (acceptable range 36-47%, females);
Fasting Glucose of 105 mg/dl (acceptable range 70-110 mg/dl); Lines 10-13)
Clinical (C) Blood Pressure of 140/90 mm Hg (acceptable <120/80
mm Hg for adults)(Line 14)
gained 40-50 pounds (18.2-22.7 kg) with each of her pregnancies (usual weight gain is ~30 pounds (13.6 kg)) and was unsuccessful returning to her usual weight after each pregnancy(Line 5-7)
family history of obesity(Line 15)
Dietary (D) Has tried multiple weight loss diets without success (Line
7)
takes a daily women’s multivitamin (Line 16)
Estimated energy intake from usual dietary intake (using the exchange method): 2610 Kcal/day (line 28)
Estimated energy needs based on usual physical activity (Mifflin-St. Jeor Equation x 1.2 for sedentary activity): 1490.5 x 1.2 = 1788.6 Kcal/day + 15% (range 1520.3-2056.9 Kcal/day)(Lines 29-30)
Environmental (E) No regular physical activity( Line 4)
She wants to set a good example for her children. “My kids don’t want to eat anything but “junk” and I don’t want to prepare separate meals” (Lines 8-9)
No smoking (Line 15)
Wine at social events occasionally (Line 15)
Functional (F)

136
Step 3: HDL is low, BP is elevated, and BMI is high. Mae does no regular
physical activity. She has tried multiple weight loss diets without success. She gained a
lot of weight with each pregnancy. She has a family history of obesity. Her energy
intake from her usual food intake is greater than her estimated needs for energy.
Nutrition Diagnosis in the Intake domain is: Excessive Energy Intake (NI-1.3).
Of the information presented, only energy intake is a nutrition problem that can be
addressed by a nutrition professional using a nutrition intervention (a change in the way
nutrients are provided) for this individual. HDL is low and BP is elevated, though
potentially related, cannot be solely impacted by a nutrition intervention and are outside
the immediate care a nutrition professional can provide.
Step 4: Construct a PES statement corresponding to the IDNT of Excessive
Energy Intake (NI-1.3) by filling in the grid with details from the nutrition assessment
that correspond to the structure of the PES statement.
The root cause or the most specific cause stands out as the etiology so that using
the terms “related to” in the PES statement clearly outlines the target of the nutrition
intervention. Include the signs and symptoms from the assessment data to support this
etiology, which you can use to monitor the effectiveness of the nutrition intervention.
These are clearly stated along with the comparison to acceptable, expected, or normal
values preceded by the words “as evidenced by” from the items that were outside the
acceptable ranges in the grid.

137
NUTRITION ASSESSMENT
Anthropometric (A)
Height: 5 feet 6 inches tall (167.64 cm):
weight 178 pounds (80.9 kg)
BMI: 28.9 (target BMI range for adults is 18.5-24.9) (Lines 3, 4)
Biochemical (labs) (B)
Hemoglobin A1C of 5.1% (normal range 4.0% to 5.5%);
Total Cholesterol of 193 mg/dl (acceptable <200 mg/dl);
HDL Cholesterol 38 (desirable >50 for women);
LDL Cholesterol 119 mg/dl (acceptable <130);
Hematocrit 41% (acceptable range 36-47%, females);
Fasting Glucose of 105 mg/dl (acceptable range 70-110 mg/dl); Lines 10-13)
Clinical (C)
Blood Pressure of 140/90 mm Hg (acceptable <120/80 mm Hg for adults)(Line 14)
gained 40-50 pounds (18.2-22.7 kg) with each of her pregnancies (usual weight gain is ~30 pounds (13.6 kg)) and was unsuccessful returning to her usual weight after each pregnancy(Line 5-7)
family history of obesity(Line 15)
Dietary (D)
Has tried multiple weight loss diets without success (Line 7)
takes a daily women’s multivitamin (Line 16)
Estimated energy intake from usual dietary intake (using the exchange method): 2610 Kcal/day (Line 28)
Estimated energy needs based on usual physical activity (Mifflin-St. Jeor Equation x 1.2 for sedentary activity): 1490.5 x 1.2 = 1788.6 Kcal/day + 15% (range 1520.3-2056.9 Kcal/day)(Lines 29-30)
Environmental (E)
No regular physical activity( Line 4)
She wants to set a good example for her children. “My kids don’t want to eat anything but “junk” and I don’t want to prepare separate meals” (Lines 8-9)
No smoking (Line 15)
Wine at social events occasionally (Line 15)
Functional (F)
NUTRITION DIAGNOSIS
Nutrition Diagnosis #1 Problem Excessive Energy Intake (NI-1.3)
Etiology: related to current energy intake 2610 kcal/day (line 28) is greater than estimated needs of 1788 kcal/day (line 29) Sign/Symptoms: as evidenced by an elevated BMI: 28.9 (target BMI range for adults is 18.5-24.9) (Lines 3, 4)
End of Example #1

138
Case Study #2 Process Oriented Worked Example (PSWE)-Learning Phase
Case details adapted from Brown, J. E. (ed.) (2005) Nutrition through the lifecycle 2nd
Ed. Thomson and Wadsworth, Belmont, CA.
Case Study #2 Kate Goode -PSWE
Kate Goode is 25 years old and is training for her first marathon with some college 1
friends. She is a graduate student and has been referred to you by the staff at the 2
university clinic because she has questions about staying healthy and strong as she trains. 3
Kate was active in high school sports and has maintained a high level of physical activity 4
in college by participating in recreational sports. The new training schedule for the 5
marathon has increased her regularly planned physical activity from about one hour (1) 6
six days per week to two (2) hours six days per week. Kate is 5 feet 8 inches tall (174.1 7
cm) and weighs 135 pounds (61.4 kg). Her Body Mass Index (BMI) is 20.3 (target BMI 8
for adults is 18.5-24.9). Her immediate family has no history of chronic illness. Kate 9
does not use any tobacco products. She drinks beer or wine socially one or two times a 10
month. She likes most foods though she avoids fried foods and desserts except 11
occasional ice cream. She has been eating a lot of meat and fish lately to increase her 12
protein intake. 13
Current calorie and protein intake based on her 24 hour dietary recall: 2090 14
kcal/day and 120 g/day of protein 15
Estimated Energy Needs (Mifflin-St. Jeor x 2.0 for high physical activity): 1417 x 16
2.0= 2835 + 15% (range 2409.8-3260.3 kcal/day) 17
Estimated Protein Needs (0.8-1.2 g/kg): 49-73.7g/day18

139
Step 1: Determine the portions of the case study that correspond to each of these
components of a nutrition assessment: Anthropometric (A), Biochemical (labs) (B),
Clinical (C), Dietary (D), Environmental (E), and Functional (F).
Assessment data can come from patients directly through interview, observations,
and measurement or from the medical record or referring healthcare provider.
Anthropometric data is height, weight, weight history and any calculations made with
that data such as BMI. It can also include other data focused on body composition such
as measuring body fat or lean body mass. Biochemical data comes from laboratory tests
or other metabolic studies. Clinical data comes from your own observations or by other
healthcare providers and includes other tests that are communicated in the medical
record or in direct conversation with other members of the healthcare team. Clinical
data may also include any past medical or family history. Dietary data includes food and
fluid intake, supplement use, and any food beliefs or behaviors. Environmental data
outlines daily living and working conditions that may impact nutrition related problems.
Functional data relates to any difficulties an individual might have with oral food
consumption such as limited motor skills for preparing and eating meals. The personal
history in a case may provide information that enhances or clarifies the information in
the other portions of the assessment.

140
NUTRITION ASSESSMENT
Anthropometric (A) Kate is 5 feet 8 inches tall (174.1 cm) and weighs
135 pounds (61.4 kg). (line 7) Her Body Mass Index (BMI) is 20.3 (target BMI for
adults is 18.5-24.9). (line 8)
Biochemical (labs) (B)
Clinical (C) Her immediate family has no history of chronic
illness.(line 8-9)
Dietary (D) She likes most foods though she avoids fried foods and
desserts except occasional ice cream.
She has been eating a lot of meat and fish lately to increase her protein intake.
Current calorie and protein intake based on her 24 hour dietary recall: 2090 kcal/day and 120 g/day of protein
Estimated Energy Intake (Mifflin-St. Jeor x 2.0 for high physical activity): 1417 x 2.0= 2835 + 15% (range 2409.8-3260.3 kcal/day)
Estimated Protein Needs (0.8-1.2 g/kg): 49-73.7g/day
(line 12-16)
Environmental (E)
Kate does not use any tobacco products. (line 9) She drinks beer or wine socially one or two times a
month. (line 10) The new training schedule for the marathon has
increased her regularly planned physical activity from about one hour six days per week to two hours
six days per week. (line 5-6)
Functional (F)
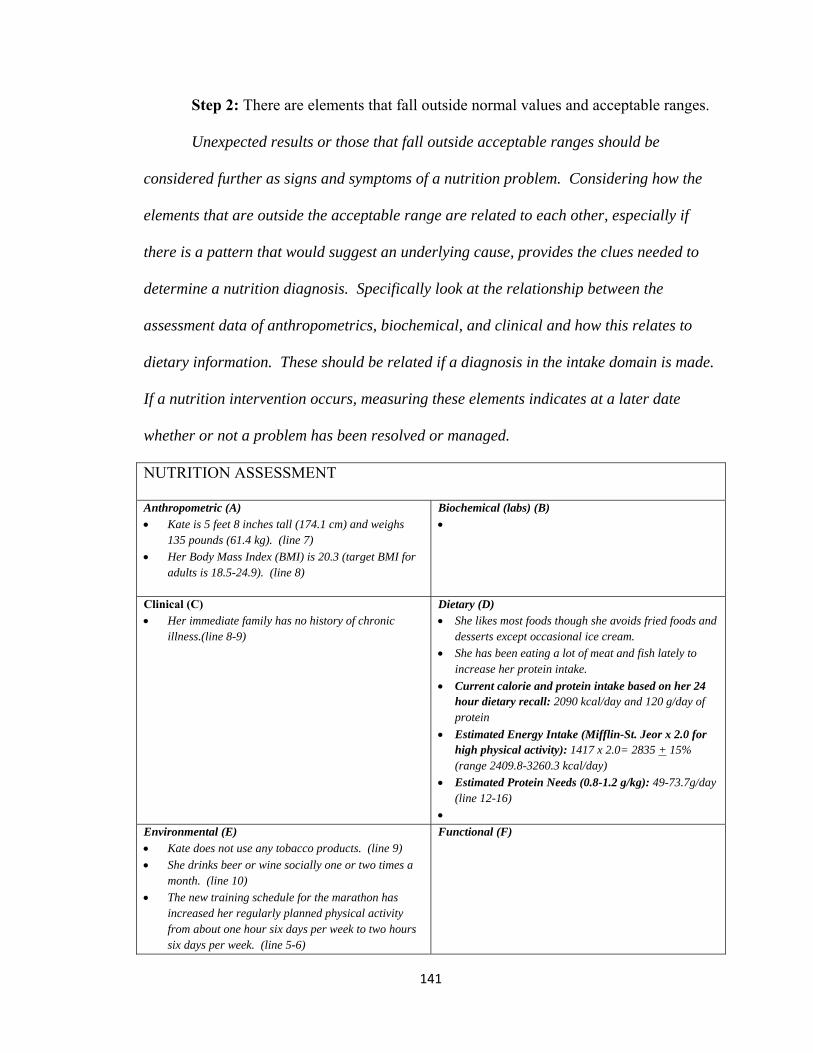
141
Step 2: There are elements that fall outside normal values and acceptable ranges.
Unexpected results or those that fall outside acceptable ranges should be
considered further as signs and symptoms of a nutrition problem. Considering how the
elements that are outside the acceptable range are related to each other, especially if
there is a pattern that would suggest an underlying cause, provides the clues needed to
determine a nutrition diagnosis. Specifically look at the relationship between the
assessment data of anthropometrics, biochemical, and clinical and how this relates to
dietary information. These should be related if a diagnosis in the intake domain is made.
If a nutrition intervention occurs, measuring these elements indicates at a later date
whether or not a problem has been resolved or managed.
NUTRITION ASSESSMENT
Anthropometric (A) Kate is 5 feet 8 inches tall (174.1 cm) and weighs
135 pounds (61.4 kg). (line 7)
Her Body Mass Index (BMI) is 20.3 (target BMI for adults is 18.5-24.9). (line 8)
Biochemical (labs) (B)
Clinical (C) Her immediate family has no history of chronic
illness.(line 8-9)
Dietary (D) She likes most foods though she avoids fried foods and
desserts except occasional ice cream.
She has been eating a lot of meat and fish lately to increase her protein intake.
Current calorie and protein intake based on her 24 hour dietary recall: 2090 kcal/day and 120 g/day of protein
Estimated Energy Intake (Mifflin-St. Jeor x 2.0 for high physical activity): 1417 x 2.0= 2835 + 15% (range 2409.8-3260.3 kcal/day)
Estimated Protein Needs (0.8-1.2 g/kg): 49-73.7g/day (line 12-16)
Environmental (E) Kate does not use any tobacco products. (line 9)
She drinks beer or wine socially one or two times a month. (line 10)
The new training schedule for the marathon has increased her regularly planned physical activity from about one hour six days per week to two hours six days per week. (line 5-6)
Functional (F)

142
Step 3: Calorie intake is below what estimated needs will be for training and
weight maintenance and protein intake is greater than estimated needs.
Nutrition Diagnoses in the Intake domain: Predicted suboptimal energy intake
(NI 1.4) and Excessive protein intake (NI 5.7.2)
Of the information presented, only the energy intake and protein intake are
nutrition problems that can be addressed by a nutrition professional using a nutrition
intervention (a change in the way nutrients are provided) for this individual.
Step 4: Construct a PES statement corresponding to the IDNT of Predicted
suboptimal energy intake (NI 1.4) and Excessive protein intake (NI 5.7.2) by filling in the
grid with details from the nutrition assessment that correspond to the structure of the PES
statement.
The root cause or the most specific cause stands out as the etiology so that using
the terms “related to” in the PES statement clearly outlines the target of the nutrition
intervention. Include the signs and symptoms from the assessment data to support this
etiology, which you can use to monitor the effectiveness of the nutrition intervention.
These are clearly stated along with the comparison to acceptable, expected, or normal
values preceded by the words “as evidenced by” from the items that were outside the
acceptable ranges in the grid.

143
NUTRITION ASSESSMENT
Anthropometric (A) Kate is 5 feet 8 inches tall (174.1 cm) and weighs 135
pounds (61.4 kg). (line 7)
Her Body Mass Index (BMI) is 20.3 (target BMI for adults is 18.5-24.9). (line 8)
Biochemical (labs) (B)
Clinical (C) Her immediate family has no history of chronic
illness.(line 8-9)
Dietary (D) She likes most foods though she avoids fried foods
and desserts except occasional ice cream.
She has been eating a lot of meat and fish lately to increase her protein intake.
Current calorie and protein intake based on her 24 hour dietary recall: 2090 kcal/day and 120 g/day of protein
Estimated Energy Intake (Mifflin-St. Jeor x 2.0 for high physical activity): 1417 x 2.0= 2835 + 15% (range 2409.8-3260.3 kcal/day)
Estimated Protein Needs (0.8-1.2 g/kg): 49-73.7g/day (line 12-16)
Environmental (E) Kate does not use any tobacco products. (line 9)
She drinks beer or wine socially one or two times a month. (line 10)
The new training schedule for the marathon has increased her regularly planned physical activity from about one hour six days per week to two hours six days per week. (line 5-6)
Functional (F)
NUTRITION DIAGNOSIS
Nutrition Diagnosis #1 Problem Predicted suboptimal energy intake (NI 1.4)
Etiology: related to increased training for a marathon (lines 5-6)
Sign/Symptoms: as evidenced by usual intake of energy of 2090 kcal/day compared to estimated needs of 2835 kcal for day for training and weight maintenance. (lines 12-15)
NUTRITION DIAGNOSIS
Nutrition Diagnosis #2 Problem Excessive protein intake (NI 5.7.2 )
Etiology: related to eating a lot of meat and fish lately to increase her protein intake (line 11) Sign/Symptoms : as evidenced by estimated protein needs between 49-73.7 g/day (line 16 compared to current dietary protein of intake at 120g/day (line 13) End of Example #2

144
Appendix M – Practice Cases
You are a student enrolled in a program to train you to be nutrition professional in
the United States health care system. Read the following cases and establish a nutrition
diagnosis using International Dietetics and Nutrition Terminology (IDNT) and write a
Problem, Etiology, and Signs/Symptoms (PES) statement consistent with that diagnosis.
A nutrition diagnosis identifies a specific nutrition problem that can be treated or
managed by a nutrition professional using a nutrition intervention. Nutrition
professionals write a PES statement to describe the problem, its root cause, and the
assessment data that provide evidence for the diagnosis. The format for the PES
statement is “___________ (nutrition problem (P) using IDNT) related to _________
(Evidence (E)) as evidenced by _________ (Signs and Symptoms (S))”.
The nutrition diagnoses presented in the examples will be within the intake
domain, though other domains exist for IDNT. A one-page abridged handout listing the
IDNT for the intake domain is included for your reference as you establish diagnoses for
the cases.
The PES statement will documented in the patient’s medical record in the grid
format provided. Write out your answers in the grid or write the line number in the
case corresponding to the elements you have chosen to focus on in the diagnostic process.
Either way is fine.

145
Case Study #1 Practice cases
Case details adapted from Emery, E. Z. (2012) Clinical Case Studies for the
Nutrition Care Process, pg. 53-59.
Case Study # 1 Mrs. Cobb Practice Case
Mrs. Cobb is a 76-year old woman admitted to the hospital with a lower right leg 1
fracture, after tripping over her cat at home. Her height is 67” (170.2 cm), and her weight 2
is 140 pounds (63.6 kg). Her weight six months ago was 160 pounds (72.7 kg). She is 3
87.5% of her usual body weight. Her BMI is 22. (Target BMI range for adults is 18.5-4
24.9). She has lost 12.5% of her usual body weight in the past six months. She has a 5
history of hypertension (elevated blood pressure). Her current blood pressure is 128/65 6
mm Hg (acceptable <120/80 mm Hg for adults). Biochemical studies (labs) reveal; 7
albumin 3.2 g/dl (target range 3.2-5.5 g/dl), prealbumin 11 mg/dl (target range 16-40 8
mg/dl), and blood glucose of 108 mg/dl (target range 70-110 mg/dl) Mrs. Cobb lives 9
alone since the death of her husband six months ago. When talking with Mrs. Cobb you 10
notice her dentures click a lot. She also complains that her mouth is dry. She reports 11
decreased motivation to cook meals in the last six months. She does not use any tobacco 12
products or consume alcohol. She currently takes 20 mg/day of Furosemide (a diuretic as 13
part of her treatment for hypertension). 14
Her usual diet consists of: 15
Breakfast: 8 oz. decaffeinated tea with 1 T half and half, 1 t sugar, 16
1 slice white toast with 1 t margarine and 1 tsp jelly or 17
1 frozen pancake with 1 T syrup 18
4 ounces of orange juice 19

146
Lunch: Canned soup, usually chicken noodle, 1 cup 20
4 unsalted crackers with 2 T peanut butter 21
½ peaches, canned in light syrup 22
Sweetened ice tea, 1 cup 23
Dinner: Chicken thigh with skin, stewed 24
½ cup rice or potato with 1 t margarine 25
½ cup spinach or carrots 26
8 oz. decaffeinated tea with 1 T cream and 1 t sugar 27
Snacks: none; avoids eggs and milk due to food preferences 28
Estimated energy and protein intake from usual dietary intake using the exchange 29
method: 30
1313 kcal/day and 47 g of protein 31
Estimated energy needs using Mifflin-St. Jeor Equation x 1. 5 (.2 for sedentary 32
activity and .3 for moderate illness/injury): 33
1746.5 kcal/day + 15% (1484-2008 kcal/day) on current weight of 63.3 kg 34
Estimated protein needs (1.0-1.5 g/kg for moderate illness): 64-95 g/day of protein35

147
NUTRITION ASSESSMENT
Anthropometric (A) Biochemical (labs) (B)
Clinical (C) Dietary (D)
Environmental (E) Functional (F)
NUTRITION DIAGNOSIS
Nutrition Diagnosis #1 Problem:
Etiology: related to
Sign/Symptoms: as evidenced by
Nutrition Diagnosis #2 Problem:
Etiology: related to
Sign/Symptoms: as evidenced by

148
Case Study #2 Practice cases
Case Study # 2 John Lewis - Practice Case
John Lewis is a 19 year old sophomore in college living in the dorm and consuming his 1
meals in the college dining hall on a meal plan. His meal plan allows him 3 meals per 2
day. He has a small refrigerator and microwave in his dorm room for snacks and 3
beverages when the dining hall is not open. He has been concerned that the meals he 4
chooses to eat in the dining hall may not be as balanced as they should be. He exercises 5
with friends in the college recreation center and has heard others talk about taking a 6
multivitamin and mineral supplement. He purchased a supplement at the local drug store 7
and has been taking it for the past 6 months. At a recent health screening sponsored by 8
the college student health clinic, John asked for a referral to a dietitian to discuss his diet 9
and the supplement he is taking. John is 5 feet 11 inches tall (181.2 cm) and weighs 180 10
pounds (81.8 kg). His Body Mass Index (BMI) is 25.1 and is plotted at the 77% for his 11
age (healthy BMI range is 5-85% in adolescents and young adults to age 20). John has 12
had no major illnesses and no chronic health problems. Both his parents are well with no 13
major health problems. John receives primary care at the student health clinic and is up 14
to date on all his required immunizations. He is taking TwinLabs supplement for men as 15
directed on the label (4 capsules per day). He has brought the bottle to this appointment.16
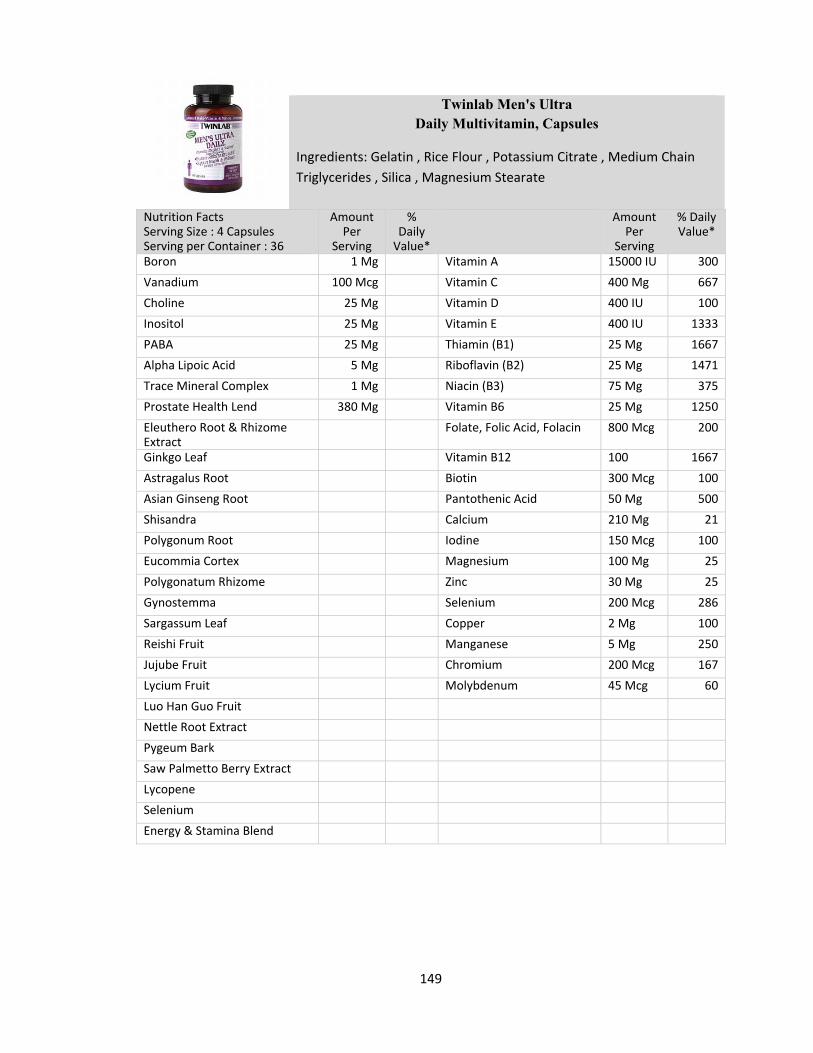
149
Twinlab Men's Ultra Daily Multivitamin, Capsules
Ingredients: Gelatin , Rice Flour , Potassium Citrate , Medium Chain
Triglycerides , Silica , Magnesium Stearate
Nutrition Facts Serving Size : 4 Capsules Serving per Container : 36
Amount Per
Serving
% Daily Value*
Amount Per
Serving
% Daily Value*
Boron 1 Mg Vitamin A 15000 IU 300
Vanadium 100 Mcg Vitamin C 400 Mg 667
Choline 25 Mg Vitamin D 400 IU 100
Inositol 25 Mg Vitamin E 400 IU 1333
PABA 25 Mg Thiamin (B1) 25 Mg 1667
Alpha Lipoic Acid 5 Mg Riboflavin (B2) 25 Mg 1471
Trace Mineral Complex 1 Mg Niacin (B3) 75 Mg 375
Prostate Health Lend 380 Mg Vitamin B6 25 Mg 1250
Eleuthero Root & Rhizome Extract
Folate, Folic Acid, Folacin 800 Mcg 200
Ginkgo Leaf Vitamin B12 100 1667
Astragalus Root Biotin 300 Mcg 100
Asian Ginseng Root Pantothenic Acid 50 Mg 500
Shisandra Calcium 210 Mg 21
Polygonum Root Iodine 150 Mcg 100
Eucommia Cortex Magnesium 100 Mg 25
Polygonatum Rhizome Zinc 30 Mg 25
Gynostemma Selenium 200 Mcg 286
Sargassum Leaf Copper 2 Mg 100
Reishi Fruit Manganese 5 Mg 250
Jujube Fruit Chromium 200 Mcg 167
Lycium Fruit Molybdenum 45 Mcg 60
Luo Han Guo Fruit
Nettle Root Extract
Pygeum Bark
Saw Palmetto Berry Extract
Lycopene
Selenium
Energy & Stamina Blend

150
NUTRITION ASSESSMENT
Anthropometric (A) Biochemical (labs) (B)
Clinical (C) Dietary (D)
Environmental (E) Functional (F)
NUTRITION DIAGNOSIS
Nutrition Diagnosis #1 Problem:
Etiology: related to
Sign/Symptoms: as evidenced by

151
Appendix N – Maintenance Cases
You are a student enrolled in a program to train you to be nutrition professional in
the United States health care system. Read the following cases and establish a nutrition
diagnosis using International Dietetics and Nutrition Terminology (IDNT) and write a
Problem, Etiology, and Signs/Symptoms (PES) statement consistent with that diagnosis.
A nutrition diagnosis identifies a specific nutrition problem that can be treated or
managed by a nutrition professional using a nutrition intervention. Nutrition
professionals write a PES statement to describe the problem, its root cause, and the
assessment data that provide evidence for the diagnosis. The format for the PES
statement is “___________ (nutrition problem (P) using IDNT) related to _________
(Evidence (E)) as evidenced by _________ (Signs and Symptoms (S))”.
The nutrition diagnoses presented in the examples will be within the intake
domain, though other domains exist for IDNT. A one-page abridged handout listing the
IDNT for the intake domain is included for your reference as you establish diagnoses for
the cases.
The PES statement will be documented in the patient’s medical record in the grid
format provided. Write out your answers in the grid or write the line number in the case
corresponding to the elements you have chosen to focus on in the diagnostic process.
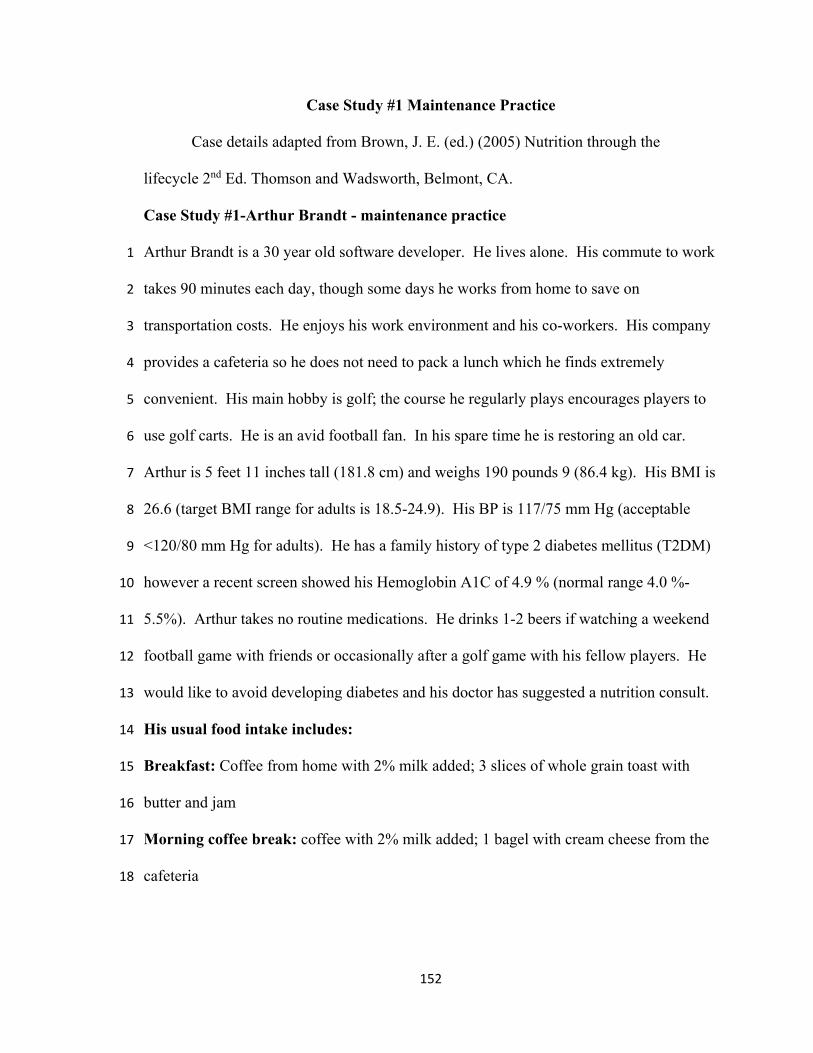
152
Case Study #1 Maintenance Practice
Case details adapted from Brown, J. E. (ed.) (2005) Nutrition through the
lifecycle 2nd Ed. Thomson and Wadsworth, Belmont, CA.
Case Study #1-Arthur Brandt - maintenance practice
Arthur Brandt is a 30 year old software developer. He lives alone. His commute to work 1
takes 90 minutes each day, though some days he works from home to save on 2
transportation costs. He enjoys his work environment and his co-workers. His company 3
provides a cafeteria so he does not need to pack a lunch which he finds extremely 4
convenient. His main hobby is golf; the course he regularly plays encourages players to 5
use golf carts. He is an avid football fan. In his spare time he is restoring an old car. 6
Arthur is 5 feet 11 inches tall (181.8 cm) and weighs 190 pounds 9 (86.4 kg). His BMI is 7
26.6 (target BMI range for adults is 18.5-24.9). His BP is 117/75 mm Hg (acceptable 8
<120/80 mm Hg for adults). He has a family history of type 2 diabetes mellitus (T2DM) 9
however a recent screen showed his Hemoglobin A1C of 4.9 % (normal range 4.0 %-10
5.5%). Arthur takes no routine medications. He drinks 1-2 beers if watching a weekend 11
football game with friends or occasionally after a golf game with his fellow players. He 12
would like to avoid developing diabetes and his doctor has suggested a nutrition consult. 13
His usual food intake includes: 14
Breakfast: Coffee from home with 2% milk added; 3 slices of whole grain toast with 15
butter and jam 16
Morning coffee break: coffee with 2% milk added; 1 bagel with cream cheese from the 17
cafeteria 18

153
Lunch: the plate special in the cafeteria, usually baked or grilled beef, pork, or chicken; 19
side salad with blue cheese dressing; 1 dinner roll with butter; cup of the daily offered 20
soup; a small cookie; plain ice tea 21
Afternoon snack: usually nothing but water or plain ice tea 22
Dinner: pasta dish of some kind, made at home with sauce from jar (Chicken Alfredo is 23
a favorite); small green salad with bottled dressing; plain ice tea or water 24
Evening snack: ice cream or occasionally a piece of fruit; if with friends watching a 25
football game it usually is cheese and crackers 26
Estimated Energy intake from usual dietary intake (using the exchange method): 27
2955 28
Kcal/day (occasional alcoholic beverages included) 29
Estimated energy needs based on usual physical activity (Mifflin-St. Jeor Equation x 30
1.3 for light activity): 1855.25 x 1.3 = 2411.8 + 15% (range 2050 - 2773.6 Kcal/day) 31
NUTRITION ASSESSMENT Anthropometric (A) Biochemical (labs) (B)
Clinical (C) Dietary (D)
Environmental (E) Functional (F)
NUTRITION DIAGNOSIS
Nutrition Diagnosis #1 Problem:
Etiology: related to
Sign/Symptoms: as evidenced by

154
Case Study #2 Maintenance Practice
Case details adapted from Nelms, M., H., & Anderson S. L. (2004) Medical
Nutrition Therapy A Case Study Approach, 2nd edition
Case Study #2 Jessica Reyes - maintenance practice
Jessica Reyes is an 18 year old female who is competes in cross country for her high 1
school in the fall and distance running events during the spring track and field season. 2
She has been referred to see you after a recent visit to her primary care physician revealed 3
she has been more fatigued than usual, has lost 4 pounds in the last 3 weeks, and though 4
training the same, has eaten less per her mother’s report. Her cross country performance 5
has suffered some as her times have increased rather than decreased. Her mother 6
attributes the slight decrease in eating to fatigue. Jessica’s height is 5 feet 5 inches (166.4 7
cm) and 105 pounds (47.7 kg). Her usual weight is 109 pounds (49.5 kg). Her weight is 8
95.4% of her usual body weight. Her BMI is 17.3 and BMI % is 2% (healthy BMI range 9
is 5-85% in adolescents and young adults to age 20). Her Hematocrit is 33 % (acceptable 10
range is 37-47 %) and a serum ferritin of 16 ug/dl (acceptable range 18-160 ug/dl). 11
Jessica takes no routine medications or supplements. Jessica does not use any tobacco 12
products. She does not consume any alcohol. 13
Her usual food intake includes: 14
Breakfast: 6 oz. of fruit juice, 1 piece of toast with butter 15
Lunch: 2 pieces of fresh fruit (apple and/or orange), 1 ham or other lunch meat 16
sandwich, 1 small bag of potato chips 17
Afternoon snack: 1 piece of fresh fruit (apple or orange), sport nutrition bar (230 kcals 18
and 5 grams of protein) 19
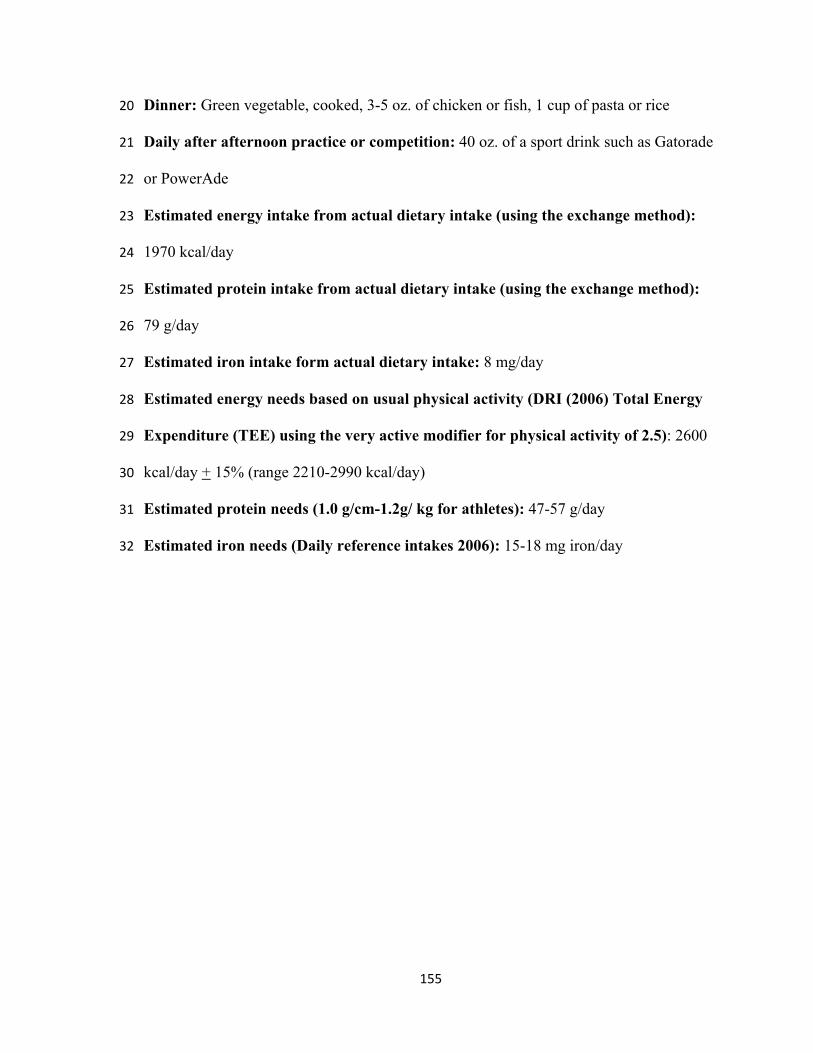
155
Dinner: Green vegetable, cooked, 3-5 oz. of chicken or fish, 1 cup of pasta or rice 20
Daily after afternoon practice or competition: 40 oz. of a sport drink such as Gatorade 21
or PowerAde 22
Estimated energy intake from actual dietary intake (using the exchange method): 23
1970 kcal/day 24
Estimated protein intake from actual dietary intake (using the exchange method): 25
79 g/day 26
Estimated iron intake form actual dietary intake: 8 mg/day 27
Estimated energy needs based on usual physical activity (DRI (2006) Total Energy 28
Expenditure (TEE) using the very active modifier for physical activity of 2.5): 2600 29
kcal/day + 15% (range 2210-2990 kcal/day) 30
Estimated protein needs (1.0 g/cm-1.2g/ kg for athletes): 47-57 g/day 31
Estimated iron needs (Daily reference intakes 2006): 15-18 mg iron/day 32

156
NUTRITION ASSESSMENT
Anthropometric (A) Biochemical (labs) (B)
Clinical (C) Dietary (D)
Environmental (E) Functional (F)
NUTRITION DIAGNOSIS
Nutrition Diagnosis #1 Problem:
Etiology: related to
Sign/Symptoms: as evidenced by
Nutrition Diagnosis #2 Problem:
Etiology: related to
Sign/Symptoms: as evidenced by

157
Appendix O – UNM IRB Consent
The University of New Mexico Consent to Participate in Research
Using Worked Examples for Training Nutrition Professionals to Diagnose Nutrition Problems and Use International Dietetics and Nutrition Terminology
12/13/2013
Introduction
You are being asked to participate in this research study by Kirsten Bennett MS RD LD, a registered dietitian and a doctoral candidate in Educational Psychology at the University of New Mexico (UNM). The purpose of this research is to compare two different ways to teach undergraduate students to diagnose nutrition problems and use standard terminology to document the nutrition problem in the medical record. You have been selected to participate because you have taken or are currently taking an introductory course in human nutrition.
This portion of the research is a pilot study. Results obtained from your participation will help the investigator evaluate whether or not the study materials are well constructed.
This form will explain the research study, and will also explain the possible risks as well as the possible benefits to you. We encourage you to talk with your family and friends before you decide to take part in this research study. If you have any questions, please ask the study investigator.
What will happen if I decide to participate?
If you agree to participate, the following things will happen:
You will be randomly assigned to one of two experimental learning conditions using worked examples to teach you about nutrition diagnosis nutrition terminology. The experiment occurs over two sessions, two weeks apart.
The first session will take one hour and fifteen minutes and the second session, two weeks later will take 40 minutes. Sessions will take place on the University of New Mexico campus in a classroom setting. All materials for the study will be provided by the investigator. You will not need a calculator or reference books.
You will first complete a brief questionnaire that asks questions like; "What is your age" and "Do you intend to pursue a career as a nutrition professional” at the beginning of the first session. The first session asks you to study clinical case studies in a worked example format to help you learn about nutrition diagnosis and using standardized terminology and then practice using what you have learned on additional case studies.
IRB #: 1 3 - 8 7 4 Page 1 of 5 Version: 12-13-13 APPROVED: 02-03-2014 OFFICIAL USE ONLY EXPIRES: 02-02-2015 The University of New Mexico Institutional Review Board (IRB)

158
During the second session you will be asked again practice what you learned about nutrition diagnosis with additional clinical case studies.
At the end of both the learning and practice sessions, you will be asked to estimate, on a questionnaire, how hard or easy it was studying the worked examples and practicing what you learned.
Both sessions combined will require no more than 2 hours and 15 minutes.
How long will I be in this study?
Participation in this study will take a total of 2 hours and 15 minutes. Participation involves two sessions. The first and second sessions are two weeks apart. After both sessions are completed participation ends.
What are the risks or side effects of being in this study?
There are risks of stress, emotional distress, inconvenience and possible loss of privacy and confidentiality associated with participating in a research study.
There are minimal risks with this study, though some participants may experience discomfort while studying information that is new to them and being asked to practice using this new information on their own.
For more information about risks and side effects, ask the investigator.
What are the benefits to being in this study?
Potential benefits to participants include beginning to learn to diagnose nutrition problems in humans and helping to investigate one way of teaching this skill.
This is potentially a benefit to future students learning this same skill.
What other choices do I have if I do not want to be in this study?
Participation is voluntary. The only alternative to participation is non-participation.
How will my information be kept confidential?
We will take measures to protect the security of all your personal information, but we cannot guarantee confidentiality of all study data.
No identifying information will be attached to study materials. Signed consent forms will be used to create a code sheet to link the first session results to the second session results using a unique identifier.
After the study has been completed this code sheet with the links to the unique identifiers will be destroyed by the investigator. Signed consents and study materials
IRB #: 1 3 - 8 7 4 Page 2 of 5 Version: 12-13-13 APPROVED: 02-03-2014 OFFICIAL USE ONLY EXPIRES: 02-02-2015 The University of New Mexico Institutional Review Board (IRB)

159
will be kept in a locked file cabinet in the investigators office for five years after the study is completed and then destroyed.
Information contained in your study records is used by study staff and, in some cases it will be shared with the sponsor of the study. The University of New Mexico Institutional Review Board (IRB) that oversees human subject research and/or other entities may be permitted to access your records. There may be times when we are required by law to share your information. However, your name will not be used in any published reports about this study.
Results from the study will be reported and published with no identifying information linking participants to the study outcomes.
What are the costs of taking part in this study?
There is no cost to participate in this study.
Will I be paid for taking part in this study?
Participants in the pilot study will be given a $25 gift card to a local restaurant after completing the second session.
How will I know if you learn something new that may change my mind about participating?
You will be informed of any significant new findings that become available during the course of the study, such as changes in the risks or benefits resulting from participating in the research or new alternatives to participation that might change your mind about participating.
Can I stop being in the study once I begin?
Participation is voluntary. You may withdraw participation at any time. If you withdraw, any portions of the study you have completed will be removed from the data collected during the study.
Whom can I call with questions or complaints about this study?
If you have any questions, concerns or complaints at any time about the research study, Kirsten Bennett MS RD LD, will be glad to answer them at (505) 400-3437.
If you need to contact someone after business hours or on weekends, please call (505) 400-3437 and ask for Kirsten Bennett.
If you would like to speak with someone other than the research team, you may call the UNM IRB at (505) 277-2644.
IRB #: 1 3 - 8 7 4 Page 3 of 5 Version: 12-13-13 APPROVED: 02-03-2014 OFFICIAL USE ONLY EXPIRES: 02-02-2015 The University of New Mexico Institutional Review Board (IRB)

160
Whom can I call with questions about my rights as a research participant?
If you have questions regarding your rights as a research participant, you may call the UNM IRB at (505) 277-2644. The IRB is a group of people from UNM and the community who provide independent oversight of safety and ethical issues related to research involving human participants. For more information, you may also access the IRB website at http://research.unm.edu/IRBmaincampus.
IRB #: 1 3 - 8 7 4 Page 4 of 5 Version: 12-13-13 APPROVED: 02-03-2014 OFFICIAL USE ONLY EXPIRES: 02-02-2015 The University of New Mexico Institutional Review Board (IRB)

161
CONSENT
You are making a decision whether to participate in this study. Your signature below indicates that you read the information provided. By signing this consent form, you are not waiving any of your legal rights as a research participant.
I have had an opportunity to ask questions and all questions have been answered to my satisfaction. By signing this consent form, I agree to participate in this study. A copy of this consent form will be provided to you.
Name of Adult Subject (print) or for Child enrollment, Name of Parent/Child's Legal Guardian
Signature of Adult Subject or for Child enrollment, Signature of Parent/Child's Legal Guardian
Date

162
Appendix P – CNM Student Dissertation Consent
Central New Mexico Community College and the University of New Mexico Consent to Participate in Research
Using Worked Examples for Training Nutrition Professionals to Diagnose Nutrition Problems and Use International Dietetics and Nutrition Terminology
03/07/14
Introduction
You are being asked to participate in this research study by Kirsten Bennett MS RD LD, a registered dietitian and a doctoral candidate in Educational Psychology at the University of New Mexico (UNM). The purpose of this research is to compare two ways to teach undergraduate students to diagnose nutrition problems and use standard terminology to label the nutrition problem. You have been selected to participate because you are currently taking an introductory course in human nutrition.
This form will explain the research study, and will also explain the possible risks as well as the possible benefits to you. If you have any questions, please ask the study investigator.
What will happen if I decide to participate?
If you agree to participate, the following things will happen:
You will be randomly assigned to one of two experimental learning conditions using worked examples to teach you about nutrition diagnosis and nutrition terminology. The experiment occurs over two sessions, two weeks apart during your regularly scheduled nutrition class.
The first session will take one hour and fifteen minutes and the second session, two weeks later will take 40 minutes. Sessions will take place on the Central New Mexico Community College (CNM) campus in your regularly scheduled nutrition classroom session. All materials for the study will be provided by the investigator. You will not need a calculator or reference books.
You will first complete a brief questionnaire that asks questions like; "What is your age" and "Do you intend to pursue a career as a nutrition professional” at the beginning of the first session. The first session asks you to study clinical cases in a worked example format to help you learn about nutrition diagnosis and using standardized terminology
Page | 1 CNM IRB#:Bennett011314 Period of Approval 03/20/14-03/10/15

163
and then practice using what you have learned on two cases. During the second session you will be asked again practice what you learned about nutrition diagnosis with two additional clinical cases.
At the end of both the learning and practice sessions, you will be asked to estimate, on a questionnaire, how hard or easy it was studying the worked examples and practicing what you learned.
Both sessions combined will require no more than 2 hours and 15 minutes.
The results of your work will be used to evaluate worked examples as educational approach to teach nutrition diagnosis.
How long will I be in this study?
Participation involves two sessions. The first and second sessions are two weeks apart. Participation in this study will take a total of 2 hours and 15 minutes. After both sessions are completed participation ends.
What are the risks or side effects of being in this study?
There are risks of stress, emotional distress, inconvenience and possible loss of privacy and confidentiality associated with participating in any research study.
There are minimal risks with this study, though some participants may experience discomfort while studying information that is new to them and being asked to practice using this new information on their own.
For more information about risks and side effects, ask the investigator.
What are the benefits to being in this study?
Potential benefits to participants include beginning to learn to diagnose nutrition problems in humans and improving understanding of the topics covered in your nutrition class.
What other choices do I have if I do not want to be in this study?
Students not wishing to participate in research and who do not consent to participate will still engage in the classroom activity of studying worked examples; however results on the exercise will not be used in the evaluation of worked examples as educational approach to teach nutrition diagnosis. Page | 2 CNM IRB#:Bennett011314 Period of Approval 03/20/14-03/10/15

164
How will my information be kept confidential?
We will take measures to protect the security of all your personal information, but we cannot guarantee confidentiality of all study data.
Information contained in your study records is used by study staff and, in some cases it will be shared with the sponsor of the study. The University of New Mexico Institutional Review Board (IRB) and the Central New Mexico Community College that oversees human subject research and/or other entities may be permitted to access your records. There may be times when we are required by law to share your information. However, your name will not be used in any published reports about this study.
No identifying information will be attached to study materials. Signed consent forms will be used to create a code sheet to link the first session results to the second session results using a unique identifier. After the study has been completed this code sheet with the links to the unique identifiers will be destroyed by the investigator. Signed consents and study materials will be kept in a locked file cabinet in the investigators office for five years after the study is completed and then destroyed.
Results from the study will be reported and published with no identifying information linking participants to the study outcomes.
What are the costs of taking part in this study?
There is no cost to participate in this study.
Will I be paid for taking part in this study?
There are no payments for participation.
How will I know if you learn something new that may change my mind about participating?
You will be informed of any significant new findings that become available during the course of the study, such as changes in the risks or benefits resulting from participating in the research or new alternatives to participation that might change your mind about participating.
Can I stop being in the study once I begin?
If you consent to allow the investigator to use results on the exercise to evaluate worked examples as an educational approach to teach nutrition diagnosis and you change your mind, you may withdraw participation at any time. If you withdraw, any portions of the study you have completed will be removed from the data collected during the study.
Page | 3
CNM IRB#:Bennett 011314 Period of Approval 03/20/14-03/10/15

165
Whom can I call with questions or complaints about this study?
If you have any questions, concerns or complaints at any time about the research study, Kirsten Bennett MS RD LD will be glad to answer them at (505) 400-3437.
If you need to contact someone after business hours or on weekends, please call (505) 400-3437 and ask for Kirsten Bennett.
If you would like to speak with someone other than the research team, you may call the UNM IRB at (505) 277-2644 or CNM IRB at (505) 224-3450.
Whom can I call with questions about my rights as a research participant?
If you have questions regarding your rights as a research participant, you may call the CNM IRB at (505) 224-3450 or the UNM IRB at (505) 277-2644. The IRB is a group of people from CNM and UNM and the community who provide independent oversight of safety and ethical issues related to research involving human participants. For more information, you may also access the UNM IRB website at http://research.unm.edu/IRBmaincampus or the CNM IRB at
http://www.cnm.edu/depts/planning/instres/irb .
Page | 4 CNM IRB#:Bennett011314 Period of Approval 03/20/14-03/10/15

166
CONSENT
You are making a decision whether to participate in this study. Your signature below indicates that you read the information provided. By signing this consent form, you are not waiving any of your legal rights as a research participant.
I have had an opportunity to ask questions and all questions have been answered to my satisfaction. By signing this consent form, I agree to participate in this study. A copy of this consent form will be provided to you.
____________________________ ____________________________ ___________
Name of Adult Subject (print) or for Child enrollment, Name of Parent/Child's Legal Guardian
Signature of Adult Subject or for Child enrollment, Signature of Parent/Child's Legal Guardian
Date
INVESTIGATOR SIGNATURE
I have explained the research to the participant and answered all of his/her questions. I believe that he/she understands the information described in this consent form and freely consents to participate.
___Kirsten Bennett________ Name of Investigator/ Research Team Member (type or print)
_________________________________________________ ___________________
(Signature of Investigator/ Research Team Member) Date
Page | 166 CNM IRB#:Bennett011314 Period of Approval 03/20/14‐03/10/15

167
Appendix Q – CNM Faculty Dissertation Consent
Central New Mexico Community College and the University of New Mexico Consent to Participate in Research
Using Worked Examples for Training Nutrition Professionals to Diagnose Nutrition Problems and Use International Dietetics and Nutrition Terminology
03/07/14
Introduction
You are being asked to participate in this research study by Kirsten Bennett MS RD LD, a registered dietitian and a doctoral candidate in Educational Psychology at the University of New Mexico (UNM). The purpose of this research is to compare two ways to teach undergraduate students to diagnose nutrition problems and use standard terminology to label the nutrition problem. You have been selected to participate because you are currently teaching an introductory course in human nutrition.
This form will explain the research study, and will also explain the possible risks as well as the possible benefits to you. If you have any questions, please ask the study investigator.
What will happen if I decide to participate?
If you agree to participate, the following things will happen:
This research involving worked examples to teach about nutrition diagnosis and nutrition terminology in one of two worked example conditions will take the place during one and one half class sessions of a regularly scheduled meeting of a nutrition class you teach. It will fulfill student course requirements for class participation within the structure of the nutrition class.
Your students, in each section of the course you teach, will be randomly assigned to one of two experimental conditions using worked examples to teach them about nutrition diagnosis and nutrition terminology. The experiment occurs over two sessions, two weeks apart.
The first session will take one hour and fifteen minutes and the second session, two weeks later will take 40 minutes. Sessions will take place on the Central New Mexico Community College (CNM) campus in your regularly scheduled nutrition classroom sessions. All materials for the study will be provided by the investigator.
Page | 167 CNM IRB#: Bennett011314 Period of Approval 03/20/14-03/10/15

168
Your students will first complete a brief questionnaire that asks questions like; "What is your age" and "Do you intend to pursue a career as a nutrition professional” at the beginning of the first session. The first session asks your students to study clinical cases in a worked example format to help them learn about nutrition diagnosis and using standardized terminology and then practice using what they have learned on two additional cases During the second session they will be asked to again practice what they have learned about nutrition diagnosis with two additional clinical cases
At the end of both the learning and practice sessions, each student will be asked to estimate, on a questionnaire, how hard or easy it was studying the worked examples and practicing what was learned.
Both sessions combined will require no more than 2 hours and 15 minutes.
The results of your students’ work will be used to evaluate worked examples as an educational approach to teach nutrition diagnosis.
Since student work is the focus of the research, no data on you or your classroom will be collected or reported.
How long will I be in this study?
Participation involves two sessions. The first and second sessions are two weeks apart. After both sessions are completed participation ends. Both sessions combined will require no more than 2 hours and 15 minutes.
What are the risks or side effects of being in this study?
There are risks of stress, inconvenience and possible loss of privacy and confidentiality associated with participating in any research study.
There are minimal risks with this study, though some instructors may experience discomfort when asked to allow an outside investigator access to their students and to the results of student work.
Since student work is the focus of the research, no data on you or your classroom will be collected or reported.
For more information about risks and side effects, ask the investigator.
Page | 2 CNM IRB#: Bennett 011314 Period of Approval 03/20/14-03/10/15

169
What are the benefits to being in this study?
Potential benefits to student participants include beginning to learn to diagnose nutrition problems in humans and helping to investigate one way of teaching this skill.
Faculty participants have the potential benefit of enhanced student learning since the exercise asks students to apply knowledge they are currently acquiring as part of the nutrition curriculum.
What other choices do I have if I do not want to be in this study?
The only alternative to participation is non-participation
Faculty who do not wish to participate in this research and who do not consent to participate will continue their regular classroom activities and their students will not be asked to participate in this research involving worked examples to teach about nutrition diagnosis and nutrition terminology.
How will my information be kept confidential?
No data will be collected on faculty at Central New Mexico Community College since the focus of the research is student work in the study conditions that involve using worked examples to learn about nutrition diagnosis.
We will take measures to protect the security of all your personal information, but we cannot guarantee confidentiality of all study data.
Information contained in your study records for your students is used by study staff and, in some cases it will be shared with the sponsor of the study. The University of New Mexico Institutional Review Board (IRB) and the Central New Mexico Community College that oversees human subject research and/or other entities may be permitted to access your records. There may be times when we are required by law to share your information. However, your name will not be used in any published reports about this study.
No identifying information will be attached to student study materials. Signed consent forms will be used to create a code sheet to link the first session results to the second session results using a student unique identifier. After the study has been completed this code sheet with the links to the student unique identifiers will be destroyed by the investigator. Signed consents and study materials will be kept in a locked file cabinet in the investigators office for five years after the study is completed and then destroyed.
Page | 3 CNM IRB#: Bennett011314 Period of Approval 03/20/14-03/10/15

170
Results from student participants in the study will be reported and published with no identifying information linking participants to the study outcomes.
What are the costs of taking part in this study?
There is no cost to participate in this study.
Will I be paid for taking part in this study?
There are no payments for participation for faculty or students.
How will I know if you learn something new that may change my mind about participating?
You will be informed of any significant new findings that become available during the course of the study, such as changes in the risks or benefits resulting from participating in the research or new alternatives to participation that might change your mind about participating.
Can I stop being in the study once I begin?
Participation is voluntary. You may withdraw participation at any time. If you withdraw, any portions of the study your students have completed will be removed from the data collected during the study.
Whom can I call with questions or complaints about this study?
If you have any questions, concerns or complaints at any time about the research study, Kirsten Bennett MS RD LD will be glad to answer them at (505) 400-3437.
If you need to contact someone after business hours or on weekends, please call (505) 400-3437 and ask for Kirsten Bennett.
If you would like to speak with someone other than the research team, you may call the UNM IRB at (505) 277-2644 or CNM IRB at (505) 224-3450.
Whom can I call with questions about my rights as a research participant?
If you have questions regarding your rights as a research participant, you may call the CNM IRB at (505) 224-3450 or the UNM IRB at (505) 277-2644. The IRB is a group of people from CNM and UNM and the community who provide independent oversight of safety and ethical issues related to research involving human participants. For more information, you may also access the UNM IRB website at http://research.unm.edu/IRBmaincampus or the CNM IRB at http://www.cnm.edu/depts/planning/instres/irb .
Page | 4 CNM IRB#: Bennett011314 Period of Approval 03/20/14-03/10/15

171
CONSENT
You are making a decision whether to participate in this study. Your signature below indicates that you read the information provided. By signing this consent form, you are not waiving any of your legal rights as a research participant.
I have had an opportunity to ask questions and all questions have been answered to my satisfaction. By signing this consent form, I agree to participate in this study. A copy of this consent form will be provided to you.
________________________ ____________________________ ___________ Name of Adult Subject (print) or for Child enrollment, Name of Parent/Child's Legal Guardian
Signature of Adult Subject or for Child enrollment, Signature of Parent/Child's Legal Guardian
Date
INVESTIGATOR SIGNATURE
I have explained the research to the participant and answered all of his/her questions. I believe that he/she understands the information described in this consent form and freely consents to participate.
___Kirsten Bennett________ Name of Investigator/ Research Team Member (type or print)
_____________________________________________ ___________________
(Signature of Investigator/ Research Team Member) Date
Page | 5 CNM IRB#: Bennett011314 Period of Approval 03/20/14‐03/10/15

172
List of References
Atkinson, R. K., & Derry, S. J. (2000) Computer-based examples designed to encourage
optimal example processing: a study examining the impact of sequentially
presented, subgoal-oriented worked examples. In B. Fishman & S. O’Connor-
Divelbiss (Eds.), Fourth International Conference of the Learning Sciences,
Mahwah, NJ: Erlbaum, pp. 132-133.
Ayers, E. J., Greer-Carney, J. L., Fatzinger McShane, P. E., Miller, A., & Turner, P.
(2012) Nutrition informatics competencies across all levels of practice: a national
Delphi study. Journal of the Academy of Nutrition and Dietetics, 112(12), 2042-
2052.
Ayers, P. (2006) Using subjective measures to detect variations of intrinsic cognitive load
within problems. Learning and Instruction, 16, 389-400.
Baddeley, A. (2000) Working memory. Current Biology, 20(4), R136-R140.
Baddeley, A. (2012) Working memory: theories, models, and controversies. Annual
Review of Psychology, 63, 1-29.
Baddeley, A. D., & Hitch, G. J. (1994) Developments in the concept of working memory.
Neuropsychology, 8(4), 485-493.
Brown, J. E. (ed.) (2005) Nutrition through the lifecycle 2nd Ed. Thomson and
Wadsworth, Belmont, CA.
Catrambone, R., & Holyoak, K. J. (1989) Overcoming contextual limitations on problem-
solving transfer. Journal of Experimental Psychology, 15(6), 1147-1156.

173
Chen, Y., Hsu, C., Liu, L., & Yang, S. (2012) Constructing a nutrition diagnosis expert
system. Expert Systems with Applications, 39, 2132-2156.
Chi, M. T. H., & VanLehn, K. A. (2012) Seeing deep structure from the interactions of
surface features. Educational Psychologist, 47(3), 177-188.
Day, S. B., & Goldstone, R. L. (2012) The import of knowledge export: connecting
findings and theories of transfer learning. Educational Psychologist, 47(3), 153-
176.
Emery, E. Z. (2012) Clinical Case Studies for the Nutrition Care Process, pg. 53-59.
Engle, R. A., Lam, D. P., Meyer, X. S., & Nix, S. E. ( 2012) How does expansive
framing promote transfer? Several proposed explanations and a research agenda
for investigating them. Educational Psychologist, 47(3), 215-231.
Escott-Stump, S. (2002) Nutrition and diagnosis related care 5th edition. Lippincott,
Williams, and Wilkins, Philadelphia, PA.
Faul, F., Erdfelder, E., Lang, A.-G., & Buchner, A. (2007). G*Power 3: A flexible
statistical power analysis program for the social, behavioral, and biomedical
sciences. Behavior Research Methods, 39, 175-191 Downloaded May 7, 2012
from http://www.psycho.uni-duesseldorf.de/abteilungen/aap/gpower3/download-
and-register
Fraser, S. W., & Greenhalge, T. (2001) Coping with complexity: educating for capability.
British Medical Journal, 323(6), 799-803.
Gerjets, P., Scheiter, K., & Catrambone, R. (2004) Designing instructional examples to
reduce intrinsic cognitive load: molar versus modular presentation of solution
procedures. Instructional Science, 32, 33-58.

174
Gerjets, P., Scheiter, K., & Catrambone, R. (2006) Can learning from molar and modular
worked examples be enhanced by providing instructional explanations and
promoting self- explanations? Learning and Instruction, 16, 104-121.
Gick, M. L., & Holyoak, K, J. (1983) Schema induction and analogical transfer.
Cognitive Psychology, 15, 1-38.
Gobet, F. (2005) Chunking models of expertise: Implications for education. Applied
Cognitive Psychology, 19,183-204.
Goldstone, R. L., & Day, S. B. (2012) Introduction to “new conceptualizations of transfer
learning”. Educational Psychologist, 47(3), 149-152.
Grosse, C. S., & Renkl, A. (2007) Finding and fixing errors in worked examples: can this
foster learning outcomes? Learning and Instruction, 17, 612-634.
Hakel-Smith, N., Lewis, N. M. & Eskridge, K. M. (2005) Orientation to nutrition care
process standards improves nutrition care documentation by nutrition
practitioners. Journal of the American Dietetic Association, 105, 1582-1589.
Hart, S. G. (2008) NASA-Task Load Index (NASA-TLX); 20 years later. NASA-Ames
Research Center, Moffett Field, CA.
Hart, S. G., & Staveland, L. E. (1988) Development of NASA-TLX (Task Load Index):
results of empirical and theoretical research. In P.A. Hancock and N. Meshkati
(Eds.) Human Mental Workload. Amsterdam: North Holland Press.
International Dietetics and Nutrition Terminology (IDNT) Reference Manual (2013)
Fourth Edition, Academy of Nutrition and Dietetics, Chicago, IL.
Kalyuga, S., Ayres, P., Chandler, P., & Sweller, J. (2003) The expertise reversal effect.
Educational Psychologist, 38(1), 23-31.

175
Lacey, K. (2006) Teaching ADA’s nutrition care process and nutrition diagnosis: one
educator’s story of a work in progress. Topics in Clinical Nutrition, 21 (3), 169-
175.
Leslie, K. C., Low, R., Jin, P., & Sweller, J. (2012) Redundancy and expertise reversal
effects when using educational technology to learn primary school science.
Education Technology Research Development, 60, 1-13.
Meier, D. K., Reinhard, K. J., Carter, D. O., & Brooks, D. W. (2008) Simulations with
elaborated worked example modeling: beneficial effects on schema acquisition.
Journal of Science Education Technology, 17, 262-273.
Mifflin, M. D., St. Jeor, S. T., Hill, L. A., Scott, B. J., Daugherty, S. A., & Koh, Y. O.
(1990) A new predictive equation for resting energy expenditure in healthy
individuals. American Journal of Clinical Nutrition, 51 (2), 241-247.
Miller, G. A., (1956). The magical number seven plus or minus two. Psychological
Review, 63, 81-96.
Moreno, R. (2004) Decreasing cognitive load for novice students: effects of explanatory
versus corrective feedback in discovery-based multimedia. Instructional Science,
32, 99-113.
Moreno, R. (2006) When worked examples don’t work: Is cognitive load theory at an
impasse? Learning and Instruction, 16, 170-181.
Nadolski, R. J., Kirschner, P. A., & van Merriënboer, J. J. G. (2006) Process support in
learning tasks for acquiring complex skills in the domain of law. Learning and
Instruction, 16, 266-278.
176
Nelms, M., H. & Anderson S. L. (2004) Medical Nutrition Therapy A case study
approach, 2nd edition.
Paas, F. (1992) Training strategies or attaining transfer of problem-solving skill in
statistics: a cognitive-load approach. Journal of Educational Psychology, 84(4),
429-434.
Paas, F., Renkl, A., & Sweller, J. (2003) Cognitive load theory and instructional design:
recent developments. Educational Psychologist, 38(1), 1-4.
Paas, F., Renkl, A., & Sweller, J. (2004) Cognitive load theory: instructional implications
of the interaction between information structures and cognitive architecture.
Instructional Science, 32, 1–8.
Paas, F, Tuovinen, J. E., Tabbers, H., & Van Gerven, P. W. M. (2003) Cognitive load
measurement as a means to advance cognitive load theory. Educational
Psychologist, 38(1), 63-71.
Paas, F., Tuovinen, J. E., van Merriënboer, J. J. G., & Darabi, A. A. (2005) A
motivational perspective on the relation between mental effort and performance:
optimizing learner involvement in instruction. Educational Technology,
Research and Development, 53(3), 25-34.
Paas, F., & Van Gog, T. (2006) Optimizing worked example instruction: different ways
to increase germane cognitive load. Learning and Instruction, 16(2), 87-91.
Paas, F, & van Merriënboer, J. J. G. (1993) The efficiency of instructional conditions: an
approach to combine mental effort and performance measures. Human Factors,
35(4) 737-743.

177
Paas, F, & van Merriënboer, J. J. G. (1994) Instructional control of cognitive load in the
training of complex cognitive tasks. Educational Psychology Review, 6(4), 351-
371.
Paas, F, van Merriënboer, J. J. G., & Adam, J. J. (1994) Measurement of cognitive load in
instructional research. Perceptual and Motor Skills, 79, 419-430.
Perkins, D. N., & Salomon, G. (2012) Knowledge to go: a motivational and dispositional
view of transfer. Educational Psychologist, 47(3), 248-258.
Pollock, E., Chandler, P., & Sweller, J. (2002) Assimilating complex information.
Learning and Instruction, 12, 61-86.
Pressely, M., Woloshyn, V., Lysynchuk, L., M., Martin, V., Wood, E., & Willoughby, T.
(1990) A primer of research on cognitive strategy instruction: the important
issues and how to address them. Educational Psychology Review, 2 (1), 1-58.
Renkl, A., Atkinson, R. K, & Grosse, C. S. (2004) How fading worked solution steps
works-a cognitive load perspective. Instructional Science, 32, 59-82.
Richey, J. E., & Nokes-Malach, T. J. (2013) How much is too much? Learning and
motivation effects of adding instructional explanations to worked examples.
Learning and Instruction, 25, 104-124.
Rourke A, & Sweller, J. (2009) The worked-example effect using ill-defined problems:
learning to recognize designers’ styles. Learning and Instruction, 19, 185-199.
Rubio, S., Diaz, E., Martin, J., & Puente, J. M. (2004) Evaluation of subjective mental
workload: a comparison of SWAT, NASA-TLX, and Workload Profile Methods.
Applied Psychology: An International Review, 53(1), 61-86.

178
Schwonke, R., Renkl, A., Krieg, C, Wittwer, J., Aleven, V., & Salden, R. (2009) The
worked example effect: not an artifact of lousy control conditions. Computers in
Human Behavior, 25, 258-266.
Simon, C., Faut, C. E., & Wooley, J. A. (2009) Lessons learned in applying the nutrition
care process to critically ill patients. Support Line, 31(2) 9-13.
Skipper, A. (2007) Applying the nutrition care process: nutrition diagnosis and
intervention. Support Line, 29(6) 12-23.
Sweller, J. (1988) Cognitive load during problem solving: effects on learning. Cognitive
Science, 12, 257-285.
Sweller, J. (1994) Cognitive load theory, learning difficulty, and instructional design.
Learning and Instruction, 4, 295-312.
Van Gog, T., Kester, L., & Paas, F. (2011) Effects of worked examples, example-
problem, and problem-example pairs on novices learning. Contemporary
Educational Psychology, 36, 212-218.
Van Gog, T., Paas, F., & van Merriënboer, J. J. G. (2004) Process-oriented worked
examples: improving transfer performance through enhanced understanding.
Instructional Science, 32, 83-98.
Van Gog, T., Paas, F., & van Merriënboer, J. J. G. (2006) Effects of process-oriented
worked examples on troubleshooting transfer performance. Learning and
Instruction, 16, 154-1642.
Van Gog, T., Paas, F., & van Merriënboer, J. J. G. (2008) Effects of studying sequences
of process-oriented product-oriented worked examples on troubleshooting
transfer efficiency. Learning and Instruction, 18, 211-222.

179
van Merriënboer, J. J. G, Kirschner, P. A., & Kester, L. (2003) Taking the load off the
learner’s mind; Instructional design for complex learning. Educational
Psychologist, 38(1), 5-15.
van Merriënboer, J. J. G., Schuurman, J. G., Croock, M, & Paas, F. (2002) Redirecting
learners’ attention during training: effects on cognitive load, transfer test
performance and training efficiency. Learning and Instruction, 12, 11-37.
van Merriënboer, J. J. G., & Sweller, J. (2005) Cognitive load theory and complex
learning: recent developments and future directions. Educational Psychology
Review, 17(2), 147-177.
Wigfield, A., & Eccles, J. S. (2000) Expectancy-value theory of achievement motivation.
Contemporary Educational Psychology, 25, 68-81.
Yuan, K., Steedle, J., Shavelson, R., Alonzo, A., & Oppezzo, M. (2006) Working
memory, fluid intelligence, and science learning. Educational Research Review,
1, 83-98.
Zelig, R., Byham-Gray, L., Touger-Decker, R., Parrot, & Rigassio-Radler, D. (2011)
Impact for continuing education: applying the nutrition care process and model
and the International Dietetics and Nutrition Terminology for dietitians in long
term care. Topics in Clinical Nutrition, 26(3), 268-280.