using transformation and formation maps to study the role of air
TRANSCRIPT

Using Transformation and Formation Maps to Study the Role of Air–SeaHeat Fluxes in North Atlantic Eighteen Degree Water Formation
GUILLAUME MAZE, GAEL FORGET, MARTHA BUCKLEY, AND JOHN MARSHALL
Massachusetts Institute of Technology, Cambridge, Massachusetts
IVANA CEROVECKI
Scripps Institution of Oceanography, University of California, San Diego, La Jolla, California
(Manuscript received 22 January 2008, in final form 22 January 2009)
ABSTRACT
The Walin water mass framework quantifies the rate at which water is transformed from one temperature
class to another by air–sea heat fluxes (transformation). The divergence of the transformation rate yields the
rate at which a given temperature range is created or destroyed by air–sea heat fluxes (formation). Walin’s
framework provides a precise integral statement at the expense of losing spatial information. In this study the
integrand of Walin’s expression to yield transformation and formation maps is plotted and used to study the
role of air–sea heat fluxes in the cycle of formation–destruction of the 188 6 18C layer in the North Atlantic.
Using remotely sensed sea surface temperatures and air–sea heat flux estimates based on both analyzed
meteorological fields and ocean data–model syntheses for the 3-yr period from 2004 to 2006, the authors find
that Eighteen Degree Water (EDW) is formed by air–sea heat fluxes in the western part of the subtropical
gyre, just south of the Gulf Stream. The formation rate peaks in February when the EDW layer is thickened
by convection owing to buoyancy loss. EDW is destroyed by air–sea heat fluxes from spring to summer over
the entire subtropical gyre. In the annual mean there is net EDW formation in the west to the south of the
Gulf Stream, and net destruction over the eastern part of the gyre. Results suggest that annual mean for-
mation rates of EDW associated with air–sea fluxes are in the range from 3 to 5 Sv (Sv [ 106 m3 s21). Finally,
error estimates are computed from sea surface temperature and heat flux data using an ensemble pertur-
bation method. The transformation/formation patterns are found to be robust and errors mostly affect
integral quantities.
1. Introduction
The main purpose of the present study is to demon-
strate how transformation and formation maps, inspired
by Walin’s (1982) integral water mass transformation
framework, can be used to yield spatial and temporal
information about water mass formation–destruction
processes associated with air–sea fluxes. Conventional
applications of the Walin approach yields integral
statements about water mass transformation and for-
mation rates based on air–sea fluxes integrated over
outcrops. Here we demonstrate the utility of mapping
out an appropriately defined ‘‘integrand’’ over the sea-
sonal cycle to yield quantitative regional and temporal
information about where and when water masses are
formed. Brambilla et al. (2008) have recently used
transformation maps to study North Atlantic Subpolar
Mode Water. We use the same technique here but also
investigate the utility of mapping formation as well as
transformation rates.
To illustrate the method in an interesting and im-
portant context, we focus on the contribution of air–sea
heat fluxes to the volume of water between 178 and
198C, which is called Eighteen Degree Water (EDW).1
The thickness of the 188 6 18C layer is plotted from a new
ocean atlas: the Ocean Comprehensive Atlas (OCCA)
as described in section 3a; see also Forget (2009) and
Fig. 1a. The layer is particularly thick south of the Gulf
Corresponding author address: Guillaume Maze, 77 Massachusetts
Ave., MIT, EAPS, 54-1424, Cambridge, MA 02139.
E-mail: [email protected]
1 Here we use the term ‘‘Eighteen Degree Water’’ in its literal
sense and define it to be water with a temperature in the range of
188 6 18C. It is not necessarily low potential vorticity water.
1818 J O U R N A L O F P H Y S I C A L O C E A N O G R A P H Y VOLUME 39
DOI: 10.1175/2009JPO3985.1
� 2009 American Meteorological Society

Stream: the annual mean depth of the 188C surface is
’300 m and its maximum thickness (centered around
358N, 558W) varies from 450 m in late winter to 250 m in
late summer. Argo profiles within the 108 3 58 white box
centered on 358N, 558W, marked in Fig. 1a, are plotted
over three annual cycles in Fig. 1b. Data from the OCCA,
sampled to mimic the Argo profiles, is shown in Fig. 1c.
The Argo profiles and the OCCA both clearly reveal the
cycle of thickening and thinning of the EDW layer, which
we now study using transformation and formation maps.
The paper is organized as follows: in section 2 we
describe how the Walin water mass framework can be
used to create transformation and formation maps. In
section 3 we show how transformation and formation
maps can be used to study EDW. The datasets for which
the maps are computed are described in section 3a.
In section 3b, the traditional Walin framework is used
to describe water mass transformation and forma-
tion. Transformation and formation maps for EDW are
analyzed in sections 3c and 3d. Section 4 provides an
FIG. 1. (a) Observed 3-yr (2004–06) mean characteristics of the 188 6 18C layer in the OCCA dataset. Mean
thickness (shaded gray), monthly thickness standard deviation (red contours), and mixed layer depth standard
deviation (blue contours). The two thick green contours are mean SSH (20.2 and 20.6 m), chosen to mark the arc of
the subtropical and subpolar gyre. The box marked by the black dashed line encloses the main formation area of
EDW (see section 3d). (b) Every Argo profile within the 108 3 58 white box centered on 358N, 558W shown in (a) is
plotted as a function of time beginning in January 2004 and ending in December 2006. The white bar indicates a
period of time when there were no profiles. The 198 and 178C isotherms, enhanced in black and magenta, are plotted.
The first day of January, February, and March in each of the years is indicated by the vertical dotted lines. (c) As in
(b), but sampling the OCCA dataset to mimic the Argo profiles.
AUGUST 2009 M A Z E E T A L . 1819

estimate of the errors in the maps. We conclude in
section 5.
2. Formation and transformation maps
Here we review how the Walin (1982) framework is
used to quantify the rate at which water is transformed
from one temperature class to another via air–sea heat
fluxes (the transformation rate). The divergence of the
transformation rate yields the rate at which a given
temperature class is created or destroyed via air–sea
heat fluxes (the formation rate). Because Walin’s frame-
work is an integral statement over temperature outcrops,
it can describe the temporal evolution of transformation
and formation rates, but at the expense of losing spatial
information. In this section, we will discuss how maps
of transformation and formation rates are created, al-
lowing one to retain crucial spatial information.
Consider the layer of water designated by Q in a
temperature range u1 , u , u2 that outcrops at the sea
surface. The volume of the Q layer is bounded by the
isothermal surfaces u1 and u2 and above by the sea
surface; see Fig. 2. Following Walin (1982), the change
in volume of the Q layer is
›VQ
›t5 A(u
2, t)�A(u
1, t)�M(Q, t), (1)
where A(ui, t) is the diathermal volume flux across the
isothermal surface ui51,2 and M(Q, t) is the volume flux
out of the control volume into the remainder of the
ocean (see Fig. 2). Positive (negative) values of A are
toward cooler temperatures, directed mainly poleward
(equatorward), and associated with cooling (warming).
Since advection can only deform a material surface in
an incompressible, inviscid fluid, leaving the volume
enclosed by it unchanged, A depends only on non-
advective (interior diffusive and air–sea) fluxes. Sepa-
rating the nonadvective supply of heat to the volume
into contributions associated with air–sea heat fluxes
and interior diffusive processes, we write Walin’s for-
mula [following the notation introduced by Garrett
et al. (1995) and Marshall et al. (1999)]
A(u, t) 5 F(u, t) � ›D(u, t)
›u, (2)
where D(u, t) is the diffusive flux of temperature across
interior surfaces of the volume and
F(u, t) 5›
›u
ð ðu
u0
�Q
net
rCp
ds (3)
is the contribution by air–sea heat fluxes. Temperature
u0 labels a reference surface (see Fig. 2), Qnet is the air–
sea heat flux (positive upward) in watts per square
meter, ro 5 1035 kg m23 is the reference sea surface
density, Cp 5 4000 J K21 kg21 is the specific heat ca-
pacity of water, and ds is an area element at the sea
surface. The term F(u, t) is known as the transformation
rate due to air–sea heat fluxes. It has units of cubic meters
per second [and so can be expressed in Sverdrups (Sv [
106 m3 s21)] and is a function of time and temperature u.
Like A, a positive transformation rate F indicates a
transfer of water across u from warm to cold tempera-
tures and is thus associated with an increase of the
volume between u0 and u (see Fig. 2a).
A discretized expression for F is
F(u, t) 51
Du
ð ðu1Du/2
u0
�Q
net
rCp
ds�ð ðu�Du/2
u0
�Q
net
rCp
ds
!
51
Du
ð ðu1Du/2
u�Du/2
�Q
net
rCp
ds (4)
and is an integral over a discrete isotherm outcrop,
which is defined as the sea surface within the tempera-
ture class u 6 ½Du.
We now rewrite F(u, t) as
F(u, t) 5
ð ðx,y
F (t, x, y, p)ds, (5)
where
F (t, x, y, p) 5�Q
net(t, x, y)
rCp
p (6)
is a two-dimensional map of the transformation rate F,
in the sense that the surface integral of F will yield F.
The boxcar sampling function of temperature is de-
fined as
p(ui, Du) 5
1
Du, if u
i� Du
2, u , u
i1
Du
2
0, otherwise.
8<: (7)
The instantaneous 2D map of F is zero everywhere
except over the outcrop window of the temperature
class defined by pui,Du
. However, when averaged in time
(e.g., over a month or a year), the seasonal migration of
the surface outcrops sweeps out a larger region, and
patterns emerge in the map of F , as will be described
in section 3c. Such an approach was recently proposed
by Brambilla et al. (2008) and used in potential den-
sity coordinates to map transformation rates of North
Atlantic Subpolar Mode Water.
1820 J O U R N A L O F P H Y S I C A L O C E A N O G R A P H Y VOLUME 39

FIG. 2. (a) Schematic of the control volume bounded by isotherms u1 and u2, which is the
subject of Walin’s (1982) theoretical framework: VQ is the volume of the layer Q, F and ›uD are
the surface and internal diathermal volume flux components, M(Q) is the flow out of the control
volume, and the vertical gray arrows represent air–sea fluxes. Temperature u0 labels a reference
surface. (b)–(c) Horizontal and vertical views of the two isotherms bounding the Q layer with a
nonuniform meridional profile of heat flux cooling (‘‘c’’). Black arrows represent the diather-
mal volume flux across isotherms. (d) Maps (from the left to the right) of transformation rates
across u1, u2, and formation rate of the Q layer, time-integrated between t and t 1 dt. The thick
contours correspond to consecutive isotherm positions (thin contours demarcate associated
temperature classes) and positive (negative) signs denote areas of positive (negative) rates.
AUGUST 2009 M A Z E E T A L . 1821

The contribution of air–sea heat fluxes to the change
in volume of water of the Q layer is called the formation
rate DF given by
DF(Q, t) 5 F(u2, t)� F(u
1, t) (8)
and is obtained by taking the difference in the transfor-
mation rates across the bounding isothermal surfaces.
We can visualize the contribution of air–sea heat
fluxes spatially by computing the difference between the
transformation rate maps corresponding to the tem-
perature classes pu2,Du
and pu1,Du
:
DF 5F (t, x, y, pu2,Du
)� F (t, x, y, pu1,Du
). (9)
Here DF is called the formation rate map and has the
property
DF 5
ð ðx,y
DF ds. (10)
Averaging DF in time yields spatial maps that show
where water of temperature range Q is formed over a
given period. Thus, the aforementioned mapping tech-
nique can be used in conjunction with the Walin integral
statements to reveal information about where and when
a water mass is formed by air–sea interaction.
Note that Brambilla et al. (2008) questioned the fea-
sibility of mapping formation rates as in Eq. (9). Here
we hope to demonstrate the utility of formation maps by
considering the volume of water within a finite tem-
perature range: its volume is changed by the action of
nonadvective processes on the two isothermal surfaces
that demarcate it.
To understand how the transformation and formation
rate maps relate to the Walin statements, let us consider
the two isotherms u1 and u2, the northern and southern
boundary of the layer Q, shown schematically in Fig. 3b
in the horizontal and in Fig. 2c in the vertical. We as-
sume here that D and M are zero in Eqs. (1)–(2) so that
there is a simple balance between the rate of volume
change and formation/destruction by air–sea heat
fluxes. Now suppose that there is more intense cooling
occurring over the pu2,Du
class than over pu1,Du
. Cooling
induces the isotherms to migrate southward, which
corresponds to a positive (poleward) diathermal volume
flux F. Since the diathermal volume flux across u2 is
greater than across u1, the volume of the Q layer in-
creases (see black arrows in Figs. 2b and 2c). The two
left panels shown in Fig. 3d represent the mapping of
these transformation rates according to Eq. (6). The
formation rate map DF , sketched in Fig. 2d, shows the
local rate of change in volume of the Q layer.
3. Studying Eighteen Degree Water usingtransformation and formation maps
In this section we will use transformation and for-
mation rate maps, in conjunction with the Walin for-
mula, to study Eighteen Degree Water (EDW). We will
define EDW to be the volume of fluid bounded by
the isothermal surfaces u1 5 178C and u2 5 198C. Thus,
all water with temperature u 5 18 6 18C is included in
our budget, not just weakly stratified waters. Two dif-
ferent datasets will be used, as described in the next
section.
a. Description of the datasets
We choose here to work in temperature classes and so
require estimates of sea surface temperatures (SST) and
net air–sea heat fluxes (Qnet). There are many such
datasets, whose relative merits and consistency are dif-
ficult to determine. Here we choose to focus on two SST
and Qnet datasets, which have complementary qualities.
The first dataset is OCCA, which was produced at the
Massachusetts Institute of Technology by the Estimat-
ing the Circulation and Climate of the Ocean (ECCO)
group and is available (http://www.ecco-group.org/) for
the data-rich Argo period from 2004 to 2006. It is a
global state estimate of the evolving state of the ocean
on a 18 3 18 horizontal grid with 50 vertical levels ex-
tending from the surface of the ocean to the bottom. It
was produced using the MIT general circulation model
(MITgcm) (Marshall et al. 1997a,b) data assimilation
technology (ECCO), which fits the model trajectory as
closely as is possible to all modern datasets, including
Argo profiles, surface altimetry, and satellite SSTs. The
fitting of the model to the data is done by sweeping
backward and forward over 16-month periods using air–
sea fluxes and winds as control variables. OCCA surface
heat fluxes are computed via the Large and Pond (1981)
‘‘bulk formulae’’ using the model SST and National
Centers for Environmental Prediction–National Center
for Atmospheric Research (NCEP–NCAR) Global
Reanalysis 1 (NCEP-1)-analyzed fields of winds and
atmospheric temperature and humidity, employing a
surface boundary layer model. Three consecutive years
are available, ‘‘joined together’’ using linear interpola-
tion over four months of overlap. This method has the
notable advantage of confining spurious drifts of the
model away from observations, yielding a state estimate
that is very close to observations. A precise description
of the resulting dataset can be found in Forget (2008).
In Figs. 1b and 1c OCCA is compared with raw Argo
temperature profiles. Figure 1b is produced by plotting
as a function of time every Argo temperature profile
within a 108 3 58 box centered on the EDW bowl at
1822 J O U R N A L O F P H Y S I C A L O C E A N O G R A P H Y VOLUME 39

358N, 558W. Figure 1c shows the corresponding plot
from OCCA, sampled accordingly. The EDW layer
shows a seasonal cycle with a short period of wintertime
ventilation when the 198C isotherm reaches the surface
and a longer period of restratification throughout the
remainder of the year. Although the OCCA time series
is smoother than that from Argo (largely due to the
absence of eddies), the depth, thickness, and temporal
characteristics of the EDW layer are very similar in
OCCA and Argo float data. Using OCCA, Forget et al.
(2008, manuscript submitted to J. Phys. Oceanogr.,
hereafter FRG) have computed a volume budget of
EDW using Eqs. (1)–(2). Here we use the OCCA air–sea
heat flux and SST to illustrate our diagnostic technique.
The second dataset (hereafter MIXED) consists of
SST maps and atmospheric state estimates produced by
Remote Sensing System and the European Centre for
Medium-Range Weather Forecasts, respectively. SST
maps are a blend of radiometer and microwave obser-
vations [Tropical Rainfall Measuring Mission (TRMM)
Microwave Imager (TMI)–Advanced Microwave Scan-
ning Radiometer for Earth Observing System (EOS;
AMSRE)] with a native resolution of ¼8 and one day
(see http://www.remss.com for more details). Atmo-
spheric state variables required are taken from the
ECMWF operational system, which provides daily
global gridded data from 1994 to the present. Atmo-
spheric variables are linearly interpolated on to the
satellite SST grid, and surface turbulent and radiative
heat fluxes are then computed using the most recent
Coupled Ocean–Atmosphere Response Experiment
(COARE) bulk algorithm (version 3.0; Fairall et al.
2003), which has been shown to be ‘‘the least problem-
atic’’ flux scheme relative to other algorithms (Brunke
FIG. 3. (a) Three years (2004–06) of mean transformation rates F(u) in OCCA (black) and MIXED (gray) datasets.
The shaded area indicates the EDW range between 198 and 178C. (b) Time series of EDW formation rate DF 5
F(19) 2 F(17) from 2004 to 2006. Plain lines are daily time series that have been low-pass filtered with a 7-day cut-off
frequency. Light black and gray dots are daily values for OCCA and MIXED datasets. First day of January, February,
and March are denoted by the vertical dashed lines at the beginning of each year. (c) Composite net formation rate
DF(188C) obtained by averaging monthly mean fields over the 3-yr time series shown in (b). Vertical bars mark the
3-yr standard deviation amplitude. Circles are the values obtained by integrating in space monthly mean formation
maps, such as those shown in Fig. 8.
AUGUST 2009 M A Z E E T A L . 1823

et al. 2003). The net surface heat flux is computed by
summing turbulent and radiative fluxes from the
COARE 3.0 algorithm. Such a method could lead to
spurious local values, but a careful inspection of the
MIXED data (see appendix A) suggests that it yields
reasonable estimates for the purpose of this study.
Daily data (2004–06) from OCCA (18 spatial resolu-
tion) and MIXED (¼8 spatial resolution) data are lin-
early interpolated onto a 1/88 grid in order to avoid any
bias in the temperature class sampling that would un-
dermine the comparison between them.
b. The Walin calculation
The Walin integral statements of the EDW water mass
transformation rate and formation rate are computed
using both the OCCA and MIXED datasets. Tempera-
ture classes are defined with a bin interval of Du 5 ½8C;
for example, the 198C temperature class consists of all
points having a temperature u such that 19 2 0.25 # u #
19 1 0.25 (boxcar function p19,1/2). Sensitivity of the re-
sults to this bin choice is discussed in appendix B.
The 3-yr time mean of F(u) is shown in Fig. 3a for the
temperature range 108–258C. The gray-shaded area
emphasizes the EDW temperature range. Both datasets
show a larger mean transformation rate at 198 than
at 178C, implying production of EDW; DF(188C) 5
F(198C)� F(178C) 5 5.6 Sv in OCCA and 3 Sv in
MIXED. These values are somewhat smaller than pre-
vious estimates based on Walin’s, found in the litera-
ture, which range from about 10 Sv to 20 Sv (see Speer
and Tziperman 1992; Speer et al. 1995; Nurser et al.
1999, e.g.). Computational details can account for a part
of this wide range of values, but the main uncertainty is
likely to be in the estimates of the net air–sea fluxes
themselves. Resolution may also affect results, espe-
cially in calculations done at low spatial and temporal
resolution (note that in our study, interpolation onto a1/88 grid reduced mean transformation rates by an am-
plitude of about 1 Sv).
Time series of DF(188C) (net EDW formation rate)
are shown in Fig. 3b. Formation rates calculated using
both datasets exhibit a marked seasonal variability with
daily formation rates reaching as high as 200 Sv in
winter (especially February) and 250 Sv (destruction)
in summer. Both datasets produce a very similar sea-
sonal cycle, but a larger wintertime formation rate is
obtained using OCCA than using MIXED. The primary
formation period is January–March and the primary
destruction period is April–June. This is clearly seen in
Fig. 3c, which shows the mean monthly formation rate
over the 3-yr period. The formation rate reaches a peak
in February: 63 and 43 Sv for the OCCA and MIXED
datasets, respectively. The formation rates calculated
from the two datasets differ most during the formation
period and are rather similar during the rest of the year.
Figure 3b also shows the interannual variability in
DF(188C), quantified in Fig. 3c as the standard deviation
(STD) of monthly values over 3 yr. The largest STD is
found during the formation period, peaking at 19 Sv for
OCCA in February and 9 Sv for MIXED in March.
The 3-yr average formation rate owing to air–sea heat
fluxes is positive, indicating that more EDW is formed
by air–sea heat fluxes than is destroyed. FRG found the
volume of the EDW layer to be close to a steady state
over the 2004–06 period. This suggests that other pro-
cesses (such as ocean mixing) act to destroy EDW. We
will not consider these processes here, but the interested
reader is referred to FRG and G. Forget et al. (2008,
unpublished manuscript) for a discussion of the annual
cycle of EDW volumes in OCCA and the contributing
formation and dissipation processes.
c. Mapping EDW transformation rates
Using Eq. (6), we mapped the mean transformation
rate over the 3-yr period for the temperature classes
198 6 0.258 and 178 6 0.258C. The mean transformation
rate maps are shown in Fig. 4. By construction, the
surface integral of the maps F (198C) and F (178C) yield
the Walin transformation rates F(198C) and F(178C),
shown in Fig. 3a.
Maps of transformation rates computed from both
datasets and for each temperature class have the same
general form: a meridional dipole with positive values in
the south and negative values in the north of the domain
swept out by the SST outcrops over the seasonal cycle.
(Note that in Fig. 4 the position of the outcrop in March
and August is marked.) Positive (negative) values imply
a poleward (equatorward) transfer of water and are
associated with cooling (warming).
The cause of the meridional dipole can be understood
by calculating maps of seasonal average transformation
rates. Figure 5 shows the average transformation map
over wintertime (October–March with monthly out-
crops marked) and summertime (April–September with
monthly outcrops marked) for both datasets. Winter-
time transformation maps are positive almost everywhere
in OCCA (MIXED), yielding a wintertime transformation
rate of 40 and 23 Sv (33 and 19 Sv) for 198 6 0.258C and
178 6 0.258C. Summertime transformation maps are
negative almost everywhere, and OCCA (MIXED) yield
a summer transformation rate of 222 and 216 Sv (222
and 214 Sv) for 198 6 0.258 and 178 6 0.258C.
In areas where a temperature class outcrops in both
wintertime and summertime, the wintertime cooling
and summertime warming cancel out over the seasonal
cycle, yielding near-zero annual mean transformation
1824 J O U R N A L O F P H Y S I C A L O C E A N O G R A P H Y VOLUME 39

rates for the temperature class. This cancellation ex-
plains the near-zero transformation rates observed in
the center of the region swept out by the outcrops over
the seasonal cycle. However, in the southernmost and
northernmost locations where a temperature class out-
crops, no such cancellation occurs. Since an outcrop
reaches its southernmost location during wintertime,
the transformation rate in this region is dominated by
wintertime cooling. Similarly, the transformation rate in
the northernmost location of the outcrop is dominated
by summertime warming. Thus, in maps of the annual
mean transformation rate (Fig. 4), a meridional dipole is
observed. Note, however, the marked east–west asym-
metry associated with both the fanning out of the out-
crops on moving eastward across the basin and the
presence of intense air–sea fluxes in the region of the
separated Gulf Stream.
Although the transformation rates for both the 198
and 178C temperature classes exhibit a meridional di-
pole, they also have important differences. Over a wide
area west of 458W between the Gulf Stream and 308N
F (198C) exhibits a maximum. In contrast, F (178C) ex-
hibits a maximum confined to the Gulf Stream in the
western part of the basin (see Fig. 4). These differences
are due to the different responses of the 198 and 178C
isotherms to wintertime cooling. In response to win-
tertime cooling, the 198C isotherm migrates southwest-
ward (particularly in February and March), opening
up a large area. Over most of this area, the 198C iso-
therm does not outcrop during the summertime. Thus,
the 198C transformation rate over this entire region is
dominated by wintertime cooling and is, therefore, large
and positive. In contrast, in the western part of the
basin the 178C isotherm remains constrained to the Gulf
Stream in wintertime, and the area of positive trans-
formation rates is constrained to a small area along the
southern flank of the Gulf Stream. The greater area of
positive transformation rates for the 198C temperature
class compared to the 178C temperature class is the
reason for the large drop in the Walin transformation
curves between 198 and 178C (see Fig. 3a).
d. EDW formation rate maps
A map of the net formation rate of EDW over the 3-yr
period, DF (188C), is obtained by subtracting the trans-
formation rate maps for the 178C temperature class from
the transformation rate maps for the 198C temperature
class, as expressed in Eq. (9) and shown in Fig. 6 for both
datasets. By construction, surface integrals of DF (188C)
yield the formation rate DF(188C) 5 F(198C)�F(178C)
[see F(u) in Fig. 3a]. Positive (negative) areas corre-
spond to net formation (destruction) of EDW. We see
that EDW is formed over a wide region south of the
Gulf Stream.
FIG. 4. The mean transformation maps of (left) F (198C) and (right) F (178C) (Sv m22) for the 3-yr period 2004–06: (top)
OCCA dataset and (bottom) MIXED dataset. Red (blue) contours are the August (March) mean position of the 198 and
178C isotherms; green contours are the mean 20.2- and 2 0.6-m SSH from OCCA. Integral quantities of the fields are shown
in the upper-left corner of each map (Sv) over the total domain (T), for positive areas only (P), for negative areas only (N),
and over the dashed black box (B). A nonlinear color scale has been used to reveal patterns.
AUGUST 2009 M A Z E E T A L . 1825

FIG. 5. Transformation maps (Sv m22) for (a)–(d) for mean October–March (fall–winter) and (e)–(h) mean April–
September (summer–spring) for the 3-yr period 2004–06 (Sv m22): (left) F (198C) and (right) F (178C); (top) OCCA dataset
and (bottom) MIXED dataset. Blue (red) contours in maps A–D (E–H) are the monthly mean positions for October–March
(April–September) of the 198 and 178C isotherms; green contours are the mean 20.2- and 20.6-m SSH from OCCA.
Integral quantities (Sv) of the fields are shown in the upper-left corner of each map over the total domain (T), for the
positive areas only (P), for the negative areas only (N), and over the dashed black box (B). A nonlinear color scale has been
used to reveal patterns.
1826 J O U R N A L O F P H Y S I C A L O C E A N O G R A P H Y VOLUME 39
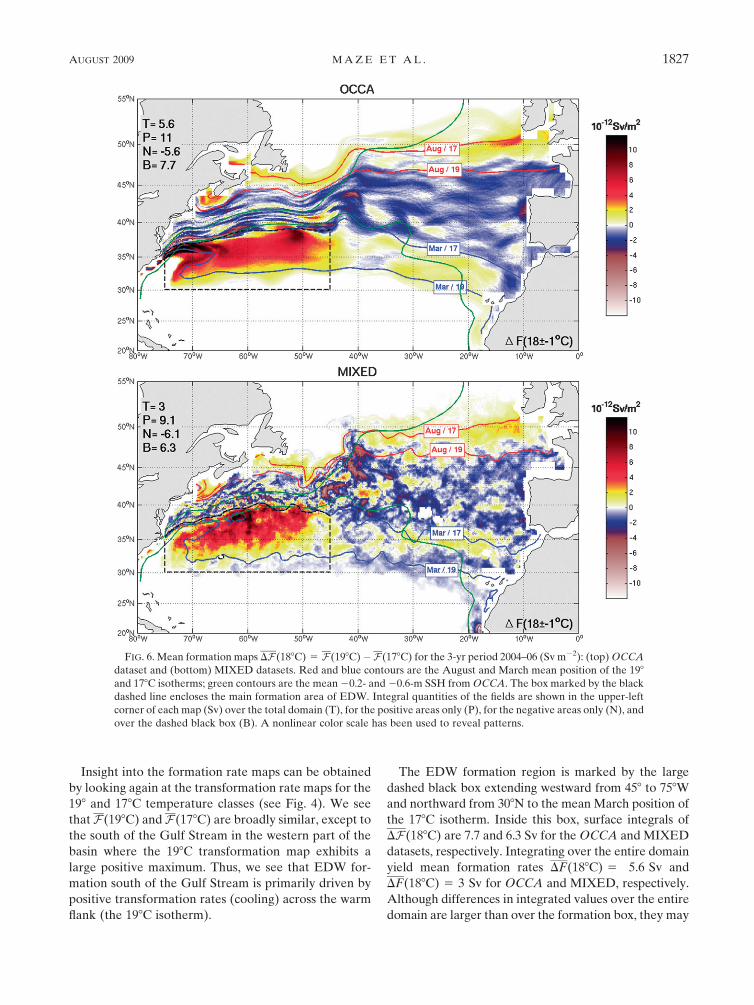
Insight into the formation rate maps can be obtained
by looking again at the transformation rate maps for the
198 and 178C temperature classes (see Fig. 4). We see
that F (198C) and F (178C) are broadly similar, except to
the south of the Gulf Stream in the western part of the
basin where the 198C transformation map exhibits a
large positive maximum. Thus, we see that EDW for-
mation south of the Gulf Stream is primarily driven by
positive transformation rates (cooling) across the warm
flank (the 198C isotherm).
The EDW formation region is marked by the large
dashed black box extending westward from 458 to 758W
and northward from 308N to the mean March position of
the 178C isotherm. Inside this box, surface integrals of
DF (188C) are 7.7 and 6.3 Sv for the OCCA and MIXED
datasets, respectively. Integrating over the entire domain
yield mean formation rates DF(188C) 5 5.6 Sv and
DF(188C) 5 3 Sv for OCCA and MIXED, respectively.
Although differences in integrated values over the entire
domain are larger than over the formation box, they may
FIG. 6. Mean formation maps DF (188C) 5 F (198C)�F (178C) for the 3-yr period 2004–06 (Sv m22): (top) OCCA
dataset and (bottom) MIXED datasets. Red and blue contours are the August and March mean position of the 198
and 178C isotherms; green contours are the mean 20.2- and 20.6-m SSH from OCCA. The box marked by the black
dashed line encloses the main formation area of EDW. Integral quantities of the fields are shown in the upper-left
corner of each map (Sv) over the total domain (T), for the positive areas only (P), for the negative areas only (N), and
over the dashed black box (B). A nonlinear color scale has been used to reveal patterns.
AUGUST 2009 M A Z E E T A L . 1827

not be significant when note is taken of the (random)
error bar of 61 Sv (see section 4).
EDW formation in the box has an interesting spatial
structure. Figure 7 shows the annual mean DF (188C)
zonally integrated over the formation box, plotted as a
function of distance south of the northern boundary
(defined as the March position of the 178C isotherm).
The formation rate rapidly increases moving southward
from the northern boundary, reaches a maximum at
distances between 50 and 300 km, and then slowly de-
creases to small values at distances greater than 600 km.
The bump at 100 km found in the OCCA dataset, but
absent in MIXED, is due to high formation rates ob-
served in the OCCA dataset in the western part of the
formation box where the Gulf Stream separates from
the coast. The Gulf Stream may be separating from the
coast too abruptly in the OCCA dataset, which suggests
that the bump may be spurious. Refined regional ob-
servations that the Climate Variability and Predict-
ability (CLIVAR) Mode Water Dynamic Experiment
(CLIMODE) project aims to provide will aid in re-
solving these questions.
The maps of the 3-yr mean EDW formation rate show
that EDW is formed by air–sea heat fluxes in a broad
region south of the Gulf Stream in the western part of
the basin, with maximum formation rates 50–300 km
south of the position of the March 178C isotherm. The
main formation region of EDW is mostly coincident
with the thickest layer of EDW seen in Fig. 1a. The
formation region found in this study is broadly similar to
the region with large subduction rates across the mixed
layer base seen by Valdivieso Da Costa et al. (2005) in an
eddy-permitting numerical simulation (see their Fig. 5b).
Peng et al. (2006) proposed another definition of the
formation area of EDW as ‘‘the region where the March
mixed layer temperature ranges between 178C and
198C.’’ This definition is less rigorous but also broadly
matches the formation area seen in this study (see Fig. 6).
Destruction of EDW by air–sea fluxes, on the other
hand, occurs over a wide area in the eastern half of the
basin. Comparing the surface integral of DF (188C) over
all regions where DF is positive to the surface integral
of DF over all regions where DF is negative, we find the
integral of the negative regions to be about 22/3 that of
the positive regions. Therefore, in calculating DF(188C)
in the Walin integral framework, EDW destruction in
the eastern part of the basin partially cancels EDW
formation south of the Gulf Stream in the western part
of the basin. Thus, a basin integral Walin analysis does
not convey underlying mechanisms because it blends
together distant regions of formation and destruction
rates. The mapping technique, instead, exposes this
crucial spatial inheterogeneity.
Monthly mean formation rate maps were calculated
in order to determine when EDW is formed and to help
us understand how the yearly mean pattern is estab-
lished. Figure 8 shows monthly mean maps of formation
rates for January–April. In January EDW formation is
restricted to the Gulf Stream region since the EDW
outcrop has not yet opened up to the south. In February
the 198C isotherm sweeps southward toward the core
of the subtropical gyre, inducing a large flux of water
into the 178–198C temperature range (positive trans-
formation rate across the warmer flank). February is
thus the period of maximum formation over the year
(see Fig. 3c). The February surface integral over the
entire domain of DF(188C) is 63 Sv for the OCCA da-
taset and 43 Sv for the MIXED dataset. Formation rates
integrated only over the formation box are 75 Sv for
OCCA and 52 Sv for MIXED. In March the 198C iso-
therm reaches westward to its greatest extent. Due to
the different behavior of the 198C isotherm in the two
datasets, there is a large discrepancy between formation
rates calculated from the two datasets in March. In
April air–sea heat fluxes change sign and EDW is
eroded over the same region in which it was formed in
February. EDW continues to be destroyed in May but
largely in regions outside the formation box.
4. Sensitivity of transformation and formation torandom errors in input fields
A notable result from the previous section is the good
overall agreement between maps of transformation and
formation rates obtained from our two datasets. There
FIG. 7. Zonal integration of the mean formation map over the
black dashed formation box in Fig. 6 plotted as a function of the
distance from its northern boundary (March monthly mean 178C
isotherm): OCCA (solid) and MIXED (dashed) datasets.
1828 J O U R N A L O F P H Y S I C A L O C E A N O G R A P H Y VOLUME 39

are detailed differences, however, which result in siz-
able differences in integrated values. There are many
possible sources of error in such estimates. Here we
focus on the contribution of random errors in SST and
Qnet, assuming that errors in the input fields have zero
time mean and prescribed covariances. We compute the
probability distribution functions (PDF) that result from
perturbing SST, Qnet, or both in a large ensemble of N
perturbations. Each perturbation is generated by ap-
plying a time/space diffusive filter to a random field with
a normal distribution (Weaver and Courtier 2001) and
scaled by a map of expected error standard deviation.
This method allows one to generate evolving surface
perturbations with chosen distributions of error vari-
ance and zonal, meridional, and temporal decorrelation
scales. We compute three ensembles of N 5 500 per-
turbations in which only Qnet is perturbed, only SST is
perturbed, and both Qnet and SST are perturbed. We
FIG. 8. January–April monthly mean formation maps DF (188C) 5 F (198C)�F (178C) for the 3-yr period 2004–06
(Sv m22): (left) OCCA and (right) MIXED. Blue contours are the 198 and 178C outcrops for each month; green contours are
the mean 20.2 and 20.6-m SSH from OCCA. The box marked by the black dashed line encloses the main formation area of
EDW. Integral quantities of the fields are shown in the upper-left corner of each map (Sv) over the total domain (T), for the
positive areas only (P), for the negative areas only (N), and over the dashed black box (B). A nonlinear color scale has been
used to reveal patterns.
AUGUST 2009 M A Z E E T A L . 1829
add the perturbations to OCCA fields and compute the
EDW transformation/formation rates, as described in
section 2, on the 18 3 18 grid with Du 5 0.58C. For each
ensemble we then compute the PDF of integral and
mapped transformation/formation rates.
For Qnet perturbations we choose decorrelation scales
of 7 days, 88, and 48 in the temporal, zonal, and merid-
ional directions, respectively; and 7 days, 28, 28 for SST
perturbations. Anomaly patterns in Qnet are more co-
herent in the zonal than in the meridional direction
(Romanou et al. 2006), while this is not the case for SST
anomalies (Hosoda and Kawamura 2004; Dong et al.
2006). We scale Qnet perturbations by the rms dif-
ference between NCEP-1 and ECMWF analysis heat
fluxes. This map has an amplitude of 100–120 W m22
along the Gulf Stream core and 40–60 W m22 in the
subtropical gyre, and has a very similar pattern to the rms
difference between the MIXED and ECMWF heat fluxes
shown in Fig. A1b. We scale SST perturbations by the
rms difference between the Reynolds optimum interpo-
lation (OI) version 2 (V2) (Reynolds and Smith 1994)
and TMI–AMSR-E SST products that are about 18C
along the Gulf Stream (peaking locally at 28C), and 0.58C
in the subtropical gyre. The spatial pattern is very similar
to the rms difference between the TMI–AMSR-E and
NCEP-1 real-time global (RTG) SSTs shown in Fig. 10a.
The PDFs of annual mean basin-integrated rates are
shown for the first ensemble (only Qnet perturbed) in
Fig. 9. PDFs of F(178C) and F(198C) (Fig. 9a) have a
standard deviation of 0.5 and 1 Sv, respectively. We
obtain 0.4/0.9 Sv in the second ensemble (only SST
perturbed) and 0.6/1.4 Sv for the third (both Qnet and
SST perturbed). These values differ from one another
(as they are calculated by perturbing different quanti-
ties) but not to a great extent. Typical error estimates
are 0.5 Sv for F(178C) and 1 Sv for F(198C). The vari-
ance of F(198C) is larger than that of F(178C) because
the 198C isotherm sweeps out a larger area than for the
178C isotherm, and thus the volume flux across it is more
sensitive to errors in Qnet and/or SST. Figure 9b shows
the PDFs of DF(188C) for the first ensemble. It has a
standard deviation of 1 Sv. The other two ensembles
yield similar values.
Monthly values of ensemble mean and ensemble
standard deviation are given for DF(188C) in Fig. 9b for
the first ensemble. Ensemble mean values are close to
the ones shown in Fig. 3c despite differences in grid
resolution. The standard deviation ranges from 7 Sv in
February at the peak of formation to 0.5 Sv at the end
of summer when the ensemble mean formation rate
is zero. It is noteworthy that the ensemble mean for-
mation rate only exceeds two standard deviations in
December–February and April–June.
The spatial distribution in formation rate errors is
shown in Fig. 9c for the first ensemble and Fig. 9d for the
second (the third, not shown, has a pattern very similar
to that of the second ensemble). Both ensembles show
the error to be maximum along the Gulf Stream, albeit
somewhat more homogeneously distributed in space in
the first ensemble than in the second. These maps are
error estimates associated with formation rate maps given
by Fig. 6. We conclude that the patterns in Fig. 6 are
robust to random errors in Qnet and SST. This is espe-
cially clear for the box in the western basin showing large
EDW formation south of the Gulf Stream, while the
largest errors are confined to the path of the Gulf Stream.
Finally, it should be said that, given the random er-
rors estimated here as O(1 Sv), the larger differences in
formation and transformation rates obtained using
MIXED as opposed to OCCA must be due to system-
atic errors (such as bulk layer formulations), which are
more difficult to quantify. An attempt is given in FRG.
5. Conclusions
Maps of transformation and formation rates due to
air–sea heat fluxes have been developed, which com-
plement, and can be used alongside, the integral state-
ment of water mass transformation introduced by Walin
(1982). Spatial maps of formation rate allow us to
observe where and when water masses are formed or
destroyed owing to air–sea heat fluxes. The mapping
approach has been applied to study the cycle of North
Atlantic EDW formation and destruction using two dif-
ferent datasets, OCCA and MIXED, which yield broadly
similar results.
Transformation rate maps show the spatial distribution
of the rate at which water of one temperature class is
transformed into another. For 198 and 178C temperature
classes, transformation rate maps exhibit a meridional
dipole with positive values to the south (associated with
winter heat flux cooling), negative values to the north
(summer warming), and thus near-zero values to the
center of the region swept out by SST outcrops over a
seasonal cycle. Moreover, it is natural to view formation/
destruction of EDW as the difference between diather-
mal volume fluxes into and out of the layer. Thus,
formation rate maps were computed as differences be-
tween maps of transformation rates. They reveal that
EDW forms primarily between the Gulf Stream and
308N to the west of 458W. Finally, an ensemble pertur-
bation method was used to determine the amplitude and
distribution of random errors due to SST and Qnet
uncertainties. The transformation/formation patterns
revealed by the maps appear to be robust to random
errors.
1830 J O U R N A L O F P H Y S I C A L O C E A N O G R A P H Y VOLUME 39

Although transformation rate maps of both tem-
perature classes exhibit a meridional dipole, there is a
key difference between them that intimately drives the
EDW formation rate (both its pattern and integrated
value). The transformation rate map across the 198C
isotherm exhibits a maximum over a wide area between
the Gulf Stream and 308N to the west of 458W. In con-
trast, the transformation rate map across 178C exhibits a
maximum confined to a small area along the southern
flank of the Gulf Stream. This difference implies a net
FIG. 9. From the OCCA dataset: PDFs of (a) transformation F(178C), F(198C) and (b) formation DF(188C) rates
for the first ensemble experiment where only the air–sea heat flux is perturbed (see text). In (b), monthly mean and
standard deviation of DF(188C) are tabulated. (bottom) Maps of local standard deviation of DF(188C) for the (c) first
and (d) second ensemble with perturbations on Qnet and SST only, respectively. Dashed black line is the formation
box area and two thick black contours are mean 20.2- and 20.6-m SSH from OCCA.
AUGUST 2009 M A Z E E T A L . 1831

positive volume flux of water into the EDW layer (a
positive formation rate) that is not balanced by negative
volume flux in other areas or seasons. Note that the
formation of EDW occurs in February when the 198C
isotherm migrates southwestward, while the 178C re-
mains confined to the Gulf Stream. This implies that the
EDW formation is primarily driven by positive trans-
formation rates across the warm flank of the EDW layer.
A small fraction of the EDW formed in late winter is
destroyed in April, as a result of negative transformation
rates (warming) across the still-open 198C outcrop.
The largest destruction of EDW by air–sea fluxes
occurs over an extensive region in the central-eastern
part of the basin, driven by positive transformation rates
across the 178C isotherm. Formation maps thus em-
phasize the limitation of the Walin framework if one
is interested in the budget of weakly stratified EDW,
that is, the North Atlantic Subtropical Mode Water
(NASTMW), typically defined as the least stratified
fraction of the EDW layer. As NASTMW is located
south of the Gulf Stream, in the core of the subtropical
gyre, we surmise that the formation site of EDW is that
of NASTMW. Destruction of EDW, however, is in
the central-eastern basin where no sizable volume of
NASTMW is found. Thus, formation maps suggest that
a Walin analysis performed over the entire basin, as
required by the theory, is perhaps a lower bound of
the NASTMW formation rate induced by air–sea heat
fluxes. A more accurate estimate of NASTMW forma-
tion rate may be the integral over the dashed black box
in the western basin defined in section 3d.
On very long time scales we expect EDW volume to
be in steady state. Kwon and Riser (2004) found a clear
balance between formation and destruction of NASTMW
over 40 years of data (at a rate of 63.5 Sv with an error
of 60.5 Sv). However, they also observed large inter-
annual variability (see also Marsh et al. 2005; Old and
Haines 2006), so we might not expect to find the EDW
layer in balance over the short period from 2004 to 2006.
Nevertheless, a volumetric census of the EDW layer in
OCCA indicates that, perhaps surprisingly, it is almost
in balance (about 1 Sv of volume storage over a seasonal
cycle and on average for the 3 yr, FRG). Thus, the 5.6 Sv
of EDW formed by air–sea fluxes (or 7.7 Sv for the
NASTMW box integral) must be balanced by other
destructive processes. Since only nonadvective pro-
cesses can lead to water mass transformation, interior
diffusive processes must be responsible for destruction
of EDW. Vertical and horizontal mixing and/or hori-
zontal diabatic eddy fluxes owing to unresolved eddies
(see Radko and Marshall 2004) may be important in
destroying EDW. These processes will be discussed
in forthcoming papers (FRG; G. Forget et al. 2008,
unpublished manuscript) in which subsurface estimates
from the OCCA are used to calculate volumes and dis-
sipation rates. There we extend the mapping technique to
interior processes.
Finally, it is important to emphasize that we have
focused here on the role of air–sea fluxes in changing the
volume of water in the particular temperature range of
EDW because of its association with subtropical mode
water. In the study of subtropical mode water, however,
one is perhaps further interested in the cycle of poten-
tial vorticity destruction and creation induced by air–sea
fluxes. The focus of attention is then the flux of potential
vorticity across the EDW isopycnal outcrop and its
circulation within the gyre on the interior isopycnic
surface. Mapping out the air–sea potential vorticity flux
using techniques similar to that discussed here will be
the subject of a future study.
Acknowledgments. Microwave OI SST data are pro-
duced by Remote Sensing Systems and sponsored by Na-
tional Oceanographic Partnership Program (NOPP), the
NASA Earth Science Physical Oceanography Program,
and the NASA REASoN DISCOVER Project. Data are
available at http://www.remss.com. This work was sup-
ported by NSF (CLIMODE) and NASA (ECCO2).
APPENDIX A
The MIXED Heat Flux
The MIXED heat flux dataset was computed using
TMI–AMSR-E SST and ECMWF analysis atmospheric
state estimates. Atmospheric variables were linearly
interpolated on to the satellite SST grid, and surface
turbulent and radiative fluxes were then computed.
Possibly incompatible SST and atmospheric states can
lead to unrealistic results. The SST used in the ECMWF
analysis system is the NCEP RTG produced with a two-
dimensional variational interpolation analysis of the
most recent 24-h buoy and ship data, satellite-retrieved
NOAA-17 Advanced Very High Resolution Radio-
meter (AVHRR) SST data, and SSTs derived from
satellite-observed sea ice coverage. Figure A1a shows
the daily centered rms difference (RMSD) between the
RTG SST used by ECMWF and the TMI–AMSR-E SST
used here to produce MIXED. The two products differ
most along the Gulf Stream with RMSD values of 18C,
peaking locally at 28C. The RMSD between Qnet ob-
tained from ECMWF and MIXED is shown in Fig. A1b.
Differences are again largest along the Gulf Stream
with values reaching 125 W m22. Reassuringly, this is of
the same order of magnitude and spatial scale as the
1832 J O U R N A L O F P H Y S I C A L O C E A N O G R A P H Y VOLUME 39

RMSD between ECMWF and NCEP-1 original heat
fluxes (not shown). This suggests that the MIXED heat
flux does not contain spurious values and is as different
from ECMWF as is NCEP.
We also compared time mean values of Qnet from
MIXED with other datasets. Results are summarized in
Fig. A1c, which plots the zonal mean and time mean of
the monthly time series of Qnet from National Oceano-
graphic Center version 1.1 (NOC1.1) and the 2004–06
daily time series from ECMWF, MIXED, OCCA, and
NCEP-1. Relative to NOC1.1, ECMWF and NCEP heat
fluxes overestimate the oceanic heat loss in the latitude
band of interest in mode water formation (308–458N).
MIXED is closer to NOC 1.1 than, for example,
ECMWF and so can be considered acceptable.
Last, we estimated the performance of the MIXED
heat flux locally. The CLIMODE project deployed a
meteorological buoy in the core of the Gulf Stream path
at 38.58N, 658W (denoted by a black cross on Figs. A1a,b)
from which we compared daily sea surface heat fluxes
with estimates from MIXED, OCCA, ECMWF, and
NCEP for the overlapping period from November 2005
to November 2006. The results are shown in a Taylor
diagram in Fig. A1d (Taylor 2001). Each point repre-
sents a local time series (labeled A, B, C, and D for
the four global heat flux products; see the legend in
Fig. Ac). The distance from the center of the disk is the
standard deviation (std dev) and the angle from the
x axis is the correlation with the time series at the buoy.
Thus, the distance between the buoy point on the x axis
and other estimates is the RMSD between the time
series. We see that ECMWF and MIXED have a similar
STD to the buoy time series, while OCCA underesti-
mates it and NCEP overestimates it.
Global and local variabilities also with time mean
of the MIXED heat flux was shown to be realistic,
FIG. A1. (a) Rms difference between daily TMI–AMSR-E and RTG SSTs from 2004 to 2006. (b) RMS difference
between daily MIXED and ECMWF analysis sea surface heat fluxes from 2004 to 2006. (c) Zonal mean of sea surface net
heat fluxes time mean from the National Oceanographic Center version 1.1 (from 1991 to 2005, monthly fields), ECMWF
analysis (2004–06, daily fields), MIXED (2004–06, daily fields), OCCA (2004–06, daily fields), and NCEP-1 (2004–06, daily
fields). (d) Taylor diagram from local daily sea surface net heat fluxes at the CLIMODE mooring localized at 38.58N, 658W
and denoted as the white cross in (a) and (b); individual points A, B, C, and D stand for ECMWF, MIXED, OCCA, and
NCEP-1 datasets, respectively.
AUGUST 2009 M A Z E E T A L . 1833

compared to several state-of-the-art heat flux products.
The point of this study is not to provide and present yet
another heat flux product (MIXED is not aimed to be
distributed), instead it is intended to compare formation
maps from the OCCA dataset to maps obtained from
another combination of SST and Qnet with a smaller
spatial resolution. One important result of this study is
the remarkable consistency of the patterns in formation
maps despite the differences in basin-integrated values.
APPENDIX B
Sensitivity to Bin Size and Resolution
The numerical discretization of the transformation
rate expression, Eq. (4), makes use of a temperature bin
Du to define temperature classes. If the bin is too small,
there will be insufficient outcropping regions to resolve,
leading to considerable noise in both maps and integral
values. On the other hand, if the bin is too large, we will
lose the ability to resolve temperature classes of inter-
est. We found Du 5 0.58C and a resolution of 1/88 to be a
good compromise leading to smooth maps, which can
resolve detail.
To test the sensitivity of the formation rate value to
the bin and resolution, we used various bins in the range
from 18 to 1/88C with several spatial resolutions in OCCA
for 2005 only (for numerical efficiency reasons) to
compute the EDW formation rate. Results are sum-
marized in Table B1. Whatever the spatial resolution, as
the bin decreases, positive and negative area integrals
tend to increase in amplitude. This reduces the error in
resolving the temperature class [see Eq. (B1)] but also
leads to average very large positive and negative values,
increasing uncertainties. However, when a linear spatial
interpolation is used to increase the horizontal resolu-
tion, we see that the variability of the formation rate as a
function of the bin decreases and that, for a given bin,
the formation rate converges as the resolution increases.
From Table B1, the 2005 mean formation rate of EDW
ranges from 5.1 to 7.48 Sv. For the range of bin and
resolution used here, the mean value is 5.8 Sv and the
standard deviation among them is 0.5 Sv, which gives an
estimate of the sensitivity of the results to the bin and
resolutions of surface fields.
Finally, we address the question of the discretization
error of the isotherms, that is, the error in approxi-
mating an isotherm by a temperature class. This error is
given by the difference between grid cell temperatures
and the actual isotherm to be determine
Fe5�
Qnet
rCp
pDu,u
iju� u
ij. (B1)
Note that compared to Marshall et al. (1999) we chose
to apply an absolute value to the difference, u 2 ui, in
order to avoid spurious cancellation of errors. This gives
an upper band on the error estimates. Maps and integral
values of transformation and formation rates have been
computed for Fe
and DFe
(not shown). We found this
source of error to be 0.4, 1.1, and 0.8 Sv for F(178C),
F(198C), and DF(188C), respectively. The mapping
showed that this error has a similar distribution to the
mean field and therefore acts to either reinforce or
weaken the pattern.
REFERENCES
Brambilla, E., L. D. Talley, and P. E. Robbins, 2008: Subpolar
mode water in the northeastern Atlantic: 2. Origin and
transformation. J. Geophys. Res., 113, C04026, doi:10.1029/
2006JC004063.
Brunke, M. A., C. W. Fairall, X. Zeng, L. Eymard, and J. A. Curry,
2003: Which bulk aerodynamic algorithms are least problem-
atic in computing ocean surface turbulent fluxes? J. Climate, 16,
619–635.
Dong, S., J. Sprintall, and S. T. Gille, 2006: Location of the Ant-
arctic polar front from AMSR-E satellite sea surface tem-
perature measurements. J. Phys. Oceanogr., 36, 2075–2089.
Fairall, C., E. Bradley, J. Hare, A. Grachev, and J. Edson, 2003:
Bulk parameterization of air–sea fluxes: Updates and verifi-
cation for the COARE algorithm. J. Climate, 16, 571–591.
TABLE B1. 2005 Mean formation rates DF(188C) from the OCCA dataset for various temperature class bin and horizontal Grid
resolutions. Top values are shown in boldface. Values in parentheses are domain integrals over positive and negative areas only.
Grid resolution
Temperature class bin: Du (8C)
1 1/2 1/4 1/8
18 5.76 6.38 6.47 7.48
(12.8, 27.07) (14.2, 27.85) (15.2, 28.77) (17, 29.53)
½8 5.1 5.73 5.62 5.94
(12.1, 26.96) (13.5, 27.79) (14.3, 28.71) (15.6, 29.68)
¼8 5.27 5.65 5.8 5.81
(12.1, 26.83) (13.4, 27.74) (14.4, 28.57) (15.7, 29.91)1/88 5.25 5.69 5.87 5.88
(12.1, 26.86) (13.4, 27.7) (14.4, 28.51) (15.7, 29.8)
1834 J O U R N A L O F P H Y S I C A L O C E A N O G R A P H Y VOLUME 39

Forget, G., 2009: Mapping ocean observations in a dynamical
framework: A 2004–06 ocean atlas. J. Phys. Oceanogr., in press.
Garrett, C., K. G. Speer, and E. Tragou, 1995: The relationship
between water mass formation and the surface buoyancy flux
with application to Phillip’s Red Sea model. J. Phys. Oceanogr.,
25, 1696–1705.
Hosoda, K., and H. Kawamura, 2004: Global space-time statistics
of sea surface temperature estimated from AMSR-E data.
Geophys. Res. Lett., 31, L17202, doi:10.1029/2004GL020317.
Kwon, Y.-O., and S. C. Riser, 2004: North Atlantic subtropical mode
water: A history of ocean–atmosphere interaction 1961–2000.
Geophys. Res. Lett., 31, L19307, doi:10.1029/2004GL021116.
Large, W. G., and S. Pond, 1981: Open ocean momentum flux
measurements in moderate to strong winds. J. Phys. Oceanogr.,
11, 324–336.
Marsh, R., S. Josey, A. Nurser, B. de Cuevas, and A. Coward, 2005:
Water mass transformation in the North Atlantic over 1985–2002
simulated in an eddy-permitting model. Ocean Sci., 1, 127–144.
Marshall, J., A. Adcroft, C. Hill, L. Perelman, and C. Heisey,
1997a: A finite-volume, incompressible Navier Stokes model
for studies of the ocean on parallel computers. J. Geophys.
Res., 102, 5753–5766.
——, C. Hill, L. Perelman, and A. Adcroft, 1997b: Hydrostatic, quasi-
hydrostatic, and nonhydrostatic ocean modeling. J. Geophys.
Res., 102, 5733–5752.
——, D. Jamous, and J. Nilsson, 1999: Reconciling thermodynamic
and dynamic methods of computation of water-mass trans-
formation rates. Deep-Sea Res., 46, 545–572.
Nurser, A. J. G., R. Marsh, and R. G. Williams, 1999: Diagnosing
water mass formation from air–sea fluxes and surface mixing.
J. Phys. Oceanogr., 29, 1468–1487.
Old, C., and K. Haines, 2006: North Atlantic subtropical mode
waters and ocean memory in HadCM3. J. Climate, 19, 1126–
1148.
Peng, G., E. Chassignet, Y. Kwon, and S. Riser, 2006: Investigation
of variability of the North Atlantic subtropical mode water
using profiling float data and numerical model output. Ocean
Modell., 13, 65–85.
Radko, T., and J. Marshall, 2004: Eddy-induced diapycnal fluxes
and their role in the maintenance of the thermocline. J. Phys.
Oceanogr., 34, 372–383.
Reynolds, R., and T. Smith, 1994: Improved global sea surface
temperature analyses using optimum interpolation. J. Climate,
7, 929–948.
Romanou, A., W. B. Rossow, and S.-H. Chou, 2006: Decorrelation
scales of high-resolution turbulent fluxes at the ocean surface
and a method to fill in gaps in satellite data products. J. Climate,
19, 3378–3393.
Speer, K. G., and E. Tziperman, 1992: Rates of water mass formation
in the North Atlantic Ocean. J. Phys. Oceanogr., 22, 93–104.
——, H. Isemer, and A. Biastoch, 1995: Water mass formation
from revised COADS data. J. Phys. Oceanogr., 25, 2444–2457.
Taylor, K., 2001: Summarizing multiple aspects of model perfor-
mance in a single diagram. J. Geophys. Res., 106, 7183–7192.
Valdivieso Da Costa, M., H. Mercier, and A. M. Treguier, 2005:
Effects of the mixed layer time variability on kinematic sub-
duction rate diagnostics. J. Phys. Oceanogr., 35, 427–443.
Walin, G., 1982: On the relation between sea-surface heat flow and
thermal circulation in the ocean. Tellus, 34, 187–195.
Weaver, A., and P. Courtier, 2001: Correlation modelling on the
sphere using a generalized diffusion equation. Quart. J. Roy.
Meteor. Soc., 127, 1815–1846.
AUGUST 2009 M A Z E E T A L . 1835