using the interrai data visualisation tool€¦ · this visualisation runs on microsoft power bi,...
TRANSCRIPT

Using the interRAI Data Visualisation Tool Updated October 2019
Contents
Contents .................................................................................................................................................. 1
Introduction ............................................................................................................................................. 2
Page 1: Home Page .................................................................................................................................. 2
Page 2: Summary ..................................................................................................................................... 3
Page 3: Demographics ............................................................................................................................. 5
Page 4: Disease Diagnosis ....................................................................................................................... 7
Page 5: Outcome Scales ........................................................................................................................ 12
Page 6: Clinical Assessment Protocols .................................................................................................. 13
Page 7: Social Wellbeing Measures ....................................................................................................... 13
Page 8: National Quality Indicators - LTCF ............................................................................................ 13
Appendix................................................................................................................................................ 14

Using the interRAI Data Visualisation Tool 2 of 23
Introduction
Welcome to the interRAI data visualisation tool user guide. This guide aims to provide all the information you require to use this interactive tool. The tool is available from https://www.interrai.co.nz/data-and-reporting/
The interRAI data visualisation tool makes New Zealand interRAI data more accessible to everyone, and it is fit-for-purpose to our stakeholders’ needs. The aggregated data presented in this visualisation tool relates to three interRAI assessment types: Contact (CA), Home Care (HC) and Long-Term Care Facilities (LTCF). The data refers to assessments rather than clients/residents unless specified.
This visualisation runs on Microsoft Power BI, which is designed to allow users to transform and visualise interRAI data freely.
Follow this guide to navigate through the interRAI data visualisation tool page by page. Note that the section named Page 4: Disease Diagnosis has detailed information on the built-in tool functionality that applies across all pages.
Page 1: Home Page
This page provides a brief introduction to the interRAI data visualisation tool and interRAI Services in New Zealand. Please note that it may take up to 30-60 seconds to load.
Use the ‘<’ and ‘>’ buttons or click on the text ‘1 of 8’ for a selection list to navigate between pages.
July 2019 update: As a result of sector feedback, definitions for diseases, outcome scales and CAPs have been incorporated into the tool. Definitions will display when a user hovers their mouse above the column charts. See section Page 4: Disease Diagnosis for further detail.
October 2019 update: National quality indicators for LTCF have been added to the tool.

Using the interRAI Data Visualisation Tool 3 of 23
Page 2: Summary
Page 2 presents key statistics from interRAI New Zealand data for the time period specified in the title.
Use the drop down list on the top left to select District Health Board (DHB) Region and/or DHB of interest. The regions and DHBs in the drop down list are in geographic order.
This page is updated annually in July.
To see all data points for a given chart, right click on the chart to bring up a ‘Show data’ option.
Select this and a new window will appear with the chart accompanied by data in a table format.

Using the interRAI Data Visualisation Tool 4 of 23
The view can be changed from horizontal to vertical layout by clicking the icon in the top right corner.

Using the interRAI Data Visualisation Tool 5 of 23
Page 3: Demographics
Page 3 includes key statistics describing the demographic information collected from interRAI assessments.
Use the drop down list on the top left to select Year and/or DHB of interest.
You can also select different types of assessment, ethnicity group, age band and gender by clicking the corresponding area on the doughnut chart. A doughnut chart is similar to a pie chart in that it shows the relationship of parts to a whole. To unselect, re-click the selected part of the chart.
The screenshot below is an example where the assessment type has been selected as ‘LTCF’. The highlighted area represents the proportion of LTCF assessments out of all assessments.

Using the interRAI Data Visualisation Tool 6 of 23
There are four genders recorded in the interRAI assessment. To preserve privacy, “Unknown” and “Indeterminate” are mapped to Female in this visualisation tool.
Ethnicity is shown according to Stats NZ level 1 definition. The six groups are:
• European
• Māori
• Pacific Peoples
• Asian
• Middle Eastern / Latin American / African
• Other Ethnicity
Other Ethnicity includes residual groups.
This page is updated annually in July.

Using the interRAI Data Visualisation Tool 7 of 23
Page 4: Disease Diagnosis
Page 4 describes the disease diagnosis information collected from interRAI assessments. Much of the functionality also applies to other pages including Page 5: Outcome Scales, Page 6: Clinical Assessment Protocols and Page 7: Social Wellbeing Measures.
Use the filter panel on the left-hand side to choose the level of detail you would like to see. The column chart will update accordingly. For example, if you would like to find out the proportion of LTCF assessments for people aged 85 and over, who reported Alzheimer’s disease, living in the area of Hawke’s Bay DHB, in 2016-17, set the filter selection as shown.
You should get a chart like this.

Using the interRAI Data Visualisation Tool 8 of 23
If you hover your mouse cursor to the chart area, you should be able to read the exact figure from a pop-up window. The pop-up window will also include the selected disease definition.
In this example, in 2016-17, 7.75% of LTCF assessments were completed for people aged 85 and over, within Hawke’s Bay DHB, reporting Alzheimer’s disease as their primary diagnosis. We can see that Alzheimer’s disease is defined as ‘A degenerative and progressive dementia that is diagnosed by ruling out other dementias and physiological reasons for the dementia’.
Remember you can also right click and select ‘Show data’ to view the information in table format.
Other functionality within the tool includes:
• Clear selections
• Focus mode
• Show next level
• Drill up
• Expand
• Drill down
‘Clear selections’ will allow you to clear each filter. Hover your mouse cursor above the downward arrow for a given filter box and the eraser symbol will appear above this. Select the symbol and the filter box will reset to ‘All’. In our example we will reset both age band and DHB to ‘All’.
‘Focus mode’ allows users to pop out a visual to see more detail without the distraction of the filters.

Using the interRAI Data Visualisation Tool 9 of 23
‘Show next level’, ‘Drill up’ and ‘Expand’ let you further explore and compare the data. Hover your
mouse cursor over the chart area. You will see these three icons on the top left.
The middle icon (Show next level) allows you to navigate to the next level of data. The level of data follows the order of the filter headers on the left-hand side.
In our example (now with filters set to Alzheimer’s disease, LTCF, 2016/17), the default view of this page is comparison by age band.
Click on the once, and the chart will display a comparison by gender.

Using the interRAI Data Visualisation Tool 10 of 23
Click again and the next view will be by ethnicity, next DHB region, next DHB, next year, and lastly quarter.
Clicking the ‘Drill up’ icon at any point will take you back to the previous level. For example if selected when the page view is by ethnicity, the view will change to age bands.
Rather than selecting a single data element for comparison, you can also expand on the number of
data elements by selecting the ’Expand all down one level of hierarchy’ icon .
Use the ‘Drill up’ icon to get back to the top level of the data filter (in this case, by age bands).
Now click once on and the chart will display a comparison by age band and gender.
Click again and the chart will expand to a view by age band, gender and ethnicity. You can continue expanding to include all variables.
The ‘Show next level’, ‘Drill up’ and ‘Expand’ functionality can also be accessed by right clicking. ‘Show data’ will also display as an option. ‘Show data’ is particularly useful for expanded views that contain many data points.

Using the interRAI Data Visualisation Tool 11 of 23
The ‘Drill down’ icon is located at the top right of the chart. When this functionality is turned on
users can drill down by clicking on the chart bars. When ‘Drill down’ is turned off (the default) clicking on the chart bars will dull the other sections of the chart as per the below example.
The data on this page is updated quarterly in January, April, July and October.
Using the interRAI Data Visualisation Tool 12 of 23
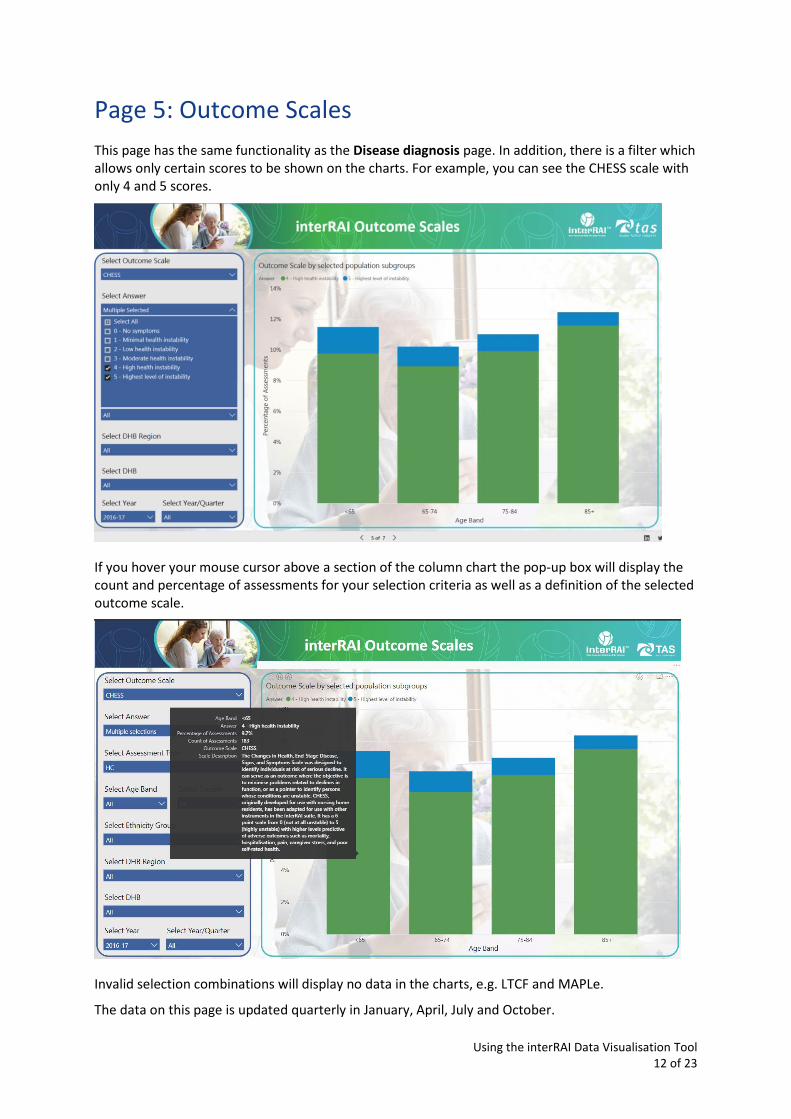
Page 5: Outcome Scales
This page has the same functionality as the Disease diagnosis page. In addition, there is a filter which allows only certain scores to be shown on the charts. For example, you can see the CHESS scale with only 4 and 5 scores.
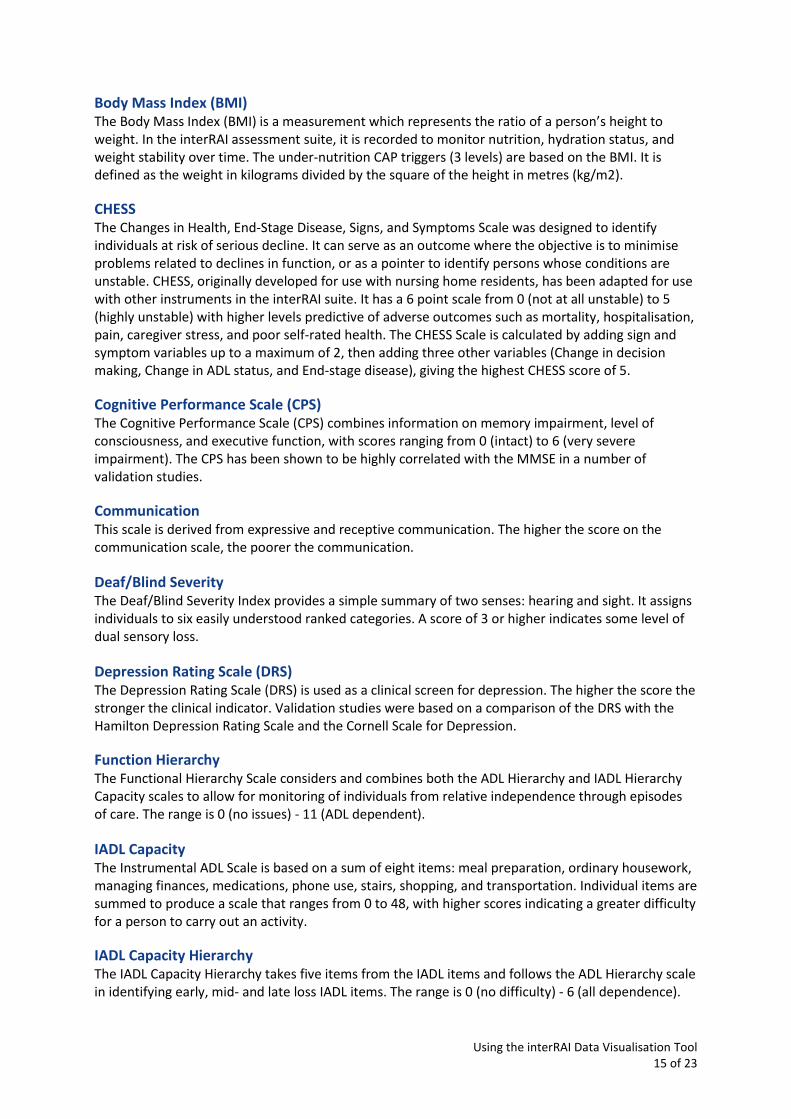
If you hover your mouse cursor above a section of the column chart the pop-up box will display the count and percentage of assessments for your selection criteria as well as a definition of the selected outcome scale.
Invalid selection combinations will display no data in the charts, e.g. LTCF and MAPLe.
The data on this page is updated quarterly in January, April, July and October.

Using the interRAI Data Visualisation Tool 13 of 23
Page 6: Clinical Assessment Protocols
This page has the same functionality as the Disease diagnosis page.
Invalid selection combinations will display no data in the chart, e.g. LTCF and Institutional Risk CAP.
The data on this page is updated quarterly in January, April, July and October.
Page 7: Social Wellbeing Measures
This page has the same functionality as the Disease diagnosis page.
For the measures Advance Care Plan (ACP) and Enduring Power of Attorney (EPOA), there was a change in the question in the November 2015 software upgrade. The data for these two questions start from 01/01/2016 (2015/16 Q3).
The data on this page is updated quarterly in January, April, July and October.
Page 8: National Quality Indicators - LTCF
This page has similar functionality to the Disease diagnosis page. However, the demographic and geographic variables are not available to filter by. Instead national data is presented by level of care.
Descriptions of each quality indicator, the type of indicator (incidence or prevalence) and desired direction (lower or higher) have been incorporated into the tool and can be viewed when hovering over the chart column.
Further information on quality indicators including an education package to help interpret results and definitions explaining each quality indicator are available from the interRAI website.
The data on this page is updated quarterly in January, April, July and October.

Using the interRAI Data Visualisation Tool 14 of 23
Appendix
Outcome Scale Definitions The interRAI software processes the assessment information and creates objective measures called Outcomes and CAPs.
Outcomes show a picture of the person’s needs, their clinical and functional status.
Each assessed person has a score on each outcome scale. Usually a higher score indicates higher urgency or need.
Assessment Urgency The purpose of this scale is to determine whether or not the person needs further in-depth assessment. This score is calculated by referring to a number of elements in the assessment that relate to the person’s physical health, person’s mood, the family’s ability to cope and the person’s dependence with personal hygiene. The scale range is 1-6 with 6 being the most complex. Level 0 is included for those assessments where no score is calculated.
Service Urgency This score is calculated by looking at whether the person has specialist nursing needs, is dependent with personal hygiene, has had recent hospital visits and has daily pain. The range is 1-4 with 4 being the most urgent. Level 0 is included for those assessments where no score is calculated.
Rehabilitation This score is calculated by looking at whether the person has specialist nursing needs, is dependent with personal hygiene, has had recent hospital visits and has daily pain. The range is 1-4 with 4 being the most urgent. Level 0 is included for those assessments where no score is calculated.
ADL Hierarchy The ADL Hierarchy Scale groups activities of daily living according to the stage of the disablement process in which they occur. Early loss ADLs (for example, dressing) are assigned lower scores than late loss ADLs (for example, eating).
ADL Long Form Scale from 0 to 28 that provides a summary of the person’s ability to perform ADLs. It is based on 7 ADL items - personal hygiene, toilet use, locomotion, eating, dressing, transferring, and bed mobility. The higher the score the greater the difficulty in performing activities.
ADL Short Form Scale from 0 to 16 that provides a summary of the person’s ability to perform ADLs. It is based on 4 ADL items - personal hygiene, toilet use, locomotion, eating. The higher the score the greater the difficulty in performing activities. Validated by Morris, Fries, and Morris 1999.
Aggressive Behaviour The Aggressive Behaviour Scale (ABS) is a measure of aggressive behaviour based on the occurrence of verbal abuse, physical abuse, socially disruptive behaviour and resistance to care. Scale scores range from 0-12 with higher scores indicative of greater frequency and diversity of aggressive behaviour. A score of 1 to 4 on the ABS indicates mild to moderate aggressive behaviour, whereas scores of 5 or more represents the presence of more severe aggression. This scale has been validated against the Cohen Mansfield Agitation Inventory.
Using the interRAI Data Visualisation Tool 15 of 23
Body Mass Index (BMI) The Body Mass Index (BMI) is a measurement which represents the ratio of a person’s height to weight. In the interRAI assessment suite, it is recorded to monitor nutrition, hydration status, and weight stability over time. The under-nutrition CAP triggers (3 levels) are based on the BMI. It is defined as the weight in kilograms divided by the square of the height in metres (kg/m2).
CHESS The Changes in Health, End-Stage Disease, Signs, and Symptoms Scale was designed to identify individuals at risk of serious decline. It can serve as an outcome where the objective is to minimise problems related to declines in function, or as a pointer to identify persons whose conditions are unstable. CHESS, originally developed for use with nursing home residents, has been adapted for use with other instruments in the interRAI suite. It has a 6 point scale from 0 (not at all unstable) to 5 (highly unstable) with higher levels predictive of adverse outcomes such as mortality, hospitalisation, pain, caregiver stress, and poor self-rated health. The CHESS Scale is calculated by adding sign and symptom variables up to a maximum of 2, then adding three other variables (Change in decision making, Change in ADL status, and End-stage disease), giving the highest CHESS score of 5.
Cognitive Performance Scale (CPS) The Cognitive Performance Scale (CPS) combines information on memory impairment, level of consciousness, and executive function, with scores ranging from 0 (intact) to 6 (very severe impairment). The CPS has been shown to be highly correlated with the MMSE in a number of validation studies.
Communication This scale is derived from expressive and receptive communication. The higher the score on the communication scale, the poorer the communication.
Deaf/Blind Severity The Deaf/Blind Severity Index provides a simple summary of two senses: hearing and sight. It assigns individuals to six easily understood ranked categories. A score of 3 or higher indicates some level of dual sensory loss.
Depression Rating Scale (DRS) The Depression Rating Scale (DRS) is used as a clinical screen for depression. The higher the score the stronger the clinical indicator. Validation studies were based on a comparison of the DRS with the Hamilton Depression Rating Scale and the Cornell Scale for Depression.
Function Hierarchy The Functional Hierarchy Scale considers and combines both the ADL Hierarchy and IADL Hierarchy Capacity scales to allow for monitoring of individuals from relative independence through episodes of care. The range is 0 (no issues) - 11 (ADL dependent).
IADL Capacity The Instrumental ADL Scale is based on a sum of eight items: meal preparation, ordinary housework, managing finances, medications, phone use, stairs, shopping, and transportation. Individual items are summed to produce a scale that ranges from 0 to 48, with higher scores indicating a greater difficulty for a person to carry out an activity.
IADL Capacity Hierarchy The IADL Capacity Hierarchy takes five items from the IADL items and follows the ADL Hierarchy scale in identifying early, mid- and late loss IADL items. The range is 0 (no difficulty) - 6 (all dependence).

Using the interRAI Data Visualisation Tool 16 of 23
IADL Performance The Instrumental ADL Scale is based on a sum of eight items: meal preparation, ordinary housework, managing finances, medications, phone use, stairs, shopping, and transportation. Individual items are summed to produce a scale that ranges from 0 to 48, with higher scores indicating greater dependence on others for instrumental activities for daily living.
MAPLe MAPLe differentiates people into five priority levels, based on their risk of adverse outcomes. People in the lowest priority level have no major functional, cognitive, behavioural, or environmental problems and are considered self-reliant. The highest priority level is based on the presence of ADL impairment, cognitive impairment, wandering, behaviour problems, and the interRAI nursing home risk CAP. Research has demonstrated that the five priority levels are predictive of risk: Individuals in the highest priority level are nearly nine times more likely to be admitted to a long-term care facility than are the lowest priority persons. MAPLe also predicts caregiver stress.
Pain Scale that attempts to define levels of pain. The scale is highly predictive of pain on the Visual Analogue Scale (Fries et al 2001). Pain that is adequately managed does not feature in the scale.
Pressure Ulcer Risk Scores from 0 (lowest risk) to 8 (highest risk) for development of pressure ulcers. This scale complements the Pressure Area CAP and should always be reviewed when that CAP is triggered.

Using the interRAI Data Visualisation Tool 17 of 23
Range of Values The following table defines the range of valid values for each scale and identifies which assessment type each scale is applicable to:
Applicable to:
Outcome Scale Range of Values CA HC LTCF
Assessment - Urgency 0,1-6 Y
Service Urgency 0,1-4 Y
Rehab 0,1-5 Y
ADL Hierarchy 0-6 Y Y
ADL Long Form 0-28 Y Y
ADL Short Form 0-16 Y Y
Aggressive Behaviour 0-12 Y Y
CHESS 0-5 Y Y
Cognitive Performance Scale (CPS) 0-6 Y Y
Communication 0-8 Y Y
Deaf/Blind Severity 0-5 Y
Depression Rating Scale (DRS) 0-14 Y Y
Function Hierarchy 0-11 Y
IADL Capacity 0-48 Y
IADL Capacity Hierarchy 0-6 Y
IADL Performance 0-48 Y
MAPLe 1-5 Y
Pain 0-4 Y Y
Pressure Ulcer Risk 0-8 Y Y

Using the interRAI Data Visualisation Tool 18 of 23
Clinical Assessment Protocol (CAP) Definitions
CAP is short for Clinical Assessment Protocol and when they are triggered, they indicate an opportunity for improvement, to slow the rate of decline or help symptoms. Most CAPs trigger at two or three levels. A higher CAP level usually indicates a larger problem, or increased risk of decline.
Abusive Relationship To identify potential abuse/neglect situations — fearful of a family member, caregiver, close acquaintance, unusually poor hygiene, unkempt appearance, neglected, abused, or mistreated.
Activities
This CAP identifies persons with some cognitive reserve who have either withdrawn from activities or who are uneasy entering into activities and social relationships.
Activities of Daily Living
To improve ADL performance or prevent avoidable functional decline — receive some ADL help; potential to improve self-performance.
Appropriate Medications
To identify and promote appropriate medication management — 9+ medications and 2 of the following: chest pain, dizziness, oedema, shortness of breath, poor health, or recent deterioration.
Behaviour
To prevent, manage behavioural problems — wandering, verbally abusing others, physically abusing others, socially inappropriate, disruptive behaviour, inappropriate disrobing, public sexual behaviour or resisting care.
Bowel Conditions
To facilitate improvement and prevent a decline in bowel function — risk of decline and improvement and bowel continence.
Cardiorespiratory Conditions
To assess and manage cardiorespiratory conditions — symptoms of chest pain, shortness of breath, irregular pulse, dizziness and test results such as BP, respiratory rate, heart rate, and oxygen saturation.
Cognitive Loss
The definition of this CAP changed in the version 9.3 assessment upgrade that occurred in November 2015. This CAP now has only two trigger levels: 0 (not triggered) and 2 (prevent cognitive decline).
Communication
To improve communication ability and to prevent avoidable communication decline — moderate–severe communication issues in understanding/expression.

Using the interRAI Data Visualisation Tool 19 of 23
Dehydration
To identify and treat underlying causes of dehydration — insufficient fluid intake; and diarrhoea, vomiting, delirium, fever, dizziness, syncope, constipation, weight loss.
Delirium
To identify persons with active symptoms of delirium — acute change in mental status and behaviour appears different from usual functioning.
Falls
To identify and change any underlying risk factors for falls — report of a single fall or multiple falls.
Feeding Tube
To identify persons with a feeding tube and manage — has a feeding tube and some residual cognitive abilities/absence of cognitive abilities.
Home Environment Optimisation
To improve the safety of an environment — problems with lighting, flooring, bathroom, toilet, kitchen, heating, disrepair, squalor, and indicators of frailty.
Informal Support
To identify where a person needs help — not independent with meals/housework/shopping/transport and alone for long periods or lives alone and no primary informal helper present.
Institutional Risk
To avoid premature admission to LTCF — identify the person with impaired functioning who is at high-risk of institutional placement.
Instrumental Activities of Daily Living
To improve IADL self-performance and capacity — identify person who have the capability and interest to carry out instrumental activities of daily living more independently.
Mood
To identify, treat and monitor mood issues — negative statements, persistent anger, expressions of unrealistic fears, repetitive health complaints, repetitive anxious complaints, sad, crying or tearfulness. Depression Rating Scale (DRS) score medium to high.
Pain
To identify and treat underlying reasons for pain — high-risk trigger for people with severe, horrible or excruciating pain or medium-risk trigger for people with daily mild/moderate pain.
Physical Activities Promotion
To increase levels of exercise and physical activity — identify person does less than two hours physical activity over a three- day period; moves and goes up/down stairs without help; increased independence possible.

Using the interRAI Data Visualisation Tool 20 of 23
Physical Restraints
This CAP identifies persons who are physically restrained.
Pressure Ulcer
To prevent, identify and treat pressure ulcers — has or is at risk of developing a pressure ulcer.
Prevention
To prevent illness and disability — blood pressure, colonoscopy, dental exam, hearing exam, fluvax, mammogram, or Pneumovax.
Social Relationship
To identify factors associated with reduced social relationships and facilitate engagement, such as mental health problems and poor health.
Tobacco and Alcohol Use
To identify strategies to help people cease smoking and cut back on excessive drinking.
Under-nutrition
To address and manage under-nutrition based on a person’s BMI score.
Urinary Incontinence
To facilitate improvement and prevent decline in bladder function — reoccurring episodes of incontinence, minimal cognitive abilities, locomotion impaired; possibility of improvement.

Using the interRAI Data Visualisation Tool 21 of 23
Range of Values The following table defines the range of valid values for each CAP, and identifies which of the assessment types each CAP is applicable to:
Applicable to:
CAP Range of Values CA HC LTCF
Functional Performance CAPS
1. Physical Activities Promotion 0-1 Y Y
2. Instrumental Activities of Daily Living 0-1 Y
3. Activities of Daily Living 0-2 Y Y
4. Home Environment Optimisation 0-1 Y
5. Institutional Risk 0-1 Y
6. Physical Restraints 0-2 Y
Cognition/Mental Health CAPS
7. Cognitive Loss 0,2 Y Y
8. Delirium 0-1 Y Y
9. Communication 0-2 Y Y
10. Mood 0-2 Y Y
11. Behaviour 0-2 Y Y
12. Abusive Relationship 0-2 Y
Social Life CAPs
13. Activities 0-1 Y
14. Informal Support 0-1 Y
15. Social Relationship 0-1 Y Y
Clinical Issues CAPs
16. Falls 0-2 Y Y
17. Pain 0-2 Y Y
18. Pressure Ulcer 0-3 Y Y
19. Cardiorespiratory Conditions 0-1 Y Y
20. Under-nutrition 0-2 Y Y
21. Dehydration 0-2 Y Y
22. Feeding Tube 0-2 Y Y
23. Prevention 0-2 Y Y
24. Appropriate Medications 0-1 Y Y
25. Tobacco and Alcohol Use 0-1 Y Y
26. Urinary Incontinence 0-3 Y Y
27. Bowel Conditions 0-2 Y Y
Using the interRAI Data Visualisation Tool 22 of 23
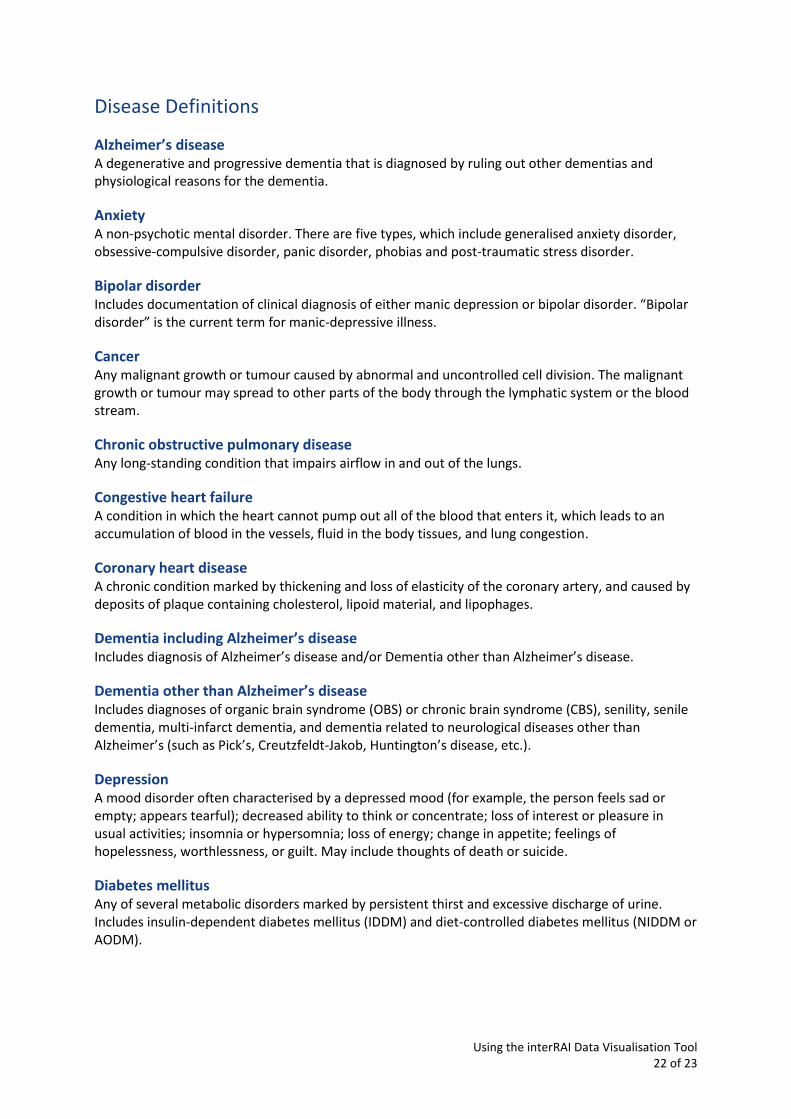
Disease Definitions
Alzheimer’s disease A degenerative and progressive dementia that is diagnosed by ruling out other dementias and physiological reasons for the dementia.
Anxiety A non-psychotic mental disorder. There are five types, which include generalised anxiety disorder, obsessive-compulsive disorder, panic disorder, phobias and post-traumatic stress disorder.
Bipolar disorder Includes documentation of clinical diagnosis of either manic depression or bipolar disorder. “Bipolar disorder” is the current term for manic-depressive illness.
Cancer Any malignant growth or tumour caused by abnormal and uncontrolled cell division. The malignant growth or tumour may spread to other parts of the body through the lymphatic system or the blood stream.
Chronic obstructive pulmonary disease Any long-standing condition that impairs airflow in and out of the lungs.
Congestive heart failure A condition in which the heart cannot pump out all of the blood that enters it, which leads to an accumulation of blood in the vessels, fluid in the body tissues, and lung congestion.
Coronary heart disease A chronic condition marked by thickening and loss of elasticity of the coronary artery, and caused by deposits of plaque containing cholesterol, lipoid material, and lipophages.
Dementia including Alzheimer’s disease Includes diagnosis of Alzheimer’s disease and/or Dementia other than Alzheimer’s disease.
Dementia other than Alzheimer’s disease Includes diagnoses of organic brain syndrome (OBS) or chronic brain syndrome (CBS), senility, senile dementia, multi-infarct dementia, and dementia related to neurological diseases other than Alzheimer’s (such as Pick’s, Creutzfeldt-Jakob, Huntington’s disease, etc.).
Depression A mood disorder often characterised by a depressed mood (for example, the person feels sad or empty; appears tearful); decreased ability to think or concentrate; loss of interest or pleasure in usual activities; insomnia or hypersomnia; loss of energy; change in appetite; feelings of hopelessness, worthlessness, or guilt. May include thoughts of death or suicide.
Diabetes mellitus Any of several metabolic disorders marked by persistent thirst and excessive discharge of urine. Includes insulin-dependent diabetes mellitus (IDDM) and diet-controlled diabetes mellitus (NIDDM or AODM).
Using the interRAI Data Visualisation Tool 23 of 23
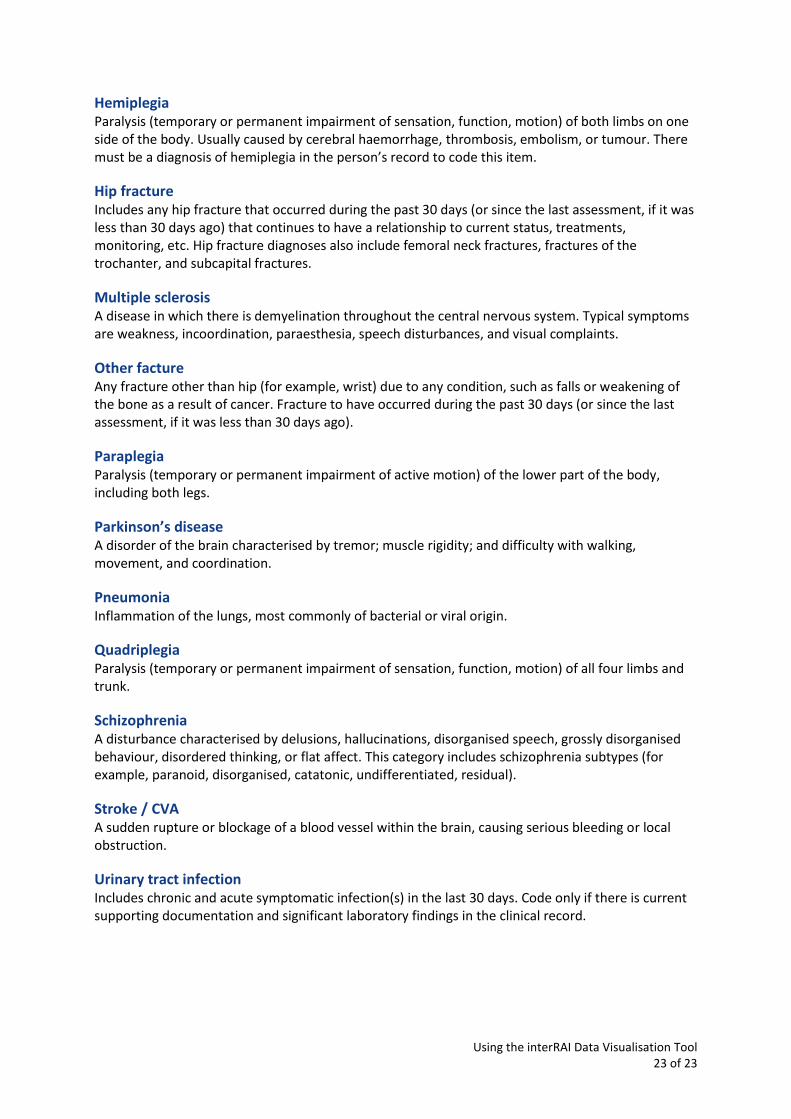
Hemiplegia Paralysis (temporary or permanent impairment of sensation, function, motion) of both limbs on one side of the body. Usually caused by cerebral haemorrhage, thrombosis, embolism, or tumour. There must be a diagnosis of hemiplegia in the person’s record to code this item.
Hip fracture Includes any hip fracture that occurred during the past 30 days (or since the last assessment, if it was less than 30 days ago) that continues to have a relationship to current status, treatments, monitoring, etc. Hip fracture diagnoses also include femoral neck fractures, fractures of the trochanter, and subcapital fractures.
Multiple sclerosis A disease in which there is demyelination throughout the central nervous system. Typical symptoms are weakness, incoordination, paraesthesia, speech disturbances, and visual complaints.
Other facture Any fracture other than hip (for example, wrist) due to any condition, such as falls or weakening of the bone as a result of cancer. Fracture to have occurred during the past 30 days (or since the last assessment, if it was less than 30 days ago).
Paraplegia Paralysis (temporary or permanent impairment of active motion) of the lower part of the body, including both legs.
Parkinson’s disease A disorder of the brain characterised by tremor; muscle rigidity; and difficulty with walking, movement, and coordination.
Pneumonia Inflammation of the lungs, most commonly of bacterial or viral origin.
Quadriplegia Paralysis (temporary or permanent impairment of sensation, function, motion) of all four limbs and trunk.
Schizophrenia A disturbance characterised by delusions, hallucinations, disorganised speech, grossly disorganised behaviour, disordered thinking, or flat affect. This category includes schizophrenia subtypes (for example, paranoid, disorganised, catatonic, undifferentiated, residual).
Stroke / CVA A sudden rupture or blockage of a blood vessel within the brain, causing serious bleeding or local obstruction.
Urinary tract infection Includes chronic and acute symptomatic infection(s) in the last 30 days. Code only if there is current supporting documentation and significant laboratory findings in the clinical record.